
Chapter 2. Promoting circular economy
The United Kingdom has improved its material productivity. It has progressed with recovery and recycling, and the use of economic instruments to divert waste from landfilling. However, contaminated sites and illegal waste dumping remain important concerns. The United Kingdom and devolved governments have set long-term ambitions to improve resource efficiency and move towards a circular economy. Government and private actions provide a strong basis for progress. However, further co-ordination and efforts will be needed to achieve long-term waste management and circular economy goals. This chapter gives an overview of trends in material use and waste generation and of related policies. It reviews policy objectives and institutional settings and then considers the effectiveness of the policy instruments used to encourage waste prevention, reuse and recycling, as well as to manage the transition towards the circular economy.
While the Department for Environment, Food and Rural Affairs (Defra) leads in England, the UK’s devolved governments are responsible for nearly all waste management and circular economy policies as part of their overall environmental competence. Local governments play an important role, managing the collection of municipal waste and ensuring its proper treatment. Local governments also tackle low-level illegal waste dumping (fly-tipping). The national regulators in each devolved government are responsible for tackling more serious instances of illegal dumping and illegal waste operations.
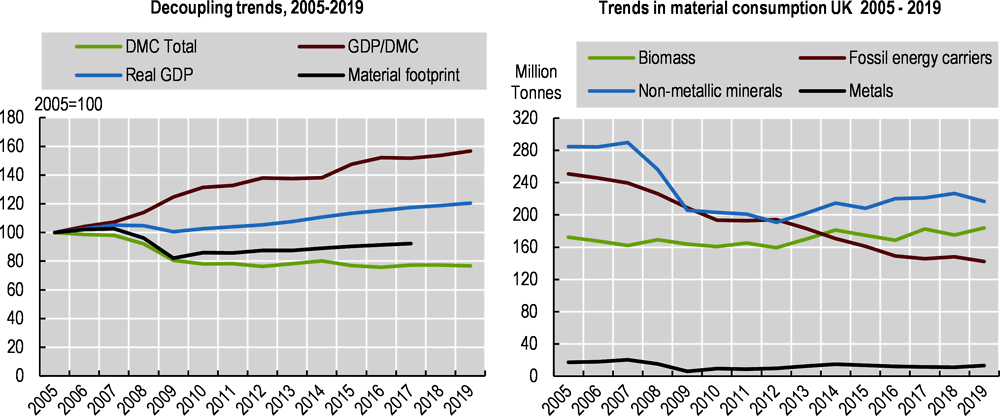
From 2005, the United Kingdom has exhibited absolute decoupling of domestic materials consumption from gross domestic product (GDP) and population growth. Over the past decade, however, the UK’s material footprint1 increased slowly. The United Kingdom reduced its generation of municipal waste, although total waste generation increased due to a rise in construction waste and other waste streams.
The landfilling of municipal waste fell sharply from 2005 to 2018, due in large measure to high landfill taxes. Meanwhile, incineration, recycling and composting have all increased. While the three devolved governments have seen strong improvements in recycling and composting, progress has been slower in England. Further efforts will be needed across the United Kingdom to meet its goals to reduce waste and increase recycling.
Government strategies and plans have supported the transition to a circular economy. Scotland, for example, published a circular economy strategy in 2016, and cities including London have launched circular economy initiatives. Private sector initiatives have reduced waste and improved recycling in sectors such as food and textiles. These initiatives provide a basis for the further work on circular economy needed to achieve the UK’s ambitious resource efficiency objectives.
2.2.1. Trends in material consumption
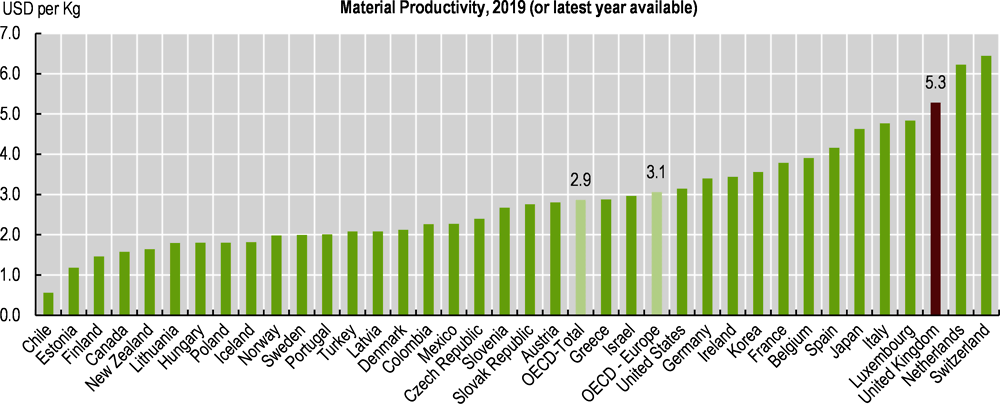
The United Kingdom has a highly service-oriented economy, more so than any other G7 country, and consequently derives a high share of GDP from economic activities that are not resource-intensive. As a result, the United Kingdom has the third highest material productivity among OECD countries, behind only Netherlands and Switzerland (Figure 2.1).
As of 2019, non-metallic minerals constitute the largest share (39%) of domestic material consumption (DMC) (Figure 2.2), almost all of which is used by the construction sector (34% of total DMC). Biomass (33% of total DMC) and fossil fuel carriers (26%) follow. As of 2019, imports constitute half (49%) of the UK’s overall DMC. The ratio varies across materials. For example, almost all fossil fuel carriers (97%) are imported. There is much less dependence on imports for biomass (38%) and non-metallic minerals (11%). However, the United Kingdom imports almost three times the volume of metals used within the economy (38 million tonnes [Mt] imported vs.13 Mt used), and also exports large amounts.
Since 2005, DMC has declined (Figure 2.2). There was a sharp decline from 2007 to 2009, in particular for non-metallic minerals, due to the fall in construction output during the financial crisis. Over 2005-19, there was a steady decline in fossil fuel carriers (-43%) due to the shift in energy supply from coal towards renewable sources. Since 2009, this decline has offset increases in biomass and non-metallic minerals consumption: as a result, DMC remained largely unchanged (Figure 2.2).
Note: GDP at 2015 prices. DMC refers to the amount of materials directly used in the economy, or the apparent consumption of materials. DMC is computed as domestic extraction used minus exports plus imports. Material productivity designates the amount of GDP generated per unit of materials used (GDP/DMC).
Source: OECD (2021), " Material Resources", OECD Environment Statistics (database).
Overall, GDP has grown over 2005-19 and decoupled in absolute terms from DMC. Moreover, DMC has fallen in per capita terms by 23%. Nonetheless, the UK’s materials footprint, which had declined from 2007 to 2009, rose to 2017 (the latest year for which data are available).
While DMC has declined, the share of imports for materials within total domestic consumption increased from 38% to 49% over 2005-19. As domestic extraction has declined, the share of imports increased for all major components of DMC (biomass, fossil fuel carriers, non-metallic minerals and minerals).
2.2.2. Trends in waste generation and management
Total primary waste
The construction sector generates more than half of primary waste (Figure 2.3). The next three sectors in terms of quantity of waste are services, households, and water and waste management, each producing around 10% of the total.

Note: Left panel: others include electricity, gas, steam and air conditioning supply, manufacturing and agriculture, forestry and fishing. Right panel: water supply; sewerage, waste management and remediation activities.
Source: Eurostat (2021), Generation of waste by waste category, hazardousness and NACE Rev. 2 activity.
Total generation of primary waste increased by 13% between 2010 and 2018. Primary waste from all sectors, except for households and mining and quarrying, rose in this period. Waste from the construction sector, which increased by 16%, was the main contributor to the increase in total primary waste due to this sector’s large share of total generation. This sector’s added value, total output and new work increased since 2010, despite short downturns between 2011-12 (ONS, 2021). Within the sector, the main contributors to growth were the construction of private housing and public infrastructure works, which both more than quadrupled in real value between 2009-19. They were followed by public housing, which doubled in the same period.2
The biggest percentage increase in waste generation is observed in waste treatment operations, which more than doubled between 2010 and 2018. This is to be expected given the increase in related operations and the amount of waste collected and recovered in the country. Waste from electricity and gas supply operations has seen a drastic fall (77%), but this sector represents only 0.26% of all waste generation in the country.
Municipal waste
The generation of municipal waste in the United Kingdom is lower than both OECD and OECD Europe averages (Figure 2.4). This is due in part to differences in definition: in the United Kingdom, municipal waste is calculated as the waste collected by local authorities (and by contractors working for them). It thus includes mainly household waste plus small shares of service sector waste, while many other OECD Europe countries include a larger share of service sector waste.

Between 2005 and 2019, the annual amount of municipal waste generated in the United Kingdom fell by 13%. With population increasing during the period, that decline represents a 22% decrease in waste generation per capita. This is partially due to the UK’s definitions of municipal waste, which have varied slightly among the four nations and over time. Moreover, municipal waste data in the United Kingdom exclude waste from businesses that do not use municipal collection services. Consequently, if businesses shift from municipal to private collection, municipal waste levels decrease. Nonetheless, awareness raising for waste reduction, separate collection and greater environmental awareness may have also encouraged household waste reduction. Indeed, over the past ten years, the United Kingdom exhibited an absolute decoupling between municipal waste generation and private consumption.
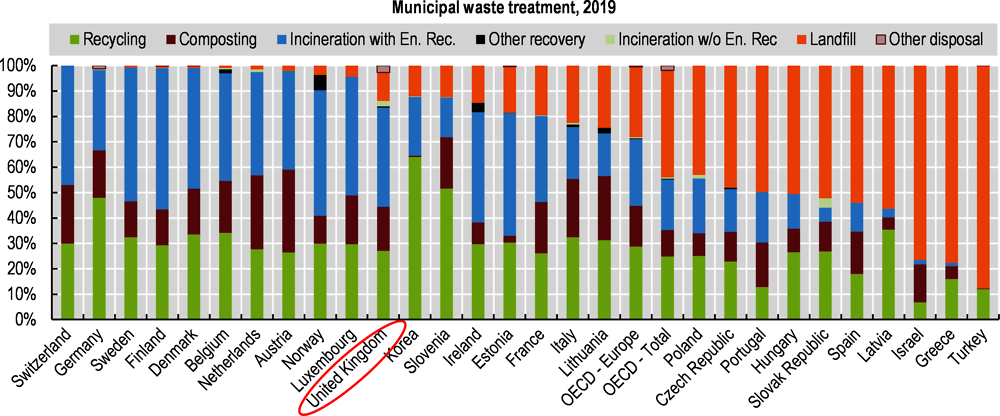
In 2019, 83% of municipal waste generated was recovered, mainly through incineration. The share of incineration with energy recovery in the United Kingdom (39%) was higher than the OECD Europe average (26%) and almost twice as high as the OECD average (20%) (Figure 2.5). For other components of waste recovery, recycling (27%) was slightly below the OECD Europe average while composting (17%) was at a similar rate. Landfilling, 11% of all treatment operations, was lower than OECD Europe and OECD averages. However several OECD Europe countries, such as Netherlands and Norway, have reduced their landfilling to below 5%.
Note: Data for 2019 or latest year available. Other recovery includes refuse-derived fuel, waste used for backfilling, process loss from mechanical biological treatment, incinerator bottom ash sent for recycling and metals from incineration sent for recycling. Other disposal includes waste treated/disposed through other unspecified treatment processes, as well as process and moisture loss.
Source: OECD (2021), "Municipal waste, generation and treatment”, OECD Environment Statistics (database).
Between 2005 and 2019, the UK’s recovery rate of municipal waste more than doubled (from 35% to 83%). This was mainly due to the considerable increase in the share of incineration with energy recovery operations (Figure 2.6). The share of composting operations also rose sharply. On the other hand, the share of recycling operations increased more modestly. These developments resulted in drastic declines in the share of waste going to landfills.

Note: See Figure 2.5 for the definition of other disposal.
Source: OECD (2021), "Municipal waste, generation and treatment”, OECD Environment Statistics (database).
Hazardous waste
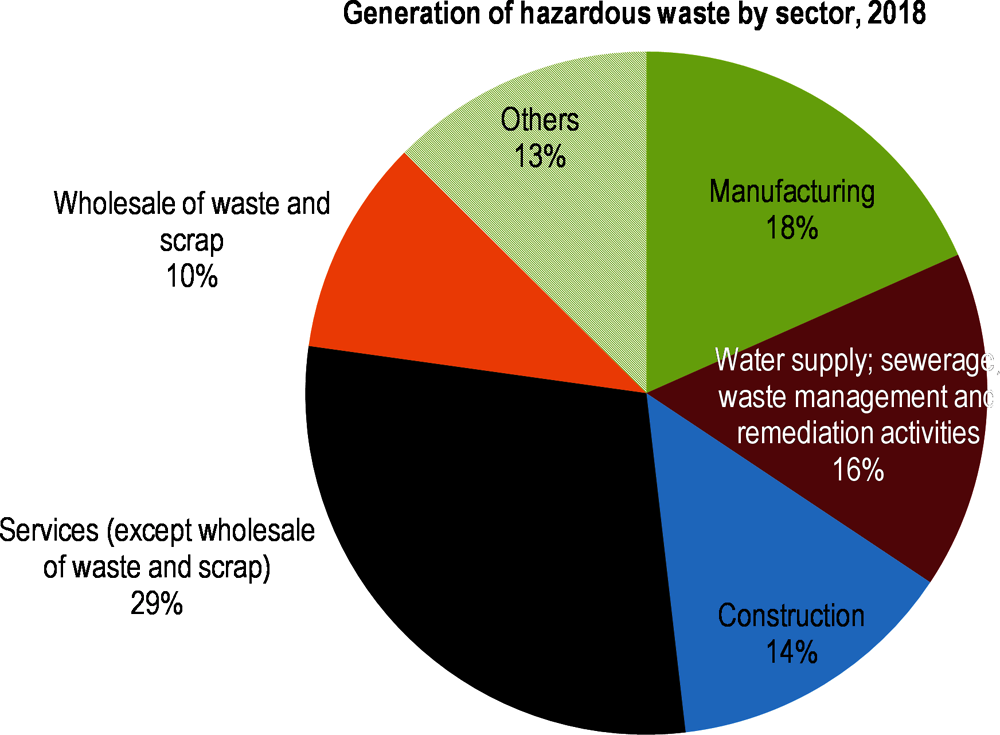
The total amount of hazardous waste generated in 2018 was 6.2 Mt. The services sector produced the largest share, followed by manufacturing, construction and water and waste management (Figure 2.7).
Source: Eurostat (2021), Generation of waste by waste category, hazardousness and NACE Rev. 2 activity.
Since 2010, total hazardous waste increased by 18%, with notable differences in magnitude among the sectors. From 2010 to 2018, generation of hazardous waste in water supply and waste management increased by 62%, while volumes remained largely unchanged for the services sector. Hazardous waste from households fell by 8%.
Waste expenditures
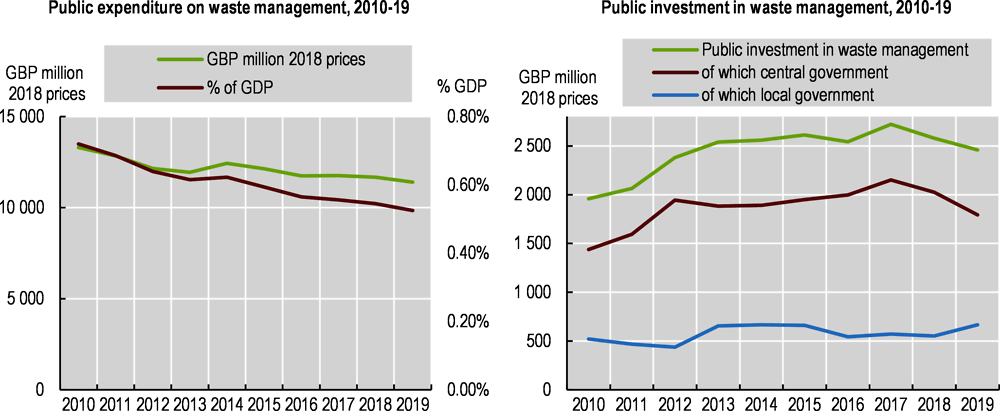
Total public expenditure on waste management declined slowly, both in real terms and as part of GDP, over the past decade (Figure 2.8). Compared to 2010, public investment from both central and local governments in waste management increased but has been fluctuating year to year. Since 2017, local government investment increased, whereas it decreased at the central level.
Source: ONS (2021), Environmental Accounts.
Waste shipments
The UK’s hazardous waste exports and imports fluctuated between 2012 and 2019. Exports increased steadily after 2015, while imports fell from 2017 to 2018 (Figure 2.9). In terms of waste streams, waste oil and mixtures, along with battery waste, constituted the two largest shares of imports between 2015 and 2019, with a combined share of 37% in 2019. Metals containing waste were the largest stream within 2019 exports (17% of total) followed by waste oil and mixtures (14% of total) for 2019; moreover, these two streams were consistently among the main hazardous waste exports throughout 2012-19.

Source: National submission.
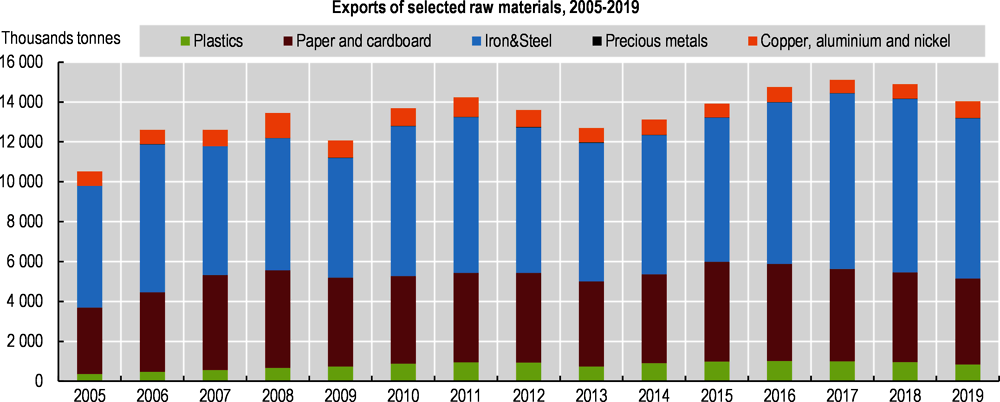
When looking at non-hazardous waste, the United Kingdom exports a large volume of recyclable materials, about 14 Mt in 2019 (Figure 2.10). In contrast, its imports of recyclable material have been about 20 times lower, reaching just over 600 000 t in that year. Export volumes fluctuated between about 12-15 Mt between 2006 and 2019. By weight, iron and steel are the largest share (57% of the total in 2019), followed by paper and cardboard. While plastics are lightweight and thus represent a small share of the total weight, their volume increased from 360 000 t to 843 000 t over 2005-19. The destination countries have shifted for all recyclable materials: exports outside the European Union reached 82% of the total in 2019 from 64% in 2005.
Source: Eurostat (2021), Trade in recyclable raw materials by waste.
In addition to its exports of recyclable waste, the United Kingdom has exported large volumes of household waste for incineration with energy recovery: from 2013 to 2015, it sent about 7 Mt to countries within the European Union for this purpose (EC, 2018). When looking at all UK waste exported in 2018, the Netherlands (31%) and Sweden (22%) were the top destinations, receiving about half of total UK exports by weight (Eurostat, 2021a). Other important destinations have included Germany (11%) and Egypt (10%). Nearly all UK waste exports are sent for recovery operations such as recycling and incineration with energy recovery.
While plastic waste is light and thus represents a small share of total waste by tonne, it has been an important component in the UK’s waste exports. By some estimates, the United Kingdom recently exported about two-thirds of its plastic waste (BBC, 2019). In 2017, the United Kingdom sent 37% of its plastic waste exports to the People’s Republic of China (hereafter “China”) for recycling. With China’s ban on most plastic waste imports, shipments shifted to Southeast Asian countries such as Malaysia and Vietnam. These imports created challenges for management in those countries, which subsequently banned or restricted them. In 2020, about 40% of the UK’s plastic exports were sent to Turkey, 12% to Malaysia, and smaller shares to EU member states, including the Netherlands and Poland. Non-governmental organisations (NGOs) have alleged that significant quantities of UK exports are not properly recycled or treated in destination countries (Greenpeace International, 2021).
From January 2021, several major categories of plastic waste became subject to a prior informed consent procedure under the Basel Convention to non-OECD countries. In 2019, the United Kingdom indicated its intention to ban plastic waste exports to non-OECD countries, and a consultation was planned by the end of 2022. For comparison, the European Union established a ban on plastic waste exports to non-OECD countries from January 2021 (Smith, 2021).
2.3.1. Policy framework and objectives
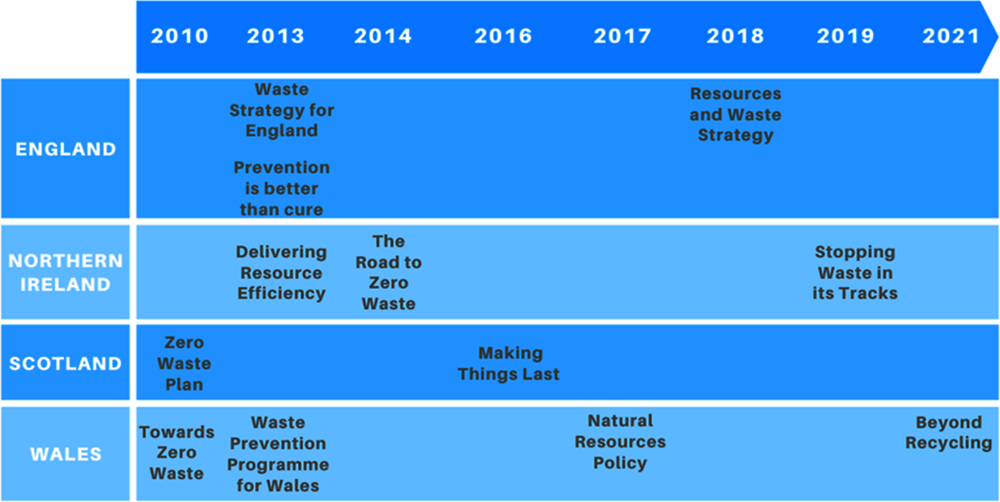
UK-wide waste policies in the 1990s established goals to reduce landfilling and improve resource efficiency, introducing key economic instruments such as a landfill tax and an aggregates levy. By 2000, England, Northern Ireland, Scotland and Wales each had responsibility for its own waste policy and established separate waste management strategies. Since 2010, the four UK nations have put in place a succession of plans and strategies that address waste management and the circular economy (Figure 2.11).
Despite differences among them, the policies, strategies and plans of the four nations over the past decade have focused on broadly similar aims. These include continuing the shift from landfilling to waste prevention, reuse, recycling and energy recovery to implement the waste hierarchy set in the EU’s 2008 Waste Framework Directive. The plans identify a range of targets, including those in EU waste legislation.
Several policy documents set more ambitious targets than those of the European Union. For example, Towards Zero Waste, One Wales: One Planet (2010) sets a long-term target to reduce total waste generation by 1.5% per year and household waste by 1.2% per year to help reach zero waste by 2050. This document sets stringent short-term targets, including for household waste (Table 2.1). Scotland’s Zero Waste Plan, also from 2010, sets a long-term target to recycle 70% of all waste.
Several policy documents set out measures for waste prevention, such as the 2013 Waste Prevention Programme for England, Prevention is better than cure: The role of waste prevention in moving to a more resource efficient economy. This programme includes proposals for tools to help households, schools and businesses reduce waste and calls for a charge on single-use plastic carrier bags. Northern Ireland issued its Waste Prevention Programme in 2014, The Road to Zero Waste. It was updated in 2019 as Stopping Waste in its Tracks with new actions to reduce waste generation and increase resource efficiency.
The four nations met many key targets to increase household waste recycling, composting and reuse and to reduce biodegradable waste going to landfill (Table 2.1). Nonetheless, the United Kingdom as a whole, although close, was not on track to meet the 2020 target for recycling and preparing for reuse regarding household waste. It must also travel some distance to reach the 2025 to 2035 targets for recycling and preparation of municipal waste for reuse.
Recent waste and circular economy policies and plans have set ambitious resource efficiency and circular economy objectives. Moreover, several economic, industrial and climate change policies, as well as recent policies for recovery from the COVID-19 pandemic, have integrated resource and circular economy objectives.
The UK-wide Industrial Strategy and Clean Growth Strategy (both from 2017) identify the circular economy among the building blocks of clean economic growth and call for industrial innovation to achieve these goals. The Clean Growth Strategy pledges to build a “zero avoidable waste” economy by 2050. These goals are taken up in the 25 Year Environment Plan (25 YEP), for both the United Kingdom and England. Among other goals, the 25 YEP calls for data to support industrial symbiosis for materials and sets a 2042 target for zero avoidable plastic waste. While work on the circular economy continues at UK level, the United Kingdom cites innovation and resource efficiency in its 2021 strategy for recovery from the pandemic, Build back better: Our plan for growth. However, it contains few references to circular economy goals.
Policy documents for the four nations set out further circular economy objectives and actions. For England, the 2018 Resources and Waste Strategy and the 2021 Waste Management Plan take up the resource objectives of the 25 YEP and set further goals, including doubling resource efficiency by 2050.
Making Things Last: A circular economy strategy for Scotland in 2016 sets objectives and actions for the transition to a circular economy. It identifies four sectors – food, drink and bio-economy; remanufacturing; construction; and energy infrastructure – as priorities. Scotland’s 2018 Climate Change Plan has a section dedicated to circular economy, setting actions and milestones for society, business and local administrations to all engage in circular dynamics by 2032 and achieve full transition by 2045. In 2021, Scotland was preparing a circular economy bill, which had been delayed due to the pandemic, as well as a Route Map towards long-term “zero waste” objectives.
In Wales, the Natural Resources Policy in 2017 identifies the transition to circular economy as one of its overarching objectives. In early 2021, Wales launched a new strategy, Beyond Recycling, which sets further waste management and circular economy goals. These goals include achieving the highest recycling rate in the world; reducing all waste by 33% and food waste by 60% by 2030; and reaching zero waste and net zero carbon by 2050. It focuses on six core themes, such as innovation in materials use; upscaling prevention and reuse; building on the recycling record; and promoting investments in infrastructure.
Northern Ireland’s 2017 draft Economy 2030 Strategy stated that a circular economy strategy would be prepared. In 2021, it was developing an Environment Strategy for Northern Ireland, which is expected to include policy actions for the circular economy (DAERA, 2019).
2.3.2. Legal framework
Until exit from the European Union (EU exit), the regulatory framework for waste management in the United Kingdom was based on EU legislation. The EU Waste Framework Directive (2008/98/EC), for example, was transposed separately in the four nations, in the following pieces of legislation:
Waste (England and Wales) Regulations 2011 amended by Waste (England and Wales) (Amendment) Regulations 2012 and Environmental Permitting (England and Wales) Regulations 2010
Other EU legislation was either transposed into the legislation of the four nations or into UK national legislation. The Landfill Directive (1991/36/EC), for example, was transposed into the four nations. Meanwhile, key legislation establishing extended producer responsibility (EPR), such as the EU Packaging and Packaging Waste Directive and the Waste Electrical and Electronic Equipment Directive (2012/12/EU), was transposed into UK national legislation.
With the EU exit, statutory instruments ensured that EU waste legislation would continue to operate. The Waste (Miscellaneous Amendments) (EU exit) (No. 2) Regulations 2019 apply to England, Scotland and Wales. Meanwhile, the Waste (Miscellaneous Amendments) (Northern Ireland) (EU exit) Regulations 2019 apply in Northern Ireland. The Waste (Circular Economy) (Amendment) Regulations 2020 transposed relevant parts of the EU’s Circular Economy Package. These recent legal instruments amend some of the previous instruments identified above.
The Environment Act 2021 lays out a domestic framework for environmental governance post-EU exit and it introduces a range of new powers for waste management and circular economy. These include reforming EPR schemes; introducing electronic waste tracking; and allowing national authorities to require that manufacturers provide information on the resource efficiency of their products and to set up deposit-refund schemes (DRSs) for beverage containers. Some of the Act’s provisions, for example for municipal waste collection, apply only to England (Smith and Priestley, 2020).
2.3.3. Institutional framework and governance
In England, Defra is responsible for policies on waste management, sustainable production and consumption and the transition to a circular economy. The Environment Agency is the main waste regulator, responsible for issuing licences for waste carriers and sites.
In Northern Ireland, the Department of Agriculture, Environment and Rural Affairs Northern Ireland (DAERA-NI) is responsible for waste management policy. The Department and the Northern Ireland Environment Agency are the main waste regulators.
In Wales, the Resource Efficiency and Circular Economy Division in the Welsh government leads on policy, and Natural Resources Wales (NRW) is the main waste regulator.
In Scotland, the Environment and Forestry Directorate in the Scottish government is responsible for waste and resources policy. The Scottish Environment Protection Agency (SEPA) is the main waste regulator and is responsible for waste management. SEPA works with the Scottish government and Zero Waste Scotland (ZWS) (see below) to deliver Scotland’s zero waste plan.
Joint Ministerial Committees between the UK and devolved governments have been used to share information and discuss common issues. Officials across these administrations also work together on an informal, ad-hoc basis. With EU exit, Defra and the administrations of the devolved governments are preparing a Common Framework for Resources and Waste that should provide a context for formal structures. Formal and informal co-operation will need to be strengthened to achieve long-term waste management and circular economy goals: co-operation mechanisms in other OECD countries, such as Belgium and Germany, could provide models (Box 2.1).
In Germany, the Federation/Länder Working Group on Waste (LAGA) was established in 1963 to align the implementation of waste rules among federal states. It provides a link with the central government, a platform for information exchange and a source of common guidance. It also provides input and recommendations to improve waste legislation, as well as propositions that Germany may put forward at international level. LAGA, which is chaired by each federal state for a two-year term, has standing committees on waste law, waste technology and producer responsibility.
Source: LAGA (2021), Bund/Länder-Arbeitsgemeinschaft Abfall website.
Throughout the United Kingdom, local authorities have two key statutory roles. As Waste Collection Authorities, they collect waste or contract with private operators to collect it. As Waste Disposal Authorities, they designate treatment sites, although they can also operate facilities. While Northern Ireland, Scotland and Wales have a single level of local government, the structure varies across England. Many parts of England have two tiers, with both county councils and below them, district, borough or city councils. The county councils are responsible for waste management overall, whereas district, borough and city councils are responsible for waste collection. Other parts of England have a single tier of local government (unitary authorities) providing all services: these include the London and other metropolitan boroughs. Consequently, in the Greater London area, each separate borough is responsible for waste management, and their approaches differ (Box 2.2).
In London, 12 boroughs both collect and dispose of waste. In addition, four sub-regional partnerships jointly dispose of the waste collected by their members: the East, West, Western Riverside and North London Waste Authorities. Four boroughs provide joint waste management service through the South London Waste Partnership.
In 2018, the Mayor of London published the London Environmental Strategy, including a chapter on waste that calls on the boroughs to provide a minimum level of collection for dry recyclables (including glass, plastic, paper and cardboard, and metal cans), as well as food waste. The London Strategy includes goals to send no biodegradable or recyclable waste to landfill by 2026, recycle 65% of municipal waste by 2030 and halve food waste by 2030 (compared to 2015). A London-wide body, ReLondon, formerly the London Waste and Recycling Board, leads the city-wide circular economy strategy (Section 2.5.2).
Source: London Councils (2021), “About Waste Management in London”, webpage; Mayor of London (2018), London Environmental Strategy; Mayor of London (2017), “Waste Policy”, webpage.
The private sector has a significant role in waste management in the United Kingdom. A high number of private companies is involved in different stages of waste management, from collection to treatment, and about 40% of local authorities outsourced waste collection in 2019 (Sasse et al., 2020).
Several independent organisations play a key role in waste management and circular economy initiatives. The Waste and Resources Action Programme (WRAP), is an independent charity that supports waste management and the transition to a circular economy. Its work includes information for local authorities, including annual surveys of gate fee charges, management of public awareness campaigns (Section 2.4.1) and promotion of circular economy initiatives (Section 2.5). WRAP works with the UK and devolved governments and also with many local governments. It receives funding from these public sources, as well as from corporations participating in its campaigns and projects. ZWS, financed by the Scottish government and (until EU exit) EU regional funds, helps implement Scottish waste and circular economy policies. It supports local governments and carries out public awareness campaigns in Scotland. The Ellen MacArthur Foundation and other organisations such as Green Alliance and Business in the Community promote initiatives for the circular economy in the United Kingdom and around the world, working with business, governments and research institutions.
2.3.4. Monitoring and information systems
Most data on municipal waste management are collected by local authorities across the United Kingdom and compiled by the four governments. Local administrations collect data from the contractors that handle waste. In 2004, a web-based system, Waste Data Flow, was created to replace and streamline the data questionnaires that the central government had distributed to local authorities. Local authorities use the platform to submit data via online questionnaires that are largely similar across the four administrations (Defra, 2019). The consistency of the information is checked by Defra at UK level.
Waste Data Flow functions as the main data source for agencies, local authorities and policy makers. Its web platform publishes data accessible to the public. In addition, the UK government website publishes data sets managed by Defra and the Environment Agency. Waste statistics for Wales, Scotland and Northern Ireland are published on the websites of Wales Statistics (and Natural Resources Wales), SEPA and DAERA, respectively. The WRAP Local Authority Portal publishes statistics combining the information from Waste Data Flow and recycling schemes at the local level.
The National Packaging Waste Database (NPWD) compiles data on this waste stream and also batteries, and waste electrical and electronic equipment (WEEE). Local authorities and waste operators, including reprocessors and importers, use NPWD to submit data on waste streams covered by EPR schemes, including amounts of waste treated by accredited operators. Defra then aggregates these submissions at UK level and publishes them on the database website.
England’s 2018 Resources and Waste Strategy underlines the need to improve waste data, noting that data on waste from business come from a “patchwork” of sources. This contributes to waste crimes, including illegal dumping; unregistered waste; waste that does not reach its declared destinations (Section 2.4.4); and changes in waste descriptions to avoid regulations. The strategy calls for an electronic waste tracking system to address these problems. The 2021 Environment Act includes clauses for subsequent regulations to create this system, which is being developed with devolved administrations and will be implemented on a UK-wide basis. In January 2022, Defra launched a public consultation on the planned system.
The 2018 strategy also proposes a National Materials Datahub that would provide comprehensive data to support the transition to a circular economy. Among other sources, it would use data from the planned electronic waste tracking system. Moreover, the Strategy presents a range of indicators to measure progress, including new measures such as the carbon footprint of waste and of resources consumed, as well as future areas of work on natural capital accounting to better capture the environmental impacts of materials.
The United Kingdom addressed the call in OECD’s 2002 Review to establish a systematic data collection and information system for non-municipal waste. However, experience has shown that monitoring and information systems are not adequate to tackle waste crime or support the transition to a circular economy. More recent initiatives seek to address these needs.
2.4.1. Promoting municipal waste reduction and recycling
Waste collection
The United Kingdom’s local authorities are responsible for municipal waste collection and treatment (Section 2.3.3). They also organise nearly all kerbside collection of recyclable and residual waste for all households. In addition, they operate household waste recycling centres for other types of waste, such as bulky waste.
In England, each local authority determines the recyclables that should be separated from residual waste. This results in differences, including between neighbouring towns and across London’s boroughs. Many local authorities in England use a single bin for all dry recyclable streams: this can lead to losses due to sorting and when glass shards become embedded in paper and cardboard. In 2016, WRAP issued a voluntary framework that encourages local authorities in England to achieve greater consistency. The framework encourages the collection of the same core set of materials to help address confusion, and rationalising the range of collection approaches and how materials are presented for collection by householders. While many local authorities continue to make improvements, there is still great variation in the materials collected for recycling.
Many local authorities saw declines in their budgets following the financial crisis that began in 2008, and public information on waste collection was a common area for cuts. Lack of awareness persists. In a recent survey, 44% of respondents said they do not receive sufficiently clear information on what they can recycle, due in part to the differences in local requirements in England (WRAP, 2020a). To tackle this problem, WRAP organises public awareness campaigns, including Recycle Now (Box 2.3), a campaign for England and Northern Ireland funded by Defra and by private donors; and Wales Recycles, supported by the Welsh government. WRAP also advises local governments on how to tailor their information and awareness raising about local collections to national campaigns.
Recycle Now comprises both annual public awareness campaigns and smaller campaigns held at other times of the year. The UK-wide National Recycle Week, for example, is held in September. Smaller campaigns take place at end-of-year holidays and for specific waste streams such as aerosols and bathroom plastics. The Waste and Resources Action Programme (WRAP) co-ordinates the campaigns, except in Scotland where Zero Waste Scotland is the lead organiser. WRAP uses a range of tools including billboards and social media. Messages are targeted to different population segments, such as those who are already well aware of recycling and those who are less interested. WRAP uses social media “influencers” to help disseminate messages. Messages can vary across the four nations: in Wales, for example, WRAP’s campaign highlights both the existing high level of recycling and policy goals to reach further.
In England, local authorities collect different mixed recyclable waste: WRAP’s awareness campaigns focus on the waste streams most commonly collected. They highlight its UK-wide online locator tool, which provides requirements for all UK postcodes.
WRAP follows up its campaigns with surveys to measure their effectiveness: for the most recent Recycle Week, 92% of the people who saw the campaign reported they were motivated to recycle; and 89% said they changed their behaviour because of the campaign.
Source: Recycle Now (n.d.), website; WRAP (2021), “Recycle Locator Tool”, webpage.
In Scotland, 2012 regulations required all local authorities to provide a comprehensive recycling service to households, collecting dry recyclable waste and food waste (rural areas were exempted). In partnership with the Convention of Scottish Local Authorities (COSLA), Scottish government developed in 2015 the voluntary Scottish Household Recycling Charter, which seeks to deliver more consistent recycling collections across Scotland. Thirty of 32 councils have signed that Charter and, of these, over a quarter have services that are broadly aligned with its guidance. Wales established a common “Blueprint” for collection in 2010 (Box 2.4).
The Welsh government issued a common Blueprint in 2011 that calls on local authorities to collect food waste and dry recyclable waste streams at kerbside, each in separate containers. The Blueprint includes suggestions for types of bins and collection times, as well as types of collection vehicles. While the Blueprint is non-binding, nearly all local authorities in Wales had adopted or were adopting its approach by early 2021. Welsh local authorities have encouraged waste separation by reducing pick-up times and bin sizes for residual waste (with provisions for households with specific needs, such as infants using nappies). Most Welsh local authorities collect residual waste every two weeks, and some do so every three or four weeks. With support from the Welsh government, the Waste and Resources Action Programme has assisted local authorities in Wales in several ways. For example, it has modelled costs and benefits of new collection approaches and vehicle routes, trained staff and advised on selling separately collected waste to processors.
The Welsh government also introduced binding targets for local authority recycling in 2011, linked to its overall recycling targets (Section 2.3.2), It charges fines of up to GBP 200/t waste if targets are not met. In addition, Wales has invested over GBP 1 billion in recycling services and separate food waste collection, much of this supporting local authorities.
Source: Welsh Assembly Government (2011), Municipal Sector Plan, Part 1 Collections Blueprint.
Separate collection of recyclable waste from apartment buildings and other multiple-occupancy developments has been a common challenge across the United Kingdom. WRAP has identified a series of barriers, including lack of storage, high turnover rates, and difficulties in communication to often diverse residents. Some councils have acted: Islington in London increased information for landlords and tenants, for example, while Preston, near Liverpool and Manchester, increased its penalties (WRAP, 2019). A further issue is that many UK businesses contract with private companies for collection, often with lower recycling rates for paper, plastic and recyclables than household waste collected by local authorities.
The UK’s 2021 Environment Act requires that all local authorities in England must collect from households a core set of recyclable waste streams: paper and card; plastic; metal; food waste and garden waste. It also calls for businesses to ensure these waste streams are collected separately for recycling or composting. The planned electronic waste tracking system (Section 2.3.4), also established under the Act, is expected to better follow these waste flows and identify opportunities to increase higher recycling rates.
Reducing and ensuring separate collection of food waste
WRAP estimates that UK households discarded about 8.1 million t of food and drink waste in 2007, about 60% of which was avoidable waste; by 2018, households had reduced their food waste by 18% (WRAP, 2020b). WRAP has organised a long-running public awareness campaign, Love Food Hate Waste. The campaign highlights links between food waste and greenhouse gas (GHG) emissions and provides tips for reducing waste (in Scotland, ZWS now manages the campaign). According to WRAP, this campaign, as well as the separate collection of food waste, has made households more attentive when buying and consuming food.
About half of local authorities in England collected food waste separately in 2013. However, the share was the same towards the end of decade, indicating that progress in extending collection has been slow. In contrast, Northern Ireland in 2015 called on all local councils to put in place separate collection of household food waste (which can be collected together with garden waste). In Scotland, all local authorities except those in rural areas are required to collect household food waste. In Wales, the 2010 Blueprint called on all local authorities to do so (Box 2.4) and 99% of households have a weekly separate food waste collection service. The Wales Blueprint also calls for food waste collection from businesses, which is also required in Northern Ireland (Priestley, 2016). In Scotland, all businesses outside rural areas producing more than 50 kg of food waste per week were required to ensure separate collection from 2012; in 2016, the threshold was lowered to 5 kg per week. Moreover, Scotland’s 2016 circular economy strategy, Making Things Last, set a target to reduce food waste from all sources to two-thirds of 2013 levels by 2025. ZWS is supporting businesses and schools to reduce their food waste.
WRAP has also worked with the food processing industry and with retailers in the Courtauld Commitments to reduce upstream food waste (Section 2.5.1); participating businesses, supported by changes in government guidance, updated food labelling to encourage consumers not to throw out useable food.
Despite these awareness-raising initiatives, many households across the United Kingdom continue to discard a high share of food waste with their residual waste or include food packaging in food waste bins. Recent government actions seek to address this issue and further promote the reduction and separate collection of food waste. In Scotland, the 2019 Food Waste Reduction Action Plan calls for new infrastructure, awareness raising and training. In 2021, Wales set a target to reduce avoidable food waste by 50% in 2025 and by 60% in 2030 (compared to 2006-07 levels). England’s 2018 Resources and Waste Strategy calls for separate food collection in all English municipalities, which became law through the 2021 Environment Act.
Economic instruments: Waste charges and taxes
Local authorities in the United Kingdom do not directly charge households for waste collection and treatment, as their council taxes lack a line item for these costs. They finance all their services, including waste management, through a combination of council taxes and central government grants.
No local authorities use “pay as you throw” (PAYT) systems that link household charges to amounts of waste generated. (Many local authorities charge for specific waste streams, such as bulky waste collected at kerbside, while businesses pay for public or private collection based on their waste volumes.) PAYT charges have been proposed occasionally, including by the UK government’s Advisory Committee on Packaging in 2021 (Vaughan, 2021). This could strengthen efforts to increase separate collection and recycling, especially in parts of the United Kingdom with lower levels. Relevant examples might be considered from other OECD countries. For example, in Flanders (Belgium), some local authorities charge a high price for the mandatory bags used for residual waste (OECD, 2021). In the United Kingdom, where households receive bins, local authorities could reduce bin size as in Wales. They could then charge a higher rate to households that wish to have a larger bin (with allowances for particular needs).
All four UK nations set a charge of 5 pence on single-use carrier bags in the first half of the review period: Wales was the first to launch in 2011, followed by Northern Ireland and Scotland in 2014, then England in 2015. The charge led to sharp falls in the use of these bags: Northern Ireland estimated a 72% drop in the first year, and Wales a 71% fall in the first three years. For a period in 2020, all four governments suspended the charge. In 2021, England extended the charge from food shops to all retailers and increased the charge from 5 to 10 pence (Southerland, 2020). Scotland also increased its charge to 10 pence in 2021, and Northern Ireland will increase its charge to 25 pence (for all bags worth less than 5 GBP) in 2022. In addition, the United Kingdom will introduce a tax on plastic packaging below a required level of recycled material (Section 2.4.2).
The United Kingdom established a landfill tax in 1996 of GBP 2/t for inert waste and GBP 7/t for “active” waste (and thus municipal waste). Scotland and Wales now set the landfill tax in their territories, although in practice the tax rates have remained identical to those in England and Northern Ireland. There have been regular increases each year since 1999 (called the “escalator”) for active waste of GBP 1/t until 2004, then GBP 3/t until 2007, and then GBP 8/t to 2014, by which time the rate had reached GBP 80/t. After 2014, however, the increase was limited to the rate of inflation. The current rate, GBP 96.7/t, is higher than levels in nearby OECD Europe countries such as Belgium, France and the Netherlands (Table 2.2). The lower rate for inert or inactive waste, GBP 3.1/t in 2021, is far lower as it increased at a much slower pace. The landfill tax acted as one of the main drivers in the United Kingdom’s reduction in landfilling of municipal waste and the shift in particular to incineration (Figure 2.6), including exports of waste for incineration with energy recovery (Elliot, 2016; HMRC, 2021a).
The United Kingdom does not have taxes on incineration, as do several other OECD Europe countries such as Belgium and Netherlands (OECD, 2021). For example, in 2020 the Flanders region of Belgium had a tax of EUR 8.18/t on incineration (with energy recovery) for general waste and EUR 2.34/t on recycling residues. For its part, the Walloon region had a tax of EUR 11.75/t on incineration with energy recovery of general waste and a rate more than five times higher for incineration without energy recovery (which is no longer used in Flanders). In 2018, a UK-wide government review indicated that it could be considered in future (HM Treasury, 2018). Wales has proposed an incineration tax in its territory; this would require authority from the UK government. Incineration taxes with common rates across the United Kingdom (and for waste exported for incineration) could provide further incentives and complement other measures to promote recycling.
The four governments have used allowance schemes that cap the amount of biodegradable municipal waste (food, yard waste and paper) that local governments can send to landfills. Municipalities in England, Scotland and Northern Ireland could trade allowances but not those in Wales. England and Scotland ended their schemes by 2013, while Northern Ireland and Wales maintained theirs through 2020. These schemes have helped all four nations meet EU targets for reducing biodegradable municipal waste to landfill (Table 2.1). When Scotland ended its allowance scheme, it announced a ban on landfilling of biodegradable municipal waste to be in place by January 2021. However, in 2019, the government postponed the ban to 2025. It cited insufficient alternative treatment facilities, as well as concerns the ban could have led Scotland to send waste to landfills in England (Pegg, 2019). This shows how waste policy in the four nations is intertwined. The Scottish government’s programme for 2021-22 calls for a review of fiscal incentives, and of the role of incineration, to meet its waste and climate emissions policies.
The United Kingdom has successfully followed the recommendation in OECD’s 2002 Review to revise measures such as landfill taxes to help reduce landfilling. The United Kingdom has not, however, introduced household charges that could encourage less waste, such as PAYT systems. This approach should be considered.
Public financing for waste investments
A range of government programmes has financed waste treatment facilities and other investments. In 2006, Defra established the Waste Infrastructure Delivery Programme in England. It provided local authorities with financial support for public-private partnerships, specifically for waste treatment projects financed via a Private Finance Initiative. The programme has provided about GBP 3 billion in grant funding to 27 projects. Since its inception, the programme has also supported local authorities with procurement and operations on these contracts.
The devolved governments have also supported investments for waste collection and treatment. Northern Ireland’s 2019 Waste Management Plan reports, for example, that GBP 40 million was provided to local authorities for investments in recycling services and infrastructure. A further GBP 23 million would be allocated from 2019 to 2022. The Welsh Waste Infrastructure Procurement Programme has secured over GBP 740 million in new infrastructure, including via public-private partnerships. In particular, it has expanded recycling and anaerobic digestion capacity to help meet Welsh recycling and composting targets. The Scottish government’s Strategic Waste Fund has supported development of local authority waste and recycling infrastructure. In 2021, it launched a five-year, GBP 70 million Recycling Improvement Fund administered by ZWS to help achieve recycling targets.
Progress in recycling
For the United Kingdom as a whole, landfilling has fallen steadily (Figure 2.6). This decline has been driven by several policy instruments including, notably, the growing landfill tax and public financing for alternative waste management facilities. The decline has also coincided with a shift, particularly in England, to incineration. By mid-2021, for example, England had nearly 100 incineration facilities, plus 17 facilities producing refuse-derived fuel for energy recovery. Nonetheless, about 500 landfills remained operational in England and Wales in 2021 (Environment Agency, 2021a).
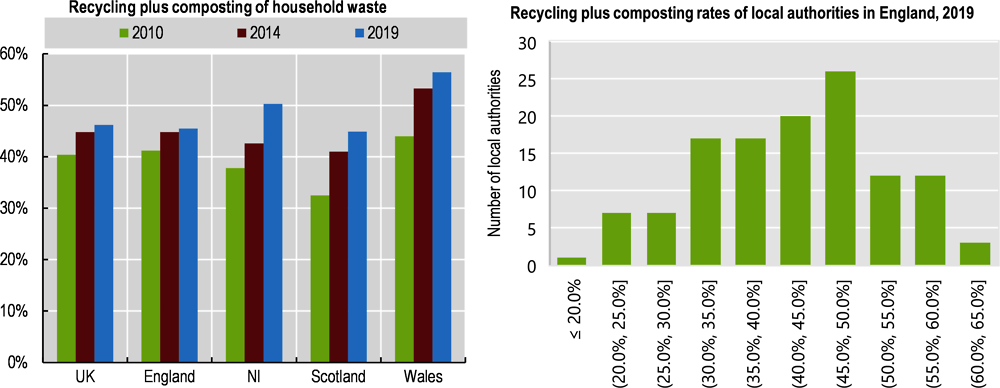
Policies and public financing to support separate collection have increased recycling and composting rates. Northern Ireland, Scotland and Wales each saw the combined rate increase by more than 10 percentage points between 2010 and 2019. The combined rate grew more slowly in England, and recycling rates vary greatly among its local authorities (Figure 2.12). Recycling rates also vary greatly among Scotland’s local authorities. As a result, Northern Ireland and Wales achieved the 50% EU recycling target for 2020 one year early. With 65% of all municipal waste recycled in 2019, Wales also appears to be on target to meet its ambitious 2025 targets (70% recycling and composting and zero waste to landfill in 2025). In 2020, rates are expected to be lower due to the COVID-19 pandemic.3
Note: There were changes in the data collection method in 2014-15, but the data were adjusted for consistency. Data collection and definitions vary slightly across the UK.
Source: Defra (2021), UK Statistics on Waste.
Recent UK waste policies set the stage for further increases in recycling, as well as composting. In England, for example, the upcoming reforms in the collection of dry recyclables will need to be co-ordinated closely with reforms proposed for EPR schemes (Section 2.4.2).
2.4.2. Extended producer responsibility
Over the past decade, EPR4 was in place for four waste streams: packaging waste, end-of-life vehicles (ELVs), waste batteries and accumulators, and WEEE. EPR schemes are organised on a UK-wide basis. For the packaging waste, consumer battery and WEEE schemes, companies can join a producer responsibility organisation (PRO) – known as a producer compliance scheme (PCS) in the United Kingdom – that will treat their waste.
Packaging waste
Under the producer responsibility scheme for packaging, 47 PCSs in the United Kingdom had 6 294 members in 2021; another 384 companies were direct registrants fulfilling obligations themselves (Environment Agency, 2021b). The EPR uses a market-based system. The PCSs and companies that are direct registrants buy packaging recycling notes (PRNs) from waste processors and buy packaging export recycling notes (PERNs) from waste exporters equivalent to their recycling obligations. These notes serve as a proof of compliance (Environment Agency, 2020). Their availability is based on the quantities of packaging waste treated and/or exported for recycling and their price varies, sometimes substantially.
Waste processors sell PRNs based on the weight of packaging after it has been sorted and decontaminated. By contrast, PERNs are based on the entire bulk that is exported, potentially without extensive sorting. According to the British Plastics Federation, this difference creates a preference for exports rather than domestic recycling and has led to underinvestment in domestic recycling facilities (BPF, 2021). There is also an issue for prices when export markets change. For instance, China placed restrictions on plastic scrap imports starting from 2018. Consequently, the number of PERNs available from UK exporters fell, which in turn led to much higher prices. In another example, PRN prices for aluminium packaging increased in 2018 from GBP 9/t to GBP 100/t (Eminton, 2019; WRAP, 2021a). In recent years, the decrease in export opportunities has combined with limitations in domestic recycling capacity, leading to higher prices. Barriers to the expansion of UK recycling facilities have included the volatility of recycling note values, historically lower prices for exports and uncertain returns for investments in domestic recycling (Iacovidou et al., 2020).
Despite these issues, in 2018, the United Kingdom exceeded the EU targets in place since 2008 for all packaging waste streams (while the UK’s aluminium rate was below the EU’s combined target for metals, this was compensated for by the higher steel recycling rate). It also met or was close to many of the targets for 2025 (Table 2.3). The United Kingdom also sets higher “business targets” for the PCSs to compensate for packaging produced by businesses that is below the minimum thresholds and not subject to the regulations. The business targets are usually set annually and increased year to year, supporting long-term improvements.
The UK’s National Audit Office has raised concerns about the data reported, as well as other aspects of this EPR. It reported that the Environment Agency “does not have a good understanding of the extent of fraud and error” (NAO, 2018). Moreover, the methodology for determining the amount of packaging consumed is complex and has not been reviewed. The National Audit Office warned of insufficient controls to prevent exports of contaminated and poor-quality plastic scrap. Unlike in other OECD Europe countries such as Belgium and the Netherlands, UK producers contribute only a minor share of the costs of municipal collection of post-consumer packaging from households. England’s Waste and Resources Strategy (2018) noted that producers have limited responsibility to cover the costs of managing packaging waste. As a result, the system does not provide sufficient incentives for them to design products for greater reuse and recyclability. The strategy also outlined reforms to address shortcomings; reform proposals are described below.
Waste electrical and electronic equipment
The United Kingdom reportedly generates one of the highest levels of WEEE per capita in the world; an estimated 40% of UK WEEE is exported for treatment (HoCs, 2020). Producer responsibilities are based on the EU’s 2012 WEEE Directive, which introduced separate collection of WEEE streams and imposed obligations to operators such as producers and importers (which can join one of the 28 WEEE PCSs). Collection, recovery and recycling targets are set separately for different product types. Collection targets are calculated and set annually, based on electrical and electronic equipment put on the market in the three preceding years. The recovery and recycling targets vary from 75% to 85% for recovery and from 55% to 80% for recycling, depending on the type of equipment. The following tables present an overview of recent collection, recovery and recycling rates (Table 2.4, Table 2.5).
Retailers and distributors also have responsibilities. Retailers with physical stores that sell more than GBP 100 000 a year worth of electrical and electronic equipment are obliged to set up a collection point. Those with a smaller business and without a physical store can join a Distributor Takeback Scheme.
The collection rates for WEEE have been fluctuating. Targets for household WEEE were not met from 2017 to 2020 (Table 2.4). The collection rate for household WEEE was 30% in 2020, while the overall collection rate, for both household and non-household waste, was slightly lower at 26% (Environment Agency, 2021c). Whereas collection rates reach 75% for large household appliances, they are around 25% for small household appliances (BPF, 2021).
Compliance fees were introduced in 2014 to address issues when not enough WEEE is available: among these, some PCSs had reportedly been buying more evidence notes than they needed and then re-selling for higher prices to others that fell below their targets. The compliance fees put a ceiling on the trading prices; however, they create a disincentive for the collection of WEEE whose treatment costs are higher than the fee, as noted by the House of Commons Environmental Audit Committee in 2020. The committee highlighted other challenges with the system, such as its failure to meet collection targets and the presence of free riders, including online retailers. Moreover, annual targets are set based on company self-reporting, and do not provide strong direction (HoCs, 2020). England’s 2018 Waste and Resources Strategy has called for legislation to provide greater incentives to producers to design and sell more sustainable products.
Waste batteries and accumulators
Companies that produce portable batteries are obliged to join a Battery Compliance Scheme that takes care of collection and treatment. Vehicle battery producers are obliged to take back waste batteries from final holders such as garages, local authorities’ collection points and ELV treatment sites and send them to approved treatment centres or exporters. Industrial battery producers also have takeback obligations from end-users (Environment Agency, 2018). Waste batteries and accumulators are banned from landfills and incineration.
Only portable batteries have a collection target: this was consistently met between 2010-20 (Table 2.6). Nonetheless, most portable batteries are not collected: England’s 2018 Waste and Resources Strategy estimates that for the UK as a whole more than 320 million portable batteries per year are not recycled. The Strategy suggests possible solutions, including expanded kerbside collection and targets for different types of batteries. The strategy also underlines the upcoming challenge of collecting and treating batteries from the growing number of electric vehicles (EVs). In the light of these issues, the regulation was under review in 2021, with a stakeholder consultation expected in 2022.
End-of-life vehicles
The UK’s ELV Regulation sets free takeback obligations, and recovery and recycling targets, for vehicle producers and importers. The targets are set to 95% for recovery and 85% for recycling by average weight of each ELV. They also must report information on the recovery and recycling operations to public authorities annually. In 2018, the recovery rate (92.8%) was below the target. The reuse and recycling rate (85.2%) met the required target. As in the case for batteries, ELV Regulation is under review, with consultation expected in 2022.
Reforming the UK’s EPR schemes
The United Kingdom is planning major changes to its EPR schemes along with proposals for new ones. In 2019, a joint consultation was launched on proposed amendments to increase incentives for design for reuse and recyclability of packaging and to increase the responsibility of producers in supporting municipal packaging waste collection from households. Defra and the devolved administrations are working together on the packaging waste reforms via a sectoral policy board and a management group. During initial consultations in 2019 and in a second phase in 2021, both industry and local authorities raised concerns about the proposals. Industry submissions claimed the proposals are overly complex. For their part, local authorities expressed concern the proposal would not guarantee that industry would cover the full costs of packaging in household waste collection and treatment (Smulian, 2021a and 2021b).
Alongside the packaging waste reforms, the United Kingdom and devolved governments also plan to introduce DRSs for most beverage containers (Box 2.5). These schemes tend to exhibit high collection/return rates and lower incidence of target products in litter surveys. However, the introduction of a DRS can impact incumbent waste managers when it isolates a valuable waste stream. DRSs tend to shift revenues from sale of recovered material from the incumbent waste managers (OECD, forthcoming). These concerns have been raised in the UK context, where local authorities worry that kerbside collection of these containers is likely to decrease, reducing revenues from the sale of waste materials such as metal cans. Industry representatives have stated that DRSs for plastics beverage containers could be more expensive to operate than kerbside collection.
In 2020, the Scottish government approved a deposit-refund scheme that will become operational in 2023. All single-use plastic, metal or glass bottles or cans will have a 20 pence deposit. The consumers will pay the deposit upon purchase and get refunded upon return. For England, Wales and Northern Ireland, a scheme has been planned since 2018. There were two rounds of consultation, the first in 2019 and the second in the first half of 2021. The government had wanted to reassess the scheme and its reception by stakeholders and the public in a post COVID-19 context. The results of the consultation were being analysed in 2021, with a scheme expected in 2024.
Source: Laville (2021), “No bottle deposit return scheme for most of UK until 2024 at earliest”, The Guardian, 24 March; ZWS (2021), “Deposit Return Scheme”, webpage.
OECD highlights that DRSs can increase recycling or reuse. Scotland’s DRS is intended to increase recycling (and reduce litter) of single-use packaging (National Archives, 2021). The United Kingdom should explore how existing and planned schemes can be used to promote reuse. In addition, DRSs can be used to isolate a hazardous waste for treatment. The United Kingdom should consider developing DRSs for waste streams with hazardous substances, such as portable batteries.
In addition to DRSs, the UK government has prepared a UK-wide tax on plastic packaging that contains less than 30% recycled content. This tax, which aims to provide an incentive to use recycled material, will be introduced in 2022. The government estimated the tax would increase use of recycled plastic in packaging by 40% and lead to saving about 200 000 t of carbon in its first year (HMRC, 2021b).
The United Kingdom is also considering new EPR schemes. England’s 2018 Resources and Waste Strategy and Wales’ 2021 circular economy strategy, Beyond Recycling, call for schemes for textiles, bulky waste (in particular furniture), certain waste streams from the construction and demolition sector, vehicle tyres and fishing gear. In Scotland, an EPR for mattresses has been under consideration and an EPR for fishing gear is planned (ZWS, 2021a).
2.4.3. Managing contaminated sites
The modern industrial revolution started in the United Kingdom over two centuries ago, leaving a legacy of potentially contaminated sites, particularly in former industrial areas. In England, the Environment Agency estimated that about 325 000 sites were contaminated to some degree in 2005 (Paya Perez and Rodriguez, 2018). In 2009, the Scottish EPA estimated that about 67 000 sites could be affected by contamination (SEPA, 2009).
Land affected by contamination in the United Kingdom is mainly dealt with through the planning system, under which developers investigate and clean up the land to make it suitable for new uses. Since 2017, local authorities in England must develop registers that list previously used parcels of land that are appropriate for housing, including land that may be contaminated (CPRE, 2020); some of these “brownfield” sites may include contaminated land.
The Contaminated Land Regime in the United Kingdom was introduced in 2000 under Part 2A of the Environmental Protection Act 1995 to identify and remediate contaminated land not being dealt with through the planning system. In 2009, it was estimated that around 10% of land affected by contamination is dealt with through Part 2A. Anecdotal evidence suggests this proportion has since decreased.
According to 2012 guidance, local authorities in England should inspect sites using a risk-based approach to identify contamination. The guidance also provides local authorities with the power to designate contaminated sites. In particular, land is designated as contaminated if there is a “significant possibility of significant harm to human health” or to the environment, as local authorities consider ecosystem effects and water contamination. Local authorities oversee remediation except for “special sites”, where the Environment Agency is responsible. These public bodies can recover costs from private parties if necessary (Defra, 2012).
From 2000 to the end of 2013, 38 830 sites in England, Wales and Scotland had undergone some form of inspection: these represented approximately 65% of the estimated total number of sites requiring inspection. At least 635 sites were determined as containing contaminated land, and remediation had been completed on 529 of these sites (national submission). More recent data are not available. Moreover, progress reportedly has slowed since 2013 and many sites still need inspection and remediation.
The United Kingdom has followed through on the recommendation in OECD’s 2002 Review to implement legislation on the remediation of contaminated sites. Nonetheless, local governments have largely retained responsibility for designating sites and overseeing their clean-up. Given that many of these governments face funding difficulties, the pace of remediation has slowed since 2013.
2.4.4. Addressing illegal waste dumping and illegal exports
Illegal waste dumping (or “fly-tipping”) has been an important concern in the United Kingdom. In 2020/21, local authorities in England dealt with 1.13 million fly-tipping incidents. Of the reported incidents, 34% (377 000) were equivalent to a small van load. Only 4% (39 000) of total incidents were equivalent or greater in volume to a tipper lorry load. For these large fly-tipping incidents, the cost of clearance to local authorities was GBP 11.6 million. Illegal dumping reportedly increased in 2020 during the COVID-19 pandemic. While local authorities and the Environment Agency clean up incidents on public land, private owners are responsible for cleaning up fly-tipping on their land. Local authorities vary in their support, some removing the waste for a charge.
There are several reasons for illegal dumping. Businesses want to avoid waste collection and treatment costs. Meanwhile, criminal groups offer to pick up household and commercial waste at low prices and then dump it on private or public land. Several members of parliament have contended that cuts in local government funding over the past decade have exacerbated the problem. Such cuts led to the closure of waste collection sites and a lack of information activities. An independent study (Purdy and Crocker, 2021) concludes the system to register waste carriers, brokers and dealers in England “does not function effectively and is being misused”. It noted the “upper tier” of the system, for professional waste registrations, contains over 140 000 entries. However, it pointed out that about 61% of individuals and organisations identified in a sample as advertising waste services were not registered. The study calls for reform of the registration system and for steps to ensure that only registered businesses can advertise.
UK governments have sought to address this ongoing problem. The 2018 Resources and Waste Strategy set out actions against waste crime in England. In 2014, the Scottish government published Towards a litter-free Scotland, and in May 2016, local authorities were given the power to issue fixed penalty notices for small-scale fly-tipping. In December 2021, the Scottish government launched a consultation on a new National Litter and Fly-tipping Strategy. In January 2020, the Environment Agency, NRW, SEPA, the UK's tax, payments and customs authority (HMRC), the National Crime Agency and the police formed a Joint Unit for Waste Crime, including illegal waste dumping. The 2021 Environment Act strengthens authorities’ powers to tackle waste crime. To address shortcomings in the system for registration of waste carriers, brokers and dealers, in January 2022 Defra opened a public consultation on a proposal to require permits and to introduce, among other provisions, a technical competence qualification and a requirement to provide permit numbers for advertising and in vehicles.
To address illegal waste exports, the Environment Agency has increased enforcement: 1 889 containers were inspected at English ports in the year ending March 2020: of these, 463 were stopped for attempting to illegally export waste. In 2020 and 2021, the Environment Agency addressed illegal plastic waste exports to Turkey, an issue highlighted in NGO and press reports: in 2020, the Agency prevented 63 containers with illegal plastic waste shipments, and 104 as of November in 2021. In this area as well, the United Kingdom has strengthened measures, but further efforts are needed. The UK government plans to consult on further measures to monitor and enforce export requirements, and has also pledged to ban exports of plastic waste to non-OECD countries.
The United Kingdom has strengthened measures to prevent and discourage illegal waste disposal, including inspection and enforcement measures, as recommended in the OECD’s 2002 Review. However, further efforts are needed. The UK’s planned mandatory electronic waste tracking system (Section 2.3.4) is expected to tackle both illegal dumping and illegal waste exports. Illegal dumping appears largely related to small waste loads by unauthorised carriers: the proposed tracking system will need to include small loads efficiently. Moreover, the United Kingdom should follow through on proposals to reform the registration system, combined with UK-wide awareness campaigns and further enforcement actions, to tackle this issue. The tracking system will also need to trace waste exports to authorised treatment facilities abroad.
2.5.1. Private sector initiatives
A range of voluntary private sector initiatives have promoted waste reduction, resource efficiency and circular economy actions.
WRAP has co-ordinated key sectoral initiatives. In the Courtauld Commitments, WRAP brought together leading UK food manufacturers, retailers and enterprises in the hospitality and food service sector. WRAP estimates the first Commitment (2005-09), mainly with manufacturers and retailers, reduced household food waste by 270 000 t; in the second phase (2010-12) signatories reduced household food waste by 670 000 t. Also in the second phase, signatories reduced combined product and packaging waste in their supply chains by 7.4% by 2012 compared to a 5% reduction target (WRAP, 2013). Signatories reduced supply chain product and packaging waste by a further 3% in the third phase from 2013-15. Those in a separate agreement from 2012-15 reduced their combined food and packaging waste by 11%, nearly doubling the 5% target, and also redistributed 760 t of surplus food (WRAP, 2021b and 2021c).
The Courtauld Commitment 2025, launched in 2015, saw further reductions in supply chain waste and included targets for reducing GHG emissions; this phase also promoted greater redistribution of surplus food (WRAP, 2020c). In 2021, the 2025 commitments were updated to 2030. Additional targets included halving per capita food waste compared to 2007 levels; halving GHG emissions compared to 2015; and ensuring half of food comes from areas with sustainable water management (WRAP, 2021d). Actions to reduce household food waste have been a key part of the 2025 and 2030 agreements, as this is estimated to be the largest area of food waste. Courtauld signatories, for example, supported WRAP’s Love Food, Hate Waste campaign (Section 2.4.1).
The Sustainable Clothing Action Plan (SCAP) ran from 2012 to 2020. SCAP brought together manufacturers, brands and retailers responsible for 48% of UK clothing sales by volume to work towards targets to reduce waste, as well as water and carbon footprints. Other signatories included waste management companies, while trade associations, NGOs, academic organisations and regulatory bodies joined as supporters. While the targets to reduce water and carbon footprints by 15% were exceeded, the signatories’ waste footprint only fell by 2.1% between 2012 and 2020, missing the 3.5% goal. In the supply chain, SCAP signatories reduced their use of fibres that generate higher levels of waste in production, including flax, linen and nylon. However, the plan’s final report states that data gaps on waste in the textiles supply chain limited action. Clothing in household waste was reduced by only 4% in this period, significantly below the 15% goal. Household clothing consumption increased over the years of SCAP, which partly explains the small reduction in waste (WRAP, 2021e). WRAP and its partners are working on a new phase of the voluntary agreement for 2021-30, called Textiles 2030. This initative is underpinned by ambitious targets: signatories have committed to halve their GHG footprint and reduce their water footprint by 30% by 2030 compared to a 2021 baseline. The new agreement also calls for greater design for circularity (including more durable and recyclable clothes) and more circular approaches, such as greater use of recycled fibres in new products (WRAP, 2021f).
The 2018 Plastics Pact, based on the Ellen MacArthur Foundation’s “New Plastics Economy” initiative, commits signatories to various targets. They must ensure that all their packaging is reusable, recyclable or compostable by 2025; that 70% is recycled or composted effectively; and that 30% of plastic packaging is composed of recycled content. From 2018 to 2019, WRAP reported that signatories had increased the recycled content of plastic packaging from 9% to 13%; increased plastic packaging recycling from 44% to 50%; maintained the level of recyclable plastic packaging at 64%; and reduced problematic or unnecessary items by 40% (WRAP, 2020d).
Several success factors have been identified for these initiatives. They include WRAP’s work to bring together key actors; establish a business case for environmental improvements; identify achievable goals; agree on measurable targets; develop common methods to estimate impacts and progress towards targets; and regularly review and report on progress. WRAP has worked with leading members in the pacts to test innovative approaches that can be adopted on a wider basis. Successful agreements have brought together a high share of the markets, as for textiles companies that joined SCAP and Textiles 2030. While government sources, including Defra, funded WRAP’s initial work on these agreements, signatories contribute once the agreements are launched. A review of England’s Waste Prevention Programme found that voluntary agreements were successful when government and the private sector worked together; businesses took on commitments and targets; and different sources provided ongoing funding (WRAP, 2020e). WRAP initiatives such as the Courtauld Commitments notably seek to reduce both industry and household waste.
The Electrical and Electronic Equipment Sustainability Action Plan, launched in 2014 with the participation of 80 major companies, was less successful. Its aims included reducing product footprints based on a lifecycle approach and increasing durability, reuse and repair. The plan produced a product durability guidance, among other outputs; however, government funding ceased in 2018 and private members did not support a new funding framework. The high diversity of products and a major presence of foreign manufacturers in the sector hindered agreement. However, WRAP continues to collaborate with interested companies on a project by project basis (WRAP, 2020e).
In addition to WRAP’s work, other organisations and business associations have supported work on the circular economy. The Waste to Wealth Commitment, developed by Business in the Community, provides guidance to increase resource productivity and improve waste management. For its part, the Circular Economy Taskforce, organised by the Green Alliance, promotes networking, innovation and entrepreneurship.
These agreements have interacted with government policy. For example, the 30% recycled content target in the Plastics Pact was reflected in the minimum content for the 2022 Plastic Tax. The work of the Ellen MacArthur Foundation and WRAP contributed to circular economy policies as have other initiatives. The Prince’s Responsible Business Network, for example, organised the 2018 “Waste to Wealth” Conference. This event supported the ambitious 2050 resource productivity objectives of that year’s England Resources and Waste Strategy.
WRAP has worked with other countries. In an EU LIFE project, the European Clothing Action Plan, WRAP and partners in Denmark and Netherlands used SCAP as a model for initiatives in these two countries and awareness raising across Europe. In 2021, WRAP, the Ellen MacArthur Foundation and partners in Denmark and elsewhere launched the Textiles Action Network to promote global actions for the circular economy in the clothing industry. WRAP helped launch Plastics Pacts in the European Union and in South Africa in 2020 (WRAP, 2020e).
With the upcoming introduction of stronger EPR for packaging and other waste streams (Section 2.4.2), waste reduction goals may become less relevant for voluntary agreements. Agreements such as Textiles 2030 are taking on new objectives for the transition to a circular economy.
2.5.2. Government actions and policies
England’s 2013 Waste Prevention Programme has supported private initiatives for resource efficiency. Recent circular economy policies call for a range of further work in co-operation with business, research bodies and civil society. This includes encouraging new product design and supporting the social economy to achieve greater material productivity. In 2021, Defra held a consultation on a new Waste Prevention Programme for England. Among its proposals are actions to promote product design that supports reuse, repair and recycling and to encourage industrial symbiosis. The final Programme should be published in 2022.
Scotland’s 2016 circular economy strategy, Making Things Last highlights product reuse and remanufacturing among its themes. It establishes Revolve, a quality standard and label that second-hand shops can use to boost consumer confidence in their goods. The strategy encourages social enterprises working on reuse and repair through funding and technical support, including training to improve skills. The government also supports the Scottish Institute for Remanufacture, where business and research organisations collaborate to promote the growth of remanufacturing. The circular use of biological resources is among the priorities for the 2016 strategy. The government, for example, has sponsored an initiative to recover protein from whisky production waste water and use it as salmon feed, replacing traditional inputs (Horizon Proteins, n.d.).
In its 2021-22 programme, the Scottish government reiterated a proposal to introduce a circular economy bill. To support Scotland’s resource productivity and climate objectives, ZWS has launched studies to improve metrics related to the circular economy. It has identified material flow accounts and carbon footprint as key indicators to be developed.
The Welsh government created a Circular Economy Fund, financed with GBP 6.5 million and managed by WRAP Cymru. Beyond Recycling, the 2021 circular economy strategy for Wales, highlights the role of social enterprises in product repair and reuse. It calls for a Green Growth Pledge for business and the development of repair and reuse hubs within communities. The Welsh government has issued a set of indicators for its Beyond Recycling strategy, including indicators for carbon savings from recycling, the activity of repair cafés and the amount of plastic sent for recycling outside Wales.
UK policies also address the role of products in the transition to a circular economy. Both the Scotland and Wales strategies call for improving product design for longer lifetimes and greater reparability and reusability. The 2021 Environment Act provides the United Kingdom and devolved governments with powers to set resource efficiency requirements in several areas. These include those related to product durability, recyclability and reparability, as well as recycle content (Smith and Priestley, 2021). The 2021 Energy-related products policy framework calls for products that can be more easily repaired, remanufactured and recycled. Meanwhile, the UK government is working on a broader products policy that will include circular economy goals. The UK’s innovative plastics tax can provide a start for further, ground-breaking work on product policy. Given the importance of its trade with the EU, the United Kingdom should consider developments in the European Union, including the upcoming sustainable products policy initiative and possible product standards, as well as work in other OECD countries. It should also co-ordinate its policy closely with the European Union and other OECD economies.
Both the United Kingdom and devolved governments have also acted to reduce waste and promote the circular economy via their procurement (Box 2.6).
At the UK level, the Greening Government Commitments for 2016 to 2020 included pledges to halve paper use compared to 2009/10, reduce waste generation and increase recycling. By 2019, UK government paper use had fallen 59%, waste generation by 40% and recycling had increased to 65%.
The Scottish government has promoted sustainable procurement tools for lifecycle impact mapping, considering the impacts of raw materials extraction and the reuse, recycling and remanufacture of materials among their criteria. In Wales, the 2019 Sustainable Procurement Code of Practice for the National Health System calls for reducing waste and incorporating circular criteria for both products and services, and the 2021 Wales Procurement Policy Statement cites the policy objectives for the circular economy and local supply chains in its principles. Quantitative results of these initiatives were not available, however.
Source: Defra (2020), Greening Government Commitments Annual Report: April 2018 to March 2019; NHS Wales (2019), NWSSP Procurement Services Sustainable Procurement Code of Practice; Scottish government (2021), “Sustainable Procurement Tools”, webpage; Welsh government (2021), Wales Procurement Policy Statement.
Local initiatives include London’s 2017 Circular Economy Route Map (LWARB, 2019), which identifies construction, food, textiles, electronics and plastics among its priority sectors. As one example, “Advance London” supports circularity in small and medium-sized enterprises (SMEs) via advisory services. Topics include project finance, product design and communication. One in three participating SMEs had accessed some form of financing within 18 months. They produced a variety of goods and services, including thermal packaging material from surplus feathers, returnable packaging for hot or cold drinks, and a food sharing app (Ellen MacArthur Foundation, 2019a).
Circular Glasgow, was launched in 2017 by the city’s Chamber of Commerce in collaboration with ZWS, the City Council and Circle Economy. Initially funded by the European Regional Development Fund, it focused first on local food and beverage businesses before adding construction, finance, tourism and creative sectors (Ellen MacArthur Foundation, 2019b). A Circle Lab Challenge in 2018 resulted in a reuse and return scheme for cutlery, containers and bottles used at large-scale events; a project to create energy from food waste; and an initiative to integrate circularity principles into business branding and communication (ZWS, 2021b).
Other cities, such as Peterborough in England, have launched circular economy initiatives. ZWS is working with organisations in several parties of Scotland, including the Edinburgh Chamber of Commerce and Highlands and Islands Enterprise (a Scottish economic development agency) for a large rural and maritime area of northern Scotland (ZWS, 2021c). Other local initiatives include the Northern Ireland Resources Network, a pilot that brings together local governments, community associations, charities and social enterprises to promote reuse and repair in Northern Ireland for bicycles, clothing, electronics, food and plastic and support local and national government action (NIRN, 2020).
Governments at different levels are taking greater and often ambitious circular economy initiatives. The United Kingdom has followed the OECD’s 2004 Recommendation on Material Flows and Resource Productivity (C(2004)79) and 2008 Recommendation on Resource Productivity) (C(2008)40) by gathering information and developing indicators on material flows, including on a life-cycle basis, and developing policies and measures at different government levels to improve resource productivity.
As of mid-2021, however, little information was found on policy results in terms of environmental outcomes, such as waste reductions and improved resource productivity. As local and national initiatives develop further, results should be monitored more closely, along with regular evaluations to understand success factors and challenges. Private sector initiatives such as those co-ordinated by WRAP can provide a model. Governments will need to further develop and put in place economy-wide data and indicator frameworks, such as the work by ZWS and the Welsh government, to monitor progress towards resource productivity targets. To meet the UK’s ambitious circular economy and resource productivity goals, governments as well as the private sector, independent organisations and research bodies should increase information exchange on success factors and challenges, as well as strengthen networks.
2.5.3. Addressing material flows and waste in the construction sector
The UK’s construction sector is a major consumer of materials and producer of waste. Government policies and private initiatives have sought to improve resource efficiency, reduce waste and increase recycling in this sector.
One longstanding instrument is the aggregates levy, introduced across the United Kingdom in 2002: this tax on commercially extracted sand, gravel and rock, including imports,5 aimed to reduce quarrying impacts on the environment and increase recycling in construction (UK Government, 2021). The original rate of GBP 1.6/t rose to GBP 2/t in 2009 but has not increased since. One study found that consumption of aggregates per unit of construction output fell about 40% over 2002-10, influenced by both the aggregates levy and the landfill tax on construction and demolition waste (CDW) (Ettlinger, 2017). From 2010 to 2018, however, consumption of aggregates rose 19%, close to the 21% increase in construction sector output (ONS, 2021). In 2021, the National Audit Office concluded the aggregates levy had only a limited effect, while noting “a wider set of regular indicators is needed to assess the levy’s environmental impact” (NAO, 2021). In November 2021, following a review and consultation, the UK government proposed to modify some exemptions to the levy but not increase its rate.
Over the past decade, government policies have set ambitious actions and objectives to increase material productivity in the construction sector, reduce CDW and increase recycling. Northern Ireland’s 2013 Waste Management Plan, for example, calls for increasing use of recycled materials in government construction projects. Scotland’s 2016 circular economy strategy, Making Things Last, and Wales’ 2010 waste strategy, Towards Zero Waste, highlight construction among the sectors that can deliver the greatest resource and waste improvements. SEPA has prepared sectoral plans for housing and the strategic infrastructure transport and utilities sector. Both highlight waste reduction and increasing resource efficiency as goals but without quantitative targets.
Government policies emphasise collaboration with the private sector. England’s 2018 Resources and Waste Strategy calls for collaboration on a roadmap to zero avoidable waste in the sector with the Green Construction Board, which brings together stakeholders. The strategy also cites the 2018 Construction Sector Deal between government and industry that pledges GBP 170 million of government funding for the sector’s development, including increasing efficiency of construction techniques. The ZWS Circular Economy Investment Fund has supported industrial research projects such as Kenoteq, a start-up company that produces bricks made of 90% construction waste (Kenoteq, 2021).
From 2008 to 2015, WRAP co-ordinated a voluntary agreement, “Halving Waste to Landfill”. Over 800 companies signed on, exchanging good practices and monitoring their material flows. WRAP developed tools to help businesses in the sector monitor their process and identify ways to reduce their waste throughout the supply chain. WRAP reported that member companies collectively achieved the headline target of halving their waste to landfill (WRAP, 2021g).
Private sector initiatives include the UK Green Building Council (GBC), which brings together over 600 private enterprises to share guidance and good practice, and promote innovation. In 2021, the government-sponsored Green Construction Board’s Taskforce on Zero Avoidable Waste which produced a Routemap for Zero Avoidable Waste in Construction, as part of the transition to a circular economy (Adams et al., 2021). The routemap defines zero avoidable waste as preventing waste at every stage in a project’s lifecycle and promoting reuse and recycling. It calls for reaching this goal by 2050 and sets out actions to be taken by the construction sector and by government, including better monitoring to track progress.
It is not clear, how well these initiatives have improved trends in materials use and waste management in the sector, as UK-wide indicators show mixed results. The UK consumption of non-metallic minerals, much of which is related to construction, rose 11% from 2010 to 2018 compared to the 21% increase in the sector’s economic output. This suggests a relative decoupling. However, as noted above, growth in the consumption of aggregates (an important component of non-metallic minerals for the construction sector) closely matched the sector’s output. In this period, the volume of construction waste rose 16%, implying a small relative decoupling. The signatories of the WRAP initiative did halve their waste to landfill. However, the UK’s total volume of CDW to landfill increased from 2.1 Mt to 2.5 Mt between 2010 and 2016 (while falling to 1.5 Mt in 2018) (Eurostat, 2021b).
Both government and the private sector have ambitious long-term goals for resource productivity and waste reduction in the construction sector. To achieve these goals, UK governments and private sector bodies will need to step up the pace. Reinforcing economic instruments, for example by raising the rate of the aggregates tax, could support resource productivity goals. Stronger monitoring, highlighted in the GBC Routemap, will be needed to track progress, including both private sector action and further government initiatives. In this regard, the planned waste tracking system and the National Materials Datahub (Section 2.5.2) could play an important role.
Policy ambition, coherence and co-ordination
Continue and strengthen the integration of circular economy policies with industrial and carbon reduction policies.
Consider how promoting greater domestic recycling and reprocessing capacity and increasing industrial symbiosis can support circular economy goals while ensuring greater economic resilience. Strengthen policy goals and initiatives for the repair, reuse and remanufacturing of products while creating local jobs.
Continue development of a UK product design strategy that supports circular economy goals. This could draw on current work in the European Union and other OECD economies for product standards on durability, reuse, repair and recyclability, together with co-ordination with other advanced economies, including via OECD working parties.
Expand resource efficiency goals to incorporate the reduction of the UK's worldwide material footprint.
Strengthen formal and informal mechanisms for co-ordination, peer learning and policy development among environmental authorities of the four UK nations in setting, implementing and evaluating waste management and circular economy policies.
Provide additional funding to support local authorities, catalyse private sector action, and promote innovative waste and circular economy initiatives, including via independent organisations such as WRAP and Zero Waste Scotland.
Policy instruments
Ensure effective implementation of England’s waste management reforms, including the kerbside collection of household food waste and national guidance for separate collection of a core set of recyclable waste streams to reduce co-mingling.
Ensure that local authorities have adequate capacity and resources to put reforms in place and reach minimum recycling rates. Strengthen financing of waste management at local level where needed. Consider the use of pay-as-you-throw mechanisms that can provide incentives for waste reduction, as well as moving to full financing of waste collection and treatment costs via user fees, in line with the polluter pays principle.
Carry out public information campaigns to support successful implementation of the new requirements.
Develop mechanisms to increase resources and capacity for local authorities for the identification and clean-up of contaminated sites to accelerate progress.
Continue and strengthen actions to tackle illegal waste dumping and illegal waste exports, including the introduction of an electronic waste tracking system, and fulfil policy goals to end exports of plastic scrap to non-OECD countries.
Put in place planned reforms to extended producer responsibility schemes to improve the performance of existing systems, extend EPR to new waste streams, and establish co-operation between EPR schemes and local authorities. Consider options to use the new deposit-refund schemes to promote beverage container reuse and consider opportunities for new deposit-return systems for waste streams with hazardous components such as portable batteries.
Consider further use of economic instruments to promote waste management and circular economy goals, in particular introduction of incineration taxes to provide further incentives for recycling and avoid a “lock-in” of incineration capacity, plus an increase in aggregates tax to encourage further resource efficiency and recycling in construction. After monitoring the results of the plastics tax, to be introduced in 2022, consider the feasibility of increasing the minimum recycled content and of introducing taxes to promote recycled content in other products.
Continue and enhance initiatives for private sector action on circular economy, including support for voluntary agreements, innovative research and co-operation with local authorities and civil society.
Use the UK’s innovative work on measures of the carbon footprint of waste streams and waste treatment to identify opportunities to further reduce the direct and indirect carbon emissions of each economic sector. Develop and implement methods to track the results of circular economy initiatives on domestic materials consumption, material footprint and carbon emissions, including in the construction sector.
References
Adams, K. et al. (2021), The Routemap for Zero Avoidable Waste in Construction, Green Construction Board and the Construction Leadership Council, July, www.constructionleadershipcouncil.co.uk/wp-content/uploads/2021/07/ZAW-Interactive-Routemap-FINAL.pdf.
BBC (2019), “Where does recycling and rubbish from the UK go?”, webpage, www.bbc.com/news/science-environment-49827945 (accessed on 21 October 2021).
BPF (2021), “Recycling Roadmap”, British Plastics Federation, webpage, https://bpf.co.uk/roadmap.
CPRE (2020), Recycling our Land: The State of Brownfield 2020 – An Updated Analysis of the Potential of Brownfield Land for New Homes, The countryside charity, London, www.cpre.org.uk/wp-content/uploads/2020/10/Recycling-our-land-the-state-of-brownfield-report-Oct-2020.pdf.
DAERA (2019), Environment Strategy for Northern Ireland: Public Discussion Document, Northern Ireland Department of Agriculture, Environment and Rural Affairs, Belfast, https://consultations.nidirect.gov.uk/daera-neq/esni/supporting_documents/Environment%20Strategy%20for%20Northern%20Ireland%20%20Public%20Discussion%20Document%20%20Full%20Version.pdf.
Defra (2019), 2019/20 National Statistics on Local Authority Collected Waste in England – Methodological Summary, Department for Environment Food, and Rural Affairs, London, https://assets.publishing.service.gov.uk/government/uploads/system/uploads/attachment_data/file/965977/Methodology_summary_201920_accessible.pdf.
Defra (2012), Environmental Protection Act 1990: Part 2A Contaminated Land Statutory Guidance, Department for Environment Food, and Rural Affairs, London, https://assets.publishing.service.gov.uk/government/uploads/system/uploads/attachment_data/file/223705/pb13735cont-land-guidance.pdf.
EC (2018), Generation, treatment and transboundary shipment of hazardous waste and other waste in the Member States of the European Union, 2013-2015; exercise of the power to adopt delegated acts, COM(2018) 762 final, European Commission, Brussels, https://eur-lex.europa.eu/legal-content/EN/TXT/PDF/?uri=CELEX:52018DC0762&from=EN.
Ellen MacArthur Foundation (2019a), “Circular Economy SME Business Support Programme: London”, webpage, www.ellenmacarthurfoundation.org/assets/downloads/London_-Case-Study_Mar19.pdf (accessed on 21 October 2021).
Ellen MacArthur Foundation (2019b), “Glasgow: The business community kickstarting circular cities and regions in Scotland”, Case Study, 19 March, https://emf.thirdlight.com/link/q9z0002nltbf-aihnu3/@/preview/1?o.
Elliot, T. (2016), “Landfill tax in the United Kingdom” commissioned by the Institute for European Environmental Policy, Eunomia.
Eminton, S. (2019), “PRN compliance fee ruled out before 2020”, News, 24 June, www.letsrecycle.com/news/compliance-fee-before-2020/.
Environment Agency (2021a), “Remaining Landfill Capacity”, webpage, https://data.gov.uk/dataset/237825cb-dc10-4c53-8446-1bcd35614c12/remaining-landfill-capacity (accessed on 21 October 2021).
Environment Agency (2021b), “National Packaging Waste Database– Public Reports”, webpage, https://npwd.environment-agency.gov.uk/Public/PublicSummaryData.aspx (accessed on 26 November 2021).
Environment Agency (2021c), “Waste Electrical and Electronic Equipment (WEEE) in the UK”, webpage, www.gov.uk/government/statistical-data-sets/waste-electrical-and-electronic-equipment-weee-in-the-uk (accessed on 21 October 2021).
Environment Agency (2020), “Packaging waste: Apply to be an accredited reprocessor or exporter”, webpage, www.gov.uk/guidance/packaging-waste-apply-to-be-an-accredited-reprocessor-or-exporter (accessed on 21 October 2021).
Environment Agency (2018), “Waste batteries: Producer responsibility”, webpage, www.gov.uk/guidance/waste-batteries-producer-responsibility (accessed on 21 October 2021).
Ettlinger, S. (2017), “Aggregates levy in the United Kingdom”, commissioned by the Institute for European Environmental Policy, Eunomia, https://ieep.eu/uploads/articles/attachments/5337d500-9960-473f-8a90-3c59c5c81917/UK%20Aggregates%20Levy%20final.pdf?v=63680923242.
Eurostat (2021a), “Transboundary shipments of notified waste by partner, hazardousness and waste management operations statistics” (database), https://ec.europa.eu/eurostat/databrowser/view/ENV_WASSHIP/default/table?lang=en (accessed on 9 June 2021).
Eurostat (2021b), “Treatment of waste by waste category, hazardousness and waste management operations” (database), https://ec.europa.eu/eurostat/databrowser/view/ENV_WASTRT/default/table?lang=en (accessed on 16 December 2021).
Greenpeace International (2021), “Investigation finds plastic from the UK and Germany illegally dumped in Turkey”, Press Release, 17 May, www.greenpeace.org/international/press-release/47759/investigation-finds-plastic-from-the-uk-and-germany-illegally-dumped-in-turkey/.
HoCs (2020), Electronic Waste and the Circular Economy – First Report of Session 2019-2021, House of Commons Environmental Audit Committee, London, https://committees.parliament.uk/publications/3675/documents/35777/default/.
HMRC (2021a), “Guidance: Landfill Tax Rates”, webpage, HM Revenue and Customs, www.gov.uk/government/publications/rates-and-allowances-landfill-tax/landfill-tax-rates-from-1-april-2013 (accessed on 17 December 2021).
HMRC (2021b), “Introduction of Plastic Packaging Tax from April 2022”, Policy Paper, HM Revenue and Customs, London, www.gov.uk/government/publications/introduction-of-plastic-packaging-tax-from-april-2022/introduction-of-plastic-packaging-tax-2021.
HM Treasury (2018), “Single-use plastics: Budget 2018 brief”, Policy Paper, HM Treasury, London, www.gov.uk/government/publications/single-use-plastics-budget-2018-brief (accessed on 21 October 2021).
Horizon Proteins (n.d.), A new dawn for Scotland’s circular bioeconomy, website, www.horizonproteins.com/ (accessed on 22 October 2021).
Iacovidou, E. et al. (2020), “Plastic packaging – How do we get to where we want to be?”, Technical Paper , No. 14777, Brunel University London, University of Leeds, Economic and Social Research Council, Department for Environment, Food and Rural Affairs, www.researchgate.net/publication/341670549_Plastic_packaging_-How_do_we_get_to_where_we_want_to_be.
Kenoteq (2021), Kenoteq website, https://kenoteq.com/ (accessed on 16 December 2021).
LWARB (2019), London’s Circular Economy Route Map: Circular London, London Waste and Recycling Board, https://relondon.gov.uk/wp-content/uploads/2021/03/LWARB-Londons-CE-route-map_16.6.17a_singlepages_sml.pdf.
NAO (2021), Environmental Tax Measures, National Audit Office, London, www.nao.org.uk/wp-content/uploads/2021/02/Environmental-Tax-Measures.pdf.
NAO (2018), The Packaging Recycling Obligations, July, National Audit Office, London, www.nao.org.uk/report/the-packaging-recycling-obligations/.
National Archives (2021), The Deposit and Return Scheme for Scotland Regulations 2020, www.legislation.gov.uk/ssi/2020/154/madewww.legislation.gov.uk/ssi/2020/154/made (accessed on 8 December 2021).
NIRN (2020), NIRN Summary Report 2020, Northern Ireland Resources Network, Carrickmore, www.ni-rn.com/annual-reports/.
OECD (forthcoming), Deposit Refund Schemes (DRS) and other Extended Producer Responsibility (EPR) instruments.
OECD (2021), Environmental Performance Reviews: Belgium 2021, OECD Environmental Performance Reviews, OECD Publishing, Paris, https://doi.org/10.1787/738553c5-en.
ONS (2021), “Output in the Construction Industry”, in Business, Industry and Trade (database), www.ons.gov.uk/businessindustryandtrade/constructionindustry/datasets/outputintheconstructionindustry (accessed on 3 December 2021).
Paya Perez, A. and Rodriguez Eugenio, N. (2018), Status of local soil contamination in Europe: Revision of the indicator “Progress in the management contaminated sites in Europe”, Publications Office of the European Union, Luxembourg, https://doi.org/10.2760/093804.
Pegg, L. (2019), “Scotland ‘reluctantly’ pushes landfill ban to 2025”, 20 September, letsrecycle.com, www.letsrecycle.com/news/scotland-reluctantly-pushes-landfill-ban-to-2025/.
Priestley, S. (2016), “Food Waste”, Briefing Paper, No. CBP07552, House of Commons Library, 30 August, https://researchbriefings.files.parliament.uk/documents/CBP-7552/CBP-7552.pdf.
Purdy, R., and Crocker, M. (2021), An Independent Study into Fly-tipping and Unregistered Waste Carriers in England, Material Focus, London, https://eq3pi6tq2z7.exactdn.com/wp-content/uploads/2021/07/An-Independent-Study-into-Fly-tipping-and-Unregistered-Waste-Carriers-in-England-FINAL.pdf.
Sasse, T., et al. (2020), Government outsourcing: When and how to bring public services back into government hands, Institute for Government, London, www.instituteforgovernment.org.uk/sites/default/files/publications/government-outsourcing-public-services-government-hands.pdf.
SEPA (2009), Dealing with land contamination in Scotland: A review of progress 2000-2008, Scottish Environment Protection Agency, www.sepa.org.uk/media/28314/dealing-with-land-contamination-in-scotland.pdf.
Smith, L. (2021), “Plastic waste”, Briefing Paper, No. 08515, House of Commons Library, https://commonslibrary.parliament.uk/research-briefings/cbp-8515/.
Smith, L. and Priestley. S. (2020), “Commons Library analysis of the Environment Bill 2019-20”, Briefing Paper, No. CBP 8824, House of Commons Library, https://commonslibrary.parliament.uk/research-briefings/cbp-8824/.
Smulian M. (2021a), “Councils warning over recovery of costs in Defra’s EPR plans”, mrw, 8 June, www.mrw.co.uk/news/council-fear-on-recovery-of-costs-in-defras-epr-plans-08-06-2021/.
Smulian M. (2021b), “Industry urges Eustice to rethink plans on packaging EPR”, mrw, 2 June, www.mrw.co.uk/news/industry-urges-eustice-to-re-think-plans-on-packaging-epr-02-06-2021/.
Sutherland, N. (2020), “Plastic bags – the single use carrier bag charge”, Research Briefing, No. 7241, House of Commons Library, https://commonslibrary.parliament.uk/research-briefings/cbp-7241/.
UK Government (2021), “Environmental Taxes, Reliefs and Schemes for Businesses”, webpage, www.gov.uk/green-taxes-and-reliefs/aggregates-levy (accessed on 14 December 2021).
Vaughan, A., “Proposed bin tax could help the UK hit net-zero goals”, New Scientist, Vol. 251/3353, 25 September 2021, p. 18, www.sciencedirect.com/science/article/abs/pii/S0262407921016882?via%3Dihub.
WRAP (2021a), “Market Knowledge Portal: Metal“, webpage, https://wrap.org.uk/resources/market-knowledge-portal/metal (accessed on 21 October 2021).
WRAP (2021b), “History of the Courtauld Commitment“, webpage, https://wrap.org.uk/taking-action/food-drink/initiatives/courtauld-commitment/history-courtauld-commitment (accessed on 21 October 2021).
WRAP (2021c), The Hospitality and Food Service Agreement: Taking Action on Waste (final report), Waste and Resources Action Programme, Banbury, Oxen, https://wrap.org.uk/resources/case-study/hospitality-and-food-service-agreement-taking-action-waste-final-report.
WRAP (2021d), “The Courtauld Commitment 2030”, webpage, https://wrap.org.uk/taking-action/food-drink/initiatives/courtauld-commitment (accessed on 21 October 2021).
WRAP (2021e), Sustainable Clothing Action Plan 2020: Commitment 2012-2020 Final Report, Waste and Resources Action Programme, Banbury, Oxen, https://wrap.org.uk/sites/default/files/2021-10/SCAP%202020%20Final%20report_0.pdf
WRAP (2021f), “Textiles 2030“, webpage, https://wrap.org.uk/taking-action/textiles/initiatives/textiles-2030# (accessed on 21 October 2021).
WRAP (2021g), “WRAP's Built Environment Programme“, webpage, https://wrap.org.uk/wraps-built-environment-programme (accessed on 21 October 2021).
WRAP (2020a), Recycling Tracker Report 2020, Waste and Resources Action Programme, Banbury, Oxen, https://wrap.org.uk/resources/report/recycling-tracker-report-2020-behaviours-attitudes-and-awareness-around-recycling.
WRAP (2020b), UK Progress against Courtauld 2025 Targets and UN Sustainable Development Goal 12.3, Waste and Resources Action Programme, Banbury, Oxen, https://wrap.org.uk/sites/default/files/2020-09/UK-progress-against-Courtauld-2025-targets-and-UN-SDG-123.pdf.
WRAP (2020c), Courtauld Commitment 2025: Milestone Progress Report, Waste and Resources Action Programme, Banbury, Oxen, https://wrap.org.uk/sites/default/files/2020-08/Courtauld-Commitment-2025-Milestone-Progress-Report.pdf.
WRAP (2020d), Blazing a Trail on Plastics – The UK Plastics Pact Annual Report 2019/20, Waste and Resources Action Programme, Banbury, Oxen,https://wrap.org.uk/sites/default/files/2020-12/The-UK-Plastics-Pact-Annual-Report-19-20.pdf.
WRAP (2020e), Review of the Waste Prevention Programme for England 2013: Summary Report, Waste and Resources Action Programme, Banbury, Oxen, https://wrap.org.uk/sites/default/files/2021-03/WRAP-review-waste-prevention-programme-england-summary-report.pdf.
WRAP (2019), Houses of Multiple Occupation (HMOs): Barriers to Improving Recycling, Waste and Resources Action Programme, Banbury, Oxen, https://wrap.org.uk/sites/default/files/2020-10/WRAP-RCY132-001-HMOs-Barriers-Improving-Recycling.pdf.
WRAP (2013), The Courtauld Commitment Phase 2: Final Results, Waste and Resources Action Programme, Banbury, Oxen, https://wrap.org.uk/sites/default/files/2021-08/courtauld-commitment-2-final-results.pdf.
ZWS (2021a), “Mattress Extended Producer Responsibility“, webpage, https://zerowastescotland.org.uk/extended-producer-responsibility/mattress (accessed on 21 October 2021).
ZWS (2021b), “Extended Producer Responsibility“, webpage, www.zerowastescotland.org.uk/our-work/extended-producer-responsibility (accessed on 21 October 2021).
ZWS (2021c), “Circular Economy in Cities and Regions“, webpage, www.zerowastescotland.org.uk/circular-economy/cities-and-regions (accessed on 21 October 2021).
Notes
← 1. Material footprint refers to raw materials extracted globally to meet the final demand of the economy, including materials processed abroad for intermediate and final products.
← 2. Based on current prices, non-seasonally adjusted, Great Britain, 2009 to 2019.
← 3. Provisional figures show England’s combined rate fell to 45% in April to June 2020 from 48% for the same period in the previous year.
← 4. The UK government refers to current schemes as “producer responsibility” and to its planned reforms as “extended producer responsibility”. This distinction is not made in the Review, which refers to both current and planned schemes as extended producer responsibility.
← 5. There are exemptions for exports and for aggregates used in agricultural and industrial processes and reductions for activities in Northern Ireland to reduce cross-border trade distortions with the Republic of Ireland.