copy the linklink copied!6. Self-employment and entrepreneurship indicators for immigrants
This chapter presents self-employment indicators for immigrants in the European Union (EU), including self-employment rates and the proportion of self-employed immigrants with employees. Data are presented for immigrants born in another EU Member State and for those born outside of the EU and whenever possible, they are disaggregated by gender. Data are presented for EU Member States and selected Non-EU OECD countries to the extent possible. Averages are also presented for the EU overall.
copy the linklink copied!Key messages
-
The self-employment rate for immigrants in the European Union (EU) in 2018 was slightly below that of those born in the country of residence. Of the 18.5 million people that were born in another country working in the EU, about 13% were self-employed in 2018. This was slightly below the share of self-employed among those born in the reporting country (14.9%).
-
The number of self-employed immigrants increased in the EU from nearly 2.2 million in 2009 to 2.9 million in 2018 (these data exclude Germany because data are not available prior to 2017). This growth was driven by a 47% increase in the number of self-employed immigrant women. Despite the absolute increase in the number of self-employed immigrants, the self-employment rate was essentially constant between 2009 and 2018.
-
There is a substantial gender gap in self-employment for immigrants, which is consistent with the gender gap in the overall population of the self-employed. In the EU, immigrant men were about 1.5 times more likely than immigrant women to be self-employed in 2018 – 17.0% of working immigrant men born in another EU Member State and 16.2% of those born outside of the EU were self-employed relative to 10.3% and 9.4% of immigrant women. This is about the same as the overall gender gap in self-employment (16.9% vs. 9.6%).
-
Self-employment rates of immigrants varied substantially across the EU in 2018. Self-employment rates for immigrants were the highest in the Czech Republic (15.1% for those born in another EU Member State and 34.9% for those born outside of the EU) and the lowest in Norway (6.2% and 6.0%).
-
Overall, immigrant entrepreneurs in the European Union are about as likely to be job creators as non-immigrants. In 2018, 26.2% of the self-employed born outside of the EU had one or more employees, which was the same proportion as non-immigrant self-employed people (26.3%). However, those born in another EU Member State were slightly less likely to have employees (22.9%).
copy the linklink copied!The policy context for entrepreneurship and self-employment by immigrants
There were approximately 58 million immigrants in the European Union (EU) in 2018, two-thirds of which were born in a non-EU country. The number of immigrants has increased by 28% over the last decade (OECD/EU, 2018[1]). This growth has been partly driven by the increase in the number of asylum seekers and refugees after 2013 which has started to taper down in 2017 (OECD, 2019[2]). Immigrants face higher rates of unemployment in all EU Member States than non-immigrants (11.5% vs. 7.5% on average in 2018), and those from outside of the EU are particularly affected. The gap in unemployment between the native-born and immigrants has widened in recent years (OECD/EU, 2018[1]). Moreover, employed immigrants with a tertiary education are also more likely than natives to be overqualified for the job that they hold, and have lower wages on average. As a result, labour market integration is a major policy priority in the EU. With the decreasing inflows of refugees, integration policies are also regaining importance compared to other reception policies for this subset of the immigrant population (OECD, 2019[2]).
copy the linklink copied!Self-employment among immigrants
The share of immigrants is increasing faster among the self-employed than among employees
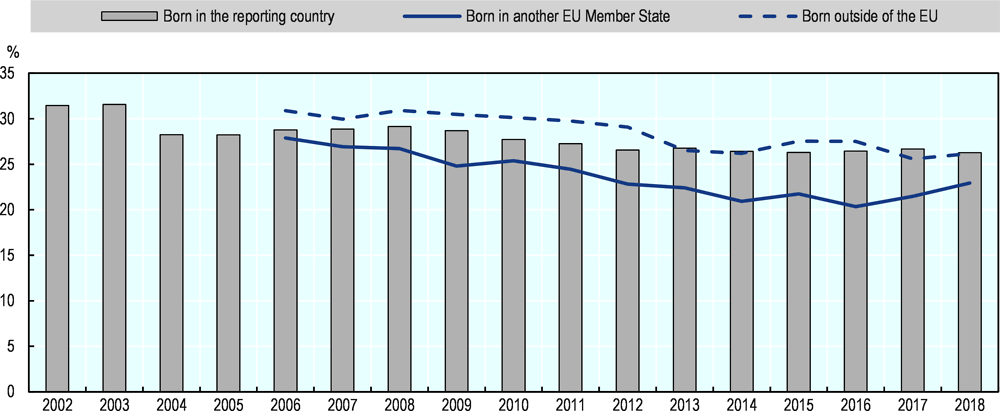
In 2018, there were 30.3 million self-employed people in the EU and approximately 3.6 million of them were born outside of their current country of residence (11.7%). Slightly more than 60% of these self-employed immigrants were born outside of the EU (Figure 6.1). This picture is very similar to that of immigrants who worked as employees; 12.2% of those working as employees in the EU in 2018 were born in another country and 63% of foreign-born employees were born in non-EU countries.
The share of immigrants among the self-employed nearly doubled between 2006 and 2018. In 2006, 6.1% of self-employed people in the EU were immigrants and approximately 65% of these were born outside of the EU. Thus, over this 13-year period, the share of the self-employed who were born in another country increased by about 90%.1 This increase is greater than the increase that was observed among those working as employees over this period (approximately 65%).
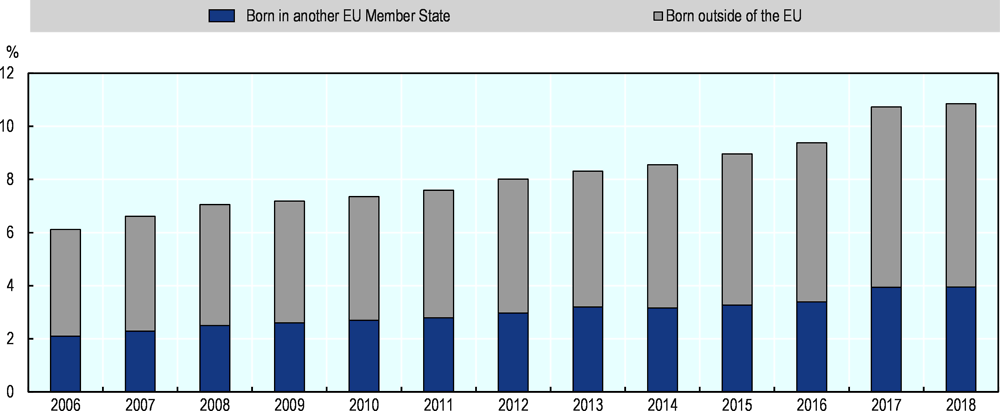
Note: Self-employment data by place of birth were not reported for Germany prior to 2017. Therefore Germany has been excluded from the EU total in 2017 and 2018 to maintain comparability over time.
Source: (Eurostat, 2019[3])
The proportion of self-employed people who were born in another country varied substantially across EU Member States in 2018 (Figure 6.2). However, it is clear that there is a close relationship between the overall share of immigrants in the labour market and the share of self-employed people that were born in another country. Immigrants accounted for the greatest share in Luxembourg in 2018 (59.2%), but this is due to the high share of foreign-born people in the population – about 57% of people working as employees were born in another country. A few countries were exceptions to this trend, notably Greece, Italy, Austria, Ireland, Cyprus and Switzerland where the share of immigrants among the self-employed was relatively low compared to their overall share in the labour market. Conversely, the share of immigrants among the self-employed is greater than the share working as employees in the Czech Republic, Croatia, Denmark, the United Kingdom and Malta.
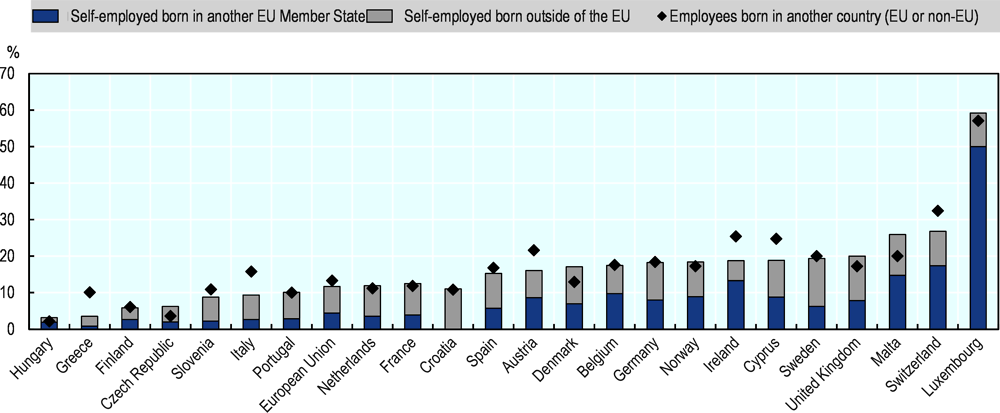
Note: The EU average does not match the data in Figure 6.1 because data for Germany is included in this total. Data for Bulgaria, Estonia, Latvia, Lithuania, Poland, Romania, Slovenia and the Slovak Republic are not reported because the estimates are unreliable due to a small sample size. Similarly, the share of immigrants to Croatia that were born in other EU Member States among the self-employed is not reported due to reliability issues.
Source: (Eurostat, 2019[3])
Immigrants were slightly less likely to be self-employed in 2018 than non-immigrants
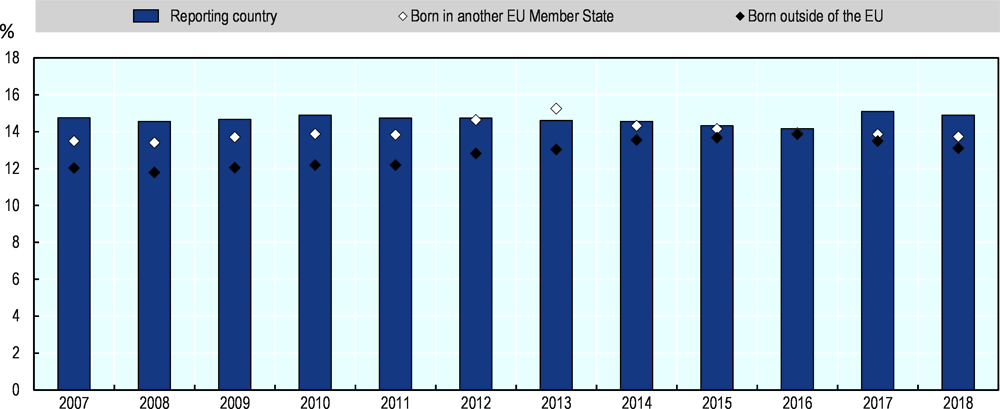
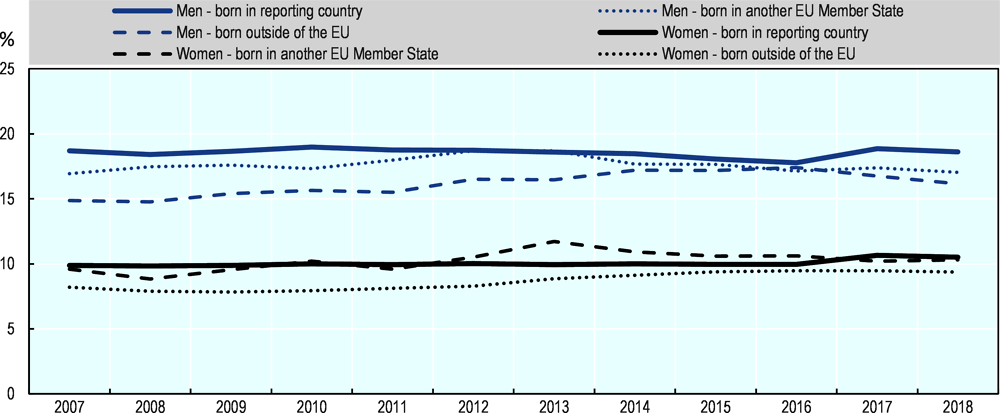
The self-employed accounted for 14.9% of total employment among those born in the reporting country and slightly less for those born in another EU Member State (13.7%) or outside of the EU (13.1%) (Figure 6.3). These rates have been relatively stable since 2007, but a small increase in the self-employment rate for immigrants was observed between 2009 and 2013. This was followed by a slight decline until 2018, which was a period where the overall self-employment rate in the EU declined slightly.
Men who were born in another country are more than 1.5 times as likely to be self-employed than foreign-born women (Figure 6.4). The self-employment rate for immigrant men in 2018 was 17.0% for those born in other EU Member States and 16.2% for those born outside of the EU, compared with 10.3% and 9.4% for women. This gender gap is approximately the same as the overall gender gap, which was 7.3 percentage points in 2018 (see Chapter 2). The number of self-employed immigrant women increased nearly 50% over the past decade but the self-employment rate for immigrant women increased only by about one percentage point because there was a similar increase in employment. The number of self-employed immigrant men increased by about 27% and the self-employment rate was essentially constant.
Note: The data presented in this figure do not include Germany to maintain comparability over time since self-employment data by place of birth were not reported for Germany prior to 2017.
Source: (Eurostat, 2019[3])
Note: The data presented in this figure do not include Germany to maintain comparability over time since self-employment data by place of birth were not reported for Germany prior to 2017.
Source: (Eurostat, 2019[3])
Self-employment rates for immigrants varied greatly across EU Member States between 2009 and 2018 (Figure 6.5). In 2018, self-employment rates for immigrants were highest in the Czech Republic, Malta and the Netherlands. Over the past decade, the greatest increases in the self-employment rate for immigrants occurred in Estonia, France, Greece, Latvia, the Netherlands and Spain.
It is also important to recognise that immigrant entrepreneurs have a range of different profiles. Some are wealthy investors that immigrate on special economic or investor visas and may have businesses in several countries. These self-employed immigrants often operate larger businesses that have greater potential for creating employment. Other immigrant entrepreneurs have a much lower level of resources at their disposal (i.e. human capital, social capital, financial capital). However, even among groups such as refugees, some appear to have the potential to create successful businesses that create employment for others (Box 6.1).
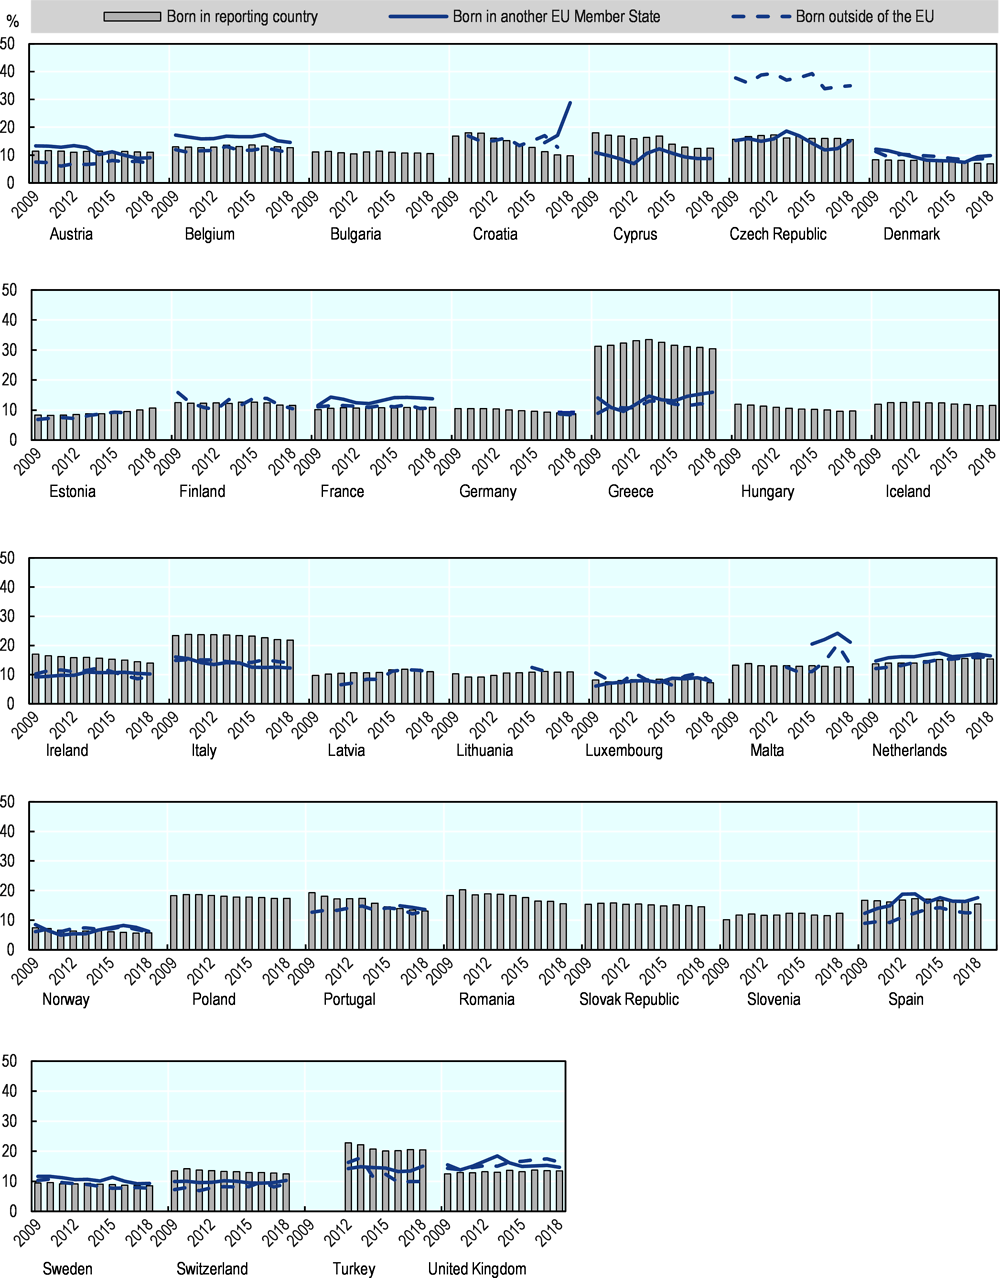
Notes: The estimates reported contain series breaks in some countries: Belgium (break in 2017); Czech Republic (2011), Denmark (2016, 2017), France (2014), Greece (2009), Ireland (2017), Luxembourg (2009, 2015), Portugal (2011), Spain (2009), Switzerland (2010), and Turkey (2014). Estimates of the self-employment rate of immigrants born in other EU Member States are not reported for Bulgaria, Croatia, Estonia, Latvia, Lithuania, Poland, Romania, Slovak Republic, and Slovenia. Furthermore, estimates for Iceland are not reported in 2012 due to reliability issues. Estimates of the self-employment rate of immigrants born outside of the EU are not reported for Bulgaria, Poland, Romania, and the Slovak Republic. Furthermore, estimates for Lithuania are not reported for 2009-14, Luxembourg for 2010 and Iceland for 2012 due to reliability issues.
Source: (Eurostat, 2019[3])
Refugees are a sub-group of immigrants, defined as persons who are in need of protection from outside their country of nationality due to a “well-founded fear of being persecuted for reasons of race, religion, nationality, political opinion or membership of a particular social group” (UNHCR, 2011[4]). Before these individuals’ request for refugee status has been formally processed and approved by the host country, they are referred to as asylum seekers.
The evidence on the proportion of refugees who start a business is mixed, suggesting that the scale of self-employment activities by refugees is context-specific. Key determinants include the culture and country of origin and the institutional and regulatory environment in the host country.
Recent figures from the Australian Bureau of Statistics suggest that around 10% of refugees had started their own business after staying in the country for five years and 30% had done so after ten years of stay (Legrain, 2016[5]). Evidence from Canada shows that refugees are less likely to be self-employed than the native population during their first three years in the country, but the proportion of refugees who are self-employed doubles after five years and exceeds the proportion of the native population (Green, Liu and Ostrovsky, 2016[6]). However, a recent survey of 305 Syrian refugees in Austria, the Netherlands, and the United Kingdom found that although as many as 32% had owned a business in their home country, only a few had started a business in their host country and less than 12% had intentions to become entrepreneurs after their relocation (Deloitte, 2017[7]).
Overall, the existing evidence suggests that many refugee entrepreneurs operate low value-added businesses. Consequently, few are likely to create employment for others. This is confirmed by programme monitoring data in Austria, Australia, Canada, Italy, and the Netherlands (Betts, Omata and Bloom, 2017[8]).
Many refugee entrepreneurs start businesses due to obstacles faced in the labour market. They often imitate others in their community, and operate in markets with low barriers to entry such as retail and wholesale trade or restaurants (Wauters and Lambrecht, 2008[9]; Wauters and Lambrecht, 2006[10]; Lyon, Sepulveda and Syrett, 2007[11]). These markets tend to have excess supply and do not offer substantial growth opportunities. Consequently, the earnings of refugee entrepreneurs are, on average, much lower than other entrepreneurs (Wauters and Lambrecht, 2006[10]).
Nonetheless, refugee entrepreneurs can be well-placed to cater to niche “ethnic” markets but there is a risk that this strategy can also limit earnings since these markets are small (Achidi Ndofor and Priem, 2011[12]). Refugee entrepreneurs with higher human and financial capital are typically more successful in targeting mainstream markets, which are more profitable (Achidi Ndofor and Priem, 2011[12]). Accessing these markets is a key to success for refugee entrepreneurs (Kloosterman, Rusinovic and Yeboah, 2016[13]).
Source: (OECD, 2019[14])
copy the linklink copied!Proportion of self-employed immigrants with employees
Self-employed immigrants in the EU are slightly less likely to have employees
In 2018, 26.2% of self-employed immigrants that were born outside of the EU had employees, which was essentially the same proportion as those self-employed who were born in the reporting country (26.3%) (Figure 6.6). However, a slightly lower proportion of self-employed immigrants that were born in another Member State had employees (22.9%).
As with the self-employment rate, the proportion of the self-employed with employees varied greatly by country between 2009 and 2018 (Figure 6.7). For example, the share self-employed people born outside of the EU with employees in 2018 ranged from 13.7% in the United Kingdom to more than half in Croatia (51.1%), Latvia (51.9%), Estonia (56.1%), Austria (56.5%), and Hungary (72.5%).
The share of self-employed immigrants who are employers declined slightly between 2006 and 2014, but has increased slightly since. Over the past decade the share of self-employed immigrants with employees increased in Austria among both those born in another Member State and those born outside of the EU. The share of employers among self-employed immigrants born in the EU increased in Denmark, Slovenia and Sweden. Among those born outside of the EU, the share of employers among the self-employed increased in Croatia, Cyprus and Poland.
Note: The data presented in this figure do not include Germany to maintain comparability over time since self-employment data by place of birth were not reported for Germany prior to 2017.
Source: (Eurostat, 2019[3])
There is new evidence from Canada that self-employed immigrants can be a substantial source of job creation (Picot and Rollin, 2019[15]). Between 2003 and 2013, immigrant-owned firms had higher levels of job creation because they operated, on average, newer companies. Immigrant entrepreneurs were also found to be more likely to operate high-growth companies than Canadian-born entrepreneurs (Box 6.2).
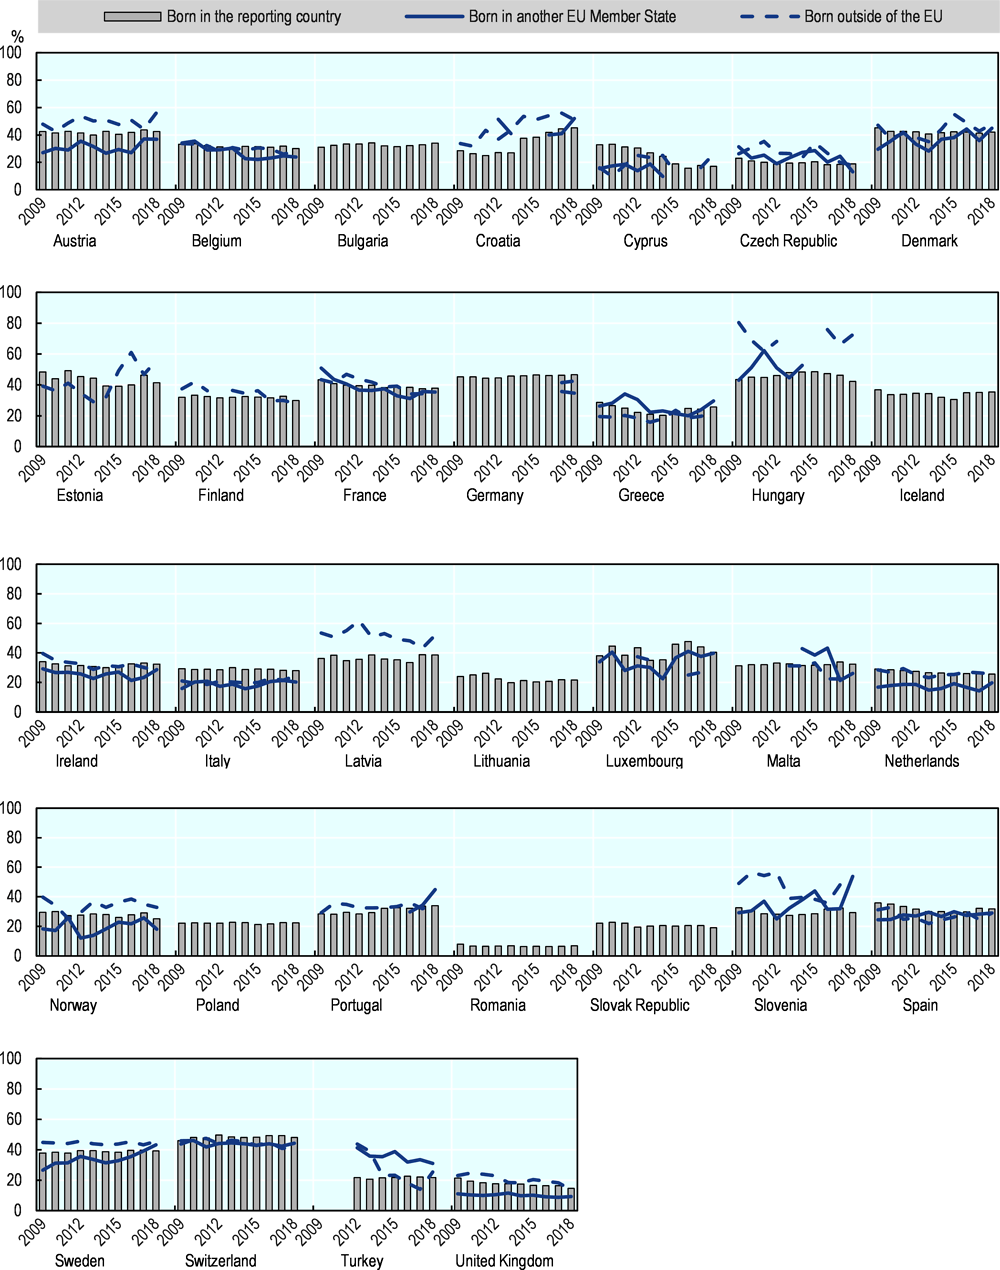
Note: The estimates reported contain series breaks in some countries: Belgium (break in 2017), Czech Republic (2011), Denmark (2016, 2017), France (2014), Greece (2009), Ireland (2017), Luxembourg (2015), Poland, (2010), Portugal (2011), Spain (2009), Switzerland (2010), and Turkey (2014). Estimates of the share of the self-employed with employees that were born in another EU Member States are not reported for the following countries due to reliability issues: Bulgaria, Croatia, Cyprus, Czech Republic (2012, 2016, 2018), Denmark (2009-15), Estonia, Finland, Greece, Hungary (2011), Iceland, Latvia, Lithuania, Malta (2009-14), Norway, (2009-10, 2012-13), Poland, Portugal (2010-13, 2015), Romania, Slovak Republic, Slovenia, Turkey (2009-11). Estimates of the share of the self-employed with employees that were born outside of the EU are not reported for the following countries due to reliability issues: Bulgaria, Estonia (2009-14, 2017-18), Finland, Iceland, Latvia (2010), Lithuania, Luxembourg, Poland, Romania, Slovak Republic, and Slovenia. Data for Germany are not reported for 2009-16 because they were not collected.
Source: (Eurostat, 2019[3])
A recent analysis by Statistics Canada examined job creation by immigrant entrepreneurs (Picot and Rollin, 2019[15]). It is the first study to provide a comprehensive overview of business ownership by immigrants and the employment trends associated with these businesses.
The study had two objectives:
1. Determine whether immigrant-owned private incorporated companies had lower or higher levels of job creation or destruction than firms with Canadian-born owners;
2. Determine whether immigrant-owned firms were more likely to be high-growth or rapidly shrinking firms than those with Canadian-born owners.
Overall, immigrant-owned firms were more likely than firms with Canadian-born owners to be job creators (including entrants, incumbents and exits). On average, immigrant-owned firms accounted for one-quarter of net job creation between 2003 and 2013, while accounting for 17% of the firms. This was primarily because immigrant-owned firms were younger. Among all firms, young firms (i.e. those less than five years old) accounted for 40.5% of gross job creation and only 17.2% of job losses. Among immigrant-owned firms, those under five years old accounted for 62.6% of gross job creation but 32.9% of job losses (Figure 6.8).
To assess the second objective, the study used the OECD definition of high-growth firms when determining the likelihood that immigrant-owned firms were high-growth, i.e. firms with 20% average annualised growth over three consecutive years (OECD, 2017[16]). New entrants were excluded from this sample because of the methodological issues of computing growth rates from zero.
Among firms that were job creators, 27.3% of immigrant-owned firms met the threshold of being a high-growth firm compared with 21.3% of firms with Canadian-born owners. Thus, immigrant-owned firms were 28% more likely to be high-growth firms. Logistic regressions examined potential factors that could determine the likelihood of being a high-growth firm (Table 6.1). Educational attainment of the immigrant business owner made very little difference, as did their immigration class with the exception of refugees being about one percentage point more likely to have a high-growth firm relative to economic and family class immigrants. Country of origin had only a small effect of approximately one percentage point.
The main conclusion of the study is that immigration led to the creation of new, young and dynamic private incorporated firms over the period studied. This positive finding is likely due to the overall success of the immigration system in integrating immigrants into the labour market. Canada admits the largest number of skilled labour migrants in the OECD and has the most carefully designed and longest-standing skilled migration system in the OECD (OECD, 2019[17]).
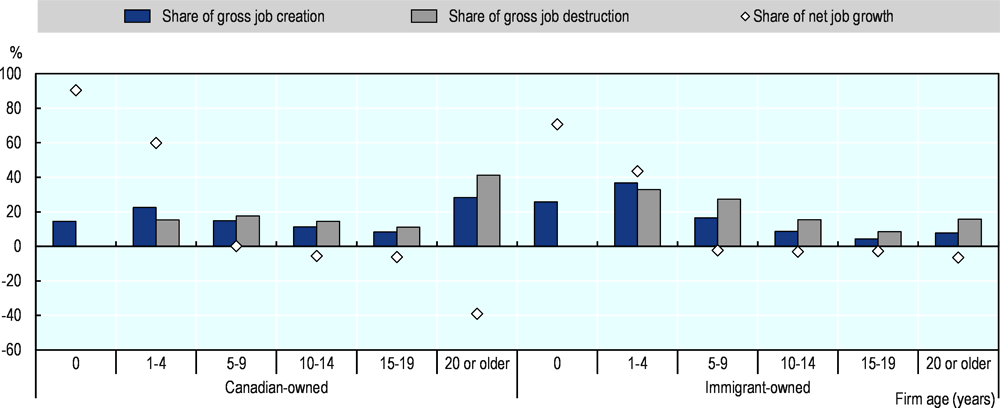
Note: The numbers for gross job creation include firm-year observations with a strictly positive change in employment. The numbers for gross job destruction include firm-year observations with a strictly negative change in employment. The numbers for net job growth consider all firm-year observations, including those with unchanged employment. Percentages may not add up to 100% because of rounding.
Source: (Picot and Rollin, 2019[15])
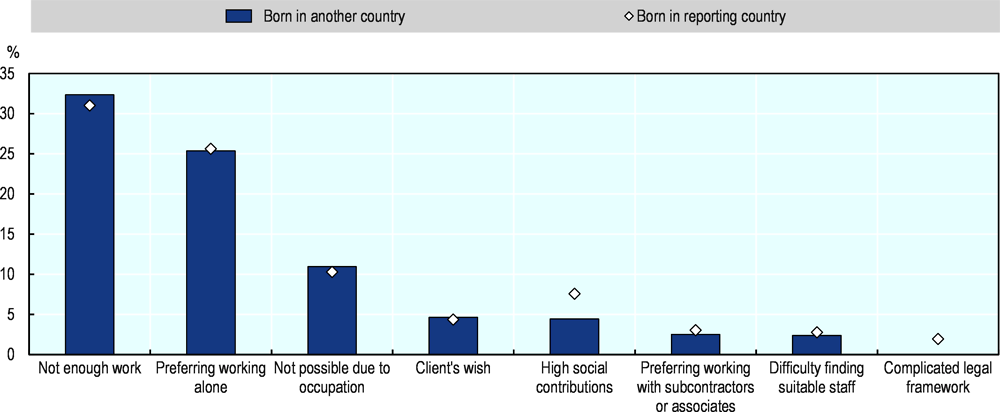
Self-employed immigrants are slightly more likely to not have enough work to hire employees
It is important to recognise that not all self-employed people want to hire employees. In 2017, about one-third of self-employed immigrants in the EU indicated that they did not have enough work to hire employees (Figure 6.9). This reason was reported by 32.4% of self-employed immigrants without employees who were born in another country and by 31.0% of those born in the reporting country. Another important reason for working alone is simply the preference for working alone. This was cited by about one-quarter of the self-employed without employees, regardless of where they were born.
Note: Data for Germany are included in the EU total in this figure.
Source: (Eurostat, 2017[18])
copy the linklink copied!Conclusions
Overall, immigrants are slightly less likely to be self-employed in the EU than those who were born in their country of residence. While many immigrants come from more entrepreneurial cultures, immigrant entrepreneurs often face greater barriers to entrepreneurship than the non-immigrants. These challenges are linked to language barriers, adjusting to a new culture, navigating a new institutional environment, a lack of credit history, legal status and eligibility to work, and small professional networks. These obstacles compound the typical barriers to business creation. Moreover, immigrants often have low levels of awareness of available support (e.g. entrepreneurship training programmes, grant schemes), and report that it is not accessible (e.g. support is not provided in multiple languages) or sufficiently adapted to their needs. However, these barriers vary greatly within the population of immigrants since some have very high levels of human, social and financial capital (e.g. international investors), while others typically have low levels of capital (e.g. refugees).
To be effective, public policy actions must account for the complexity of immigrant’s needs since they go beyond business start-up support. Keys to success for immigrant entrepreneurship support are effective outreach and strong linkages with social and labour market integration policies and programmes for immigrants.
For more information and policy discussion on immigrants’ self-employment and entrepreneurship activities, please refer to (OECD/EU, 2014[19]), (European Commission, 2016[20]) and (OECD, 2010[21]). For more information about entrepreneurship by refugees, please refer to (OECD, 2019[14]). Examples of recent policy actions to support immigrants and refugees in entrepreneurship are contained in the country profiles in Part III of this report, notably the profiles for Germany, Lithuania, Luxembourg and Sweden.
References
[12] Achidi Ndofor, H. and R. Priem (2011), “Immigrant entrepreneurs, the ethnic enclave strategy, and venture performance”, Journal of Management, Vol. 37/3, pp. 790-818.
[8] Betts, A., N. Omata and L. Bloom (2017), “Thrive or Survive? Explaining Variation in Economic Outcomes for Refugees”, Journal on Migration and Human Security, Vol. 5/4, pp. 716-743.
[7] Deloitte (2017), Talent displaced. The economic lives of Syrian refugees in Europe, Deloitte, https://www2.deloitte.com/content/dam/Deloitte/global/Documents/About-Deloitte/talent-displaced-syrian-refugees-europe.pdf.
[20] European Commission (2016), Evaluation and Analysis of Good Practices in Promoting and Supporting Migrant Entrepreneurship Guide book, European Commission, Brussels.
[3] Eurostat (2019), Labour Force Survey, https://ec.europa.eu/eurostat/web/lfs/data/database.
[18] Eurostat (2017), Self-employment, Labour Force Survey ad-hoc module, https://ec.europa.eu/eurostat/web/lfs/data/database.
[6] Green, D., H. Liu and Y. Ostrovsky (2016), “Business Ownership and Employment in Immigrant-owned Firms in Canada”, Analytical Studies Branch Research Papers Series, No. 375, Statistics Canada.
[13] Kloosterman, R., K. Rusinovic and D. Yeboah (2016), “Super-diverse migrants—similar trajectories? Ghanaian entrepreneurship in the Netherlands seen from a Mixed Embeddedness perspective”, Journal of Ethnic and Migration Studies, Vol. 42/6, pp. 913-932.
[5] Legrain, P. (2016), Refugees Work: A humanitarian investment that yields economic dividends, Open Political Economy network, http:///www.opennetwork.net/wp-content/uploads/2016/05/Tent-Open-Refugees-Work_V13.pdf.
[11] Lyon, F., L. Sepulveda and S. Syrett (2007), “Enterprising refugees: contributions and challenges in deprived urban areas”, Local Economy, Vol. 22/4, pp. 362-375.
[2] OECD (2019), International Migration Outlook 2019, OECD Publishing, Paris, https://dx.doi.org/10.1787/c3e35eec-en.
[14] OECD (2019), “Policy brief on refugee entrepreneurship”, OECD SME and Entrepreneurship Papers, No. 14, OECD Publishing, Paris, https://dx.doi.org/10.1787/70571d6f-en.
[17] OECD (2019), Recruiting Immigrant Workers: Canada 2019, Recruiting Immigrant Workers, OECD Publishing, Paris, https://dx.doi.org/10.1787/4abab00d-en.
[16] OECD (2017), Entrepreneurship at a Glance 2017, OECD Publishing, Paris, https://dx.doi.org/10.1787/entrepreneur_aag-2017-en.
[21] OECD (2010), Open for Business: Migrant Entrepreneurship in OECD Countries, OECD Publishing, Paris, https://dx.doi.org/10.1787/9789264095830-en.
[1] OECD/EU (2018), Settling In 2018: Indicators of Immigrant Integration, OECD Publishing, Paris/European Union, Brussels, https://dx.doi.org/10.1787/9789264307216-en.
[19] OECD/EU (2014), The Missing Entrepreneurs 2014: Policies for Inclusive Entrepreneurship in Europe, OECD Publishing, Paris, https://dx.doi.org/10.1787/9789264213593-en.
[15] Picot, G. and A. Rollin (2019), “Immigrant Entrepreneurs as Job Creators: The Case of Canadian Private Incorporated Companies”, Analytical Studies Branch Research Paper Series, No. 423, Statisitics Canada, Ottawa, https://www150.statcan.gc.ca/n1/en/pub/11f0019m/11f0019m2019011-eng.pdf?st=g5OILrhR.
[4] UNHCR (2011), UNHCR Resettlement Handbook, United Nations High Commissioner for Refugees, Geneva.
[9] Wauters, B. and J. Lambrecht (2008), “Barriers to refugee entrepreneurship in Belgium: Towards an explanatory model”, Journal of Ethnic and Migration Studies, Vol. 34/6, pp. 895-915.
[10] Wauters, B. and J. Lambrecht (2006), “Refugee entrepreneurship in Belgium: Potential and practice”, The International Entrepreneurship and Management Journal, Vol. 2/4, pp. 509-525.
Note
← 1. This growth rate was computed by excluding Germany from the EU total in 2018 because data by place of birth for Germany were not reported before 2017.
Metadata, Legal and Rights
https://doi.org/10.1787/3ed84801-en
© OECD/European Union 2019
The use of this work, whether digital or print, is governed by the Terms and Conditions to be found at http://www.oecd.org/termsandconditions.