1. Addressing labour-market disruptions from trade and automation
The US labour market has been exposed to repeated disruptions in the past two decades, and a wave of change stemming from the rise of automation is looming large. Although unemployment is at an historical low, many displaced workers remain inactive and wages have been stagnant for occupation affected by these disruptions. The upcoming automation of tasks with robots, artificial intelligence and machine learning will bring many benefits, but it will also lead to employment losses and wage pressures for workers whose tasks will be automated. While the US labour market had traditionally the capacity to absorb these shocks, labour market fluidity has slowed in the past two decades, hindering the reallocation of labour and contributing to high unemployment and weak participation, with some locations particularly affected by these social troubles. Lessons from these past trends are helpful to formulate future policies helping improving opportunities for displaced workers.
OECD labour markets normally experience considerable dynamism. On average each year, one-fifth of jobs are created and/or destroyed and one third of workers are hired or separate from employers (DELSA/ELSA/WP5(2018)2). This is part of the normal reallocation of resources to their most productive uses in response to shocks. It also allows workers to improve their incomes by moving to new higher-paying jobs.
Despite this dynamism of creating new jobs, workers who have become unemployed have often struggled to find employment quickly and can experience a significant earnings loss. While the substantial globalisation shock during the 2000s has largely run its course, the prospect of greater automation and novel applications of artificial intelligence to a wider array of jobs - including in services - create a need to strengthen policies that can mitigate the negative consequences for affected workers.
The potential for further automation and artificial intelligence applications has given rise to dystopian outlooks with technological unemployment arising as workers lose their jobs. For example, some authors estimate that up to one half of jobs in the United States may be vulnerable to computing innovations (Frey and Osborne, 2017[1]). However, the outcomes are likely to be more nuanced due to various complementarities between workers and machines and the consequence of rising productivity making widespread redundancy unlikely (Nedelkoska and Quintini, 2018[2]). What seems more likely is that the nature and type of job will change.
Against this background, continuing technological innovation - with further automation and the impact of artificial intelligence on the horizon - is not necessarily grounds for pessimism about labour market opportunities. But there will be disruption requiring workers to move in reaction to technological change and acquire different skills. The experience of the U.S. economy during the global trade shock suggests that some workers experienced greater difficulties in making the transition and were left behind even though on aggregate the labour market was resilient and has created significant numbers of new jobs. This chapter discusses issues that may help mitigate similar difficulties in adapting to future shocks.
Labour market impacts of technological change and globalisation
Technological change brings benefits through the introduction of new and better products, increased variety and gains from higher productivity raising living standards. With the spread of information communication technologies in recent decades, labour markets have been profoundly affected. Particular types of jobs - often routine ones - are increasingly performed by machines and workers have needed to acquire new skills. For other workers however, the introduction of new technologies has complemented their existing skills and made them more productive.
Trade remains essential for underpinning productivity and economic well-being. Gains from trade accrue from the ability to allocate resources to the sectors and locations where they can be most efficient. In particular, global trade integration has facilitated the efficient production of intermediate goods thanks to the organisation of fragmented supply chains. More open economies tend to grow faster and participation in global value chains is associated with better knowledge diffusion and stronger productivity growth. In the United States, more than 40% of imports are intermediate goods. These inputs can be essential to global value chains and ensuring the competitiveness of exports (OECD, 2017[3]). The structure of the economy is affected by trade, notably the demand for different types of skills, which imply a reallocation of workers across sectors.
Discerning the relative impacts from technological change and trade on labour markets is hard due to their inter-relation. The deeper integration of labour and product markets that has marked globalisation has accompanied and facilitated the introduction of new technology. Empirical work tends to suggest that technological change has had bigger measurable impacts than international trade (Goos, Manning and Salomons, 2014[3]). The impact of technology shocks on the wage premium, labour shares, job polarisation and deindustrialisation have been found in a range of studies (e.g., Schwellnus et al, 2018). That is not to deny the impact of trade, particularly for a local labour market where the employment and earning impacts can be substantial and persistent.
Technological change and globalisation
Technological progress and globalisation are having impacts on OECD labour markets through de-industrialisation of employment and polarisation of jobs (OECD, 2017[5]). Technology complements "non-routine" cognitive tasks and substitutes for the routine cognitive tasks, while having little effect on manual labour (Autor, Katz and Kearney, 2006[6]). In part, the dynamic is driven by technologies being able to perform tasks that are easy to codify - the routine cognitive tasks.
The impacts of technological change, along with changes in demand, have contributed to a shift in employment from manufacturing towards services in OECD economies. Real manufacturing output has continued to increase, driven by significant productivity gains, but its share in value added and total employment has fallen (Figure 1.1). There is some variation across countries in the extent of the decline. Notably, Germany has managed to buck the relative fall in output experienced elsewhere, but even there the employment share has still fallen.
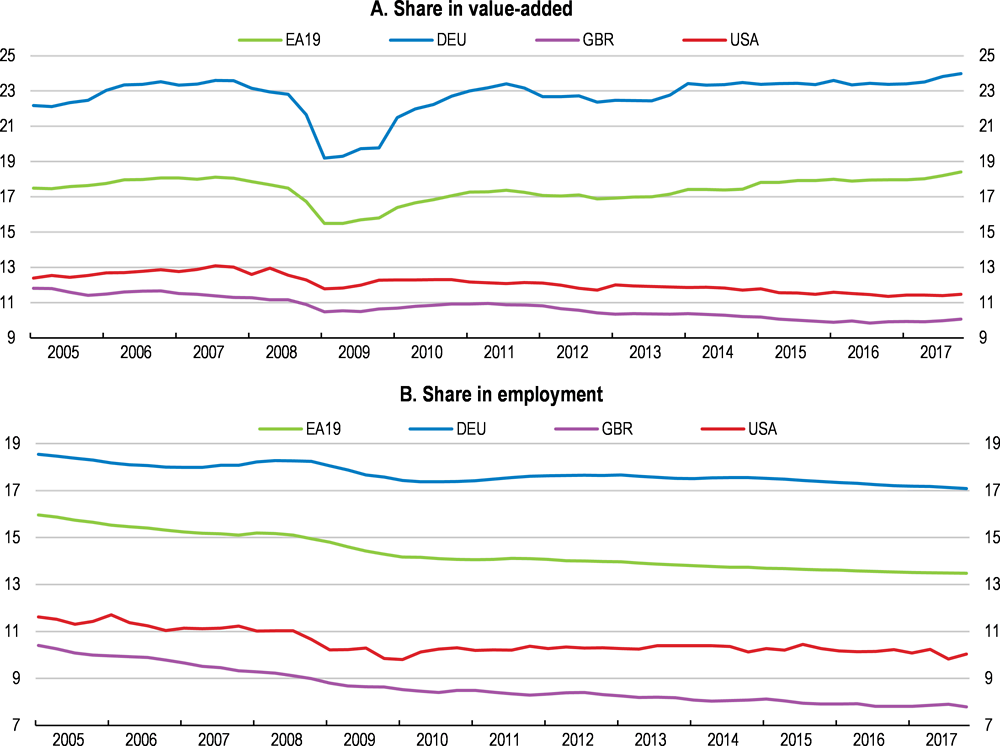
Source: OECD National Accounts Statistics, OECD Main Economic Indicators (MEI) database, and Thomson Reuters.
The share of employment in the middle of the skill distribution has declined since the early 1980s across most of the OECD (OECD, 2017[5]). On average across the OECD, the share of workers in low-skilled and high-skilled occupations rose by 2.5 and 4.3 percentage points respectively between 1995 and 2015. In North America, the polarisation has seen high-skilled jobs largely absorb the losses experienced in the middle of the distribution.
While polarisation holds overall, within particular sectors the picture can be slightly different. For example, in the United States, the share of university graduates has been rising in manufacturing and the share of workers with at most high school attainment shrinking. This is largely a result of production in this sector shifting away from physical work in the production process, which is increasingly automated. Empirical work by Acemoglu and Restrepo (2017[7]) suggests that an additional robot can reduce employment in a local labour market by around six workers. Despite the shift in employment towards higher skilled workers, wages in the manufacturing sector have been declining relative to the economy-wide average since the early 1980s (Figure 1.2).
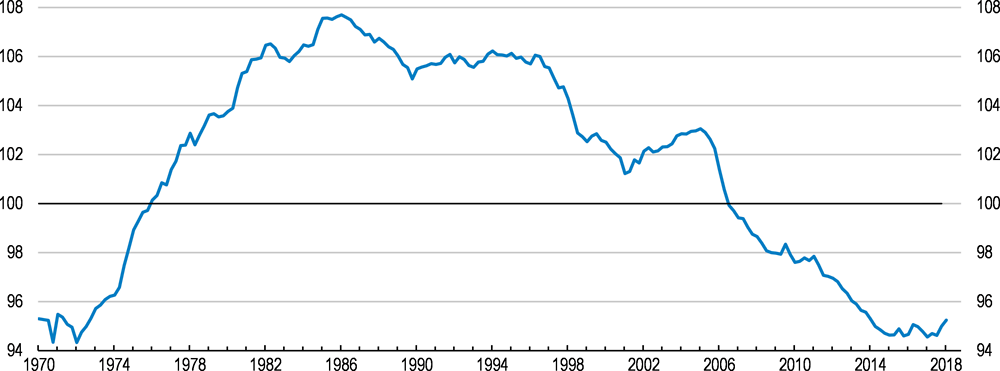
Source: OECD Main Economic Indicators (MEI) database.
The second major influence on the labour market in OECD economies has been the rise of emerging economies as major players in international trade flows. China's successful development strategy and accession to the WTO created a significant shock to other economies. Increasing trade openness adversely affected employment in competing sectors in other counties. Standard trade theory predicts that the less-abundant factor of production is harmed by openness to international trade, which in most OECD countries concerns lower-skilled employment.
Recent evidence has emerged suggesting that globalisation through import competition had direct and persistent negative employment effects in some parts of the United States, whereas increasing exports have boosted employment elsewhere. Some evidence points to the globalisation shock mainly having its effect by inducing plant closure, rather than downscaling (Asquith et al., 2017[8]). Acemoglu et al., (2016) estimate that around 16% of manufacturing job losses between 1991 and 2011 (almost 1 million out of around 6 million) can be attributed to China's rising importance in international trade. Knock-on effects from the initial shock to manufacturing though upstream and downstream linkages had an adverse employment effect of a similar magnitude. In total, this globalisation shock accounts for almost 2 million job losses. To put this into perspective, aggregate payroll employment rose by around 30 million over the same period.
Globalisation has not been all bad news for workers. A complementary approach to the globalisation shock has looked at the consequences of increasing the size of the export market. The United States remains a key partner country in global trade and increased opportunities for its exporters support new job creation. Empirical estimates based on impacts in local labour markets suggest that the number of new jobs created (2.2 million between 1991 and 2011) offset a similar number of jobs lost due to the globalisation shock (Feenstra, Ma and Xu, 2017[9]). Since 2005, trade in value added statistics suggest that employment embedded in export activities outstripped employment embodied in domestic demand by some margin (Figure 1.3).
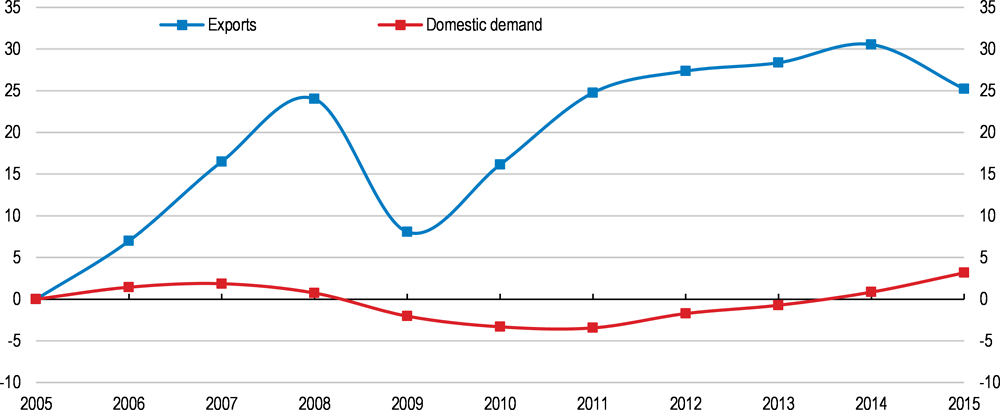
Source: OECD Inter-Country Input-Output (ICIO) tables.
While jobs were created, local labour market developments suggest employment adjustment has been weak in the most adversely affected areas (Autor, Dorn and Hanson, 2016[10]). Workers displaced from employment in commuting zones most exposed to the China trade shock have found re-employment relatively slowly with knock-on effects on other segments of the local labour market. The spatial correlation between export-related job gains and import job losses declined over time (Feenstra, Ma and Xu, 2017[9]), suggesting it become harder for displaced workers to find new employment opportunities. The adjustment frictions to reallocation have played a role in creating localised pockets of unemployment and ultimately, when persistent, to heightened inequality.
In the past, pockets of unemployment dissipated relatively quickly with inter-State migration being an important adjustment mechanism to asymmetric regional shocks. However more recent empirical evidence suggests that workers in industries exposed to import competition suffered significant losses in earning capacity subsequently in comparison with similar workers in other industries (Autor et al., 2014[11]). Losing firm-specific skills account for some of the earnings declining, but churning between employment and in some cases movement onto disability rolls also play a role, especially for those with weaker labour force attachment. Higher-skilled workers tend to move out of manufacturing and subsequent earnings losses are smaller. On the other hand, low-income workers appear to suffer more frequent job losses, greater subsequent earning losses, and more cycling between precarious manufacturing employment and spells out of unemployment.
Possible shocks in the future
The globalisation shock appears to have largely run its course and future impacts on labour markets are likely to be more modest than experienced during the rapid integration of China into international trade and global value chains. On the other hand, technological change is likely to continue impacting labour markets. While technological change is difficult to predict, possible shocks on the horizon are related to automation.
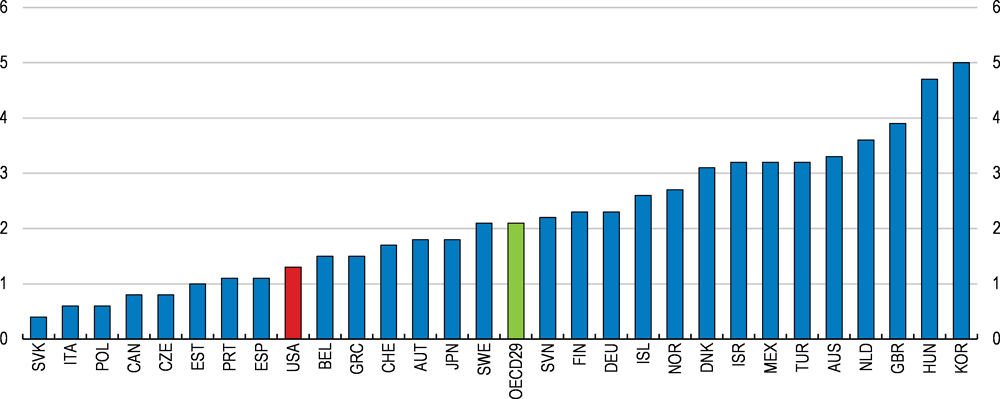
One way to assess the future dangers of technological change to various jobs is to consider their task content and the proportion of jobs that are potentially automatable. By this metric, the share of jobs most at risk from automation account for around about one-tenth for the United States and very close to the OECD average (Figure 1.4). The threat of automation is most keenly felt by workers with the least education, whose job tasks are often the most repetitive. Another 25% of jobs have a substantial share of tasks that are potentially automatable, implying that the nature of these jobs may change dramatically. Nonetheless, job losses for this group will be smaller than the more exposed jobs. Even though the number of jobs threatened is potentially limited, the effects on particular industries are likely to be dramatic. Road transport is one example where technologies making automation feasible are on the cusp of widespread adoption, although current concerns are about truck driver shortages (Box 1.2).
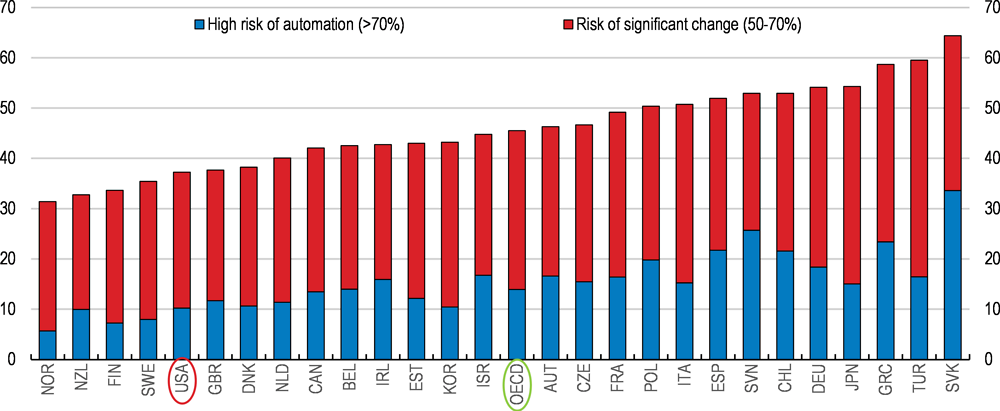
Note: Jobs are at high risk of automation if the likelihood of their job being automated is at least 70%. Jobs at risk of significant change are those with the likelihood of their job being automated estimated at between 50 and 70%.
Source: OECD calculations based on the Survey of Adult Skills (PIAAC) 2012, 2015; Nedelkoska and Quintini (2018).
Automated inter-urban trucking is approaching feasible implementation once remaining technological and regulatory issues are resolved (ITF, 2017). Driving within urban areas is more complex and as a result automated transport is further from implementation. The expected operational savings for inter-urban transport are estimated to be substantial, reducing costs by around 30%. Such savings will grant tremendous cost advantages to early movers and is thus likely to see the industry rapidly converting to driverless trucks.
In the European Union and the United States, drivers of heavy trucks (mainly middle-aged men) account for 1½-1¾ per cent of total employment. To some extent, automation's effects on employment will be mitigated because future driver numbers are already projected to fall short of expected demand. Furthermore, automation will alter the nature of the job, such as creating new remotely-located drivers, who would take control of trucks when on-board systems encounter difficulties. Nonetheless, in some disruptive scenarios - when new technology is rolled out rapidly - job losses could account for around one half of potential drivers in Europe. On the other hand, if automation is introduced gradually, allowing for potential drivers to be dissuaded from a driving career choice, job losses could be relatively small. In this context, issuing permits for introducing driverless vehicles would offer one approach to controlling the pace of adoption if the negative externalities on drivers were judged to be excessive. These externalities will need to be balanced with wider societal benefits of automated trucking, stemming from fewer crashes reducing loss of life and injury, and environmental benefits from lower emissions.
Automation affects employment directly though worker displacement, when the introduction of a robot or machine replaces a human performing a specific task. On the other hand the introduction of automation can have positive consequences by boosting demand for labour (Acemoglu and Retrepo, 2018[12]). For example, improving productivity of existing automated tasks will feed through to increasing demand for non-automated tasks. In addition, as with past technological innovations the nature of work changes, including through the creation of new jobs. Even within a sector that is automating, task reorganisation could enhance complementarities between machines and tasks that are less easy to automate, increasing the complexity of the human task. Some jobs may become more attractive to a wider range of people. As such the overall effect on employment depends on the direct and more subtle indirect effects of automation on the labour market.
The rapid pace of technological change displacing workers from automatable tasks has given rise to calls to slow or halt the process. This has given rise to calls to remove regulatory and tax biases that give incentives to replace workers by machines, or even to tax robots (Box 1.3).
Concerns about how robots can displace workers and lead to heightened inequality have given rise to calls to slow the pace of technological progress. In addition to the direct effect on employment, others have worried about the ability of the government to raise revenue and the scope it can give for tax avoidance (Abbott and Bogenschneider, 2018[13]). For example, Bill Gates has raised concern about taxation shortfalls when robots replace workers. The South Korean government has recently reacted by removing tax incentives for businesses investing in automation.
Examining these issues in a simplified model (Daubanes and Yanni, 2018) shed some light on mechanisms and possible outcomes. Standard economic models would argue against taxing an intermediate input, such as a robot, and use the tax and transfer system to address inequality. In a model with "routine" workers, who are at risk of being replaced by robots, and "non-routine" workers, who are not (Guerreiro, Rebelo and Teles, 2017[14]), a fall in the price of robots will raise tax revenue (Figure 1.5). As such, concerns about tax erosion appear misplaced. A further consequence of the results of this stylised model economy is that the threat of job loss can be mitigated by improving the skills of workers so that robots are complements rather than substitutes for workers. In this context, efforts to boost the skills of workers can help ensure everyone is better off from the rise of robots.
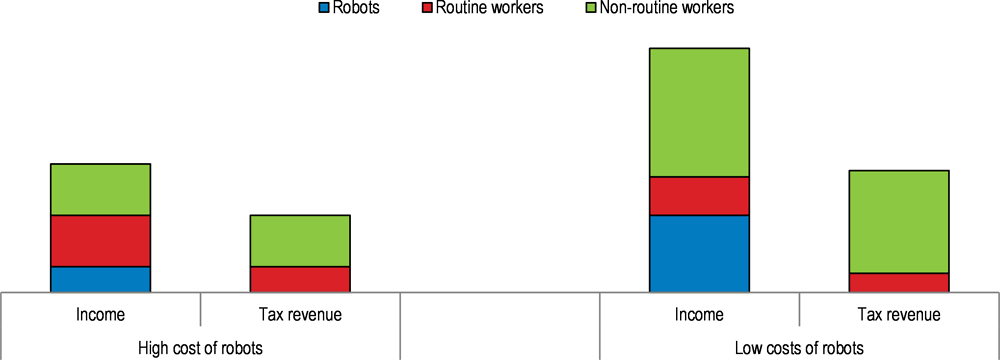
Source: Daubanes and Yanni, 2018.
Helping workers into employment
Economic growth is a primary engine of job creation. Indeed, during the current upswing in employment payroll growth has averaged almost 200,000 per month. But not everyone and not all locations have seen their prospects improve during the general recovery. A number of structural impediments appear to be at play. Even before the crisis, employment prospects and participation in the labour force differed noticeably across groups and the country.
Examining transition rates from unemployment to employment using data from the Current Population Survey reveals a few differences across the population. Males have had less success in making the transition from unemployment to employment, whereas following the recession, married women have been more successful in finding employment. Age and education have expected relationships, with older individuals experiencing greater difficulties in finding employment, while persons with higher levels of education attainment are more likely to move back into employment. The duration of unemployment has a statistically significant relationship with the likelihood of moving into employment, highlighting the importance of helping the unemployed back into employment quickly.
At the bottom end of the wage distribution in employment, jobs tend to become more precarious, including more temporary work. This is linked to lower earnings and higher job strain and can reduce opportunities for on-the-job training and learning. Workers in this type of employment are also the most likely to experience job losses in a downturn. Declining traditional employment in manufacturing appears to affect low-skilled men particularly badly. While the labour force participation of those with the lowest level of education attainment is lower than other groups it has increased somewhat, whereas other groups appear to have followed a secular decline in participation (Figure 2.6).
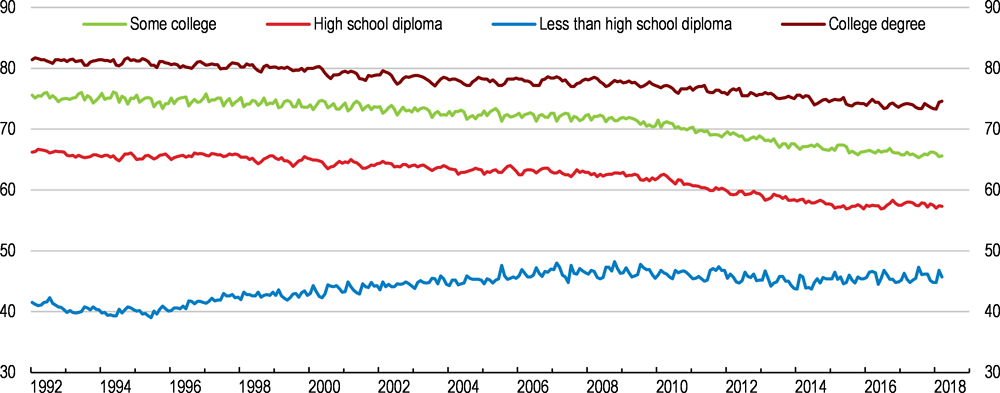
Source: Bureau of Labor Statistics.
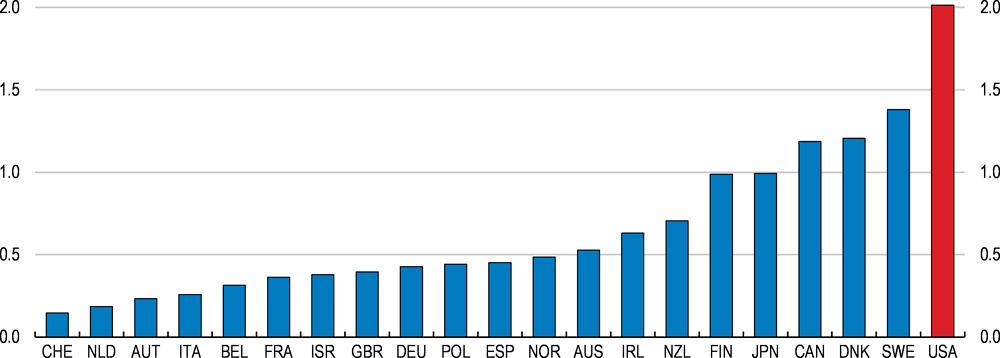
One of the lessons many OECD countries have learnt is that early interventions can be important in preventing job displacement leading to persistent employment or income loss. Income losses in the United States are relatively large in comparison with other OECD countries. Early interventions include acting before workers become unemployed as job-to-job transitions can be easier to facilitate. In this context, public employment services may create a temporary office in a firm where mass lay-offs have been announced. Some of the initial contact with the workers is to document their skills and assessing how they match local and national employment opportunities and to provide counselling about opportunities and possible needs for reskilling.
A final way countries have tried to preserve employment is using short-term working schemes. When well designed, such schemes can preserve viable jobs without imposing large efficiency costs as shown by the experience of Germany and Japan during the global financial crisis. The evidence from Finland on the other hand suggests that when schemes are poorly targeted jobs are subsidised for the duration of the scheme but then end with the finish of the programme (DELSA/ELSA/WP5(2018)2).
In the United States, the policy environment for job displacement relies largely on unemployment insurance and a set of smaller specific programmes, many of which are provided by the States. Income loss associated with losing employment is relatively large (Figure 1.7). The operation of unemployment insurance has a counter-cyclical aspect in that the duration of unemployment benefits is typically extended when the labour market is performing poorly. On the other hand, the job search requirement targets full-time employment. As this can lead to extended breaks when employment opportunities are limited, this has led to calls for the requirement to be relaxed to allow part-time work or self-employment (Alden and Taylor-Kale, 2018[17]).
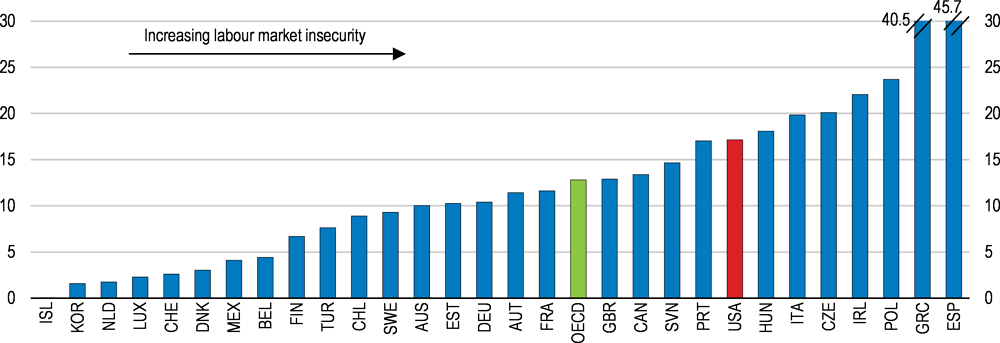
Note: 2012 for Australia, Korea, Mexico, the Netherlands, Turkey and the United States. 2011 for Chile. "Labour market insecurity” consists of unemployment risk and unemployment insurance. “Unemployment risk” is defined as the proportion of time that a worker is expected to spend on average in unemployment and calculated by the monthly probability of becoming unemployed multiplied by the average expected duration of unemployment spells in months. “Unemployment insurance” is measured by the coverage of the unemployment insurance and replacement rates of public transfers received by the unemployed.
Source: OECD (2017), "Job quality", OECD Employment and Labour Market Statistics (database).
The main federal government programme to address worker dislocation specifically is the Trade Adjustment Assistance programme. Workers who are certified as being displaced are eligible for training, job-search assistance, salary subsidy for older workers and modest relocation support. Delays in determining whether job losses are eligible for support have undermined the programme's effectiveness. This programme is narrowly defined to address the specific challenges faced by those losing their jobs as a consequence of international trade and will play a limited role in addressing dislocations arising from technological change.
Finally, the Workforce Innovation and Opportunity Act of 2014 introduced reforms to assisting job seekers by better matching them to growing sectors. The initiative aimed to build regional partnerships, between employers, education and training providers and public stakeholders in providing training and job placement in high-demand sectors. Overall, the United States spends relatively little on active labour market programmes that target getting persons into employment whether through helping with job search and placement or through providing training (Figure 1.8).
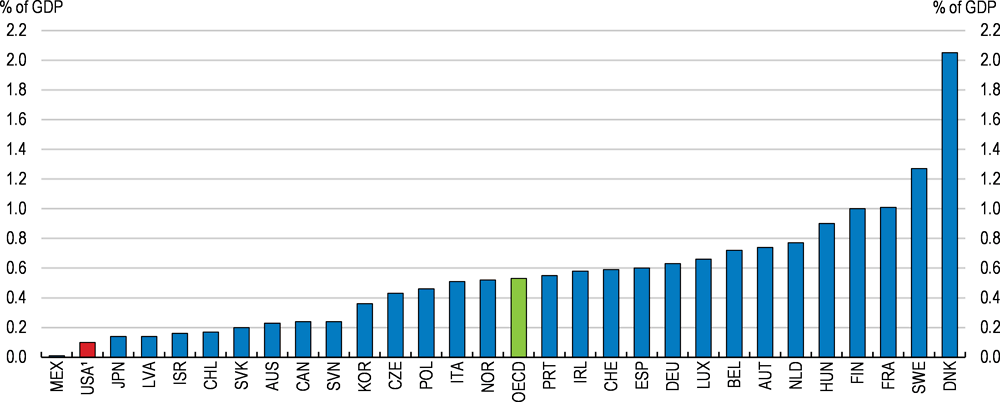
1. Includes Temporary Assistance for Needy Families (TANF) work-related activities. Other TANF expenditure (0.20% of GDP) is not included.
Source: OECD Labour Market Programme Database.
Differential impacts across the country
The combined consequences of technological change and globalisation on local labour markets have led to job losses and growing divergences between large metropolitan areas and smaller ones and non-metropolitan areas. Job growth has become more concentrated than in the past as many smaller cities have struggled in the wake of the decline of manufacturing employment. Larger cities, on the other hand, appear to be more resilient and have attracted more high-skilled workers, widening the disparities between large urban areas and the rest of the country. In part, the different experiences of workers in urban and more rural settings appear to be linked to agglomeration benefits. Thicker labour markets in urban areas allow workers to find new jobs more easily. On the other hand, finding employers in less dense areas may mean specific skills fall into disuse when other suitable matches are few (Bleakley and Lin, 2012[14]).
These dynamics have been compounded by the impact of the financial crisis. The aftermath of the crisis saw large increases in unemployment rates across the United States. In comparison with previous expansions, subsequent job creation has been more concentrated in the larger urban areas (Brainard, 2017[15]). Furthermore, labour force participation is stronger in the larger metropolitan areas as well. After 2015, further disparities have emerged between large metropolitan areas, where unemployment rates have continued to decline, and other parts of the country. These dynamics create special problems for crafting appropriate policy responses as quite different labour market conditions can coexist across relatively short distances.
There are sizeable differences across the United States in labour force participation rates (Figure 1.9). At the State level in December 2017, the participation rate ranged from just 53% in West Virginia to over 71% in North Dakota. Similar differences hold for unemployment, ranging from just 1.7% in Hawaii to 7.3% in Alaska. At the metropolitan area level the rates vary from 1.5% in Ames, Iowa to almost 18% in El Centro in California (where the State-wide rate is close to the national average at 4.2%).
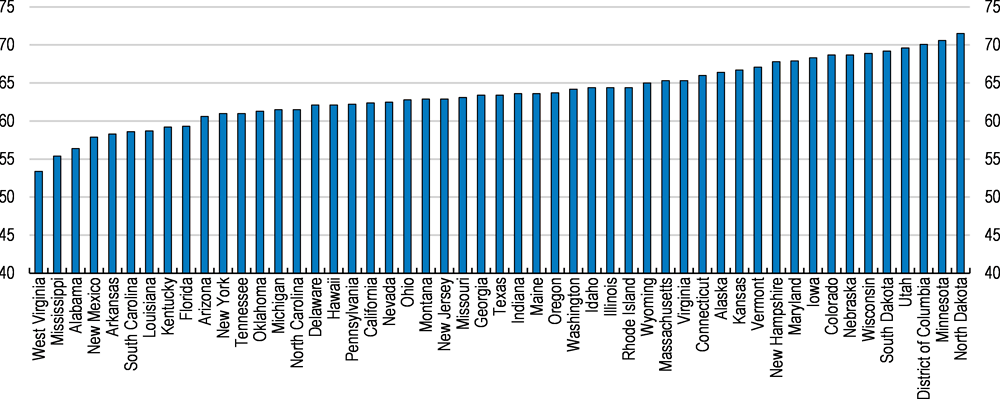
Source: BLS.
The decline in labour force participation rates outside metropolitan areas was marked after 2007 and whilst recovering remained over three percentage points lower at the end of 2017. By contrast participation rates in metropolitan areas were only around one percentage point lower than before the crisis and there is a correlation with local labour market participation and the measured productivity of cities (both in the United States and across other OECD cities) (Figure 1.10). Differences in productivity across regions and cities are sizeable in the United States. Partly as a result of declining participation outside larger metropolitan areas, some local labour markets are becoming tighter, despite employment growth remaining relatively sluggish. Thus while wage acceleration has been quiescent during the recovery, more recently these development have begun to push up wages and to narrow the wage premia enjoyed by urban workers (Weingarden, 2017[16]). However, large numbers of individuals remain on the fringes of the labour market.
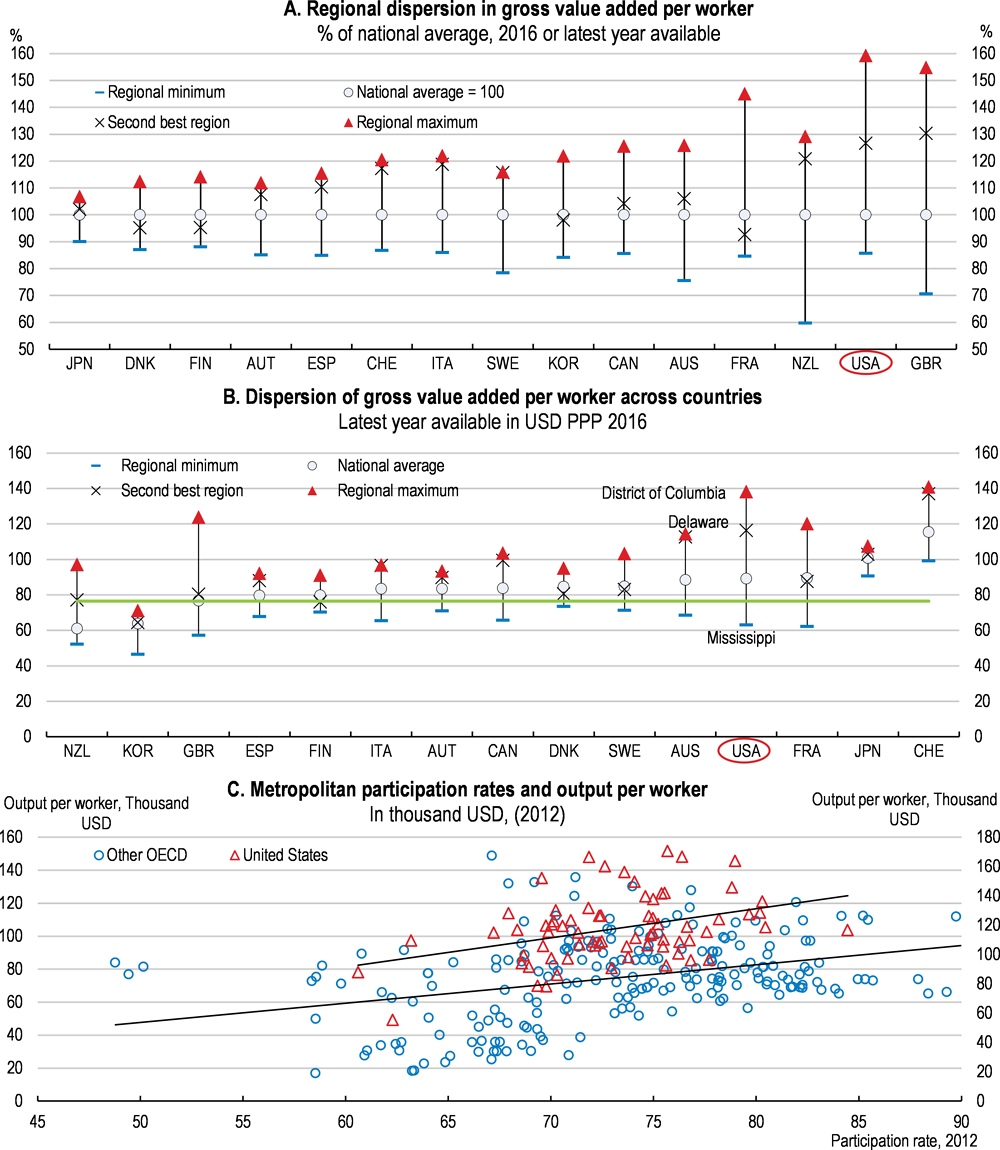
Note: Panels A and B: Data refer to 2016 for USA, CAN, FRA; 2015 for AUS, SWE, DNK, AUT, ITA, FIN, ESP, GBR, KOR; 2014 for NZL, 2013 for CHE, and 2012 for JPN.
Source: OECD Regional and Metropolitan areas databases.
One approach to assessing local economic conditions on the basis of several labour market indicators suggests that 52 million Americans live in distressed communities (Economic Innovation Group, 2017[17]). These are areas where the number of jobs and businesses has continued to fall during the national recovery from the crisis. Unemployment duration tends to be longer when there are concurrent job losses or when they are more localised, with smaller metropolitan and non-metropolitan areas being more vulnerable. These areas also have low participation rates and also a large share of the population has only limited educational attainment. Most of these communities are in the South or Midwest.
Regions with stronger productivity growth across the OECD tend to be better integrated into global value chains, particularly in tradeable services. Integrating urban areas, which attract more knowledge-intensive firms, into global value chains presents opportunities to boost productivity. Promoting interactions between manufacturing and services and building up forward and backward linkages boosts productivity within the sector. Furthermore increasing the accessibility of urban centres can have positive spillovers to surrounding areas, boosting economic growth (Ahrend and Schumann, 2014[18]). A case in point is Chattanooga, a mid-sized city that is growing rapidly. The area is developing on the back of successfully attracting foreign direct investment coupled with the installation of ultra-fast broadband infrastructure. This in turn has induced the development of a tech sector in the city, which further helps in propelling local economic growth (CFR, 2018[13]).
The 2017 tax reform introduced tax credits for regional development. The tax benefits aim to encourage long-term investment in Opportunity Zones, which are low-income urban and rural communities. Other approaches to addressing the particular location specific problems facing communities includes tailoring federal support (Austin, Glaeser and Summers, 2018[19]). For example, in the spirit of unemployment insurance, earned income tax credits could be boosted in particularly distressed areas for a limited period of time with the aim of maintaining labour market attachment. The implementation of such a scheme by the Federal government poses considerable administrative difficulties for the Internal Revenue Service, which may be difficult to overcome. As such State-level initiatives may be preferable.
Improving access to fixed broadband, particularly in rural areas, is a potentially important means of helping distressed areas (OECD, 2018b). Rolling out modern technology that can better integrate localities into wider economic networks and expand the job finding and education opportunities for rural residents. Better broadband coverage can also provide access to healthcare and education in the most remote locations. The Federal Communications Commission (FCC) has allocated $2 billion in 2018 to use in competitive bidding auctions to expand access to nearly 1 million homes, which should minimise the risk of the infrastructure investment having little impact. Municipal networks have also been created in some cities, often using existing infrastructure to cut costs. These initiatives have been supported by the FCC, which is also identifying unreasonable regulatory barriers to broadband deployment. The Administration has also acted with the Rural Broadband Executive Order to support deployment.
Improving job accessibility
Cities in the United States often suffer from poor integration that hinders productivity gains that can arise by making better matches. Poor co-ordination of spatial planning and service delivery across administrative boundaries can contribute to this outcome. Making cities more accessible, both for residents within the city and the surrounding commuting zones offers a way to increase the chances for displaced workers and others to find employment. Particularly in sprawling cities, access to jobs by public transport is often very limited. For example, in Atlanta just 3% of jobs accessible by car within one hour are accessible by public transport within the same time. This can be a considerable barrier to low-income groups of potential workers. In San Diego county, the workforce development agency considers transport availability and expense as a major barrier for the young in accessing employment and training (Guichard, 2018). Large house price disparities can lead to trade-offs emerging between housing and access to jobs. In this regard, better provision of mass transit where appropriate is one possible solution, though in the longer run better integration of spatial and transport planning is desirable to improve the functioning of urban and surrounding labour markets.
A second way to enhance urban mobility is to address spatial segregation that blights some cities and may contribute to persistent inequality (Fogli and Guerrieri, 2017[20]). Even in very prosperous cities, pockets of the population can struggle (Glaeser, Resseger and Tobio, 2009[21]). For example, in Minneapolis the unemployment rate gap between the black and white populations is amongst the highest in the country despite the local labour market being very tight. In some cases, such problems can reflect information asymmetries and actions such as promoting local populations with limited labour force attachment to surrounding employers can help raise employment possibilities. In other cases, addressing spatial segregation may require action to improve opportunity by strengthening non-cognitive skills and raising educational attainment of the population as well as to improve access to important public services.
Inter-State migration in response to shocks
One finding of recent studies looking at technological and trade change is that local labour market shocks appear to be quite persistent. In part this is related to vulnerable regions being repeatedly buffeted by adverse shocks. There is an inter-State migration response with people leaving areas with high unemployment rates, particularly higher-skilled workers, but this outflow of workers is not in large enough numbers to return local labour markets to equilibrium quickly enough to prevent persistent unemployment and workers dropping out of the labour force altogether.
Migration has played an important role in reaction to economic shocks in the past. For example, Blanchard and Katz (1992[22]) found that States experiencing negative shocks tended to adjust by workers leaving the State in response to rising unemployment rates, rather than falling wages. However, migration rates have been slowing since the early 1980s and in particular around the early 2000s until the financial crisis. The slowdown affects migration between States, between counties in the same State and even within counties in the same State (Figure 1.11). Household mobility is now at an all-time low, with the mover rate 11% of the population in 2017.
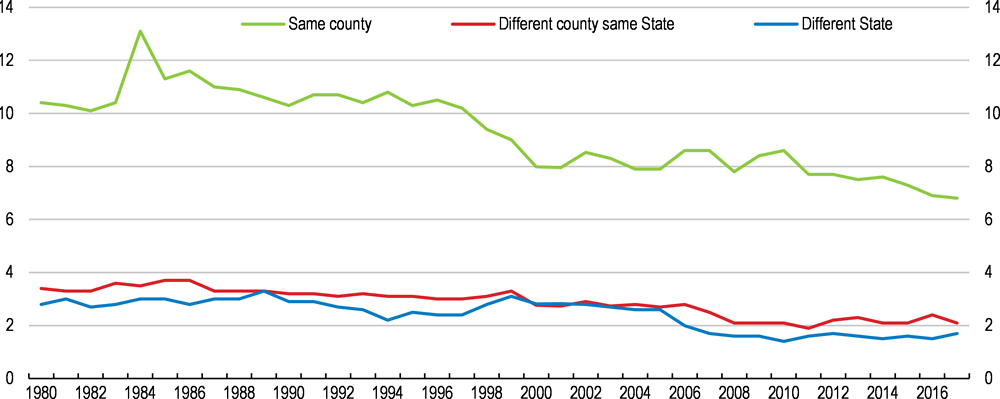
Source: Census Bureau.
The factors underlying declining U.S. migration trends are not well understood. Past strong inter-regional migration flows have declined, partly due to ageing as older people typically move residence less frequently. Declining willingness of workers to undertake job transitions is another factor inhibiting this adjustment mechanism (Molloy, Smith and Wozniak, 2014[23]). This underlines the importance of boosting business dynamism and reducing barriers to job transitions as complements to efforts to boost employment.
Other factors are at play in slowing moving rates. As more households have two main earners than in the past, migration becomes more complicated in ensuring matches. This affected migration choices of younger people (who are more likely to migrate than more established families). Young couples are more likely to move to larger cities, which offer greater employment opportunities. As a consequence, the structure of American urban areas has been changing with younger college-educated individuals concentrating in large urban centres since the early 2000s. Over the same period the suburbanisation of cities continues with other groups moving to the peripheries. Part of this is due to the presence of amenities, as measured by the concentration of non-tradeable services in larger cities (Couture and Handbury, 2017[24]). One consequence of this dynamic is increasing spatial segregation.
Besides these factors, migration may also have fallen as smaller differences in local labour markets across the United States provide weaker push and pull incentives. For example, the variation of State unemployment rates fell dramatically in the lead up to the great recession, but spiked up sharply and remained pronounced for several years (Figure 1.12). The secular decline in migration did abate around the time of the crisis but low migration rates arguably hindered adjustment to heterogeneous spatial employment shocks.
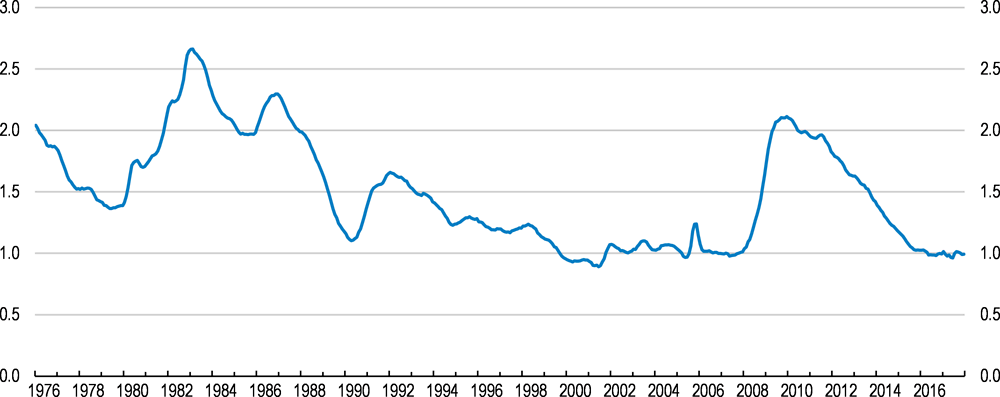
Source: Bureau of Labor Statistics
While inter-State migration patterns tend to be less responsive to labour market conditions in the United States, in other OECD countries migration appears to be increasingly responsive. Some evidence suggests that migration patterns in the European Union are becoming more reactive to local labour market conditions than in the United States (Jauer et al., 2014[25]). Mover rates remain higher in the United States - at around 11% of the population - than those in the European Union, where annual mover rates affects around 6% and are within the same country. Although gross flows appear larger, net migration flows are relatively small (Figure 1.13). Elsewhere in the OECD, underlying migration patterns tend to be from rural and intermediate regions to urban agglomerations, particularly from rural regions with poor accessibility to cities. A similar pattern is less obvious for the United States (OECD, 2016[26]). In part, this may reflect muted income differentials between households in metropolitan and non-metropolitan areas when compared with other OECD economies (Boulant, Brezzi and Veneri, 2016[27]). But it may also reflect housing market frictions can make finding affordable housing a challenge, particularly in booming cities. In addition, occupational licensing can increase the costs of moving. These are addressed in the next sections.
Note: The territorial units are the TL3 units used for international comparison. The data for the United States are based on aggregates of counties that are smaller than States.
Source: OECD (2015), OECD Regional Statistics database.
Housing market frictions
Changes in the housing market have contributed to lower labour market fluidity, but also to the functioning of the housing market creating barriers to migration (Ganong and Shoag, 2016[28]). As a result, workers and families hit by adverse shocks from technological change or globalisation arguably face greater difficulties in moving to areas where employment opportunities are better.
The barriers to mobility do not appear to be related to rising homeownership, which does not appear to have made a material difference on labour market flows. Empirical evidence points to negative equity leading to lock in and higher homeownership rates being associated with higher unemployment, but these findings are either economically small or contested in other studies (Goodman and Mayer, 2018[29]). Interestingly, homeownership is not a barrier to inter-metropolitan moves, though the moves tend to be in pairs of cities with co-varying home prices (Sinai and Souleles, 2013[30]). As such, migration between declining areas and more prosperous metropolitan areas is likely damped, and contribute to the low net-migration rates. In any case, the recent decline in household mobility appears to be related to lower mover rates for renters. In 2017, just over one-fifth of renters moved whereas in the late 1980s almost one third of renters moved accommodation. Difficulties in finding suitable accommodation in more prosperous cities may be related to this dynamic.
In comparison with other OECD countries, housing is expensive for low-income households in the United States (Figure 1.14). Housing cost burdens are large for private renters and low income private house owners with a mortgage. Furthermore, rental housing affordability has deteriorated. Social housing accounts for only a small fraction of the housing stock (4.5%). In comparison with many other OECD countries, the amounts spent on social housing are modest. The main Federal programme is administered by Housing and Urban Development using vouchers, which are distributed by lottery, that cover part of the cost. However, these are undersupplied given demand. Cities can support social housing by requiring new developments include affordable housing units (or by levying a fine when affordable housing units are not included in the development).
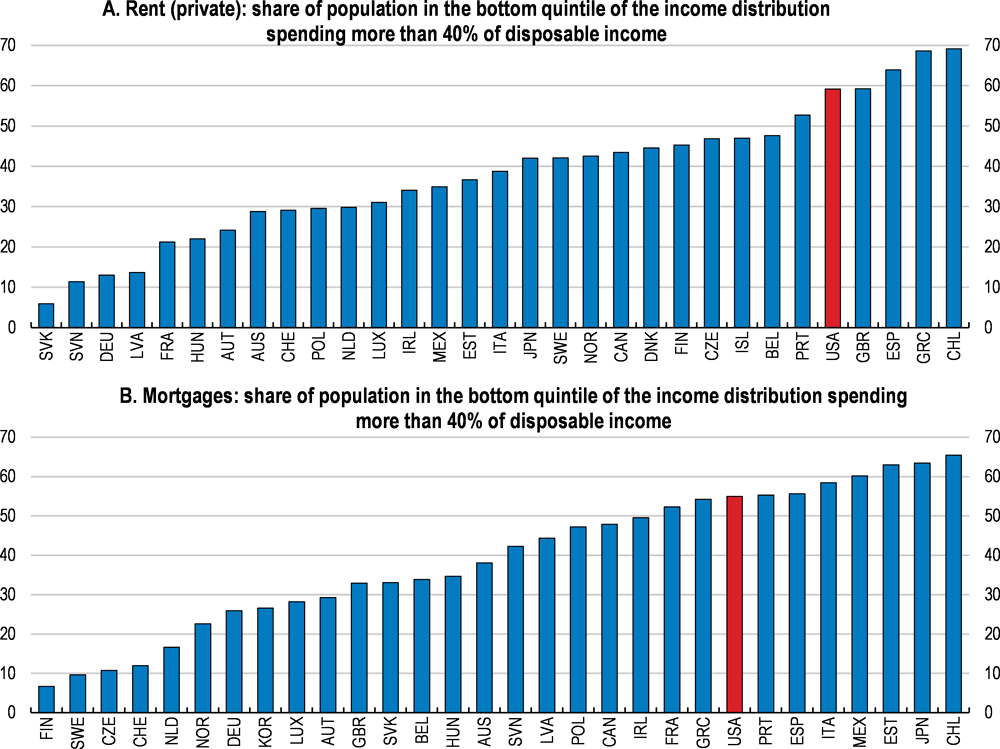
Source: OECD Housing Affordability Database.
Part of the different dynamics in house prices across the country relates to housing supply. The housing supply response in the United States has been amongst the strongest in the OECD. Over the past few decades the higher elasticity of housing supply in the South has enabled the relative shift of the population to more temperate locations (the Sun Belt) from the Frost Belt in the North East and Midwest.
However, it appears that the supply elasticity has been more muted following the crisis (Box 1.4). Whereas the supply response helped move the housing market back to equilibrium in the pre-crisis period, since the crisis the supply response has been muted, but the price response has continued to move to equilibrium, putting upward pressure on housing prices. Coastal areas where the economy is booming, such as San Francisco and Seattle, have limited topological scope to expand horizontally. This is compounded by zoning regulations that hinder the densification of cities.
In comparison with other OECD countries the price responsiveness of new housing supply in the United States is one of the strongest (Caldera Sanchez and Johansson, 2011[33]). The long-run price elasticity of around 2 was strong (Figure 1.15).
Source: (Caldera Sanchez and Johansson, 2011[33]).
Over time however the price responsiveness to supply appears to have weakened, but the link to prices of income demand remains. Re-estimating the equations yields similar elasticities for a sample from 1970 to 2015. Splitting the sample in half suggests that supply was more responsive in the first half but not the second, when the coefficient was statistically insignificant and economically less powerful. These estimates need to be taken with caution since the second half of the sample included the global financial crisis and developments in local housing markets across the United States exhibit very different dynamics.
One source of housing market friction arises from local regulation. Furman (2015) and Gyourko and Molloy (2014[31]) note that land use regulation adversely impacts economic activity. Estimates of how land use regulation hinder productivity in major cities suggests that it may reduce GDP by up to 2 percentage points in some calculation (Glaeser and Gyourko, 2018[32])and rising to as much as 9 percentage points in others (Hsieh and Moretti, 2015[33]). There is only limited information on the nature of regulation with the Wharton Land Regulation Index providing a detailed snapshot for 2007. The index reveals that minimum lot sizes are common and that "development fee extraction programs" are also very common. The approval process can vary markedly across localities from around 3 months to 10 months and that more groups are involved in project approval in the more regulated areas.
Housing regulation can help correct externalities, which may reflect different local preferences. Such preferences appear markedly different between California and Texas, for example, but are generally not enough to justify the large differences between prices and construction costs. Additional factors contributing to house price differentials across cities include amenity values, with certain cities being far more attractive to live in due to for example higher cultural and environmental quality. In some cases, the tightness of some local zoning requirements reflects house owners' desire to protect house prices to the detriment of potential movers to these areas.
Restrictive land use regulation raising housing prices may undermine cities in the longer run. Limiting housing supply can reduce population density and thus potential agglomeration effects (complementarities between population density and productivity). Existing property owners, typically older people, enjoy wealth gains from higher housing prices, but at the cost of making housing less affordable for younger adults and people wanting to relocate to the cities where employment probabilities are higher.
Other OECD countries do not experience the same degree of local-level land-use regulation, mainly because land-use authority resides at a higher level of government, which mitigates co-ordination problems. Nonetheless, many OECD countries confront similar challenges. Restrictive land use regulations have limited sufficient new housing construction and hindered densification, particularly in low density areas close to city centres and along mass transit routes. Densification in these areas is typically needed to keep housing affordable for low- and middle-income households.
Options to make land-use regulation more flexible include moving from single use zoning to zoning based on the nuisance externalities. In this context, local preferences can be respected in core planning objectives while at the same time allowing mixed-use developments. Spatial planning for housing should not occur in isolation and take into account transport, network utilities and other land uses. These are important to encourage city form that allows greater accessibility, reduces congestion and local air pollution, as well as mitigating climate change. These considerations call for metropolitan bodies that can co-ordinate policies across the metropolitan area (and foster links outside) and avoid potential undersupply or supply in inappropriate areas (Ahrend et al., 2014[34]).
A related feature of metropolitan governance fragmentation contributing to housing undersupply can occur with business and sales taxation. In cases where local governments within a metropolitan area retain this tax base, an undersupply of housing can occur as localities chase revenue sources. An exception is the Minneapolis metropolitan area which pools sales tax revenues and then redistributes on a per capita basis (Metcalf, 2018[35]).
Licensing barriers to employment and migration
Occupational licensing is used to ensure public health and safety amongst other policy objectives. As such there are good reasons, particularly in the medical sector and in occupations such as civil engineering. This is reflected in the coverage of licensing of the workforce. Licensing is most common in education and health services and is also widespread in government, particularly for local government where teaching is likely an important employer (Figure 1.16). However, there is also licensing which is harder to justify on public policy grounds and rather appears to have morphed from its original purpose to protect local rents (Kleiner and Vorotnikov, 2017[36]). Ultimately, from the perspective of workers in regions being hit by negative technological or globalisation shocks, the spread of occupational licensing creates additional frictions. As households have increasingly multiple breadwinners the growth of occupational licensing affects a growing share of households. In this context, the costs of moving to make a better employment match is made more complex if other members of the household need to acquire new licences to continue their employment. This is also likely to contribute to problems of mismatch if workers are constrained to search in local labour markets.
The impact of occupational licensing on income appears to be most pronounced for workers with relatively low educational attainment. Wages are approximately one-fifth higher for workers that did not finish high school who also hold a certification or an occupational licence. There is essentially no wage difference for workers who completed college and hold an occupational licence. Licensed workers tend to earn higher wages in transportation, construction and legal services.
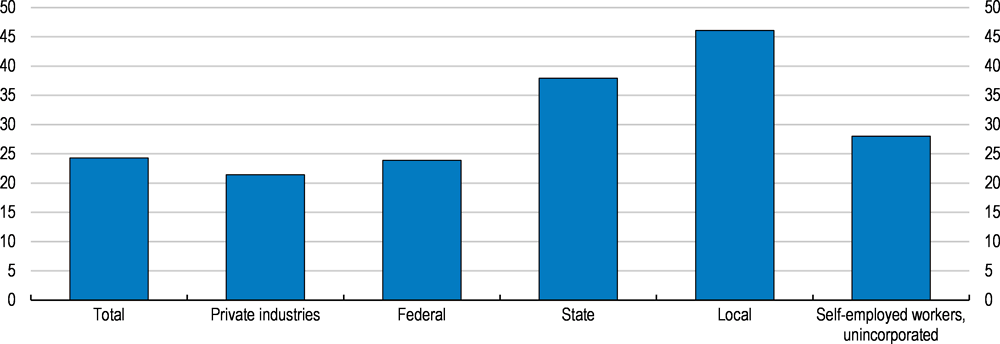
Source: Bureau of Labor Statistics.
Occupational licensing can have negative effects on employment by hindering job movements. Job-to-job flows in the U.S. have exhibited a net decline over the past decade, which is a source of concern given that job transitions is a source of opportunity for workers (OECD, 2016). One factor that has been attributed to this decline is the prevalence of regulatory barriers, notably occupational licensing. State-level licensing can result in requirements that are heterogeneous across states. Workers, therefore, are obliged to obtain separate licences with varying levels of requirements for each state, which can imply significant commitments in terms of time, effort and financial resources when relocating. This hinders workers from reaping the advantages of career opportunities elsewhere and can subsequently result in a mismatch between the demand and supply of talents. Nevertheless, the extent to which licensing contributes to the decline in labour market fluidity remains quantitatively unclear. Recent evidence does suggest it has played a role in reducing inter-state migration (Johnson and Kleiner, 2017[37]).
A consequence of licensing is that it can block access to particular jobs for a large share of the population. This arises through requirements to pass a criminal background check in order to obtain a State licence. There are an estimated 27,254 State occupational licensing restrictions for those with a criminal record. Estimates of the size of the population with a criminal record suggests that a sizeable share of the population may be affected by these restrictions and due to the over-representation of black and African American men with criminal records, these background checks effectively constrain their employment opportunities (Figure 1.17).
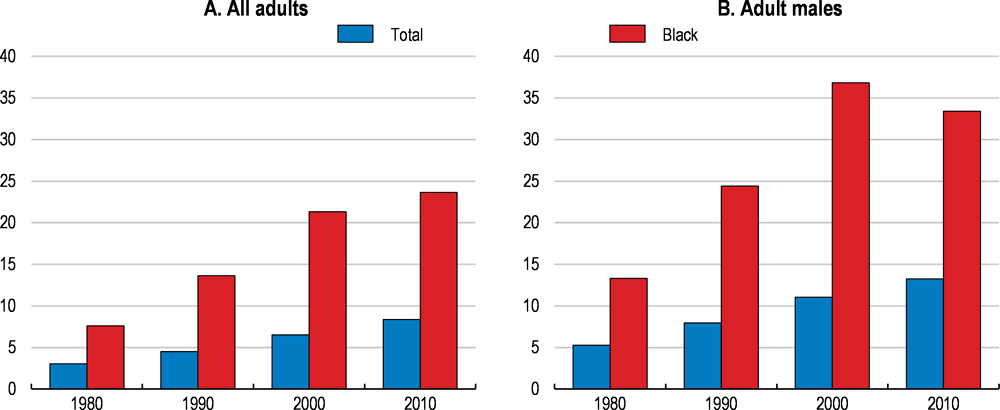
Source: (Shannon et al., 2017[38]).
Occupational licensing is also an important issue elsewhere in the OECD. Surveys in the European Union show that the share of regulated professions in the total labour force is a little over 20% on average, but with substantial variation across countries. For example, the share in Denmark is under 15%, whereas in Germany it rises to over 35%. The variation in the number of regulated professions is substantial ranging from just 76 occupations in Lithuania to 545 in Hungary. Economic analysis of the impact across Europe suggests that employment in these professions could be up to 9% higher and that the aggregate wage premium in these sectors is 4%. Furthermore, related analysis suggests that making barriers less onerous resulted in improved business dynamism, encouraging new firm creation and the development of innovative services.
There are a number of strategies to minimising the costs of licensing, although successful experience in the United States is scarce. One study only uncovered 8 instances of States de-licensing an occupation over 40 years (Thornton and Timmons, 2015[39]). The approaches include sunset clauses, reviews, switching to voluntary registration or certification, and mutual recognition:
-
Sunset clauses have proven largely ineffectual in reducing unnecessary licensing. While 36 States since the 1970s have introduced sunset laws that require periodic "performance audit" of occupational licensing schemes to determine whether they should be maintained around one half of the States subsequently repealed or suspended the laws. Furthermore, most audits recommended continuing the licensing and in the few cases where de-licensing was proposed the State legislature ignored the recommendation.
-
When the public interest objective is not well served by occupational licensing, switching to a voluntary scheme is one way to minimise the economic burden of the law. For example, Texas switched its scheme for interior designers to a voluntary scheme in 2009. An alternative approach to reform is to reduce the scope of licensing. For example a number of states have exempted hair braiding from barber of cosmetologists occupational licensing.
-
Another approach is to pursue mutual recognition to reduce barriers to inter-state migration. New evidence for this survey suggests that this approach does appear to relax some of the constraints on inter-State migration (Box 1.5). Incentives for States to pursue reciprocal recognition were contained in the Administration's infrastructure initiative.
The European Union has been grappling with similar issues for the movement of professionals. Given the diversity of regulatory approaches across the European Union, the 2013 Professional Qualifications Directive introduced a mutual evaluation exercise which required member countries to review all regulated professions. This process garnered information on the regulation in place and how the level of regulation varied across countries, notwithstanding the same underlying rationale. On the basis of this information, countries then were required to produce National Action Plans that would justify when regulations were maintained or amended. The European Commission is working to improve mobility for specific professions by creating "services passports" and introduce a proportionality test which provides a framework for countries to assess the extent to which their occupational licensing induces harmful economic consequences.
Technological change also has the potential to modify regulation. For example, the Productivity Commission in Australia note that online rating of companies could potentially reduce the need for government regulation to ensure consumer protection.
The Nurse Licensure Compact (NLC) whereby States recognise the licences of other States that join the Compact offers a way to study its impact on interstate job mobility within the relevant sector. Membership of the NLC has gradually expanded over time since its creation in 1999 and now covers 26 States.
This expansion of coverage can be used to help understand whether the adoption of the Nurse Licensure Compact increases job-to-job flows in the healthcare and social assistance industry from a given Compact state. The econometric approach adopted to study this was estimating difference-in-differences regressions. The empirical work done for this Survey exploits a relatively new dataset of job-to-job flows released by the U.S. Census Bureau that has not yet been used to study the effects of occupational licensing and job mobility.
The results of the difference-in-differences estimation suggest an approximately 11% increase in job outflows within the health and social assistance industry (significant at the 1% level) following the implementation of the NLC (see Table 1.1, column 1). By contrast the empirical specifications examining whether the result is potentially spurious by checking job-to-job flows that are not between Compact States do not show any meaningful increase in inter-regional migration between States on joining the Compact.
Skills and labour market opportunities
Beyond the importance of ensuring high quality pre-primary and compulsory (K12) education to provide strong foundations, workers acquire needed skills in preparation for joining the labour force or when moving between jobs and occupations from 2 and 4 year colleges and on-the-job training.
Over time, the proportion of students attending colleges has been rising from around one quarter of 18-24 year olds in the 1980s to almost two-fifths in the mid-2000s. Most students attend four year colleges, where the individual returns to investment in education have been substantial. Furthermore, unemployment rates amongst those with bachelor degrees are typically noticeably lower than those finishing two year programmes or those with high school graduation (Figure 1.18). Enrolment in post-secondary career and technical education has also been rising. This part of the system is highly decentralised and has strengths in its diversity and flexibility in meeting the needs (OECD, 2015[40]).
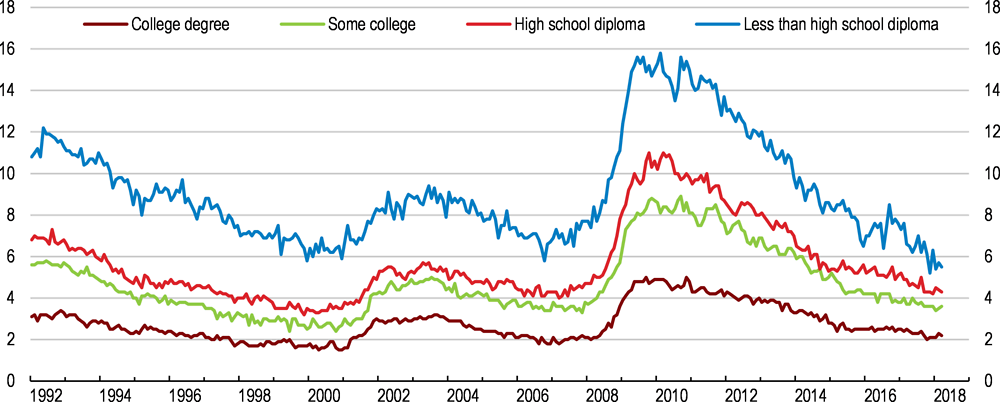
Source: Bureau of Labor Statistics.
While formal education settings can play a major role in providing workers with requisite skills, experience across the OECD also suggests that work-based learning opportunities are valuable complements. This is probably particularly appropriate for students who are less suited to continuing in formal education but would benefit from acquiring additional skills to enhance their employability.
As work-based training is linked directly to employers' needs it can provide needed skills and build the soft skills valued in the work environment (OECD, 2017[5]). There are three conditions that help boost the effectiveness of work-based learning. First, quality needs to be assured and employers engaged in the programmes. Second, the courses need to be affordable and attractive to workers. Third, the competencies gained need to be recognised. In achieving the first two criteria, support for businesses and students likely entail a fiscal cost. The recognition of skills has created obstacles to movement in some professions (either due to occupational licensing or qualifications not being portable from one State to another, either due to differences in curricula or lack of understanding in what the qualification signifies). In this context, the Credential Transparency Initiative is a potentially useful approach to helping prospective students understand what different courses are offering and what employers are demanding (CFR, 2018[13]). Instituting a voluntary hallmark scheme would be another approach to clarifying the bewildering array of options.
The Economic Report of the President recommends allocating resources to promoting apprenticeships and building partnerships between education institutions and employers as a means to promote greater labour force participation among younger cohorts (CEA, 2018[41]). Apprenticeships play a relatively small role in the workplace in comparison with other countries. Data for 2011 reveals that in the United States there were fewer than 15 apprenticeships per 1000 workers. In Canada this figure was closer to 30, whereas in Switzerland it was around 45 (OECD/ILO, 2017[42]).
Apprenticeship programmes can help facilitate the transition to work. This is important as young people who disengage from the labour market subsequently tend to experience more difficulties in finding stable employment in the future (OECD, 2010[43]). The share of young adults not in employment, education and training is around the average of the OECD, and noticeably higher than in Germany and Japan (Figure 1.19). Building basic and transferable skills into these types of education facilitates workers moving between jobs, particularly when the economy reacts to technological change or other shocks. A variety of models exist with different focus, such as ones targeting the school to work transition, as in Germany, to designs that take into account location such as apprenticeship hubs in cities in the United Kingdom to apprenticeships serving rural areas in Norway (OECD/ILO, 2017[42]). Successful apprenticeship training programmes, such as those in Australia, Austria, Germany and Switzerland, are founded on strong collaboration between employers and other stakeholders combining on-the-job and off-the-job training. The strong role of the employers helps ensure the training provides relevant skills.
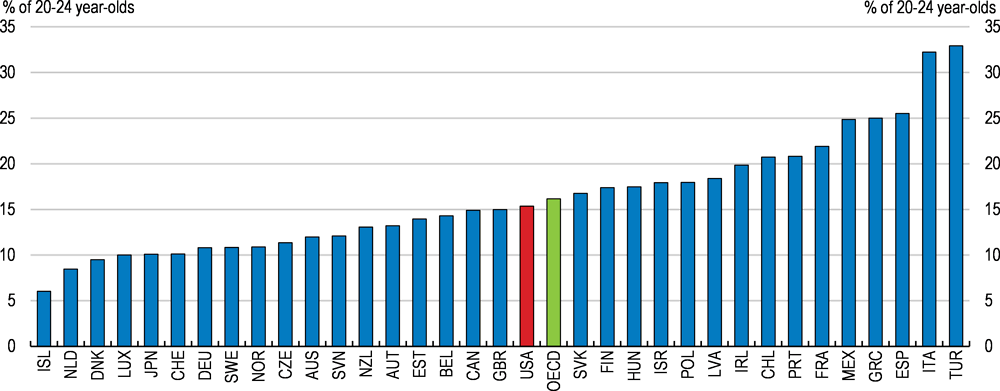
Source: OECD Education at a Glance: Transition from school to work database.
The traditional education system and expansion of work-based training, such as apprenticeships, meet an important part of education needs, mainly targeting those entering the labour market. For those already working, the prospects of structural shocks implies that workers need to become more resilient and able to adapt to changing demands for skills. With respect to the increasing use of technology, improving digital skills possessed by the adult population in the United States suggests one way life-long learning could boost employment opportunities. Older cohorts of workers already possess greater aptitude than older workers in many other OECD countries, but the younger population appears to be less equipped with digital skills in comparison with other OECD countries (Figure 1.20).
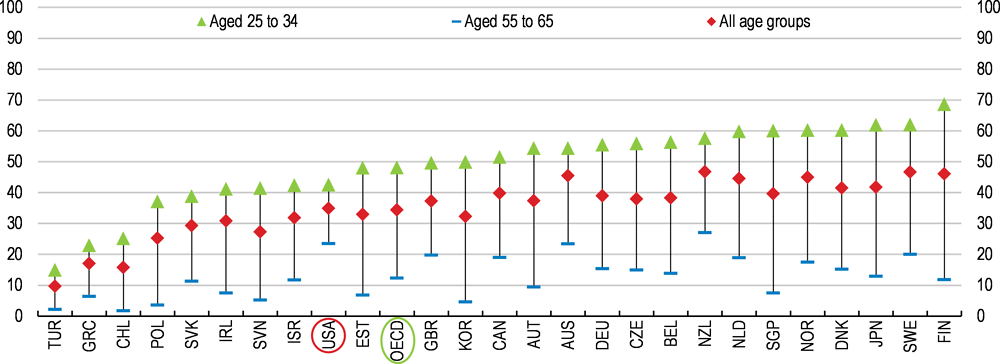
Note: Individuals in Level 2 or Level 3 have more advanced ICT and cognitive skills to evaluate problems and solutions than those in Level 1 or below. The OECD average is the simple unweighted average across countries.
Source: Survey of Adult Skills (PIAAC) 2015.
In comparison with other OECD countries, adult Americans are more willing to participate in further education (both formal and non-formal learning activities). Survey evidence suggests that over one third of American adults want to participate, whereas the unweighted OECD average is about one quarter (OECD, 2017[44]). Barriers to participation include caregiving responsibilities and the pressure of work, which are cited in about the same frequency as in other counties. On the other hand, the expense of adult education creating a barrier to participation was cited more frequently in the United States than the OECD on average, 24% and 15% of respondents, respectively.
Educational spending tends to be pro-cyclical at the State and local level, which is the main source of financing. As such, when labour markets experience large negative shocks, current education spending has been restrained (Figure 2.21). This can limit opportunities for displaced workers, including through programmes offered by community colleges, which have felt the squeeze in the recent downturn. Furthermore, public investment in education has stalled since the beginning of the century (Figure 1.20). This has occurred at both the Federal and the State and local levels especially after the financial crisis. Current spending and investment has only begun to recover somewhat after 2013. More spending does not necessarily translate into better outcomes, yet the past experience of education spending raises concerns about whether training provision will be sufficient to address skills challenges during periods when workers most need retraining.
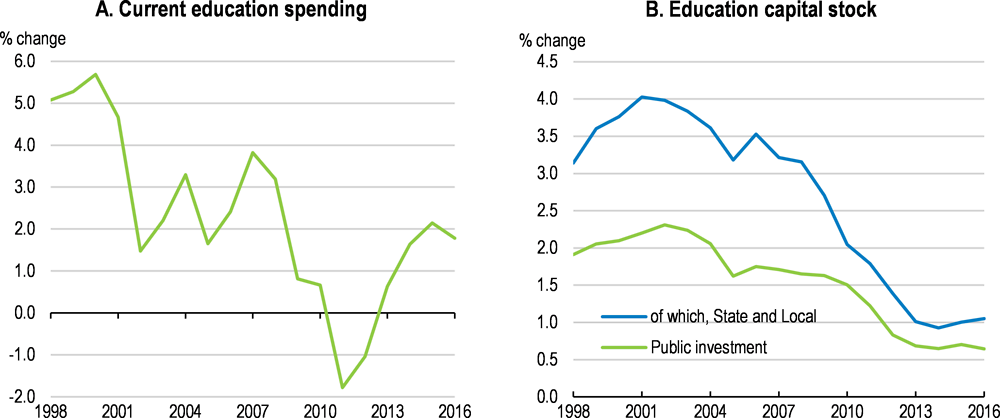
Source: Bureau of Economic Analysis.
With some - often low-skilled - workers on more precarious types of contracts or participating in the gig economy that preclude on-the-job training opportunities, enhancing skills becomes difficult. However, reaching these groups has proven difficult, including due to the cost of the training. The low-skilled, in particular, are often not well prepared for further learning (OECD, 2016[45]).
The prospects of harnessing technology through the use of massive open online courses and open education resources potentially offers a means to reduce costs and increase accessibility. Efforts are needed to ensure quality and qualification recognition to become an effective complement to other educational approaches. In addition, as these resources require familiarity with digital technologies, the continued rollout of broadband infrastructure (as recommended in the previous Economic Survey and the current Administration) and helping students and workers acquire these skills acquires considerable importance (OECD, 2017[5]).
Finally, ensuring workers are well prepared for work also requires that they learn appropriate skills. As technological change continues apace, the types of skills required on the labour market are likely to change. The duration of courses means that reactivity to current demands can only be met with some lag. In this light, education and training need to anticipate demands for skills. Forecasting the demand for particular types of skills is inherently difficult. However, using big data (from online job openings) may help signal where changes in demand for skills are emerging. Ultimately, however, all stakeholders need to co-operate to ensure that changes in curricula are responding to actual needs.
Health, drug addiction and re-employment prospects
Improving employment prospects has a link with health, including mental health. The relationship is complex, though there is some evidence that job loss can incur considerable physical and psychic costs and raise the risk of suicide. On the other hand, employment appears to improve life outcomes, including by reducing the need for medical treatment, as well as by raising household income. The work of Case and Deaton (2017[46]) highlighted increasing midlife mortality due to suicides and drug and alcohol abuse since the late 1990s, contributing to relatively modest gains in life expectancy in the United States. While causality is complicated, the importance of drawing workers into the labour force and employment is highlighted by the relationships between non-participation and disability and drug use.
Opioid use appears to be connected to labour market conditions (Figure 1.22). Prescription rates appear to be higher where labour force participation is lower. There is also a possible relationship between drug use and disability. This may arise after the definition of disability was extended to include chronic conditions. Krueger (2017[47]) found that around one-fifth of the non-participating prime age males were also regularly taking opioid painkillers. This would account for around 0.6 percentage point of the decline in the male prime age participation rate.
The link with participation may be overstated as areas where poor prescribing practice was prevalent before the opioid crisis gathered pace were also areas with relatively poorly performing labour markets. The correlation with disability and opioid prescriptions could suggest that non-participation is a consequence of workplace injury in areas where physical labour was more prevalent. Indeed, the incidence of disability is concentrated in the old industrial heartland (Figure 1.23). However, disability has acted as a social safety net, with the undesirable consequence that very few recipients re-enter the labour market. In this context, a lesson from recent experience is to preserve the labour force attachment of displaced workers or run the risk of persistent non-participation, which generate costs that the public authorities ultimately end up shouldering.
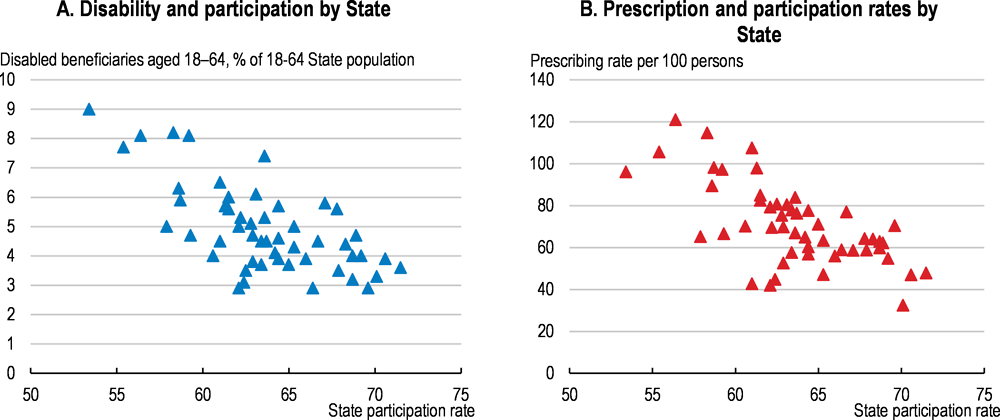
Source: OECD Labour force statistics; Centers for Disease Control and Prevention (CDC); and Social Security Administration (SSA).
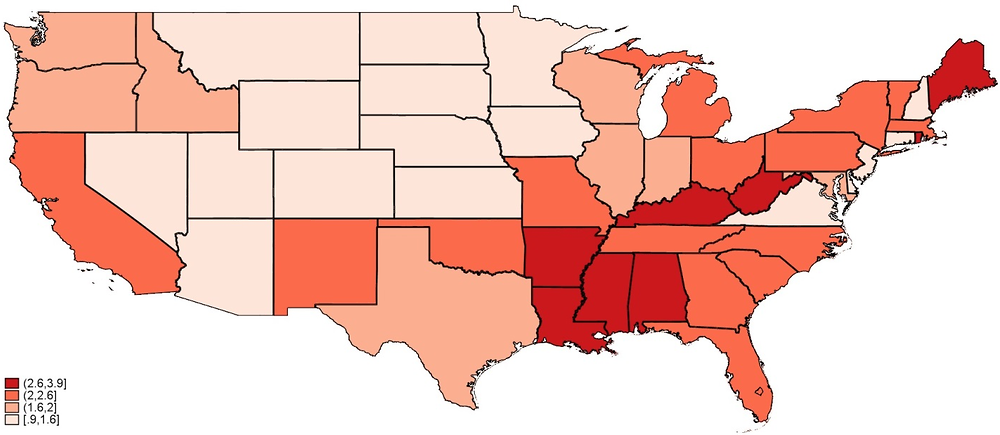
Source: Census Bureau and Social Security Administration.
The rise in drug-related deaths has been particularly dramatic (Figure 1.24). While opioid abuse is a problem in other countries, opioid use and death rates are considerably higher in the United States. For example, the age-adjusted death rate from opioid (all drugs) overdoses was 13.3 (19.8) per 100,000 in 2016. For comparison, in Australia, the age-standardised death rate for all drugs was 7.5 per 100,000. In Europe, drug-induced mortality rates were around 2 per 100,000 for the population aged 15 to 64, but were elevated in Estonia and Sweden, where they were closer to 10 per 100,000 (EMCDDA, 2017[48]).
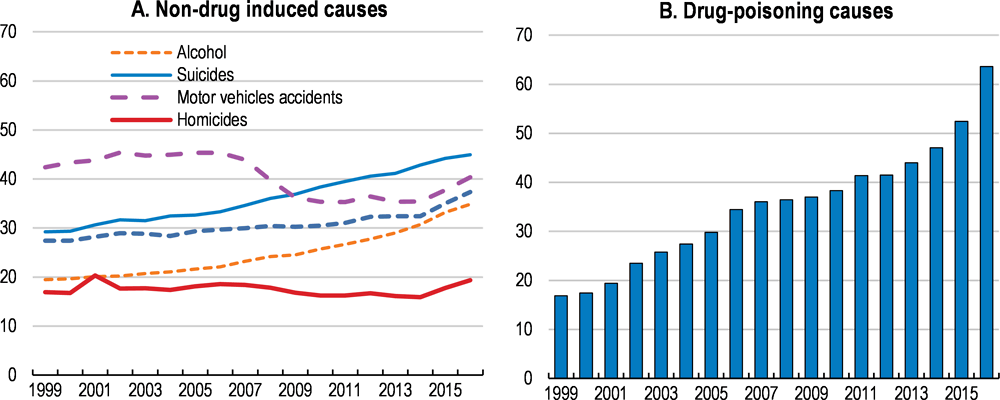
Source: CDC Wonder database.
Costs of the crisis
The consequences of the opioid epidemic are not only felt through deaths but also through the impact on livelihoods and breaking up homes. For example, parental neglect or incapacity to care is forcing public authorities to take children into care. The effects on livelihoods can also be dramatic. While possible to remain in employment, the correlation with non-participation in areas most beset by opioid addiction suggests that addiction ultimately impairs participation. In addition, when addiction leads to criminality, the consequences of a felony record can drastically reduce employment possibilities. The spread of opioid addiction and the growth of the illicit drug market have adverse social consequences with the growth of criminality and the consequences for communities as households who can move leave the areas most affected.
Standard measures of the cost of opioid addiction and deaths include the effects from lost wages and productivity as a result of death, incarceration and decreased productivity associated with drug addiction. Estimates suggest that this could amount to around $40 billion (Table 1.2). Significant costs arise from providing health care. Other costs arise with spending on policing and criminal justice system and child and family assistance spending.
Drug misuse and abuse puts considerable pressure on public services. In 2014, there were over 400,000 emergency room visits and over a quarter of a million hospitalisations for drug poisonings. Opioid overdoses accounted for around one-fifth of these hospitalisations and one-quarter of these emergency room visits. Medicare and Medicaid are the primary payers in around two-thirds of opioid poisoning cases. Public outlays are also incurred through costs for policing, law enforcement and other public services in dealing with drug overdoses. In addition, the treatment of addiction represents another cost often borne by public authorities. On the other side of the ledger, lost productivity also has effects on tax revenue. Estimates of this suggest that in 2016 the combined impact would reduce Federal, State and local tax revenue by almost $16 billion, or around ¾ percentage point of current receipts. As many of the costs are borne by State and Local governments the impact will vary significantly across the country depending on the intensity of the problem locally.
The consequences of the opioid epidemic are even more profound if rather than just the effects on wage and productivity, estimates also account for the value individuals put on their own lives. The Council of Economic Advisors estimated that the cost rises to over $500 billion when taking into account deaths (based on age-adjusted estimates of the value of statistical lives) (CEA, 2017[51]).
The opioid epidemic and drug use
The opioid epidemic emerged relatively unnoticed until death rates surged in the past decade. In part, the scale of the problem confronting the United States is the sheer prevalence of opioids. The prescription of opioids per capita is significantly higher than elsewhere in the OECD (Figure 1.25). The pharmaceutical industry and healthcare sector appear to have played a role in the genesis, and to which they are now reacting. As pain management philosophies changed, particularly with respect to treating chronic pain, pharmaceutical companies and medical doctors increasingly advocated opioids for a wider range of conditions. Between 1999 and 2014, opioid prescriptions quadrupled. This was compounded by relatively liberal policies on the number of opioids being prescribed, the duration of treatment and aggressive marketing. Anecdotal evidence also suggests that medical practitioners prescribed more drugs to reduce co-payments patients would need to make for repeat prescriptions. Prescription rates also varied considerably across the country, suggesting that prescription practice is poorer in some areas. Ultimately millions of individuals were exposed to addictive substances, either the intended patient or through unused drugs being taken by family members or others. By 2014, one in four patients receiving opioids for non-cancer chronic pain was struggling with opioid dependence. The amount of opioids available also facilitated drug misuse and abuse.
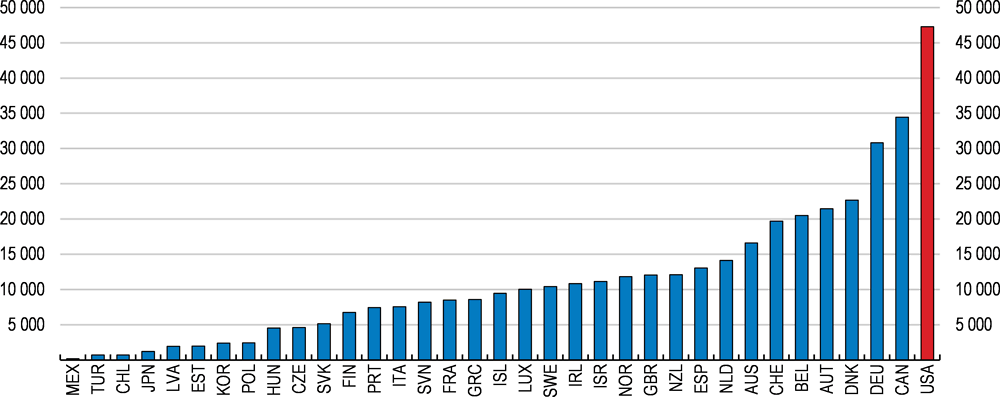
Source: INCB.
More recently, prescribing practice appears to be changing as the associated risks are becoming better appreciated, but opioid supply is still considerable. The prescription rate peaked in 2012 at around 80 per 100 persons and has subsequently declined in 2016 to under 67 per 100 persons and the average daily dosage has also been falling gradually. The decline in prescriptions is mainly accounted for by declines in supplies of less than 30 days. On the other hand, prescription rate for longer durations have remained relatively constant since the beginning of the decade, such that the average days of supply per prescription has increased from around 13 days in 2006 to 18 days in 2016.
With opioid use rising, intentional and unintentional deaths from drug overdoses have also been rising (Figure 1.26). There have been demographic differences with the death rates for non-Hispanic whites (hereafter whites) significantly higher than other groups. In smaller metropolitan areas the likelihood of abuse or misuse of prescription pain killers is higher. Death rates are not surprisingly also higher in these areas, though there are some differences in the nature of the overdoses. Prescription opioid overdoses are a much more common cause of death in smaller cities and urban areas. In larger cities, particularly the large fringe metropolitan areas, heroin and synthetic opioids (such as fentanyl) are responsible for a large share of overdoses. Given the differences across places, improving prescribing practice (as recommended by the Administration's opioid imitative) and controlling the flow of opioids in smaller metropolitan and rural areas promises to regain control over opioid use. However, without addressing underlying addiction, tightening access to prescription opioids can push individuals with opioid dependence onto the illicit market for drugs.
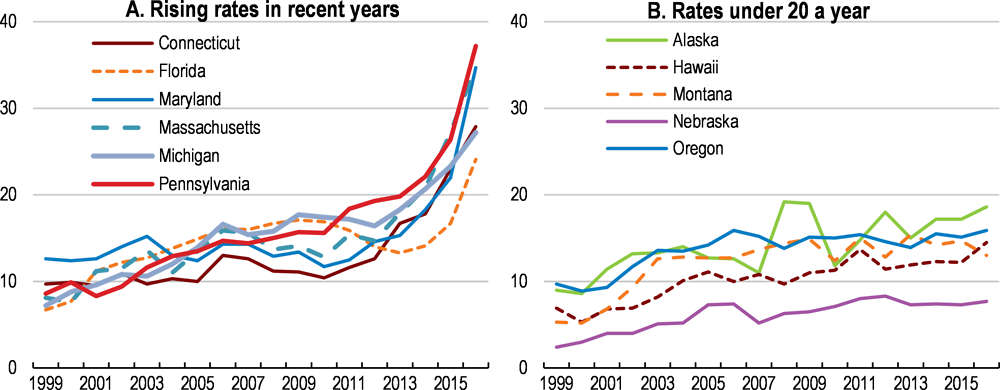
Source: NCHS, National Vital Statistics System Mortality, CDC WONDER database.
More recently, the use of illicit and extremely potent substitutes for prescription pain killers has grown rapidly and contributed to marked jumps in deaths from overdoses since the beginning of this decade. Death rates due to heroin overdoses spiked first from 2010 for whites and then subsequently for other groups with the exception of Asian or Pacific Islanders (Figure 1.27). Death rates from synthetic opioid overdoses (e.g. Fentanyl) began to spike up from 2013. Fentanyl and related drugs are orders of magnitudes more potent than heroin, which helps account for why overdose deaths have risen so dramatically. The dose of illegally supplied fentanyl can vary enormously depending on how the drug is mixed with other compounds and can be fatal. Indeed intravenous abusers have died before fully injecting the syringe. The potency of these drugs also presents mortality risk to family members and first responders if they are exposed to the remaining drug.
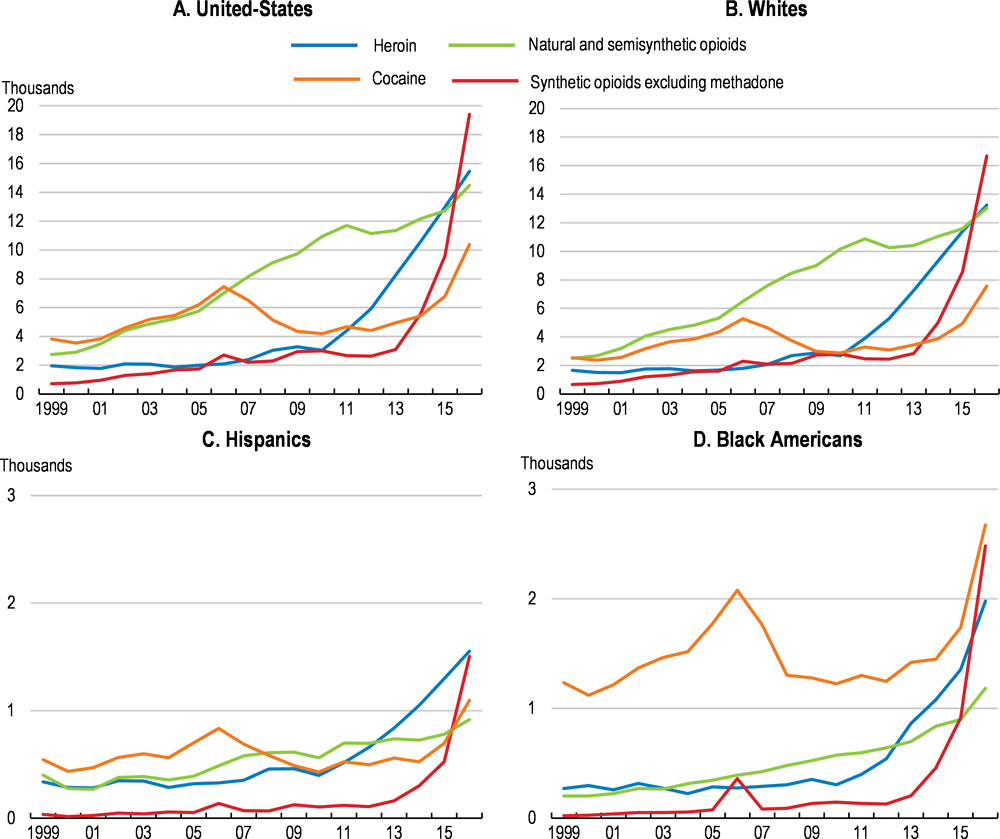
Note: Natural and semisynthetic opioids include morphine, codeine, hydrocodone and oxycodone. Synthetic opioids excluding methadone include fentanyl, fentanyl analogs and tramadol.
Source: NCHS, National Vital Statistics System Mortality, CDC WONDER database.
There is some experience elsewhere in the OECD with the use of synthetic opioids. In Estonia, overdose rates surged in the early 2000s largely due to supply disruptions for heroin inducing switching to substitutes, notably fentanyl. Death rates are now falling, in part due to subsequent cohorts avoiding the drug as well as the government's programmes, such as drug-replacement therapies. In part, the death rates are also falling because so many of the initial drug users are now dead. In Germany, where fentanyl prescription rates are higher than elsewhere in the OECD, overdoses have risen (partly due to the diversion of legally acquired drugs). Given the potency of the drugs and the small amounts that need to be transported, combatting illicit supply is extremely difficult, though with some success recently. U.S. Custom and Border statistics reveal that discovery of fentanyl has increased considerably in the past couple of years from essentially none in 2015 (US CBP, 2018[52]). These statistics also show a marked increase in seizures of methamphetamine (which tripled between 2012 and 2017).
Policy responses
Public policies can adapt to limit the emergence of new opioid abuse, by addressing the potential for creating opioid dependence. Adopting best practice in prescription practice and removing unused drugs from circulation would be important steps in reducing the scale of the problem. Design is important as some empirical studies fail to identify policies that make a significant difference in outcomes. Nonetheless, differences in the trajectory of drug-related deaths in States, such as the stabilising of elevated death rates in Nevada and New Mexico rather than continually rising, suggests that there are factors that can constrain misuse and abuse.
A number of initiatives appear to have an effect in addressing the use of prescription opioid painkillers. For example, in Minnesota health authorities introduced electronic monitoring to identify doctors who overprescribe and patients who are trying to source painkillers from different healthcare providers. This has led to a one-fifth reduction in prescriptions of the most common painkillers (hydrocodone) between December 2014 and December 2016. This does not mean that pain management is ignored as non-opioid painkillers are available and used to a greater extent in other countries.
At the national level, the FDA is considering introducing extra hurdles for doctors wishing to prescribe more than a limited supply of opioids. Not only may this prevent patients developing addiction by continued use, but prevent experimentation by others in the household, which is another pathway to developing addiction. This approach to limiting misuse can be complemented by creating drop off places where excess drugs can be disposed of safely. And information programmes documenting the risks may help reduce some of the demand.
A different set of policies are needed to help people with opioid dependence. One of the most immediate concerns is preventing avoidable deaths. Naloxone and similar drugs have proven efficacy in reversing the effects of opioid overdoses and thereby saving lives. Making these drugs more widely available would help reduce deaths from overdose. Some European countries have schemes allowing naloxone to be taken home by the drug user (EMCDDA, 2017[48]). A few countries have drug consumption rooms, where death from overdose is much less likely. Almost all countries have needle and syringe programmes, which can prevent the spread of infectious diseases, which can be very expensive to treat (such as hepatitis C).
An additional problem for policymakers arises when limiting accessibility to prescribed painkillers induces switching to alternatives, such as heroin or fentanyl, on the illegal market. Such alternatives are likely to be more closely linked to poisoning given that dosages may vary dramatically between sources or when illegal drugs are contaminated with other chemicals. Notwithstanding these complications, actions to prevent addiction from arising should eventually feed through to a diminishing problem of addicts seeking illegal substitutes. Successes in reducing the circulation of illegal drugs will also help in this regard.
A second set of policies to address opioid dependence would work to wean addicts off opioids. Medically-assisted treatments using methadone and in some cases abstinence programmes are used across the country. Programmes dealing with addiction should consider methadone and related drugs as part of the treatment regime (as is the case in many other countries where supervised injection has reduced overdose rates). But the numbers treated this way are relatively limited in comparison to the scale of the problem (currently licensed medical staff could cope with 1.5 million people being treated (AAFP, 2016[53])). Against this background relaxing some of the current administrative restrictions - where medically appropriate - would help reach a larger group of the population. For example, removing restrictions on treatment facilities (such as requirements on the number of rooms they must have) and broadening the number of doctors who can administer medically assisted programmes, particularly in rural areas where coverage by medical practitioners is limited, would help expand the reach of addiction treatments.
Past estimates suggest many individuals with drug abuse disorders - around 60% - do not undergo medically-assisted treatment, despite their existence (Compton et al., 2007[54]). Increasing treatment rates will require action to reduce the stigma associated with drug dependence and increase awareness of treatments options amongst drug users and medical practitioners. Efforts to develop new drugs to reduce cravings are underway though these drugs are not yet clinically proven to augment possible treatment options.
Successfully treating addiction will require complementary policies to reap the full benefits. These will need to address underlying problems linked to addiction and efforts to re-integrate addicts into work and housing to minimise the risks of relapse and recidivism. Finally, given the problems people with criminal records face in finding employment, the authorities should consider removing barriers to expunging criminal records of those who have undergone treatment successfully.
Labour market policies
-
Increase spending on effective active labour market policies, such as job placement services and support to geographic mobility.
-
Expand the use of apprenticeships and on-the-job training to ease the school-to-work transition.
-
Relax the full-time employment job search requirement in the unemployment insurance system.
Infrastructure and mass transit
-
Roll out initiatives to invest more in infrastructure, making use of greater private-sector financing, user fees and flexible risk-sharing arrangements.
-
Improve mass transit systems.
-
Continue current policies to improve access to broadband in poorly served areas.
Housing market
-
Reform housing finance, including the government sponsored enterprises, to better target housing affordability measures to the rental market.
-
Support the provision of affordable housing for low-income families.
-
Use seed money to encourage States and localities to remove zoning restrictions and move to multi-use zoning.
-
Encourage state and local governments to deregulate occupational licensing and recognise credentials granted by other States.
The opioid crisis
-
Ease administrative barriers to the treatment of opioid addiction.
-
Make drugs that can reverse opioid overdoses more readily available.
-
Promote and expand medically assisted treatment options.
-
Help reintegrate into employment, including by expunging criminal records, those who have successfully completed treatment for addiction.
References
[53] AAFP (2016), Chronic Pain Management and Opioid Misuse: A Public Health Concern (Position Paper), American Academy of Family Physicians, https://www.aafp.org/about/policies/all/pain-management-opioid.html (accessed on 16 April 2018).
[61] Abbott, R. and B. Bogenschneider (2018), “Should Robots Pay Taxes? Tax Policy in the Age of Automation”, Harvard Law & Policy Review, Vol. 12, https://doi.org/10.2139/ssrn.2932483.
[16] Abdul Ghani, A. (2018), “The Impact of the Nurse Licensing Compact on interstate Job Mobility in the United States”, OECD Economics Department Working Papers, No. Forthcoming.
Acemoglu, D. et al. (2016), “Import competition and the great US employment sag of the 2000s”, Journal of Labor Economics, Vol. 34/S1, pp. S141-S198, https://doi.org/10.1086/682384.
[7] Acemoglu, D. and P. Restrepo (2017), “Robots and Jobs: Evidence from US Labor Markets”, NBER Working Papers, No. 23285, NBER, http://www.nber.org/papers/w23285 (accessed on 13 April 2018).
[12] Acemoglu, D. and P. Retrepo (2018), Artificial Intelligence, Automation and Work, NBER, http://www.nber.org/papers/w24196 (accessed on 16 January 2018).
[34] Ahrend, R. et al. (2014), “What Makes Cities More Productive? Evidence on the Role of Urban Governance from Five OECD Countries”, OECD Regional Development Working Papers, No. 2014/5, OECD Publishing, Paris, https://doi.org/10.1787/5jz432cf2d8p-en.
[18] Ahrend, R. and A. Schumann (2014), “Does Regional Economic Growth Depend on Proximity to Urban Centres?”, OECD Regional Development Working Papers, No. 2014/7, OECD Publishing, Paris, https://doi.org/10.1787/5jz0t7fxh7wc-en.
[17] Alden, E. and L. Taylor-Kale (2018), “The work ahead: Machines, skills, and U.S. leadership in the twenty-first century”, Independent Task Force Report, No. 76, Council on Foreign Relations, https://www.cfr.org/report/the-work-ahead/.
[8] Asquith, B. et al. (2017), “U.S. Job Flows and the China Shock”, No. 24080, National Bureau of Economic Research, Cambridge, MA, https://doi.org/10.3386/w24080.
[19] Austin, B., E. Glaeser and L. Summers (2018), “Saving the heartland: Place-based policies in 21st century America”, Brookings Papers on Economic Activity, https://www.brookings.edu/wp-content/uploads/2018/03/3_austinetal.pdf (accessed on 08 March 2018).
[59] Autor, D.(2015), “Why Are There Still So Many Jobs? The History and Future of Workplace Automation”, Journal of Economic Perspectives—Volume, Vol. 29/3, pp. 2015-3, https://doi.org/10.1257/jep.29.3.3.
[10] Autor, D., D. Dorn and G. Hanson (2016), “The China Shock: Learning from Labor-Market Adjustment to Large Changes in Trade”, Annu. Rev. Econ, Vol. 8, pp. 205-40, https://doi.org/10.1146/annurev-economics-080315-015041.
[11] Autor, D. et al. (2014), “Trade adjustment: Worker-level evidence”, Quarterly Journal of Economics, Vol. 129/4, pp. 1799-1860, https://doi.org/10.1093/qje/qju026.
[6] Autor, D., L. Katz and M. Kearney (2006), “The Polarization of the U.S. Labor Market”, American Economic Review, Vol. 96/2, https://pubs.aeaweb.org/doi/pdf/10.1257/000282806777212620 (accessed on 13 April 2018), pp. 189-194.
[22] Blanchard, O. and L. Katz (1992), “Regional Evolutions”, Brookings Papers on Economic Activity 1, https://scholar.harvard.edu/files/lkatz/files/regional_evolutions.pdf (accessed on 08 February 2018), pp. 1-75.
[14] Bleakley, H. and J. Lin (2012), “Thick-market effects and churning in the labor market: Evidence from US cities”, Journal of Urban Economics, Vol. 72/2-3, pp. 87-103, https://doi.org/10.1016/J.JUE.2012.04.003.
[27] Boulant, J., M. Brezzi and P. Veneri (2016), “Income Levels And Inequality in Metropolitan Areas: A Comparative Approach in OECD Countries”, OECD Regional Development Working Papers, No. 2016/6, OECD Publishing, Paris, https://doi.org/10.1787/5jlwj02zz4mr-en.
[15] Brainard, L. (2017), Why Persistent Employment Disparities Matter for the Economy's Health, https://www.federalreserve.gov/newsevents/speech/brainard20170926a.htm (accessed on 23 November 2017).
[63] Caldera Sanchez, A. and A. Johansson (2011), “The Price Responsiveness of Housing Supply in OECD Counties”, OECD Economics Department Working Paper, No. 837, OECD, Paris, https://www.oecd-ilibrary.org/docserver/5kgk9qhrnn33-en.pdf?expires=1523873524&id=id&accname=ocid84004878&checksum=FD784B5EFE803F77E0709AD1D2FF57E8 (accessed on 16 April 2018).
[46] Case, A. and A. Deaton (2017), “Mortality and Morbidity in the 21st Century”, Brookings Papers on Economic Activity, https://www.brookings.edu/wp-content/uploads/2017/08/casetextsp17bpea.pdf (accessed on 12 March 2018).
[41] CEA (2018), Economic Report of the President, Council of Economic Advisers, https://www.whitehouse.gov/wp-content/uploads/2018/02/ERP_2018_Final-FINAL.pdf (accessed on 19 March 2018).
[51] CEA (2017), The Underestimated Cost of the Opioid Crisis, The Council of Economic Advisers, Washington, D.C., https://www.whitehouse.gov/sites/whitehouse.gov/files/images/The%20Underestimated%20Cost%20of%20the%20Opioid%20Crisis.pdf (accessed on 23 November 2017).
[13] CFR (2018), The Work Ahead: Machines, Skills, and U.S. Leadership in the Twenty-First Century, Council on Foreign Relations, https://www.cfr.org/report/the-work-ahead/report/ (accessed on 13 April 2018).
[54] Compton, W. et al. (2007), “Prevalence, Correlates, Disability, and Comorbidity of DSM-IV Drug Abuse and Dependence in the United States”, Archives of General Psychiatry, Vol. 64/5, p. 566, https://doi.org/10.1001/archpsyc.64.5.566.
[24] Couture, V. and J. Handbury (2017), Urban Revival in America, 2000 to 2010, National Bureau of Economic Research, Cambridge, MA, https://doi.org/10.3386/w24084.
[17] Economic Innovation Group (2017), The 2017 Distressed Communities Index, Economic Innovation Group, http://eig.org/wp-content/uploads/2017/09/2017-Distressed-Communities-Index.pdf (accessed on 13 April 2018).
[48] EMCDDA (2017), European Drug Report, European Monitoring Centre for Drugs and Drug Addiction, http://www.emcdda.europa.eu/system/files/publications/4541/TDAT17001ENN.pdf (accessed on 12 April 2018).
[9] Feenstra, R., H. Ma and Y. Xu (2017), “US Exports and Employment”, No. 24056, NBER, http://www.nber.org/papers/w24056 (accessed on 06 February 2018).
[49] Florence, C. et al. (2016), “The Economic Burden of Prescription Opioid Overdose, Abuse, and Dependence in the United States, 2013”, Medical Care, Vol. 54/10, pp. 901-906, https://doi.org/10.1097/MLR.0000000000000625.
[20] Fogli, A. and V. Guerrieri (2017), The End of the American Dream? Inequality and Segregation in US cities, https://economicdynamics.org/meetpapers/2017/paper_1309.pdf (accessed on 15 March 2018).
[1] Frey, C. and M. Osborne (2017), “The future of employment: How susceptible are jobs to computerisation? ଝ”, Technological Forecasting & Social Change, Vol. 114, pp. 254-280, https://doi.org/10.1016/j.techfore.2016.08.019.
[28] Ganong, P. and D. Shoag (2016), “Why has regional income convergence declined?”, https://www.brookings.edu/wp-content/uploads/2016/08/wp21_ganong-shoag_final.pdf (accessed on 23 November 2017).
[32] Glaeser, E. and J. Gyourko (2018), “The Economic Implications of Housing Supply”, Journal of Economic Perspectives, Vol. 32/1, pp. 2018-3, https://doi.org/10.1257/jep.32.1.3.
[21] Glaeser, E., M. Resseger and K. Tobio (2009), “Inequality in Cities”, Journal of Regional Science, Vol. 49/4, pp. 617-646, https://doi.org/10.1111/j.1467-9787.2009.00627.x.
[29] Goodman, L. and C. Mayer (2018), “Homeownership and the American Dream”, Journal of Economic Perspectives—Volume, Vol. 32/1—Winter, pp. 31-58, https://doi.org/10.1257/jep.32.1.31.
[62] Guerreiro, J., S. Rebelo and P. Teles (2017), “Should Robots be Taxed?”, NBER Working Papers, No. 23806, NBER, http://www.nber.org/papers/w23806.pdf (accessed on 10 April 2018).
[37] Gyourko, J. and R. Molloy (2014), “Regulation and housing supply”, NBER Working Paper, No. 20536, National Bureau of Economic Research, Cambridge, MA, https://doi.org/10.3386/w20536.
[60] Helpman, E. (2016), “Globalization and Wage Inequality”, No. 22944, National Bureau of Economic Research, Cambridge, MA, https://doi.org/10.3386/w22944.
[39] Hsieh, C. and E. Moretti (2015), “Housing constraints and spatial misallocation”, NBER Working Paper, No. 21154, National Bureau of Economic Research, Cambridge, MA, https://doi.org/10.3386/w21154.
[57] ITF (2017), “Managing the Transition to Driverless Road Freight Transport”, International Transport Forum Policy Papers, No. 32, OECD Publishing, Paris, https://doi.org/10.1787/0f240722-en.
[25] Jauer, J. et al. (2014), “Migration as an Adjustment Mechanism in the Crisis? A Comparison of Europe and the United States”, No. 7921, IZA, http://ftp.iza.org/dp7921.pdf (accessed on 07 February 2018).
[37] Johnson, J. and M. Kleiner (2017), “Is Occupational Licensing a Barrier to Interstate Migration?”, http://www.nber.org/papers/w24107 (accessed on 15 December 2017).
[36] Kleiner, M. and E. Vorotnikov (2017), “Analyzing occupational licensing among the states”, J Regul Econ, Vol. 52, pp. 132-158, https://doi.org/10.1007/s11149-017-9333-y.
[47] Krueger, A. (2017), “Where Have All the Workers Gone? An Inquiry into the Decline of the U.S. Labor Force Participation Rate”, Brookings Papers on Economic Activity, https://www.brookings.edu/wp-content/uploads/2017/09/1_krueger.pdf (accessed on 26 March 2018).
[4] Maarten Goos, B. et al. (1993), “Explaining Job Polarization: Routine-Biased Technological Change and Offshoring”, American Economic Review, Vol. 104/8, pp. 2509-2526, https://doi.org/10.1257/aer.104.8.2509.
[35] Metcalf, G. (2018), “Sand Castles Before the Tide? Affordable Housing in Expensive Cities”, Journal of Economic Perspectives—Volume, Vol. 32/1—Winter, pp. 59-80, https://doi.org/10.1257/jep.32.1.59.
[23] Molloy, R., C. Smith and A. Wozniak (2014), “Declining Migration within the U.S.: The Role of the Labor Market”, No. 20065, NBER, http://www.nber.org/papers/w20065 (accessed on 25 January 2018).
[2] Nedelkoska, L. and G. Quintini (2018), “Automation, skills use and training”, OECD Social, Employment and Migration Working papers, No. 202, OECD, https://read.oecd-ilibrary.org/employment/automation-skills-use-and-training_2e2f4eea-en#page1 (accessed on 17 April 2018).
[44] OECD (2017), Education at a Glance 2017: OECD Indicators, OECD Publishing, Paris, https://doi.org/10.1787/eag-2017-en.
[3] OECD (2017), “Making Trade Work for All”, Trade Policy Papers, No. 202, OECD, http://www.oecd.org/tad/making-trade-work-for-all.pdf (accessed on 29 January 2018).
[5] OECD (2017), OECD Employment Outlook 2017, OECD Publishing, Paris, https://www.oecd-ilibrary.org/docserver/empl_outlook-2017-7-en.pdf?expires=1523368964&id=id&accname=ocid84004878&checksum=0CA82D29F1BF78B3D549E782E10DC327 (accessed on 10 April 2018).
[45] OECD (2016), Education at a Glance 2016: OECD Indicators, OECD Publishing, Paris, https://www.oecd-ilibrary.org/docserver/eag-2016-en.pdf?expires=1523546194&id=id&accname=ocid84004878&checksum=20324E6687043B9C6B458B8798FB22CC (accessed on 12 April 2018).
[55] OECD (2016), OECD Economic Surveys: United States 2016, OECD Publishing, Paris, https://doi.org/10.1787/eco_surveys-usa-2016-en.
[30] OECD (2016), OECD Regional Outlook 2016: Productive Regions for Inclusive Societies, OECD Publishing, Paris, https://doi.org/10.1787/9789264260245-en.
[46] OECD (2015), OECD Reviews of Vocational Education and Training: Key Messages and Country Summaries, OECD Publishing, Paris, http://www.oecd.org/education/skills-beyond-school/OECD_VET_Key_Messages_and_Country_Summaries_2015.pdf.
[43] OECD (2010), OECD Reviews of Vocational Education and Training : Learning for Jobs, OECD Publishing, Paris, http://www.sourceoecd.org/education/9789264082236 (accessed on 13 April 2018).
[42] OECD/ILO (2017), Engaging Employers in Apprenticeship Opportunities: Making It Happen Locally, OECD Publishing, Paris, https://doi.org/10.1787/9789264266681-en.
[56] Rhyan, C. (2017), The potential societal benefit of eliminating opioid overdoses, deaths, and substance use disorders exceeds $95 billion per year, Altarum Center for Value in Health Care, https://altarum.org/sites/default/files/uploaded-publication-files/Research-Brief_Opioid-Epidemic-Economic-Burden.pdf.
[38] Shannon, S. et al. (2017), “The Growth, Scope, and Spatial Distribution of People With Felony Records in the United States, 1948–2010”, Demography, Vol. 54/5, pp. 1795-1818, https://doi.org/10.1007/s13524-017-0611-1.
[30] Sinai, T. and N. Souleles (2013), “Can Owning a Home Hedge the Risk of Moving?”, American Economic Journal: Economic Policy, Vol. 5/2, https://doi.org/10.1257/pol.5.2.282.
[39] Thornton, R. and E. Timmons (2015), “The de-licensing of occupations in the United States”, Monthly Labor Review, https://doi.org/10.21916/mlr.2015.13.
[52] US CBP (2018), CBP Enforcement Statistics FY2018, U.S. Customs and Border Protection, https://www.cbp.gov/print/148141 (accessed on 23 April 2018).
[16] Weingarden, A. (2017), “Labor Market Outcomes in Metropolitan and Non-Metropolitan Areas: Signs of Growing Disparities”, FEDS Notes, Vol. 2017/2063, https://doi.org/10.17016/2380-7172.2063.