Chapter 1. Unleashing private sector productivity
Productivity growth has been sluggish since the Great Recession and had been slowing before it. This slowdown has touched nearly every industry. Although part the slowdown may be related to weakness of investment related to the slow recovery of aggregate demand, structural issues also appear to be playing a role, including persistent declines in business dynamism (market entry and exit of firms) and signs of diminishing competitive pressures. Historically, young productive firms have been an important source of productivity growth, but start-up rates have been slowing for some time and have been especially low in the aftermath of the crisis, and failure rates of new firms have risen. This diminished dynamism appears to be associated with other trends such as population ageing, funding difficulties, reforms in 2005 to the personal bankruptcy code that made debt discharge more difficult, intellectual property rights that favour some established companies, the spread of state-level occupational licensing requirements, as well as zoning and land use restrictions that inhibit resources from flowing to their most productive use. There are also signs that market power is gradually intensifying on balance, restraining competitive forces that would otherwise translate productivity gains into broad-based improvements in household purchasing power.
Labour productivity has suffered a broad-based deceleration
Available measures show that US labour productivity has slowed at most levels of aggregation. One broad measure, real GDP per worker, rose at an average annual rate of 0.9% from 2005 to 2015 after having increased at annual rates of 2.2% from 1995 to 2005 and 1.5% from 1970 to 2005. Aggregate measures of US business sector productivity – which exclude production by governments and non-profits – have also slowed, as have measures that calculate productivity using hours worked rather than workers. Similar patterns can also be seen in the OECD as a whole (Figure 1.1). Although it is too early to dismiss the possibility that the deceleration is mainly cyclical, there are legitimate worries that the slowdown is being driven by more persistent forces.
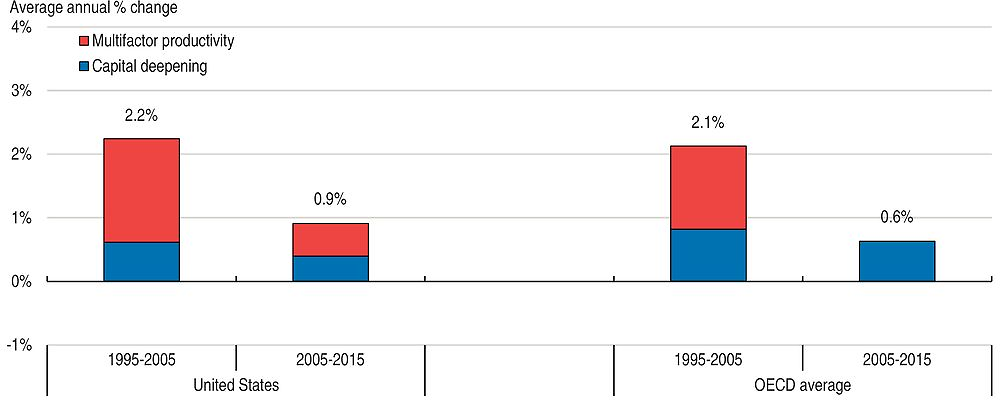
Note: Real GDP per employed worker. OECD average is for 32 countries that have data available for the full timespan shown.
Source: OECD, Analytical database and OECD calculations.
The sources of this slowdown are not entirely understood. Growth decompositions attribute the deceleration of aggregate productivity from 2005-2015 in comparison to the preceding ten-year period to slower multifactor productivity growth, and, to a somewhat lesser extent, a diminished pace of capital deepening (Figure 1.2). Although productivity growth initially surged in the aftermath of the crisis as employment fell disproportionately relative to output, since 2010 capital formation has failed to keep pace with steady gains in employment and hours worked, whilst multifactor productivity growth has been meagre by historical standards. By comparison, growth decompositions show that the productivity slowdown from 2005 onward in the OECD as a whole can be mainly attributed to a levelling of multifactor productivity.
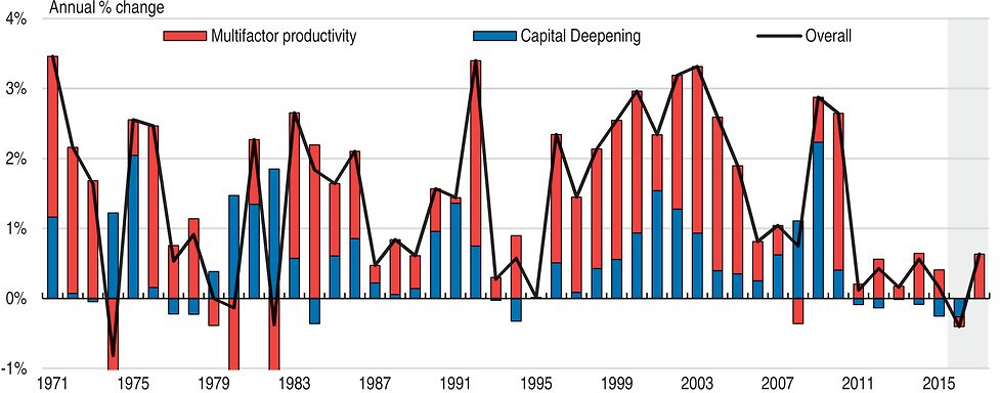
Note: Productivity is aggregate real GDP per work hour and capital deepening is capital per work hour.
Source: OECD, Analytical database and OECD calculations.
The labour productivity slowdown is equally evident in more disaggregated data. Available estimates show that gross output per hour (which includes industry value added and intermediates) decelerated in all but a handful of industries in 2005 to 2014 relative to the preceding nine-year period (Figure 1.3). To be sure, productivity growth varies substantially across industries, and these differences are persistent. Yet even though productivity advances in many high tech industries (such as semiconductors, computer equipment, and telecommunications) remain comparatively strong, gains have nonetheless slowed in these industries. The pervasiveness of the productivity deceleration across industries is an important piece of the puzzle because it redirects some focus from explanations that rely on developments (such as measurement difficulties) in particular industries or upon shifts in the composition of activity away from industries with faster productivity growth (Box 1.1 explores the role of such compositional shifts). Cross-industry regressions (weighted by nominal pruduction) show that rates of increase in productivity were nearly two-thirds slower, on average, from 2005 to 2014 than in the preceding nine-year period. This deceleration is highly significant and is broadly in line with that seen in aggregate data.
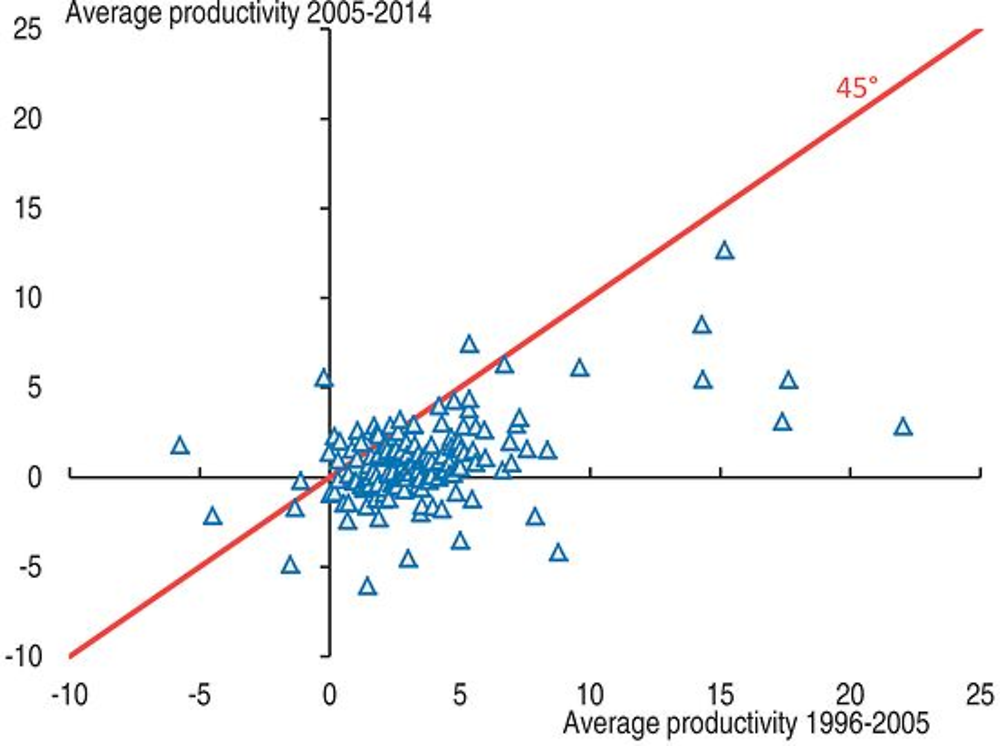
Note: Productivity is calculated as real gross output per hour for 153 industries at the four-digit NAICS level.
Source: OECD calculations using yearly industry productivity estimates from the Bureau of Labor Statistics (BLS).
Baumol (1967) long ago advanced the “cost disease” theory, which posits that overall productivity growth can be slowed by shifts in the composition of activity from industries with high productivity growth and falling relative costs (such as durable goods manufacturers) to industries with slow growth and rising relative costs (such as healthcare providers). Shifts in activity away from industries with high productivity growth can occur when goods and services produced by high productivity growth industries are poor substitutes for those with low growth, especially when products from low growth industries cannot be imported (as with many services). Such compositional shifts can be allocatively efficient even though they diminish the overall pace of productivity growth. Gains in productivity in individual industries allow economies to produce more of anything (or everything) using existing resources, and in the cost disease case, households allocate freed resources to goods and services with rising relative costs and become better off as a result. However, such compositional shifts could be a symptom of allocational inefficiency if constraints prevent inputs from being reallocated to reflect market signals.
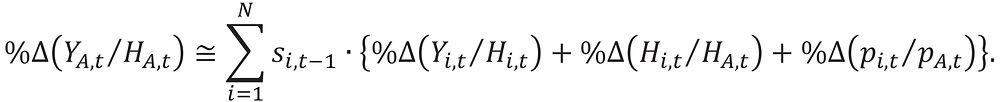
To investigate whether such compositional effects are making a meaningful contribution to the deceleration in overall productivity, this box uses formulas developed by Tang and Wang (2004) and Diewert (2013) to decompose value-added productivity growth into contributions from (1) value-added productivity growth within industries holding the relative allocation of labour and relative prices constant, as well as (2) reallocation effects that arise due to changes in relative prices and the relative allocation of labour across industries. These formulas, which account for the non-additivity of output across industries and sectors that arises with chain-weighted aggregation, take the form:

where YA,t is a chain-aggregated measure of the quantity of private business output and HA,t is aggregate hours worked in private business, pA,t is the aggregate price deflator for private business value added, where Yi,t, Hi,t and pi,t are the same variables for industries i = 1,…,N, and where si is the share of aggregate nominal value added by industry i. If one ignores covariance effects that will derive from interactions between the growth rates In the above equation, the formula simplifies to the following approximation,
This equation shows that aggregate productivity growth is affected directly by average within-industry productivity growth and indirectly by relative changes in hours worked and prices across industries. When %Δ(Hi,t/HA,t) + %Δ(pi,t/pA,t) > 0, firms in the industry either attract more labour, experience relative price changes that increase their relative value weight, or both, thereby amplifying the influence of their productivity growth on the aggregate level. When this sum is negative, the opposite effects tend to occur, on balance. Only when both of these growth rates are zero will aggregate productivity growth be a simple value-weighted average of productivity growth across industries.
This decomposition is performed using KLEMS data from the BLS, which extend through 2013 and include selection of two- and three-digit NAICS industries that collectively span the private business sector. Before applying the formulas, each industry’s nominal gross output is converted to nominal value added by subtracting intermediate costs, and to real terms using formulas derived by Domar (1961). Real value added and prices for the private business sector are formed chain-aggregating across sectors. Consistency is not imposed between KLEMS and the published aggregates, so implied aggregate productivity growth estimates can differ somewhat from yearly published figures.
Table 1.1 decomposes private business productivity growth into total contributions by selected industries (column T) and into average contributions for each industry from within-industry productivity growth (column D) and from the combined effects of labour reallocation and relative price changes (column I). The decomposition is shown for 2004 to 2013, for the preceding 1995 to 2004 period, and as changes from 2013 to 2004 relative to 1995 to 2004. The decomposition for overall growth (first row) suggests that cross-sector reallocation played no meaningful role in the overall productivity deceleration, as the weighted average within-industry productivity deceleration – at nearly 2 percentage points – more than accounts for the deceleration in overall productivity growth. As in Figure 1.3, the within-industry slowdown is broad-based, with nearly all sectors – with the exception of the mining and financial, insurance, and real estate (FIRE) sectors – experiencing slower productivity growth from 2004 to 2013 than in the earlier period. Notably, the total contribution to the overall productivity slowdown from the FIRE sector is substantially negative, as price changes and reallocation away from that sector more than offsets this within-industry acceleration. It is also notable that even though productivity growth in high-tech sectors has slowed on the whole (most notably for computers and electronic products), these effects are mostly offset by labour reallocation and by relative price changes. The overall productivity deceleration remains broad-based after accounting for relative price and reallocation effects, with especially large negative contributions from the construction, finance, and service sectors.
Studies using firm-level data provide additional insights into the slowdown. One robust finding is that productivity varies substantially across firms even at the detailed industry level (Syverson, 2004; Foster et al., 2008; Foster et al., 2016b) and that such discrepancies persist over time. There is also tentative evidence that such productivity discrepancies across firms are widening over time (Decker et al., 2016) – and perhaps rapidly (Andrews et al., 2014). Recent evidence shows that variations in wages are primarily across firms rather than within firms (Song et al., 2015), which may imply that cross-firm differences in productivity or rent-sharing may be contributing to widening income inequality. These studies raise concerns that distortions are undermining the US economy’s allocative efficiency to a greater extent than in the past, as – holding all else equal – productivity would seemingly be boosted by redistributing inputs to the most productive firms in each industry. Such inefficiency could be contributing to the overall productivity slowdown.
Findings from firm-level studies point to a number of possible explanations for the slowdown (Foster et al., 2016b). One hypothesis is that the slowdown reflects cyclical influences (such as funding constraints or uncertainty) which should wane as slack narrows. Another possibility is that technological innovations are no longer diffusing from frontier firms to non-frontier firms as effectively as in the past, or that the cost of redistributing resources to more productive firms could have risen. Yet another explanation is that competitive pressures have diminished within industries, so that firms with better technologies are content to use this advantage to sustain higher mark-ups rather than acquiring additional capacity and driving out less efficient competitors. That said, productivity measurement is challenging, especially at more detailed levels of aggregation, in part because studies struggle to disentangle the role of quantities and relative prices in driving variations in nominal value added. Hence, it is also possible that variations in product quality and mark-ups are being misidentified as variations in physical productivity (Box 1.2 discusses measurement issues in more detail). Combinations of these various explanations cannot be ruled out as well.
One potential explanation for the productivity slowdown is that technological changes are boosting output in ways that are not being adequately captured by measurement techniques used for official statistics. If so, the policy challenges posed by the slowdown may not be meaningful. Evidence for this view is not yet convincing, in part because the magnitude of the slowdown is so large and because such mismeasurement problems are not new.
The mismeasurement hypothesis mostly boils down to challenge of inferring quantities when the characteristics of goods and services sold – and how they are produced – change over time. Although disentangling quantities from prices has always been a challenge, some argue that the problems are particularly daunting at present. For almost all final goods and services, quantity indexes are inferred by dividing measures of nominal value added by a price deflator. Ideally, the deflator should capture price changes over time for an identical item, adjusting for implicit changes in quantity that account for product characteristics. Examples where measurement may fall short of this ideal abound, especially when there are rapid changes in the mix of available products and where they are sold. Among other things, techniques fail to capture declines in effective prices as new products are introduced and as buyers substitute toward lower-priced sales outlets and toward imported goods, and may fail to adequately capture quality changes for products with rapid innovation (such as computer processors and televisions). Existing techniques are also not well equipped to account for fragmented production process that arise with globalisation, and, by construction, will likely fail to capture goods and services that are provided on the internet at no direct cost to consumers.
Some evidence suggests that high-tech capital goods may be particularly susceptible to such measurement biases, and may help explain why measured price declines for such goods have slowed even though technological advances in the sector have remained rapid (Byrne et al., 2015; Byrne and Pinto, 2015). If so, capital deepening may have been faster than recent estimates suggest. That said, since many high tech capital goods are imported, the implied mismeasurement of real output growth and productivity is likely modest. To be sure, price declines for some varieties of high tech capital with a higher concentration of domestic content (such as software) have also slowed, and measurement problems for these products could help explain a small part of the productivity slowdown.
Although measurement challenges clearly exist, it is not obvious that the effects on overall productivity are meaningful. Recent studies (Syverson, 2016; Byrne et al., 2016) suggest that the magnitude of such mismeasurement is likely modest compared to the observed productivity slowdown. As with high tech capital, many goods and services that have experienced rapid technological change are manufactured abroad, so such mismeasurement need not have meaningful effects on measured domestic production. As for globalisation, some evidence suggests that official measures may actually understate the foreign-produced content of outsourced intermediates, thereby contributing to over-measurement of output and productivity growth (Houseman et al., 2011). More broadly, problems associated with rapid technological change and other factors distort historical estimates as well, so it is difficult to form the appropriate historical counterfactual that would be needed to fully inform such a comparison.
The remainder of this chapter discusses in more detail the many influences that may be contributing to the productivity slowdown, starting with a discussion of business investment, moving on to innovation, then to many influences that may be damping business dynamism. The chapter then transitions to some evidence on whether market power has intensified and how this might be affecting productivity, then closes with a discussion about whether better management practises or public infrastructure provision might help compensate for influences slowing the pace of business productivity that may be beyond the reach of policy.
The business investment climate
A good portion of the slowdown in aggregate productivity growth over the past decade can be directly attributed to sluggishness in capital formation, especially following the financial crisis when investment failed to rebound as vigorously as in previous recoveries. This sluggishness may help explain some of the slowness of multifactor productivity as well, as exploiting new technologies frequently goes hand in hand with investing in the appropriate capital.
It is difficult to pinpoint specific reasons why capital formation has lacked vigour. Private capital formation has been broadly consistent with what one would expect given the historical accelerator relationship and the lower-frequency trends in business output growth (Figure 1.4). Therefore, the slow pace of capital formation can be regarded, at least in part, as a symptom of various longer-term influences that are restraining aggregate demand, such as lingering hysteresis effects that derive from the financial crisis, fiscal retrenchment, and limitations on the effectiveness of monetary stimulus at the zero lower bound (for example, Summers, 2014). If this is the case, policies designed to directly boost domestic aggregate demand more generally, such as fiscal policy, would help kick-start investment, especially if such measures were coordinated across countries to help negate leakages through imports (OECD, 2015a).
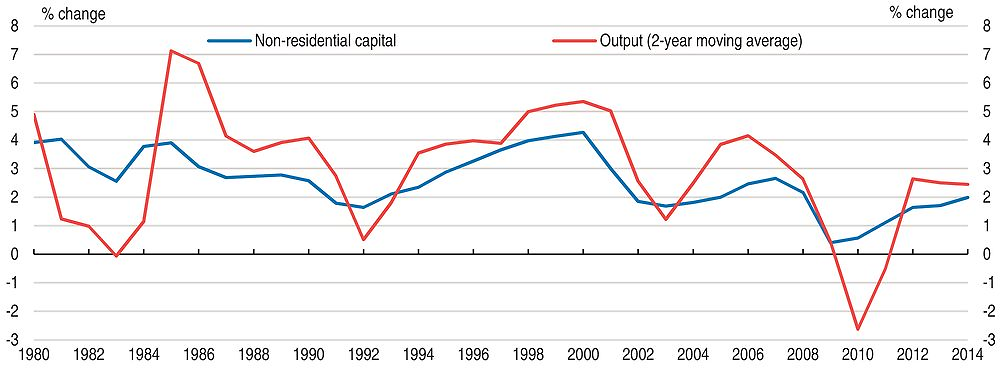
Note: Private business sector.
Source: OECD calculations using Bureau of Economic Analysis (BEA) capital stock estimates.
To be sure, the explanation that sluggish capital formation is wholly a symptom of weak demand is not entirely satisfying because business investment is itself a component of overall spending. Hence, factors that might be discouraging investment more directly – such as tight credit conditions, elevated uncertainty, and diminished business confidence – might also be a primary cause of aggregate demand weakness. If this is the case, it is not obvious that stoking aggregate demand would reinvigorate capital accumulation if the factors directly restraining investment are still in force.
That said, many plausible influences that were once thought to be directly restraining investment are fading in intensity as the recovery advances. The post-crisis jump in corporate leverage (as measured by aggregate ratio of debt to assets, in market value terms) has unwound, lending conditions have steadily eased, and uncertainty has descended toward historical norms (Figure 1.5). However, there are still signs that businesses are failing to undertake investments that would seemingly boost overall efficiency. In particular, nonfinancial corporations continue to accumulate low-yielding financial assets even though aggregate measures show that a wide gap has opened between the rate of return on productive capital – net of depreciation – and capital costs (Figure 1.6). Estimates from the BEA (Corea and Retus, 2015) suggest that a similar pattern also holds across industries. This gap suggests that the sluggishness of capital formation may reflect, at least in part, structural influences discussed in the remainder of this chapter, such as diminished market competitiveness and dynamism, reduced fluidity of productive inputs, or changes in how technology diffuses through the economy.
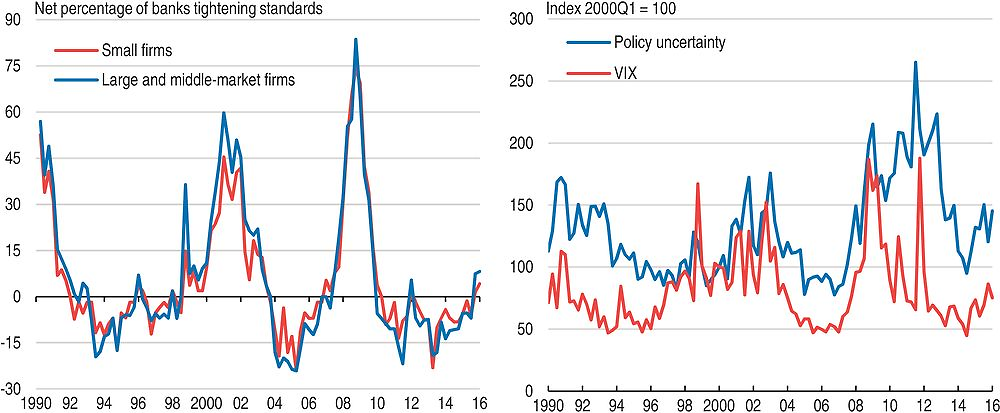
Note: Data for lending conditions are for commercial and industrial loans; uncertainty is measured by the Baker-Bloom Policy Uncertainty Index.
Source: Board of Governors of the Federal Reserve System.
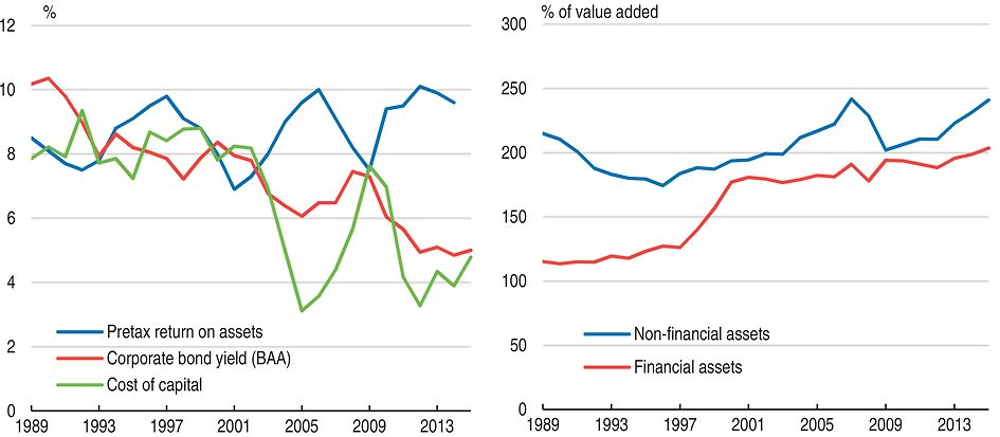
Note: Aggregates for non-financial corporate business. Assets are stated as a percentage of gross nominal value added. Return is calculated as net operating profit divided by net stock of produced assets. Cost of capital is bond yield minus the percentage change in the price deflator for non-residential fixed investment.
Source: OECD calculations using estimates from BEA and Board of Governors of the Federal Reserve System.
The role of innovative activity
Economists are engaged in a very active debate about whether the pace of innovation has slowed. If innovation has slowed, this might help explain the slowdown in both multifactor productivity and capital accumulation. Optimists, such as Brynjolfsson and McAfee (2011), argue that the underlying rate of technological progress remains rapid and that the observed slowdown reflects measurement problems or shortcomings in current business structures in adapting to the ongoing IT revolution. Pessimists, such as Gordon (2012), argue that productivity has permanently slowed because the quality of recent innovation pales in comparison to the transformative advances that occurred in the first half of the 20th century, and that these advances derived from exceptional circumstances that are unlikely to be repeated. As yet, there is insufficient evidence to dismiss either view.
Even though the debate about innovation quality is inconclusive, it is worthwhile to consider whether policy levers can be manipulated to boost innovative effort and exploit existing technologies more effectively. According to many measures, overall resources devoted to innovative effort remain in line with historical standards, and patenting activity has ascended rapidly in recent decades (Figure 1.7). Total private and public investment in research and development (R&D) has been hovering at around 2.5% of GDP for some time, somewhat above the OECD average (Figure 1.8). However, spending has been shifting from government to the business sector – especially since the financial crisis – with government supporting about one-sixth of business R&D through direct grants, procurement contracts, and non-refundable business tax credits. Such supports can favour incumbents with established reputations, and which are more likely to have tax obligations to offset with tax credits. Moreover, even though the design of the tax credit seems to provide comparatively stronger marginal incentives for additional R&D (OECD, 2015b), R&D tax subsidies as a share of GDP are relatively small in comparison with other OECD countries. In late 2015, the government took a positive step by making permanent the R&D business tax credit, which had expired at end-2014 and whose continuation had been uncertain for some time. Another positive step might be to make the R&D tax credit refundable for new firms, but this would need to be balanced against the administration costs of doing so.
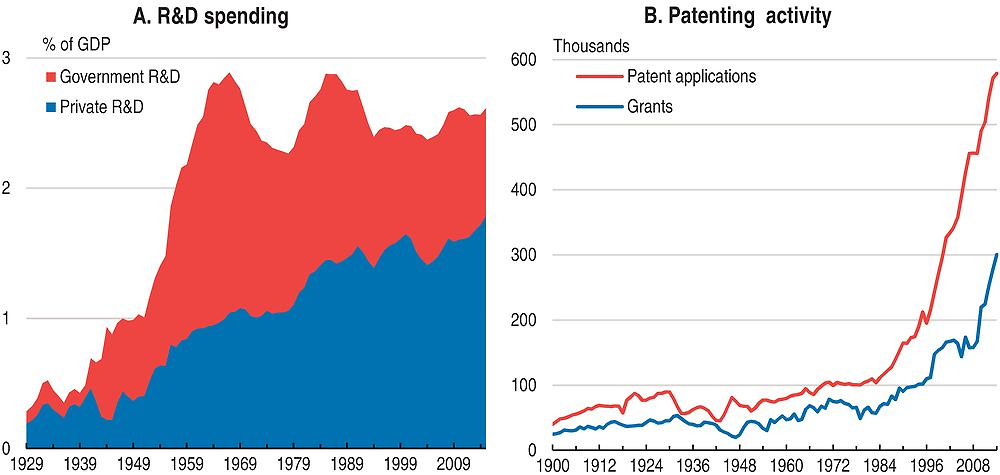
Source: United States Patent and Trademark Office (USPTO) patents; Bureau of Economic Analysis (BEA), R&D.
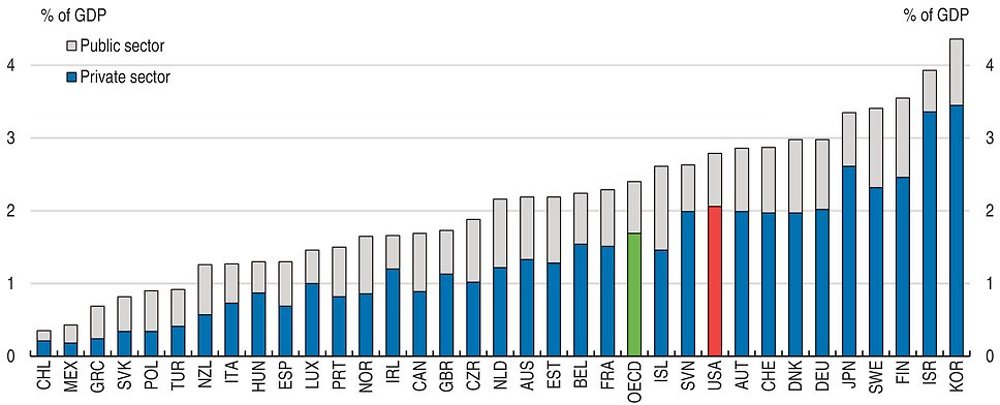
Note: 2012 or latest available year.
Source: OECD Science, Technology, and Industry Indicators.
More broadly, the gradual transition of R&D away from public research to business support may be inefficient given the substantial social externalities associated with many types of research. Social externalities are especially large for basic research and science, where research by universities and government have enabled the development of key technologies subsequently adopted by the private sector in areas such as agriculture, chemicals, healthcare, aerospace and information technology (Bernanke, 2011). Users of government R&D also need not navigate legal restrictions for private intellectual property, which boosts its social return. Other proposals have called for the establishment of a so-called patent box (or innovation box, in a US context), which lowers the tax rate on income from patents and intellectual property that may help firms internalise positive externalities from innovation. However, patent boxes cast a needlessly wide net, providing the greatest tax benefit to existing innovations, and windfall gains to existing patents. There is little evidence that this approach addresses positive externalities from R&D better than targeted government supports. Patent boxes also contribute to greater complexity in the tax system and may exacerbate problems with base erosion and profit shifting.
Evidence about the pace of technological change at the firm level is limited, but available evidence suggests that the deceleration of productivity owes more to structural issues that affect the diffusion of technology following an innovation than to the pace of innovation, per se. Evidence from firm-level data shows that shocks to multifactor productivity are no less prevalent than in the past (Decker et al., 2016), but that firms are no longer reacting as aggressively to scale up operations when favourable shocks occur (Decker et al., 2016; Guzman and Stern, 2016).
Structural issues related to intellectual property rights may help explain why shocks to multifactor productivity are not triggering firms to expand as aggressively as in the past. Inability to obtain timely patents may be one such issue. Evidence suggests that small firms that obtain patents are able to gain financing and expand operations more easily than otherwise, and that delays in the patenting process can hinder growth (Farre-Mensa et al., 2015). Patent processing delays rose substantially through much of the 2000s, with the time from submission to action increasing around 12 months over a decade (Figure 1.9). Following the introduction of the America Invents Act in 2012, the US Patent and Trademark Office (USPTO) made progress in working down the application backlog and reducing the time for examiners to review applications and then grant or deny patents. Further reductions have been targeted, and patent fees have also been reduced for small firms. Despite progress to date, the USPTO should work to further shorten processing times in ways that do not undermine patent quality.
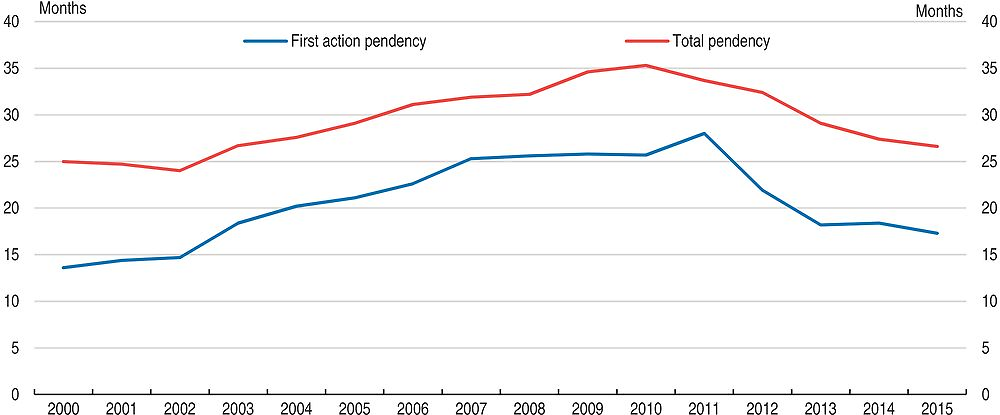
Source: USPTO.
Firms incorporating new technology may also be targeted by patent assertion entities, or “patent trolls” (Chien, 2015), whose business model is primarily to purchase and accumulate patents in hopes of extracting payoffs from firms. While such entities can play an important role in monetising innovation, they can also unfairly impede innovation by new firms. More work – be it from further legislative, judicial or executive actions – is needed to curtail abusive litigation. In 2014, the Supreme Court acted to give the court discretion to shift the attorney fees to the loser of patent litigation as a deterrent to rent-seeking, and the Federal Trade Commission (FTC) is currently undertaking an investigation of patent assertion entities. Similarly, entrepreneurs can be restrained by the need to obtain licensing fees with owners of existing technology in order to build upon or modify intellectual property. Such situations can encourage rent-seeking by licensors, especially in cases where the existing technologies enjoy a dominant market position. Public policy measures could help level the playing field in these negotiations, such as by requiring dominant players to offer standardised licensing agreements that generate a fair return.
Since patents temporarily grant market power to innovators, calibrating a patent regime to encourage innovation likely entails meaningful trade-offs in terms of income inequality – and inefficiency more generally. Aghion et al. (2015) confirm that US States with more innovative activity tend to exhibit wider inequality in market income. Even so, innovation appears to contribute only modestly to overall income inequality overall (about 17% of the increase in top 1% income share between 1975 and 2010). Moreover, inequality associated with innovation appears to be more favourable in nature than that driven by other sources, since it is associated with upward income mobility. Although inventors do tend to ascend the income scale, their improved position does not become entrenched because the rents are temporary and is subject to creative destruction by subsequent innovators. Evidence from this research also suggests that policymakers can blunt the positive impetus to productivity and social mobility from innovation by yielding to lobbying efforts by incumbents seeking to lock in rents.
Business dynamism and technological diffusion
Numerous indicators show that the US business sector is becoming less dynamic: Entry rates by new establishments have been slowing, incumbents are exiting less frequently, the typical establishment is becoming older, and failure rates for start-ups are trending upward (Figure 1.10). Moreover, these signs of waning dynamism are broad-based across industries, geographic areas and firm sizes (Hathaway and Litan, 2014). Evidence also suggests that inputs are not flowing as fluidly as in the past to the firms and industries where they would be most valuable, thereby inhibiting allocational efficiency. As mentioned earlier, firm-level studies show that available measures of productivity vary widely across firms within narrowly defined industries (Syverson, 2004; Foster et al. 2016b) and that this dispersion may be widening (Decker et al., 2016).
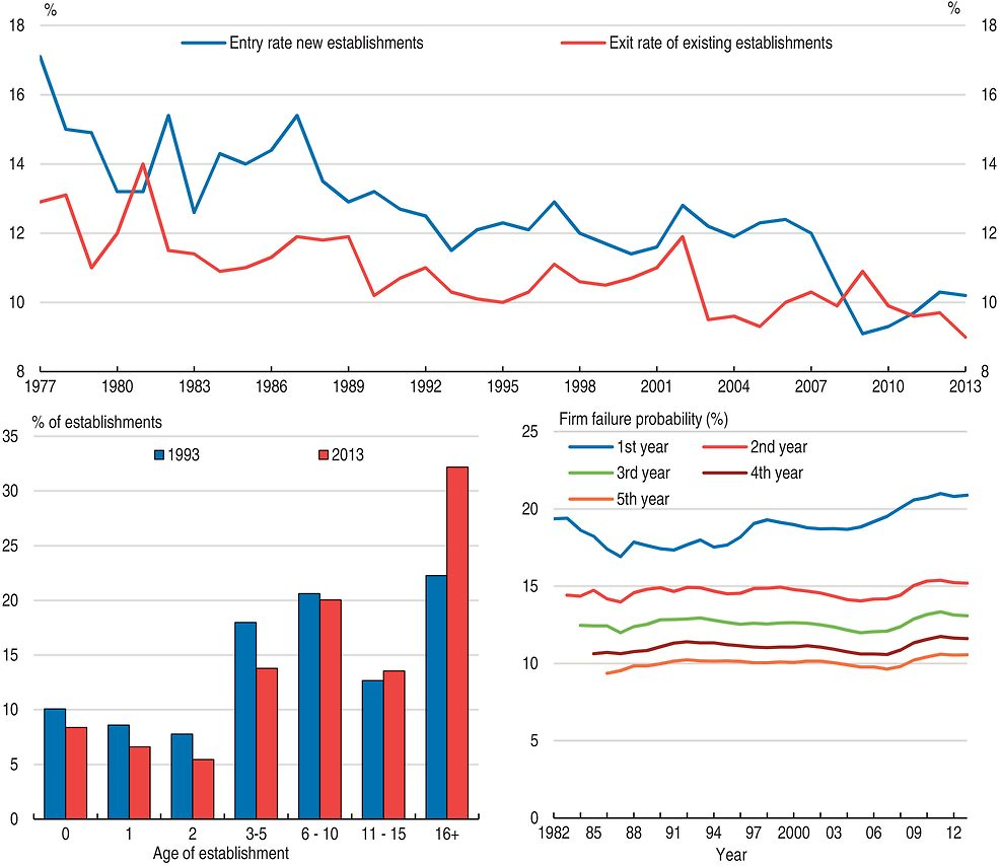
Note: The establishment entry and exit rates are the number of new and closed establishments as a percentage of total establishments, respectively. The failure rate is number of failures divided by average number of firms in the current and preceding year. The data shown for failure rates are five-year moving averages.
Source: OECD calculations using Business Dynamics Survey, Census Bureau.
Waning business dynamism may also be contributing to widening income inequality and diminished intergenerational income mobility (Aghion et al., 2015). In addition to showing that some firms systematically pay higher wages than others, the firm-level evidence cited earlier by Song et al. (2015) also shows that cross-firm variations in wages explain nearly all of the widening of labour income inequality in recent decades. These developments suggest that the economic forces that translate technological innovations at the firm level to overall gains in wellbeing may not be functioning as well as in the past.
The slowdown of business dynamism is also closely linked with signs that new firms are becoming less prevalent, and that productive young firms are becoming less of an impetus for creative destruction than before. Previous research demonstrates that young firms play a key role in promoting allocative efficiency, by adopting new technologies, expanding rapidly, and thereby placing competitive pressures on incumbents. This disruptive influence helps boost overall productivity growth, in part by driving out less productive firms (for example, Haltiwanger et al., 2013). Decker et al. (2015) show that the overall decline in entry rates for new firms has been accompanied by signs that, over the past decade or so, fast-growing young firms are not pushing the pace of economic growth as before.
To be sure, business dynamism – and especially start-ups – may have been restrained to some extent by lingering aftereffects of financial crisis that are likely fading as the recovery advances. In the years following the crisis, entry rates fell below exit rates in many markets, intensifying market concentration and thereby dampening competitive pressure on incumbents. Weak aggregate demand conditions no doubt discouraged new firms from entering some markets, the collapse of home equity erased collateral that could otherwise have been tapped by entrepreneurs, while income inequality likely hindered the ability of some would-be entrepreneurs to accumulate savings. Transitory constraints on funding availability also likely played an important role, as tighter credit conditions hit small firms especially hard due to their limited collateral (Figure 1.11). Failures and consolidation in the banking industry disrupted lending relationships with small businesses, which can play an important role in overcoming problems with imperfect information.
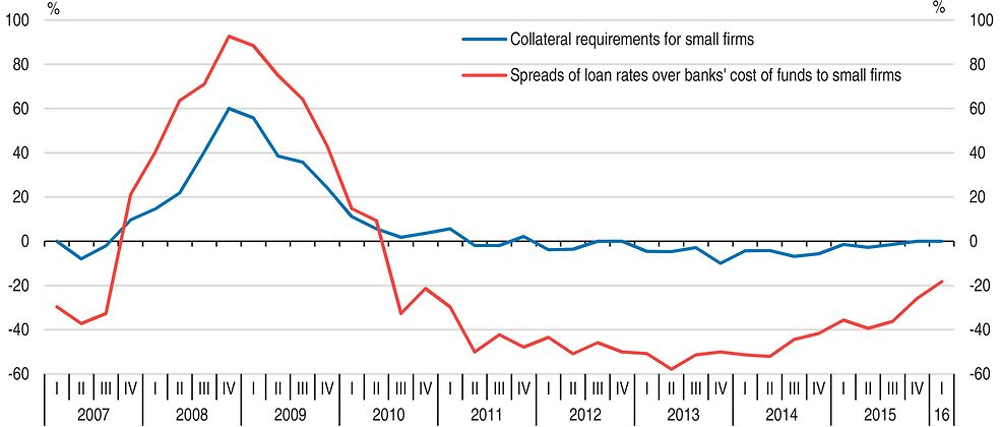
Source: Federal Reserve Senior Loan Officers Survey.
Some of this post-crisis tightening of financial conditions can also be attributed to post-crisis measures intended to address shortcomings in prudential and macro-prudential policy, which could potentially leave a permanent negative imprint on credit availability and business dynamism. Time will tell whether policymakers need to recalibrate these measures as the trade-offs between financial stability and funding availability become more apparent. The financial industry continues to develop new forms of intermediation that may entail less risk for the banking system (such as crowdsourcing and FinTech). Although these new funding models could help satisfy funding needs for new businesses, it remains to be seen whether innovations can entirely fill shortfalls in traditional bank lending.
Secular influences are likely contributing to the longer-term declines in business dynamism as well. Some of these influences may be beyond the direct influence of policy, such as demographic forces that are gradually shifting a greater share of the population into older age ranges that tend to be associated with slower rates of business formation (Liang and Lazear, 2014). There are also signs that an increasing share of industries are impacting by technologies that accentuate scale economies and “winner-take-all” effects, thereby contributing to market concentration. For example, larger retail firms (such as Walmart) can gain enduring economies of scale advantages over potential entrants by establishing large supply networks and by using their leverage over suppliers to help narrow overall mark-ups for their products. Outcomes in the high tech sector also frequently suggest that network externality effects can push a single firm (such as Facebook) to a dominant position.
However, policy settings may have traction on some secular influences. At the federal government level, policymakers might reconsider laws that govern competition policy, as merger and acquisition activity is showing signs of blunting market forces in some industries. This is particularly apparent in the high-tech industry, where deep-pocketed incumbents have acquired promising young firms – such as the recent acquisition by Facebook of WhatsApp. While such acquisitions need not blunt incentives for market entry, they tend to side-line the strong-performing young firms that play a key role in pushing market innovation and challenging incumbents.
In addition, reforms to the personal bankruptcy code in 2005 made it more difficult for entrepreneurs with “high incomes” to declare Chapter 7 bankruptcy, and put limits on the how quickly an entrepreneur could re-enter bankruptcy proceedings. Although failed entrepreneurs can still opt for Chapter 11 bankruptcy, this route is more onerous because it requires the filer to set out a repayment schedule, thereby heightening risks that entrepreneurs would be saddled with debt repayment obligations if they were to fail. Indirect evidence suggests that this change may have raised the implicit costs of starting a business (Figure 1.12), prompting a noticeable overall decline in personal bankruptcy filings prior to the financial crisis, and encouraging a shift in ownership from sole proprietorships and partnerships toward the more costly option of incorporation (Paik, 2013). States that have offered exemptions for the new Chapter 7 rules have done comparatively better than other States in generating firm creation (Rohlin and Ross, 2016), suggesting that more onerous personal bankruptcy rules have inhibited firm creation. However, the repercussions of stricter bankruptcy laws for firm creation are complex, as some research suggests that stronger creditor protections might also increase credit availability for some borrowers (Cerqueiro et al., 2016; Gropp et al., 1997).
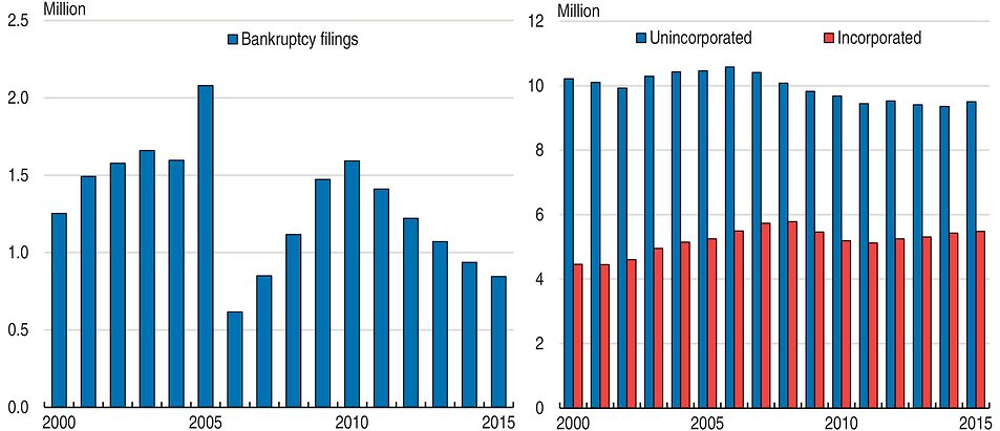
Note: Incorporation and non-incorporation are measured as the number of self-employed workers with each designation.
Source: United States Courts, BLS CPS.
Policy-driven distortions from state and local regulations may also be obstructing the fluidity of resources across firms and industries. In particular, occupational licensing requirements that vary across States have become more pervasive in recent decades, perhaps contributing to the decline in inter-state migration documented by Molloy et al. (2014) and others. Such licensing has grown considerably in past decades (Kleiner and Krueger, 2013), with recent estimates from the household survey suggesting that about 25% of employed persons in 2015 were either licensed, certified, or both. Although this growth has been driven, to some extent, by shifts in the composition of economic activity towards sectors where the overall public interest in licensing is very compelling (such as healthcare), there are signs that licensing differences across jurisdictions are restricting labour flows and distorting wages in some occupations. Evidence suggests that people in licensed occupations are less likely to move across state lines (CEA, 2015), and that wage premia increase over time in jurisdictions and occupations where licensing requirements are introduced (Han and Kleiner, 2015).
Indicators and anecdotal evidence also suggest that restrictions placed by local zoning may also be inhibiting allocative efficiency (Furman, 2015). In highly productive areas, zoning constraints can artificially restrict housing supply and thereby raise the cost of living and driving lower-skilled persons from these areas (Ganong and Shoag, 2015). Restricting low-skill workers from these markets can lead to skill mismatches that diminish allocative efficiency, dampen overall productivity growth, and help lock in income inequality across geographic areas.
The role of market power
There are many indications that market power may be increasing, on balance. The recent divergence between labour and non-labour compensation – reflected in the rising income share of non-labour compensation in many sectors (Figure 1.13) – may be a symptom of gains in overall market power, as is the fact that profits by domestic corporations have risen to an unusually high proportion of GDP (Figure 1.14). The widening distribution of market incomes may also be consistent with rising market power. However, evidence from these aggregate measures is not conclusive, as a host of compositional shifts and other influences are also affecting the labour share (Elsby et al, 2013; Rognlie, 2015). In addition, though profits by US corporations are hovering near record levels in relation to GDP, much of this increase has been driven by net profit remittances from abroad.
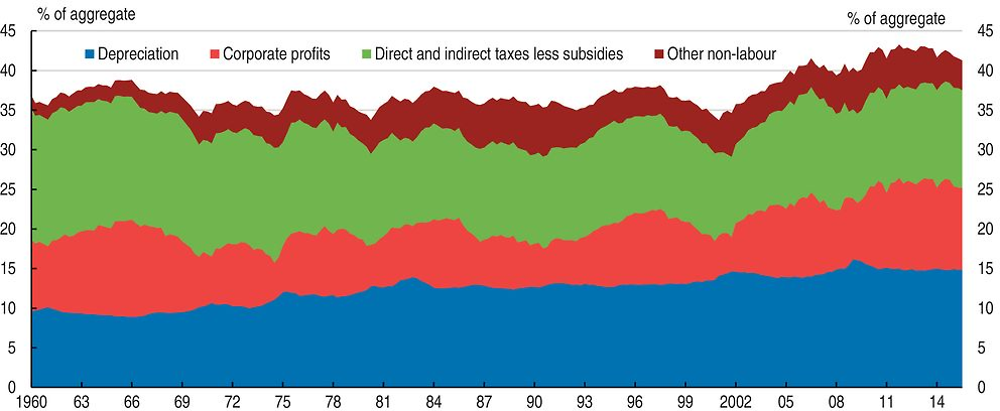
Note: Share of non-financial corporate business income.
Source: BEA.
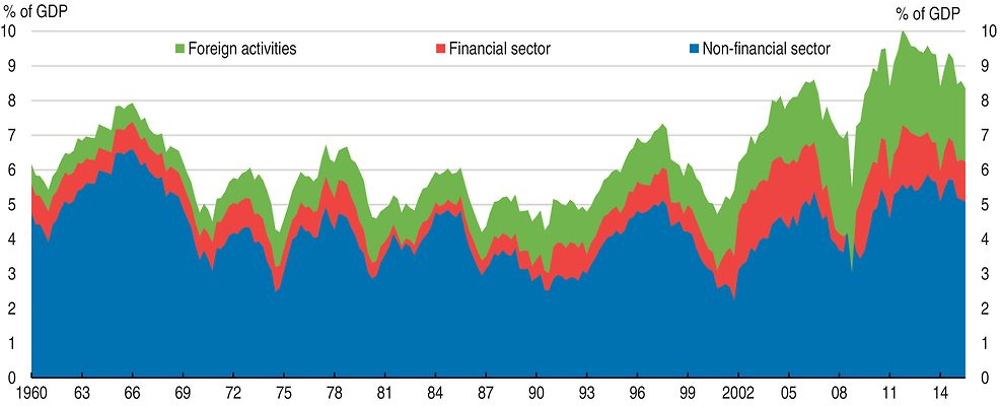
Source: BEA.
Some evidence does suggest that market power may be increasing at the industry level, on balance. Various measures of market shares show that most markets have become more concentrated since the early 2000s (Figure 1.15). This concentration process was already underway prior to the financial crisis, and gained momentum in its aftermath in the face of attrition by smaller firms and diminished market entry. This concentration has coincided with signs of diminished competitive pressures in many markets.
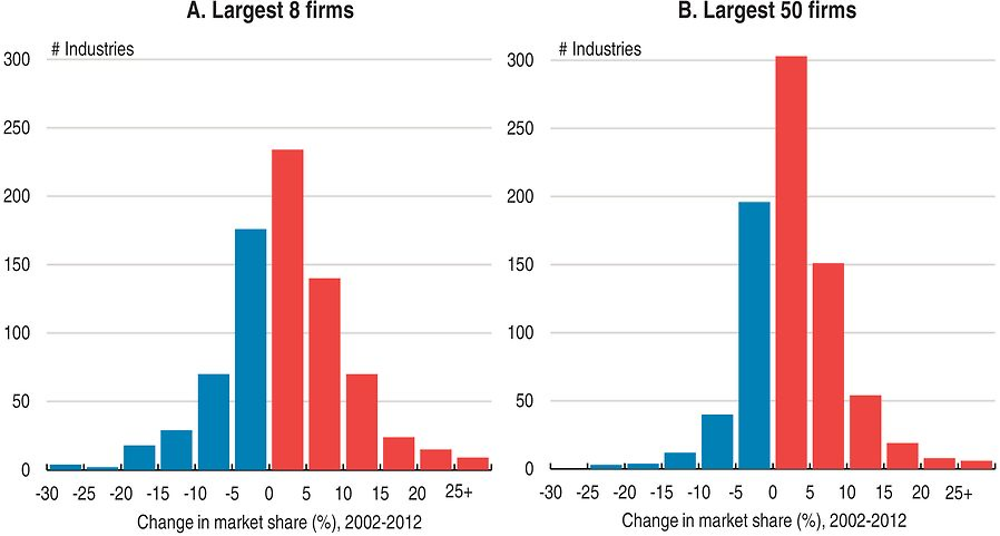
Note: Data are for the 719 six-digit NAICS industries that are consistently defined from 2002 to 2012.
Source: OECD calculations using data from the quinquennial Economic Census.
Historically, productivity and relative prices have exhibited a tight inverse relationship across industries, as the initial jump in price margins following a productivity gain attract additional competition and boost relative supply. This negative correlation is an important means through which the benefits from productivity gains are disseminated broadly, as falling relative prices and freed up resources contribute to enhanced household purchasing power and well-being. Recently, the strong inverse relationship between relative prices and productivity at the industry level has become substantially looser (Figure 1.16), and, moreover, a much larger proportion of industries are seemingly able to sustain simultaneous increases in relative prices and productivity. These developments suggests that firms in many industries have greater scope to sustain higher mark-ups following productivity gains, consistent with diminished competitive pressures. Box 2.3 takes a more formal look at the empirical link between mark-ups and market concentration at the industry level.
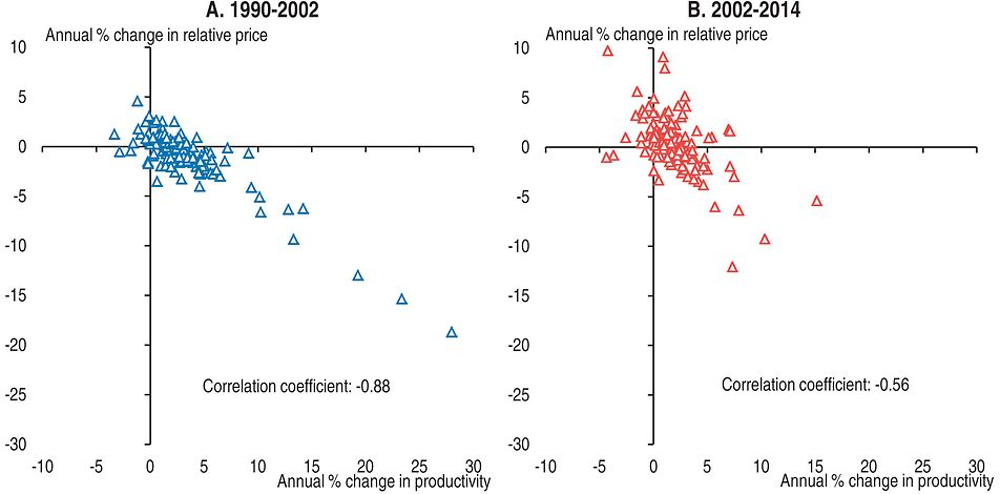
Note: Productivity is calculated as real gross value added per hour for industries at the four-digit NAICS level.
Source: OECD calculations using annual industry-level estimates from the BLS.
Increasing market shares likely owe to a number of influences. Consolidation may be consistent with market forces seeking out more efficient production processes in some industries where technology exhibits increasing returns to scale. The multi-decadal slowing of business dynamism (discussed earlier) has likely diminished competitive pressures somewhat, especially as credit conditions tightened in the aftermath of the financial crisis. Market consolidation may also be consistent with anticompetitive behaviour. Even with cyclical fluctuations, merger and acquisition activity has been elevated for over 25 years (Figure 1.17), and has been especially prevalent in a number of industries – such as retail, telecommunications, and pharmaceuticals – where consolidation is especially evident. Antitrust authorities at the Department of Justice and the Federal Trade Commission (FTC) have actively used the judicial system to combat anticompetitive behaviour, but they must choose targets carefully as the burden of proof for such cases has been interpreted more stringently by the courts (even though competition laws have not changed). Even so, recent actions seem to have paid substantial dividends in terms of lowering margins and intensifying competitive forces, such as measures that effectively blocked proposed mergers of T-Mobile with other mobile phone carriers (AT&T in 2011 and Sprint in 2014). The FTC has also been actively rooting out other anticompetitive behaviour, such as “pay-for-delay” agreements in which pharmaceutical companies offer patent settlements that pay producers of generics not to market lower-cost alternatives. Although continued vigilance is appropriate, legislative measures may be warranted to either broaden the scope of existing antitrust laws or to clarify their interpretation.
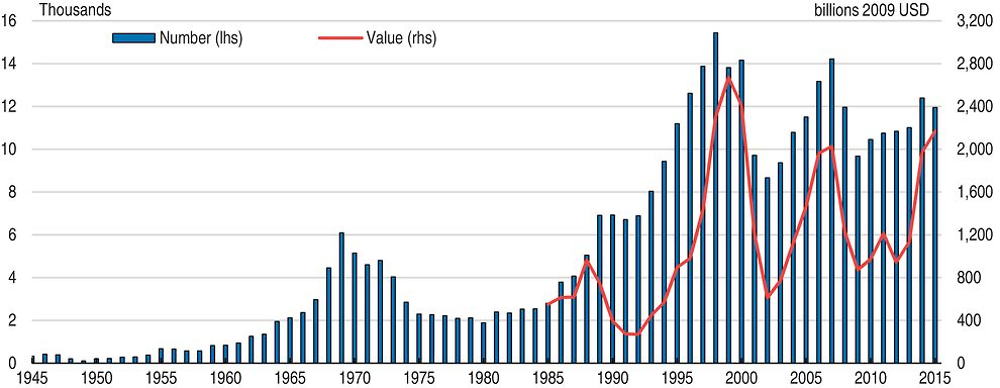
Source: Institute for Mergers, Acquisitions and Alliances.
This box investigates the empirical relationship between mark-ups and concentration using available data at the detailed (six-digit NAICS) industry level. In practise, market shares in a given industry could be a misleading proxy for market power, as the competitive environment in a given industry likely also depends on a host of other characteristics such as the elasticity of demand, the intensity of import competition, the prevalence of increasing returns to scale, the number of firms contesting local markets, and the nature of strategic interaction.
To estimate whether there has been an empirical relationship between the two measures, annual industry-level data on market shares from the quinquennial Economic Census in 2002, 2007 and 2012 are paired with corresponding annual estimates from the Bureau of Labor Statistics of the mark-up of prices over unit labour costs (a proxy for the mark-up over marginal costs) for detailed (six-digit NAICS level) industries. Since industry definitions in the NAICS evolve somewhat over time, market shares are only used for industries whose definitions were unchanged in the available census years and for which mark-up estimates are available from the BLS. Measures of the market share are available for the largest 4, 8, 20 and 50 firms in each industry. Figure 1.18 shows a scatterplot of the change in market share of the 8 largest firms and the change in mark-ups for 105 industries from 2002 to 2007 and from 2007 to 2012, after removing industry fixed effects. A positive association between the two measures is visually apparent, and is broadly similar to that using the other market share measures.
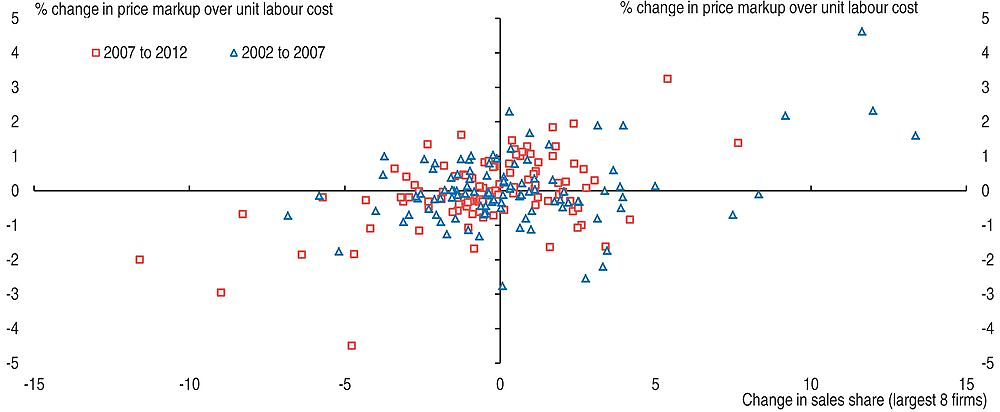
Note: Data for 105 six-digit NAICS industries that are consistently defined from 2002 to 2012 and that can be paired industry-level productivity estimates. Industry fixed effects have been removed. Mark-up is industry price level divided by unit labour cost.
Source: OECD calculations using annual industry-level estimates from the BLS and market shares from the quinquennial Economic Census.
This positive association is confirmed by results shown in Table 1.2, which shows estimated panel regressions that project the annual rate of change in the mark-up from 2002 to 2007 and from 2007 to 2012 on the average annual change in each available measure of the market share. These regressions control for both industry and period fixed effects. All specifications show a highly significant and economically meaningful positive association between changes in an industry’s market concentration and its mark-up. The estimated responsiveness of the mark-up to a one percentage point increase in the market share ranges from 1.1% to 1.7%, depending on the measure. Not surprisingly, estimated year effects (not shown) suggest that the financial crisis and its aftermath placed downward pressure on industry mark-ups notwithstanding any effects associated with market concentration; excluding this effect does not materially alter the coefficients shown.
The overall effect of concentration on mark-ups from these panel regressions can be decomposed to provide further insight into how increases in market share are affecting households. The percentage change in the mark-up of industry i can be expressed as contributions from the percentage changes in its relative price, its real wage, its output, and its labour hours:

where pA,t is the overall price deflator for non-farm business output. Hence, the effect of a change in market share can be decomposed into separate effects from each of these components. Table 1.3 shows results of separate panel regressions for each of these components, where each regression includes controls for industry and period fixed effects. (By construction, the overall effect on the mark-up in Table 1.2 is the sum of these relative price and output effects, less the sum of these effects on real wages and hours.) These regressions indicate that mark-ups have a large and statistically robust effect on output, but that the effects on relative prices, real wages, and hours are smaller in magnitude and cannot be distinguished from zero at standard levels of statistical significance. Although the point estimates show that intensifying market concentration in a given industry was associated with productivity gains that lowered real unit labour costs, these efficiency gains do not appear to have passed through to households in the form of lower relative product prices or higher real wages.
Innovative management practises and productivity
Management practises can be thought of as a type of intangible capital that is ultimately reflected in both productivity and profitability, as superior practises induce better outcomes out of a given set of productive resources. A growing body of firm level evidence suggests that managerial practises can have considerable effects. For example, results in Bloom and Van Reenen (2007) show that cross-firm variations in management quality can explain between roughly a quarter and a half of cross-firm variations in productivity and profitability. Consistent with the link between business dynamism and competition discussed earlier, their study documents a meaningful positive association between a firm’s management quality and the intensity of competition in its product market. Evidence suggests that management quality is also negatively associated with whether a firm’s upper management was chosen strictly by hereditary succession – perhaps hinting at additional linkages between productivity and income inequality. Studies that track corporate asset returns when top executives switch employers suggest that at least some of this intangible is associated with the skills of specific managers (Bertrand and Schoar, 2003).
One specific way that management can boost firm performance is by adopting non-traditional human resource practises that might help attract a more productive mix of workers and boost labour effort. Numerous studies have documented links between productivity and non-standard human resource practices such as work teams (Boning et al., 2007) incentive pay mechanisms (Lazear, 2000), and high performance work practices (OECD, 2016). Another set of human resource innovations that are of particular interest to policymakers are family friendly work policies and flexible working conditions – such as paid parental leave, child care assistance, and flexible work hours. Studies about the effect of such initiatives on productivity are hard to come by, but some evidence does suggests that such programmes can pay off in terms of reduced labour turnover costs, diminished absences, and retaining productive employees (Thévenon and Solaz, 2013; Bassanini and Venn, 2008; Bloom et al., 2011a). Such advantages have prompted many employers to introduce flexible work initiatives on their own accord: For instance, survey data from the National Study of Employers (Matos and Galinsky, 2014) show that about 43% of employers allow employees to opt for a compressed workweek versus 38% in 2008, while 67% of employers now allow employees to occasionally work from home compared to 50% in 2008.
Even so, the business case for more costly flexible working conditions (such as employer-funded childcare and paid leave) is not always straightforward. For instance, 58% of employers provided some form of replacement pay for maternity leave in 2014, but, of these, only 9% provided full replacement, while the remainder offer only partial pay replacement either directly or indirectly in the form of temporary disability insurance benefits (Matos and Galinsky, 2014). Given the positive social externalities associated with labour market attachment and having workers allocate themselves to activities where they provide the highest social value, there is a compelling case that additional policy support could encourage workers with children to select jobs where they are most productive, thereby improving labour allocation and overall productivity. Existing US government programmes do provide some limited support, such as the Family and Medical Leave Act (FMLA), passed in 1993, which ensures that workers in large companies can take up to 12 weeks of protected unpaid leave. Many employers also sponsor Dependent Care Assistance Plans that allow workers to pay child care expenses using pre-tax dollars. If the authorities did opt for more comprehensive support measures, they might build on the successful experiences with Paid Leave programmes at the state level (California, New Jersey, Rhode Island and soon New York) by developing a national social insurance programme that provides paid leave for all workers funded through a small increase in the payroll tax.
Harnessing complementarities between business productivity and public infrastructure
Public infrastructure has not kept pace with the economy. The rate of increase in the government capital stock (Figure 1.19) has slowed to a crawl over the past decade, and countless anecdotes point to deterioration in public infrastructure. The World Economic Forum’s Global Competitiveness Report ranks US infrastructure below most of its G-7 peers, including France, Germany, Japan, and Great Britain. The gradual deterioration of US infrastructure contributes to declines in overall wellbeing in a wide variety of respects, including longer commutes, congestion, shortages of suitable water, poorer school resources, and vulnerability to natural disasters (to name just a few). Since many types of infrastructure complement productive activity, this deterioration also weighs on productivity. For example, the CEA estimates suggest that negative externalities from congestions are costing American families and businesses USD 120 billion per year, 30 billion of which can be traced to truck congestion. These costs are felt in a number of dimensions, including sub-par performance of public utilities (including communications), increased costliness of transporting goods and materials, and substantial losses in household time.
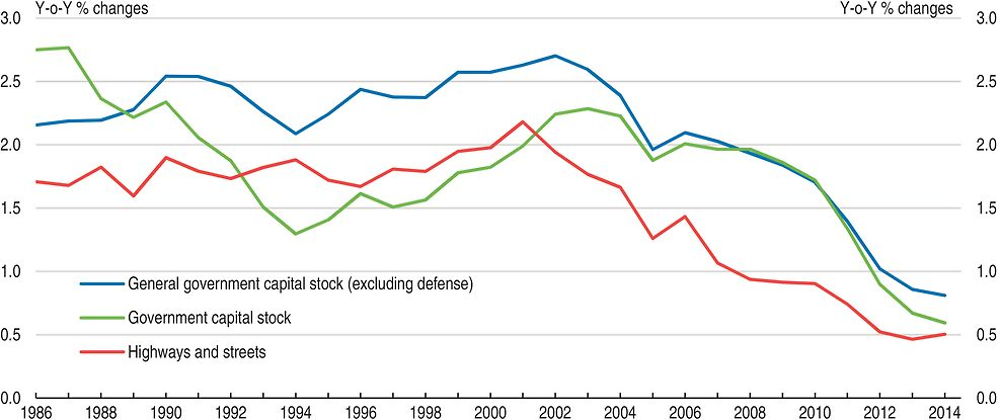
Source: OECD calculations using BEA capital stock estimates.
Potential side effects of deficiencies in public infrastructure are particularly evident when comparing differences in productivity across large metropolitan areas. Most economic growth is metropolitan, with some areas performing very well and other cities and rural areas lagging behind. Although broader economic forces have played a role in these variations, self-inflicted problems stemming from ill-adapted governance structures also seem to be holding parts of the country back. In a recent study that analysed the agglomeration benefits of urban areas in the United States and four other OECD countries, Ahrend et al. (2014a) find that productivity is positively associated with city size in all five countries, and the strength of the relationship is strongest for the US. Estimates suggest that a doubling in a US metropolitan area’s population, holding other factors constant, generally increases its productivity by about 6.3%. However, several metropolitan areas in the US fall short of this benchmark given their population size (Figure 1.20). Some metropolitan areas that appear to perform relatively poorly, such as Atlanta, Miami and Houston, have in common that they are less compact and accessible. The set of metropolitan areas that are more productive includes some of the more accessible and connected cities, such as San Francisco, Washington and Boston (Hamidi and Ewing, 2014; Owen and Levinson, 2014).
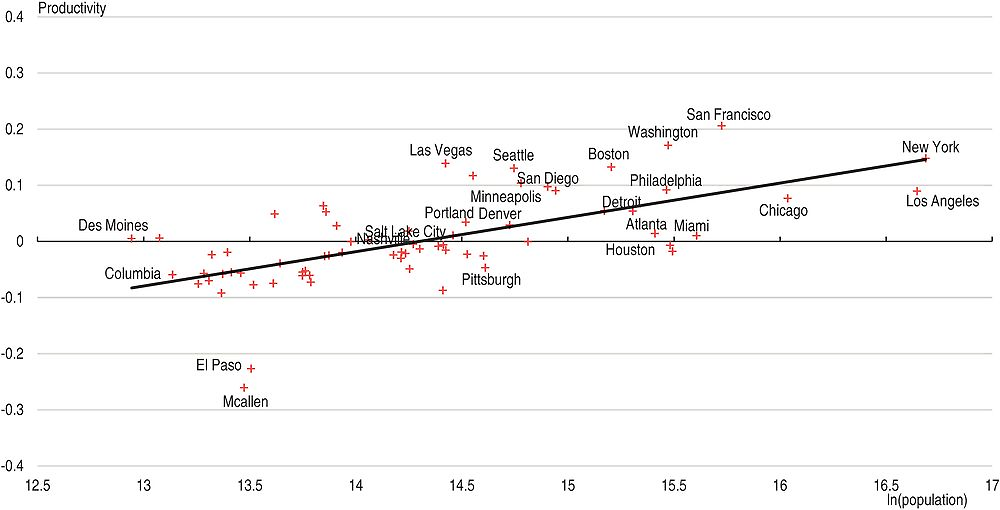
Note: Productivity is defined as the wage premium associated with each metropolitan area after accounting for characteristics of its workforce. This premium is estimated in separate regressions that control for the individual characteristics of the workforce in order to account for sorting of individuals to metropolitan areas.
Source: Ahrend et al.
Larger-sized urban agglomerations are usually associated with higher productivity. Since state and local governments make most decisions regarding infrastructure provision, the positive effects of agglomeration may go unrealised if infrastructure provision is not well coordinated across local jurisdictions. Generally, the capacity for co-ordinated planning across such jurisdictions is relatively under-developed and is subject to co-ordination failures. Empirical evidence suggests that these problems mitigate the benefits of agglomeration. Ahrend et al. (2014a) show that a city with twice the number of municipalities within its functional boundaries is on average about 3.4% less productive, holding other factors equal. However, negative effects from fragmentation on productivity is cut by almost half when a governance body exists at the metropolitan level (Ahrend et al., 2014b). This suggests that metropolitan governance arrangements that reduce fragmentation have the potential to boost overall productivity by helping to better harness the gains from agglomeration.
The lack of coordination across jurisdictions is manifested, in part, in urban transport systems that are not integrated across jurisdictions (OECD, 2012). Empirical work that has looked at functional urban areas within the OECD suggests that improvements in city governance can help boost private productivity (Ahrend et al. 2014a), both by improving allocative efficiency and by helping to harness externalities. The federal government has some scope to help solve such coordination problems using various incentives such as formula-based funding and competitive grants, as well as through programmes that provide information to State and local authorities. Some federal programmes have been directed to encourage co-ordination at the metropolitan level regarding infrastructure that contributes to wider social and environmental goals, but the outlays to date are relatively small. The Transport Infrastructure Finance and Innovation Act (TIFIA) of 1988, which is a major source of transportation funding for larger population areas, requires the existence of a Metropolitan Planning Organization as a precondition for funding. Another existing initiative, the Moving Ahead for Progress in the 21st Century Act (MAP-21), develops performance metrics to evaluate the impact of government investment. Building on these evaluations will be an important means to prioritise future investment and will help the federal government better leverage its future efforts to overcome co-ordination difficulties.
Revenue constraints at the state and local level may contribute to shortfalls in public infrastructure as well. Federal government funding is one way to help alleviate these constraints. The TIFIA programme provides the federal government with additional tools (such as loan guarantees and standby lines of credit) that can help steer State and local governments toward financing sources other than municipal bonds that are better suited to a project’s risk profile. TIFIA has also helped develop the market for public-private partnerships (P3s) that can overcome funding constraints at the State and local level. The federal government has further supported P3s by establishing a Build America Transport Investment Center to support States in their implementation.
Funding constraints are particularly acute for surface transport infrastructure. Existing transportation networks are deteriorating and not keeping pace with demand. The main federal funding source for road transport, the Highway Trust Fund, has required repeated injections from general revenue, as the nominal (per-gallon) gasoline tax intended to fund road transport infrastructure has not been adjusted since 1993. After a series of last-minute fixes, the Fixing America’s Surface Transportation Act in December 2015 secured funding for the trust fund from general revenues until 2020. In the absence of rate increases, revenues from the gasoline tax will need to be supplemented on an ongoing basis from general revenues, as a combination of tightening in Corporate Average Fuel Economy Standards, the spread of electric cars, and hydrogen fuel cells have acted to increase fuel efficiency and diminish gasoline usage (Geddes, 2015). The increasing shortfall of the Federal Highway Trust Fund and uncertainty over future federal transportation infrastructure funding arrangements have triggered state initiatives to raise funding, including via higher state gasoline taxes and toll roads.
Surface transportation infrastructure funding could be put on a sounder footing by making better use of user fees to address negative externalities more effectively. For example, heavy trucks account for just 4% of road users but represent almost one-quarter of the road maintenance costs, mainly because they cause greater damage to the road pavement (Austin, 2015). Boosting user fees for heavy trucks would help users internalise these externalities. Electronic distance-based charges are one way of implementing cost-based user fees. These have become more widespread in Europe following their introduction in Austria, Germany and Switzerland in the early 2000s. In Germany, the mileage fee is based on the truck’s axle weight and emission class. In addition, user tolls in urban areas help reduce congestion while providing funding to support needed improvements and expansion – which is becoming increasingly costly in built-up areas. While such fees would likely have direct adverse distributional consequences, less regressive approaches are available. For example, high-occupancy or express toll lanes can be used to help mitigate congestion without necessarily imposing fees on low-income drivers. This approach was pioneered in California in the mid-1990s and has been adopted more widely by other States. The UK provides another notable alternative, as London has introduced a congestion charge for vehicles entering the city centre, combined with a boost in investment on mass transit to broaden travel alternatives.
Key recommendations
-
Boost investment in, and maintenance of infrastructure; in particular, promote mass transit. Use federal programmes to encourage co-ordination across State and local jurisdictions.
-
Make R&D tax credits refundable for new firms.
-
Ensure personal bankruptcy procedures do not undermine incentives for entrepreneurship.
-
Continue to speed up patenting decisions in line with targets without compromising patent quality.
-
Adapt antitrust policy to new trends in digitalisation, financial innovation and globalisation. Strengthen compliance with merger remedies.
-
Continue to strengthen pro-competitive policies, including in telecoms.
-
Use federal funding to remove unnecessary occupational licensing requirements and make others more easily portable across States.
Other recommendations
-
Consider additional policy measures to encourage workers with children to remain in jobs that best utilise their skills, such as by boosting support for maternal leave and childcare or by establishing a national social insurance programme.
-
Consider implementing and expanding user fees for transportation infrastructure designed to address externalities, such as mileage-based charges for heavy trucks and express toll lanes in congested areas.
-
Consider shifting government supports for business R&D spending toward direct public funding of basic research and science, which likely has a higher social return.
Bibliography
Ahrend, Rudiger, Emily Farchy, Ioannis Kaplanis, and Alexander C. Lembcke (2014a), “What Makes Cities More Productive? Evidence on the Role of Urban Governance from Five OECD Countries”, OECD Regional Development Working Papers, Paris, https://doi.org/10.1787/5jz432cf2d8p-en.
Ahrend, Rudiger, Catherine Gamper, and Abel Schumann (2014b), “The OECD Metropolitan Governance Survey: A quantitative description of governance structures in large urban agglomerations,” OECD Regional Development Working Papers, Paris, https://doi.org/https://doi.org/10.1787/5jz43zldh08p-en.
Aghion, Philippe, Ufuk Akcigit, Antonin Bergeaud, Richard Blundell, and David Hémous (2015), “Innovation and Top Income Inequality”, NBER Working Paper, #21247.
Aghion, Philippe, Ufuk Akcigit, Ari Hyytinen, and Otto Toivanen (2016), “Living the `American Dream’ in Finland: The Social Mobility of Innovators.” Mimeo.
Andrews, Dan, Chiara Criscuolo, and Peter N. Gal (2015), “Frontier Firms, Technology Diffusion and Public Policy: Micro Evidence from OECD Countries”, OECD Productivity Working Papers, #2, November.
Austin, David (2015), “Pricing Freight Transport to Account for External Costs”, CBO Working Paper, 2015-03.
Bassanini, Andrea, and Danielle Venn (2007), “Assessing the Impact of Labour Market Policies on Productivity: A Difference-in-Difference Approach.” OECD Social, Employment and Migration Working Papers, 54, OECD Publishing, Paris.
Baumol, William J. (1967), “Macroeconomics of unbalanced growth: The anatomy of urban crisis”, American Economic Review, 57(3), 415-426.
Bernanke, Ben S. (2011), “Promoting Research and Development: The Government’s Role”, Issues in Science and Technology, 27(4), Summer.
Bertrand, Marianne and Antoinette Schoar (2003), “Managing with Style: The Effect of Managers on Firm Policies”, Quarterly Journal of Economics, 118(4), 1169-1208.
Bloom, Nicholas, Tobias Kretschmer, and John Van Reenen (2011a), “Are Family-Friendly Workplace Practices a Valuable Firm Resource?”, Strategic Management Journal, 32, 343–367.
Bloom, Nicholas and John Van Reenen (2007), “Measuring and Explaining Management Practises across Firms and Countries”, Quarterly Journal of Economics, 122(4), 1351-1408.
Bloom, Nicholas and John Van Reenen (2010), “Why do Management Practices Differ across Firms and Countries?”, Journal of Economic Perspectives, 24(1), 203-224.
Bloom, Nicholas and John Van Reenen (2011b), “Human Resource Management and Productivity”, Handbook of Labor Economics, Volume 4b, 1697-1767.
Boning, Brent, Casey Ichniowski, and Kathryn Shaw (2007), “Opportunity Counts: Teams and the Effectiveness of Production Incentives”, Journal of Labor Economics, 25(4), 613-650.
Brynjolfsson, Erik. and Andrew McAfee (2011), Race against the Machine: How the Digital Revolution is Accelerating Innovation, Driving Productivity, and Irreversibly Transforming Employment and the Economy. Digital Frontier Press.
Byrne, David M., John G. Fernald, and Marshall B. Reinsdorf (2016), “Does the United States have a productivity slowdown or a measurement problem?”, Brookings Papers on Economic Activity, March.
Byrne, David M., Stephen D. Oliner and Daniel E. Sichel (2015), “How Fast are Semiconductor Prices Falling?”, NBER Working Paper, #21074.
Byrne, David and Eugenio Pinto (2015), “The recent slowdown in high-tech equipment price declines and some implications for business investment and labor productivity”, FRB Feds Notes, March 26.
CEA (2015), Economic Report of the President, Council of Economic Advisers, Washington, D.C..
Cerqueiro, Geraldo, Deepak Hegde, Maria F. Penas and Robert Seamans (2016), “Debtor Rights, Credit Supply and Innovation”, Tilberg Law and Economics Center Discussion Paper 2014-011.
Chien, Colleen V. (2012), “Startups and Patent Trolls”, Santa Clara University Legal Studies Research Paper, No. 09-12.
Corea, Robert J. and Bonnie A. Retus (2015), “Returns for Domestic Nonfinancial Business”, Survey of Current Business, June 2015.
Decker, Ryan A., John Haltiwanger, Ron S. Jarmin, and Javier Miranda (2015), “Where has all the Skewness Gone? The Decline of High-Growth (Young) Firms in the U.S”, NBER Working Paper, #21776.
Decker, Ryan A., John Haltiwanger, Ron S. Jarmin, and Javier Miranda (2016), “Changing Business Dynamism: Volatility of Shocks versus Responsiveness to Shocks?”, Unpublished manuscript, January.
Diewert, Erwin W. (2013), “Decompositions of productivity growth into sectoral effects”, Journal of Productivity Analysis, 43(3), 367-387.
Domar, Evsey D. (1961), “On the Measurement of Technological Change”, The Economic Journal, 71(284), 709-729.
Elsby, Michael W., Bart Hobijn, and Aysegül Sahin (2013), “The Decline in the U.S. Labor Share,” Brookings Papers on Economic Activity, Fall.
Farre-Mensa, Joan., Deepak Hegde and Alexander Ljungqvist (2015), “The Bright Side of Patents”, USPTO Working Paper, 2015-5.
Foster, Lucia, Cheryl Grim, John Haltiwanger and Zoltan Wolf (2016a), “Firm-Level Dispersion in Productivity: Is the Devil in the Details?”, American Economic Review, 106(4).
Foster, Lucia, Cheryl Grim, and John Haltiwanger (2016b). “Reallocation in the Great Recession: Cleansing or Not?” Journal of Labor Economics, 34 (1:2).
Foster, Lucia, John Haltiwanger, and Lance Syverson (2008), “Reallocation, Firm Turnover, and Efficiency: Selection on Productivity or Profitability?”, American Economic Review, 98(1), 394-425.
Furman, Jason (2015), “Barriers to Shared Growth: The Case of Land Use Regulation and Economic Rents”, Remarks at The Urban Institute, November 20.
Furman, Jason and Peter Orszag (2015), “A Firm-Level Perspective on the Role of Rents in the Rise in Inequality”, Presentation at `A Just Society’ Centennial Event in Honour of Joseph Stiglitz, Columbia University.
Geddes, R. Richard (2015), “American Transportation Challenges: Proposals for Reform”, AEI Perspectives¸ September.
Gonang, Peter, and Daniel Shoag (2015), “Why Has Regional Income Convergence in the U.S. Declined?” Mimeo, Harvard Kennedy School.
Gordon, Robert J. (2012), “Is U.S. Economic Growth Over? Faltering Innovation Confronts the Six Headwinds”, NBER Working Paper, #18315.
Gropp, Reint, John K. Scholz, and Michelle J. White (1997), “Personal Bankruptcy and Credit Supply and Demand”, The Quarterly Journal of Economics, 112(1), 217-251.
Guzman, Jorge, and Scott Stern (2016), “The State of American Entrepreneurship: New Estimates of the Quantity and Quality of Entrepreneurship for 15 US States, 1988-2014”, NBER Working Paper #22095, March.
Haltiwanger, John, Ron S. Jarmin, and Javier Miranda (2013), “Who Creates Jobs? Small vs. Large vs. Young”, Review of Economics and Statistics, 95(2), 347-361.
Hathaway, Ian, and Robert Litan (2014), “The Other Aging of America: The Increasing Dominance of Older Firms”, Economic Studies at Brookings, July.
Hamidi, Shima, and Reid Ewing (2014), “A Longitudinal Study of Changes in Urban Sprawl between 2000 and 2010 in the United States”, Landscape and Urban Planning, 128, 72–82.
Han, Suyoun and Morris M. Kleiner (2015), “Analyzing the Duration of Occupational Licensing on the Labor Market”, Mimeo.
Houseman, Susan, Christopher Kurz, Paul Lengermann, and Benjamin Mandel (2011), “Offshoring Bias in U.S. Manufacturing”, Journal of Economic Perspectives, 25(2), 111-132.
Kleiner, M. and A. Krueger (2013), “Analyzing the Extent and Influence of Occupational Licensing on the Labor Market”, Journal of Labour Economics, 31(2), S173-S202.
Lazear, Edward P. (2000), “Performance Pay and Productivity”, American Economic Review, 90(5), 1346-1361.
Liang, Hui Wang and Edward P. Lazear (2014), “Demographics and Entrepreneurship”, NBER Working Paper #20506.
Matos, Kenneth and Ellen Galinsky (2014), “National Study of Employers”, Families and Work Institute.
Molloy, Raven, Christopher Smith and Abigail Wozniak (2013), “Declining Migration within the US: The Role of the Labor Market”, Finance and Economics Discussion Series, No. 2013-27.
OECD (2012), Redefining `Urban’: A New Way to Measure Metropolitan Areas, OECD Publishing, Paris.
OECD (2015a), OECD Economic Outlook No. 97, 2015-1, OECD Publishing, Paris.
OECD (2015b), OECD Science, Technology and Industry Scoreboard 2015: Innovation for Growth and Society, OECD Publishing, Paris.
OECD (2016), Employment Outlook, OECD Publishing, Paris.
Owen, Andrew, and David Levinson (2014), “Access Across America: Transit 2014”, Center for Transportation Studies, University of Minnesota. http://hdl.handle.net/11299/168102.
Owen, Andrew; Levinson, David. (2014). Access Across America: Transit 2014. Center for Transportation Studies, University of Minnesota. Retrieved from the University of Minnesota Digital Conservancy, http://hdl.handle.net/11299/168102.
Paik, Yongwook (2013), “The Bankruptcy Reform Act of 2005 and Entrepreneurial Activity”, Journal of Economics & Management Strategy, 22(2), 259-280.
Reinsdorf, Marshall B. (2014), “Alternative Formulas for Measuring Industry Contributions to Labor Productivity Change”, BEA manuscript.
Rognlie, Matthew (2015), “Deciphering the Fall and Rise in the Net Capital Share”, Brookings Papers on Economic Activity. BPEA Conference Draft.
Rohlin, Shawn M. and Amanda Ross (2016), “Does Bankruptcy Law Affect Business Turnover? Evidence from New and Existing Businesses”, Economic Inquiry, 54(1), 361-374.
Song, Jae, David J. Price, Fatih Guvenen, Nicholas Bloom, and Till von Wachter (2015), “Firming Up Inequality”, NBER Working Paper, #21199.
Summers, Lawrence (2014), “U.S. Economic Prospects: Secular Stagnation, Hysteresis, and the Zero Lower Bound”, Keynote Address at the NABE Policy Conference, Business Economics, 49(2).
Syverson, Chad (2004), “Market Structure and Productivity: A Concrete Example”, Journal of Political Economy, 112(6), 1181-1222.
Syverson, Chad (2011), “What Determines Productivity”, Journal of Economic Literature, 49(2), 326-365.
Syverson, Chad (2016), “Challenges to Mismeasurement Explanations for the U.S. Productivity Slowdown”, NBER Working Paper, #21974.
Tang, Jianmin, and Weimin Wang (2004), “Sources of Aggregate Labour Productivity Growth in Canada and the United States”, Canadian Journal of Economics, 37, 421-444.
Thévonon, Olivier and Anne Solaz (2013), “Labour Market Effects of Parental Leave Policies in OECD Countries”, OECD Social, Employment, and Migration Working Papers, 141, OECD Publishing: Paris.
World Economic Forum (2015), Global Competitiveness Report 2015-2016, World Economic Forum.