Key Policy Insights
Turkish GDP per capita has continued to catch up with the more advanced OECD economies. Despite a series of adverse shocks including severe geo-political tensions at the southeastern border and an averted coup attempt in 2016, GDP growth averaged nearly 7% over 2010-17 (Figure 1, Panel A). Labour productivity now exceeds that of several other catching-up OECD economies (Panel B), notwithstanding the prevalence of low-productivity informal activity, especially in agriculture. This reflects the strong performance of a dynamic, albeit fragmented, business sector. Despite dynamic job creation and a labour force growing at above 3% per year, the employment rate of the working age population remains the lowest in the OECD.
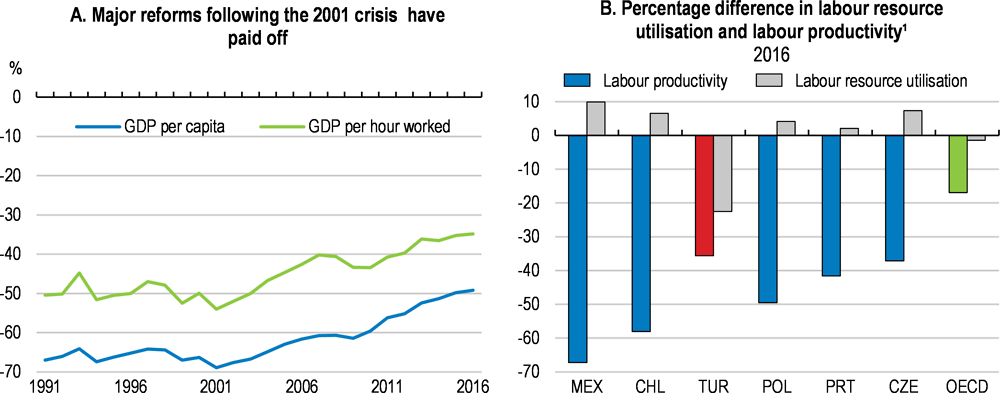
1. Labour productivity is measured as GDP per hour worked. Labour resource utilisation is measured as the total number of hours worked per capita.
Source: OECD (2018), Economic Policy Reforms 2018: Going for Growth Interim Report, OECD Publishing, Paris, https://doi.org/10.1787/growth-2018-en.
Against the backdrop of substantial population growth, expected further increases in labour force participation and massive refugee inflows, strong GDP growth and job creation top the wish list of the population and the agenda of policymakers. Concurrently, living standards have improved but more so in terms of material conditions than in other measures of quality of life (Figure 2). A number of inequalities nevertheless endure, illustrating the challenge of making growth more inclusive.
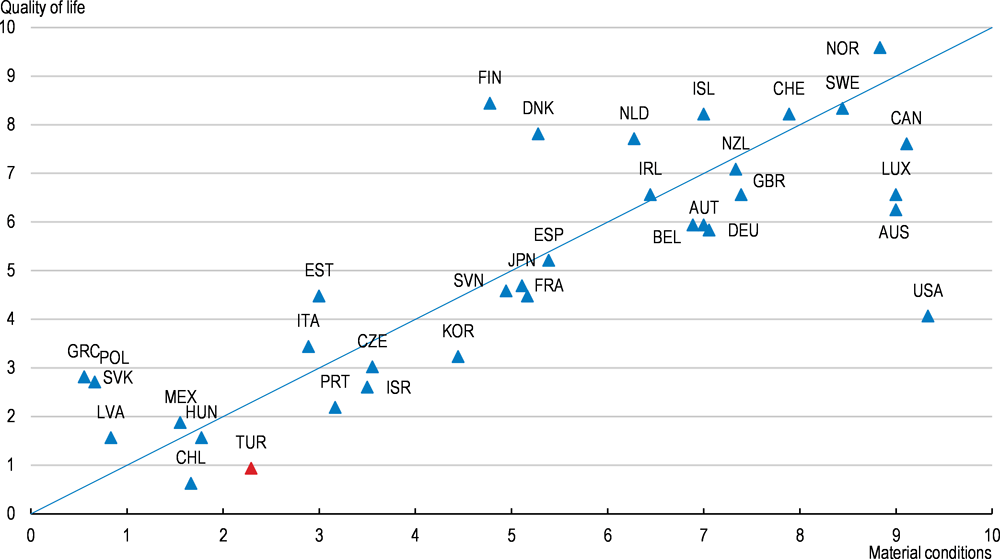
Note: Material conditions encompass 10 indicators across three dimensions: income and wealth, jobs and earnings, and housing. Quality of life is measured through 15 indicators spanning eight dimensions: work-life balance, health status, education and skills, social connections, civic engagement and governance, environmental quality, personal safety and subjective well-being.
Source: OECD (2017), How's Life: Measuring Well-being.
Despite progress in recent years, income and wealth inequalities are indeed high in international comparison, due principally to the uneven labour markets position of family bread earners. This reflects first and foremost the divide of economic activities into informal, semi-formal and formal segments of the business sector. The extent to which high-productivity formal activities grow differs substantially across regions, and male workers are much more concentrated in the formal sector than their female counterparts. Overcoming this disparity is the fundamental condition for making productivity enhancements and growth more inclusive in Turkey. Higher-quality firms not only deliver better and more gender-equal working conditions and earnings, they also boost the national and local fiscal resources required for stronger social services.
Growth remained strong but imbalances increased
At 7.4% annual growth in 2017 and with a strong first quarter in 2018, real GDP growth has been among the fastest worldwide, exceeding both market expectations and official projections. Robust foreign demand and sharp real exchange rate depreciation supported exports (Figure 3, Panel A). Domestic fiscal and quasi-fiscal stimulus, including a massive extension of the government credit guarantee scheme, boosted domestic demand.
Private business investment was more subdued over most of 2016-17, reflecting “wait and see” attitudes amid various domestic, regional and international uncertainties. However, it picked up in late 2017 and early 2018 on the back of strong export prospects and substantial government incentives. The share of machinery and transport equipment investment in GDP reverted to its long-time average of around 13%, one of the highest rates in the OECD.
The announcement of early presidential and parliamentary elections in April 2018 (brought forward from November 2019) could have reduced policy uncertainties by shortening the pre-electoral period but did not have this effect. It rather amplified the departures from the cautious macroeconomic framework of the Medium-Term Programme 2018-20 published in October 2017, which aimed at cutting the general government deficit from 2.4% of GDP in 2017 to 1.9% in 2018 and 2019 (a new Medium-Term Programme 2019-21 is under preparation). New questions also arose on the objectives and conduct of monetary policy. The exchange rate depreciated sharply and increased the debt burden and borrowing costs of the large number of non-financial firms carrying high foreign currency debt. Private consumption, in contrast, is expected to be backed by buoyant employment and pre-electoral social transfers. The expected increase in inflation should nevertheless weigh on households’ purchasing power.
Against this delicate backdrop, re-anchoring macroeconomic policies to a cautious Medium-Term Programme, and resuming the reforms initiated in early 2018 to align Turkey’s doing business conditions with international benchmarks, would help restore policy predictability and improve confidence after the presidential and legislative elections. The sharp increase in the effective funding rate of the central bank and the simplification of its monetary policy framework to align it with standard international practice in April-June 2018 will help. The increased fiscal spending should be offset by concomitant savings in order to maintain the structural fiscal balance in line with the programmed targets. Maintaining favourable conditions for the further integration of Turkish businesses into global value chains, and taming inflation to preserve international competitiveness will also be important to keep up export growth and business sentiment.
On the back of a particularly strong carry-over from late 2017 and early 2018, and absent any further severe tensions on exchange rates and external financing, GDP growth is projected at slightly above 5% in 2018 and just below in 2019 (Table 1). Tourism and service exports are projected to play an important role in both years. The impact on growth of the sharp increase in real policy interest rates in mid-2018 may be mitigated by a decline of risk premia embedded in commercial lending rates. The monetary policy tightening has also stopped the trend depreciation of the Turkish Lira, which should be supportive for the many non-financial firms heavily indebted in foreign currencies. Growth is on course to decline in the second half of 2018 as fiscal stimulus diminishes after the presidential and parliamentary elections, making for a weaker carry-over into 2019. The slowdown in growth and the normalisation of gold imports (which reached 1 to 2 % of GDP in some recent quarters) are projected to reduce the current account deficit.
Growth could turn out to be stronger if the post-electoral period allows a smoother than expected phasing in of the ambitious structural reform agenda, accompanied by more prudent and credible fiscal and monetary policy. If, on the contrary, additional uncertainties arise regarding the macroeconomic policy stance or the outlook for structural reform, or if regional geo-political conditions worsen further, additional pressure on exchange rates, capital movements and domestic sentiment may undermine investment, consumption and growth.
Rebalancing the economy and containing vulnerabilities
Growth continues to suffer from the structural imbalances that have been emphasised in previous OECD Surveys (OECD, 2016[1]; 2014[2]): demand is overly driven by domestic consumption, domestic saving falls short of total investment, and external debt is on the rise. These imbalances remain evident following the major revision of the national accounts in 2016, which considerably modified the GDP, investment and saving series. Private and public saving are estimated at around 23% and 2% of GDP in 2017, against private and public investment of around 26% and 4%. Accordingly, the current account deficit widened anew to above 5% of GDP after having fallen below 4% in 2015-16. While the precise cyclical position of the economy is difficult to gauge as the unemployment rate remains very high and wage pressures are subdued, this persisting imbalance endangers the sustainability of strong growth and job creation needed for achieving inclusive growth. The uncertainties about the precise cyclical position of the economy, associated with the absence of general government accounts consolidated according to national accounting standards (see below), complicates the assessment of the structural fiscal stance.
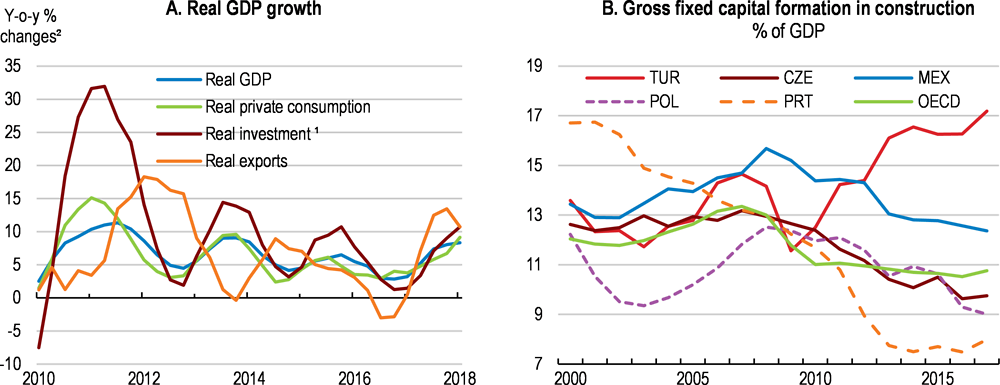
1. Public and private business investment are not separately reported in Turkish national accounts.
2. Three-quarter moving average.
Source: OECD Economic Outlook (database).
Housing and construction now account for a very large share of investment, employment and output compared to other OECD countries (Figure 3, Panel B). This is partly expected, given Turkey’s urban renewal and infrastructure needs, amplified by high seismic risks and continuing internal migration. It nonetheless contributes importantly to the gap between investment and saving.
Both business and household saving can be increased. Policy action has been stepped up to raise household saving, notably via a rapidly expanding government-subsidised private pension scheme (see below). However, rebalancing the economy without dampening growth calls for improvement in export performance. Even though exports have diversified over the past decade (Figure 4), the weight of the export sector in GDP and the progress of Turkey’s share in world exports fall short of the performance of the more dynamic comparable OECD countries (Figure 5). As a result, Turkey exhibits a lower share of employment sustained by foreign demand than comparable OECD countries (23% in 2014, against more than 40% in Poland and Portugal) (OECD, 2017[3]).
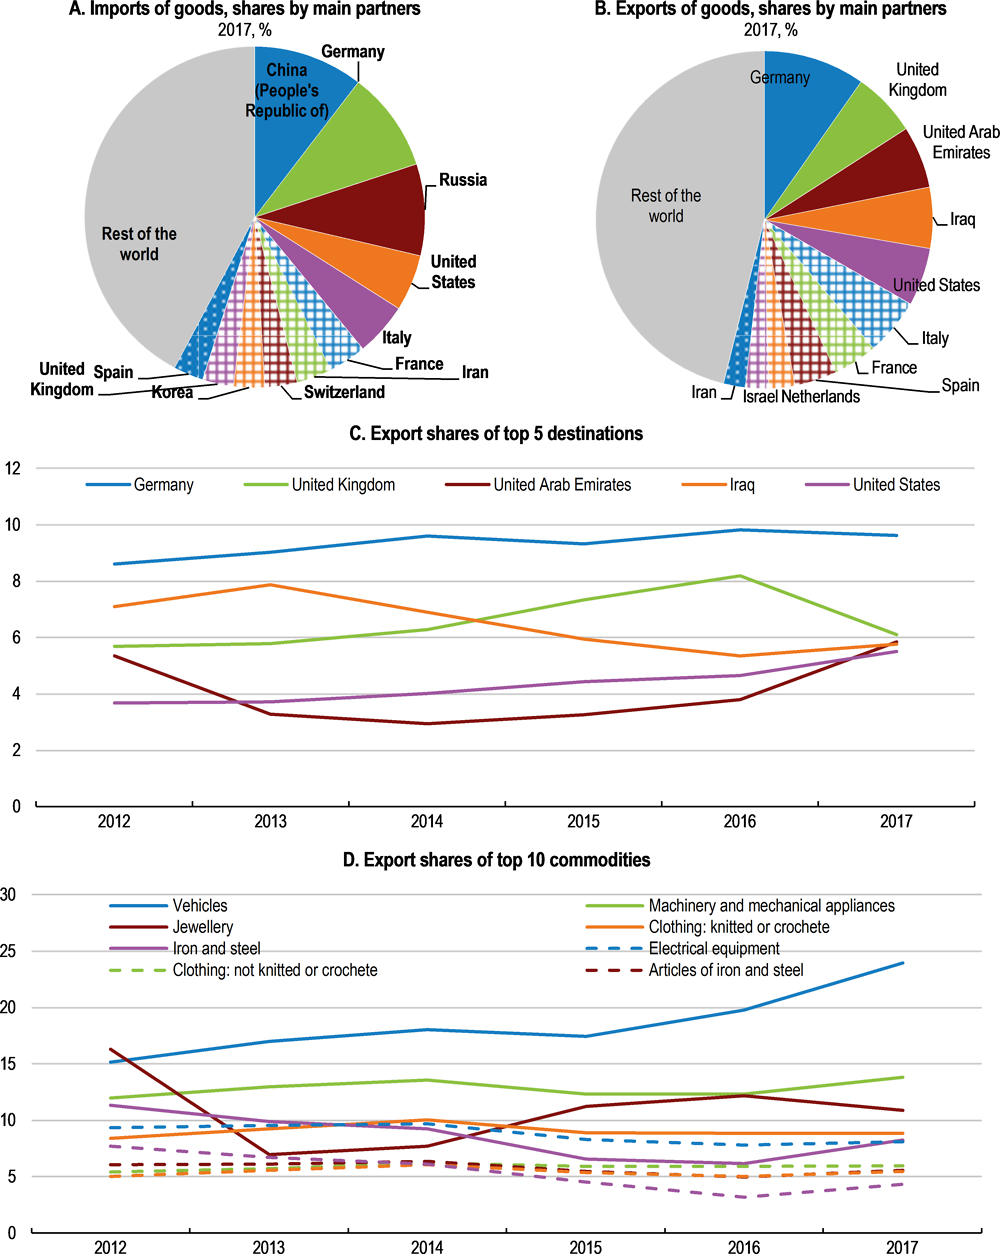
Source: OECD (2018), OECD International Trade by Commodity Statistics (database).
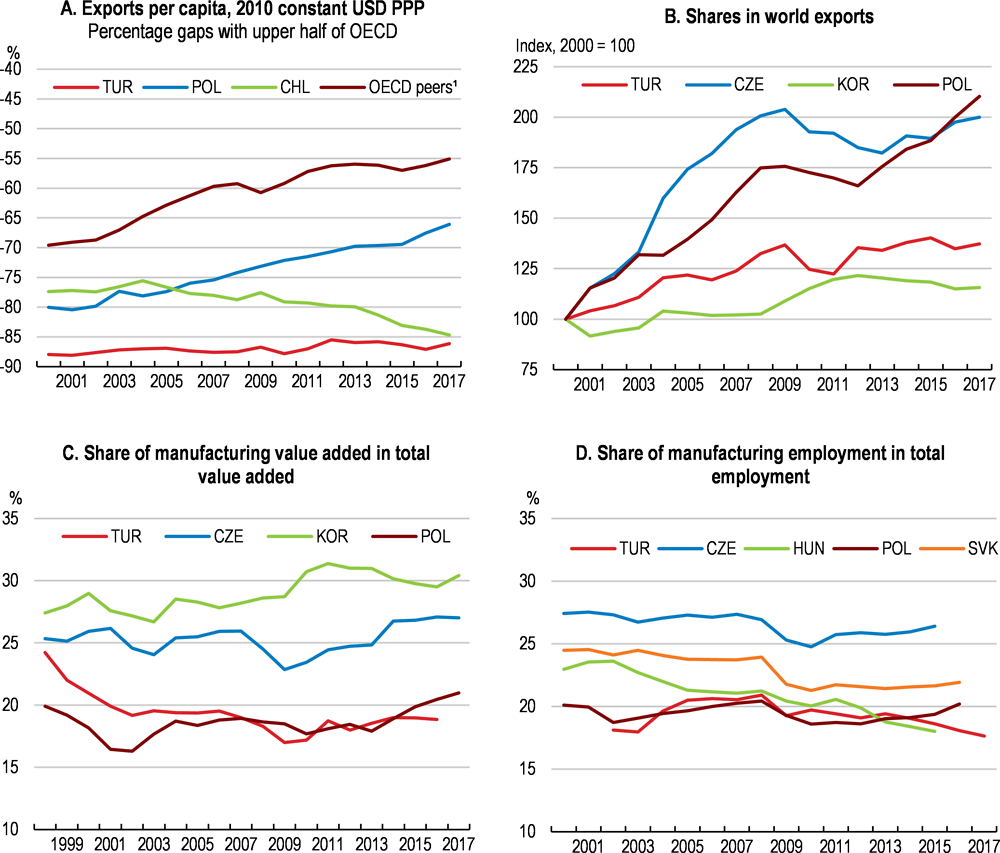
1. OECD peers comprise lower-income OECD countries: Czech Republic, Slovenia, Portugal, Slovak Republic, Estonia, Greece, Latvia, Hungary, Poland, Chile and Mexico. The selection of countries shown varies across panels depending on data availability.
Source: Calculations based on OECD National Accounts (database) and Turkstat.
Tourism is a major export sector, accounting for one-fifth of total exports of goods and services. Tourist entries and revenues have expanded over the past decade, although with sharp fluctuations in headcount, composition and revenue per tourist, especially after the extraordinary events of 2016 (Figure 6). The number of visitors from Russia, Ukraine and the Middle-East has trended up while the share of higher-spending tourists from EU countries has declined. There are, however, signs of a recovery in tourist arrivals from Europe in 2018. While Turkey has considerable further potential in tourism, coastal protection measures appear insufficient to contain the environmental impact of massive transformations of land and sea (Ocean Health Index, 2016[4]). Raising awareness for trade-offs between different dimensions of wellbeing (e.g. air quality versus jobs) and regarding natural resources as determinants of growth (current versus future), would help shape a policy agenda targeting inclusive and ecologically sustainable growth.
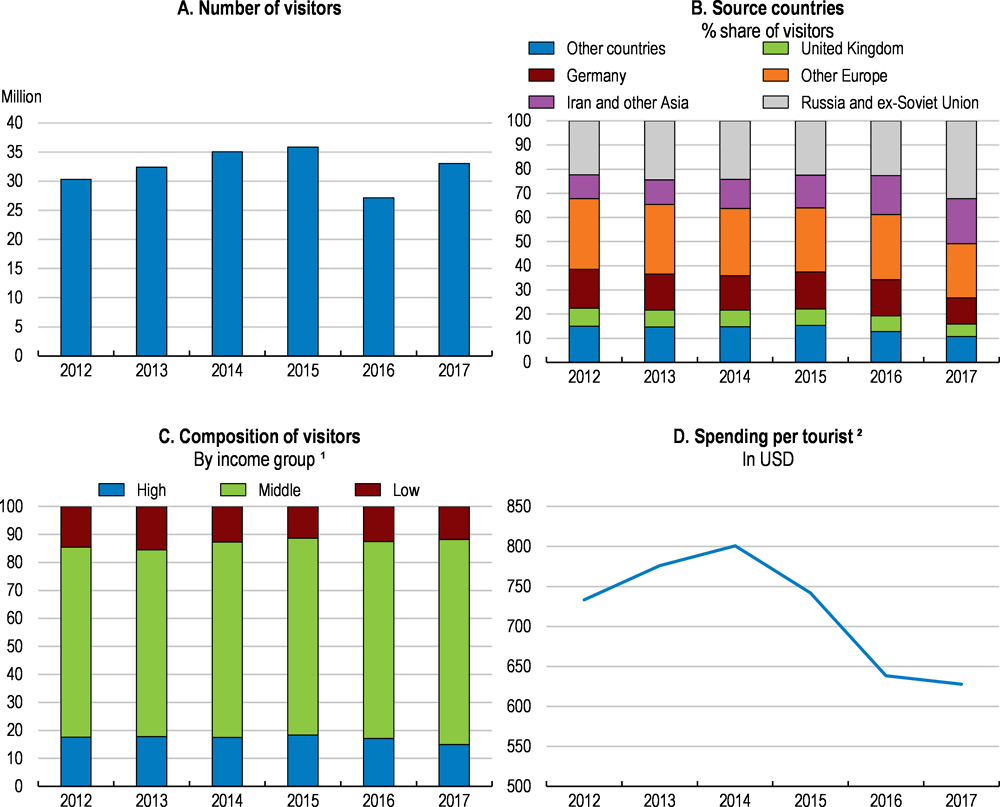
1. Income groups are defined along source country standards. For example, middle-income visitors do not refer to visitors from middle-income countries but to middle-income visitors from different countries.
2. Excluding Turkish nationals residing abroad.
Source: Turkstat.
The business sector is dynamic but requires further upgrading to boost exports
Backed by ongoing integration into global value chains and diversification towards other export markets, the tradable sector has improved its performance in many areas over the past decade. But its technological basis still falls behind (Figure 7 Panel A). Recent policy initiatives by the Ministry of Science, Industry and Technology and the SME agency KOSGEB target firms’ technological capacities. There has been an upgrade in the structure of exports in terms of broad product categories: the share of medium-to-high- and high-technology goods in total manufactured exports reached 39% in 2017, up from 26% in 2012, even if Turkey is specialised in the less sophisticated segments of these industries. In particular, passenger car and car part-and-component exports expanded respectively by 13% and 22% in 2017, which exemplifies Turkey’s transition to medium-to-high technology manufacturing. In February 2018, the Survey of Exporter Tendencies hinted at exceptionally strong confidence among exporters for the period ahead (TIM, 2018[5]).
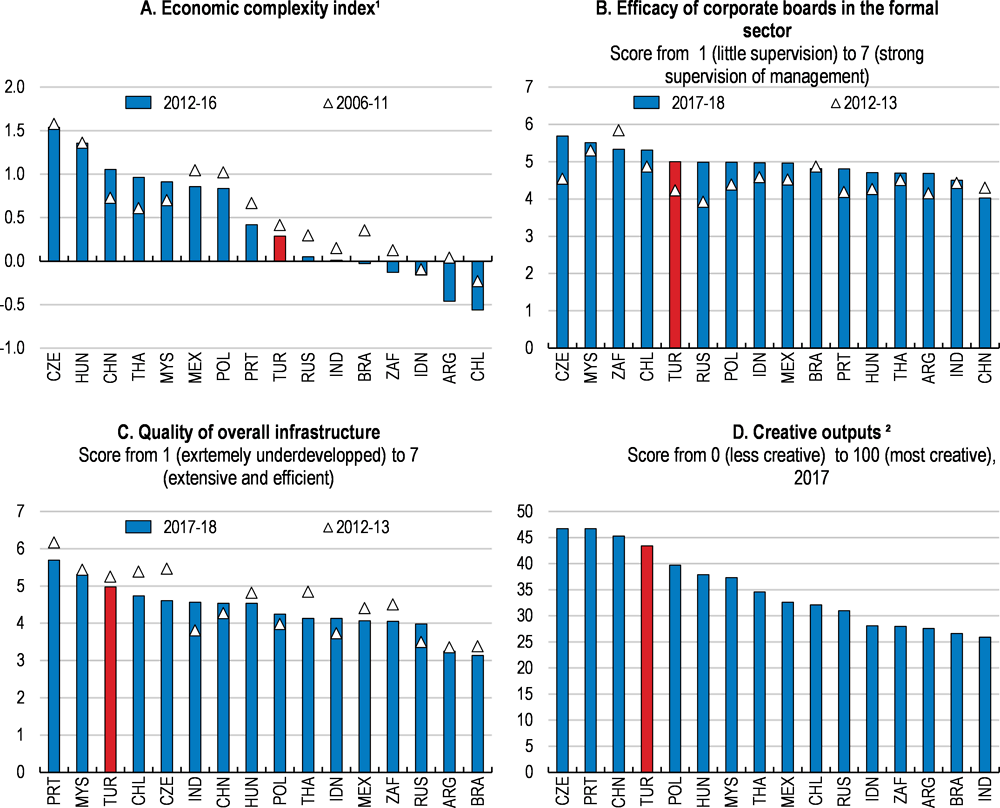
1. Economic complexity is measured by the knowledge intensity of an economy, as reflected in the diversity and ubiquity of its exports. It is measured net of the sophistication of imported inputs (Hausmann et al., 2014[6]) .
2. “Creative outputs” is a sub-index of the global innovation index which ranks the economies according to their innovation capabilities and outcomes. It covers intangible assets, creative goods and services and online creativity.
Source: Observatory of Economic Complexity, Economic Complexity Index; World Economic Forum, Global Competitiveness Index (database); Cornell University, INSEAD, and the World Intellectual Property Organization (2017), Global Innovation Index.
A recent analysis of the composition and diversity of Turkey’s exported goods suggests that the country’s sectoral specialisation has reached a threshold which foreshadows additional sophistication and market share and GDP per capita gains in the future (Hausmann, 2017[7]). A more detailed investigation using the same methodology confirms that Turkey’s expansion towards machinery, electrical equipment and chemical sub-sectors has built the basis for further diversification going forward (Yildirim, 2018[8]).
Other recognised strengths of the business sector include the quality of management in the formal sector, the quality of the physical infrastructures it is drawing on, and a proven capacity for introducing creative products and services in a wide range of markets (Figure 7).
Meanwhile, Turkey’s less-advanced regions have tended to rely increasingly on low-technology, low-skilled manufacturing. This development is welcome as these new activities replace inactive or low-productivity agricultural labour and provide a basis for learning-by-doing for the entrepreneurs and workers in the regions. Going forward, however, it will be important to help these businesses to upgrade the quality of their products and increase productivity. In this regard, the formalisation of informal and semi-formal activities in these less advanced regions has a long way to go and progress will be crucial for inclusive growth.
Concomitantly, all sectors and firms should keep up with digital transitions. Turkey’s business sector appears more advanced in the early phases of this transition than in several comparable countries (Box 1). However, further progress with digitalisation requires substantial additional investment in the skills of entrepreneurs and workers. Broad-based digitalisation is expected to improve financial and tax transparency, facilitating the formalisation of businesses and additional productivity gains.
Turkey is among the OECD countries whose growth scenarios are particularly sensitive to policy reforms in these areas (Box 2).
Digitalisation is gaining momentum in the Turkish business sector. The share of firms with a website and of firms present in digital social media is very high compared with peer countries in Europe (Figure 8, Panel A). However, use of core digital applications in businesses is less advanced. The share of firms using (functionally important) enterprise resource planning and customer relationship management software is lower than in other catching-up countries in Europe (Panel B), possibly reflecting skills gaps.
Nonetheless, small firms are trying to draw on digital technologies to make up for their size disadvantages. The share of small firms using the fastest available broadband Internet speed in Turkey ranks high compared to peer countries (Panel C). Turkey has also a significant share of young micro and small firms in the ICT sector, higher than in comparable countries (Panel D). The presence of these small and dynamic high-technology firms is promising.
Simultaneously, the gap faced by the mass of low-skilled, micro-size, informal firms in the area of digitalisation is a specific challenge for the Turkish economy. It calls for targeted awareness, information and education campaigns for these firms.
Various public and private initiatives seek to accelerate digitalisation. A Platform for the Digital Transformation of Industry was created with the participation of several business organisations under the aegis of the Ministry of Science, Industry and Technology. Six working groups were established and prepared policy-oriented reports on i) key trends in digital technologies, ii) advanced manufacturing technologies, iii) open innovation systems, iv) education and skill needs, v) infrastructure requirements, and vi) standardisation and patenting issues. The Ministry established a Department of Fourth Industrial Revolution to co-ordinate this activity and devise strategies and policies.
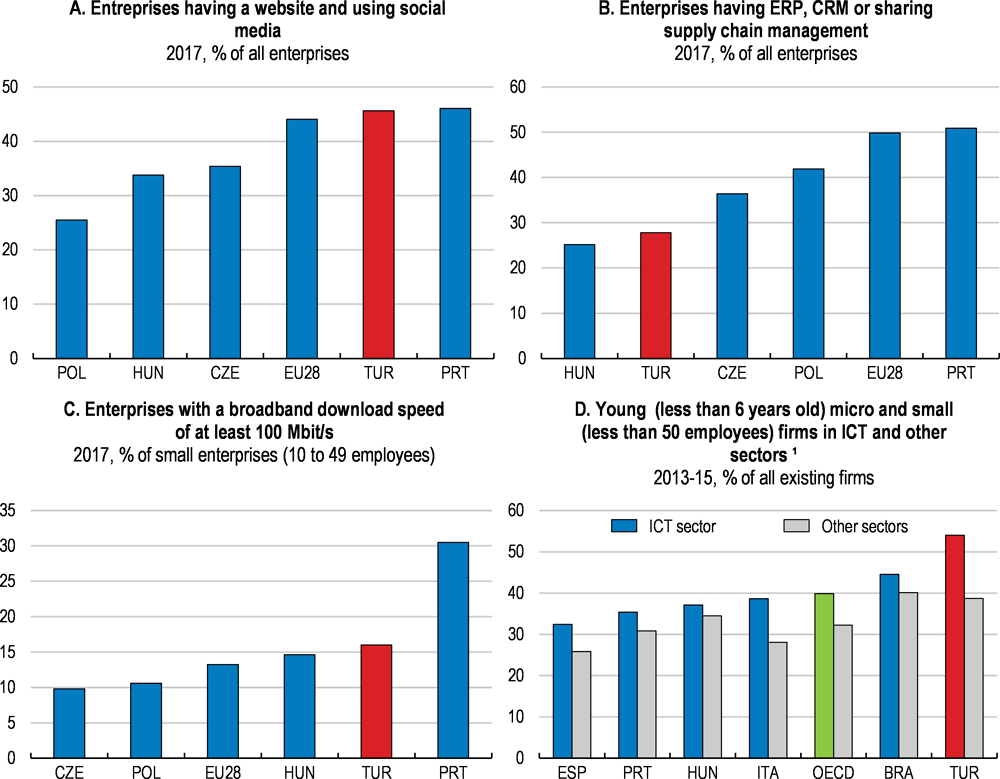
1. The ICT sector includes the ISIC Rev. 4 sectors 26, 61 and 62-63: computer and electronics; telecommunications and IT and other information services. Other sectors cover manufacturing and the non-financial business services sector excluding the ICT sector, coke and refined petroleum products and real estate activities. Data refer to 2008-10 for Italy and 2010-12 for Portugal. OECD unweighted average calculated on the basis of the 18 available countries.
Source: Eurostat (2017), The Digital Economy and Society Index and OECD (2017), OECD Science, Technology and Industry Scoreboard 2017. For Panels A, B and C data is available only for European countries.
The Turkish Enterprise and Business Confederation has initiated a nationwide project called Digital Anatolia, to raise widespread awareness and promote interaction between digitalisation professionals and SMEs across the country. Also, a first conference on practical artificial intelligence applications was held in February 2018, under the aegis of the Turkish Artificial Intelligence Initiative.
The experience of other OECD countries suggests that a holistic strategy encompassing technology, education, life-long learning and infrastructure and internet access policies can accelerate digitalisation on a broad and socially inclusive basis. Turkey should build on these experiences (OECD, 2018[9]).
OECD research suggests that, in addition to technological and skill formation initiatives, the adequacy of the general regulatory framework for doing business is essential for the pace of digitalisation. This research has identified Turkey as one of the top OECD countries in terms of potential for accelerating digitalisation by aligning market entry and labour market regulations with OECD good practices (Nicoletti, Andrews and Timiliotis, 2018[10]).
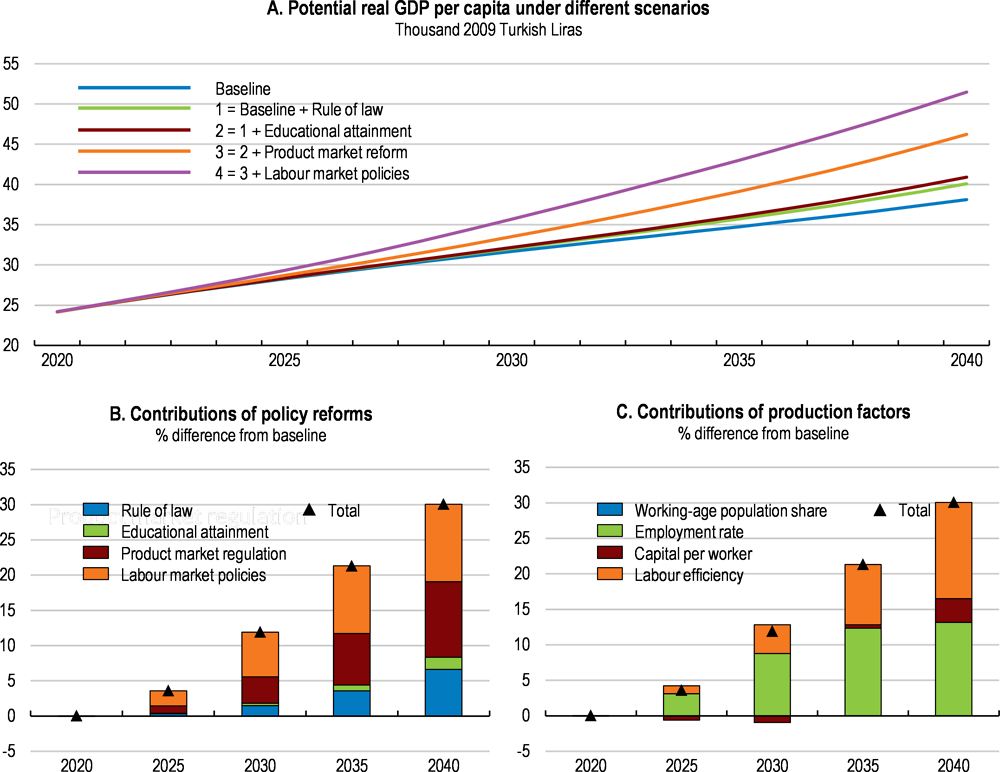
The OECD long-term projections for the world economy (OECD, 2018[11]) include scenarios based on the assumed evolution of policy frameworks in individual countries. This encompasses policy choices in areas where emerging economies tend to lag (education and rule-of-law), and in areas where advanced OECD economies display substantial heterogeneity (product and labour market regulations). As a middle-income country, Turkey has ample room for convergence with international good practices in both areas. It therefore faces a particularly wide spectrum of possible future growth trajectories depending on its policy choices (Gönenç, 2017[12]).
Source: Estimations based on “OECD Long-term Scenarios for the World Economy” database.
Drawing on a standard cross-country OECD methodology, country growth scenarios include a baseline which assumes no change in policies (although trend gains in educational attainment across cohorts are extended into the future); and reform scenarios assuming i) convergence with the rule-of-law standards of the top five OECD countries by 2060; ii) further progress in educational attainment with full convergence with the top five OECD countries by 2060; iii) alignment of product market regulations with best practice countries by 2030; and iv) halving of the distance from best practice labour regulations by 2030. The growth impacts are derived from cross-country econometric estimations, which also help appraise average time lags for their realisation.
Figure 9 presents the scenarios for Turkey. Panel A shows estimated GDP per capita paths under different policy assumptions, Panel B the contributions of reforms in each policy area, and Panel C the gains projected via specific production factors. These scenarios suggest that the combined implementation of standard reforms could help increase Turkey’s GDP per capita and associated living standards by as much as one third within two decades.
Addressing external vulnerabilities
The recent upturn in exports has been strong due to favourable external demand conditions, but not enough to prevent a renewed increase in the current account deficit to 5.6% in 2017 amid vibrant domestic demand, rising import prices, notably energy, and sizeable gold imports (Figure 10, Panel A). The concomitant increase in external debt and deterioration in underlying fundamentals, notably recurrent periods of substantial real depreciation of the Turkish Lira, have shed doubt on the sustainability of external liabilities. The external debt ratio remains relatively low in international comparison as a share of GDP, at around 50% in 2017, but is relatively high as a share of exports (Figure 11). Box 3 presents an analysis of the drivers of external debt and sets out four scenarios on the basis of alternative assumptions concerning their evolution.
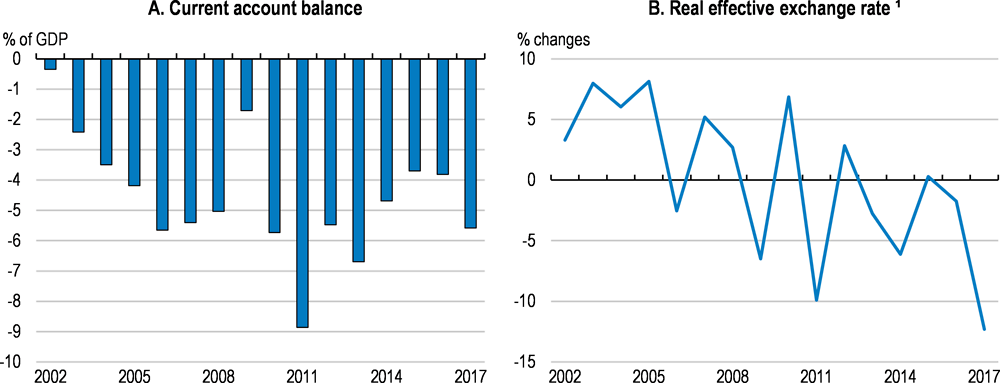
1. The real effective exchange rate is the nominal effective exchange rate deflated by GDP deflators and using constant trade weights.
Source: OECD (2018), OECD Economic Outlook (database).
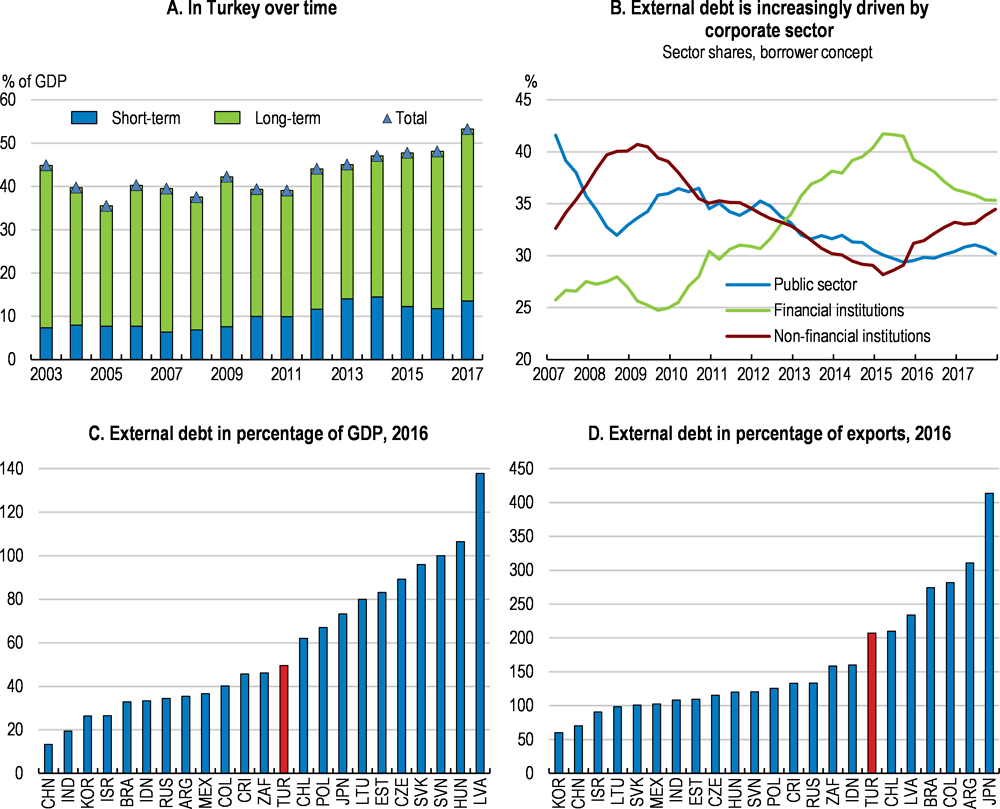
Note: For presentation purposes, Panel C and D exclude advanced European countries that typically have substantially higher external debt ratios.
Source: IMF (2018), Balance of Payments Statistics (database).
The evolution of the external debt-to-GDP ratio is a function of the initial external debt, the current account balance, net FDI inflows, real GDP growth, the exchange rate, foreign interest rates, inflation and the share of foreign-currency-denominated debt. Simulations have been run which are described in more detail in Annex A. A baseline scenario assumes 5% real GDP growth, real exchange rate stabilisation, a 4% of GDP current account deficit and net FDI inflows of 1.5% of GDP, in line with the historical average (Table 2). For all scenarios, the external interest rate is assumed to increase from 1.5% in 2018 to 4.0% in 2023 and to remain at this level thereafter.
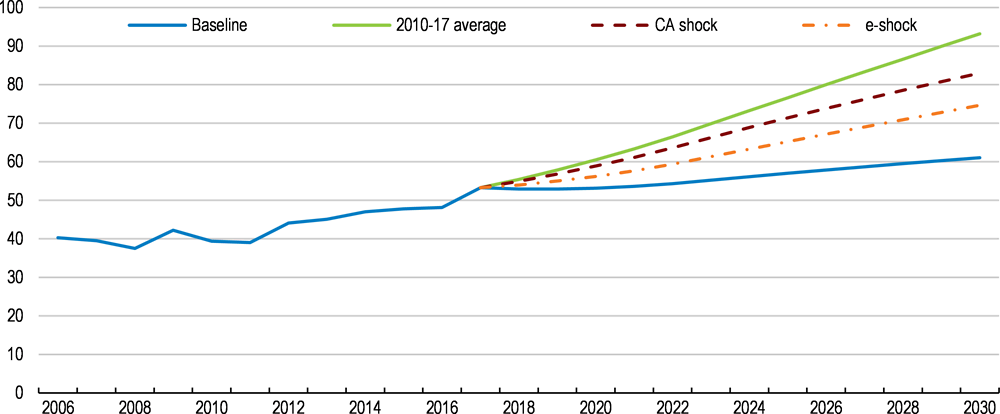
Note: The “`2010-17 average” scenario extends average parameters observed over 2010-17 until 2030. The “baseline” scenario assumes an interest rate of 1.5% in 2018 rising by 0.5 percentage points per year and stabilising at 4.0% from 2023 onwards, real GDP growth of 5%, inflation of 7%, effective exchange rate depreciation of 5%, a current account deficit of 4% and net FDI inflows of 1.5% of GDP per annum. “CA shock” assumes a current account deficit of 6% while the “e-shock” scenario assumes 7% nominal depreciation par year (all other fundamentals equal to baseline for both shock scenarios).
Source: OECD calculations based on IMF (2018), Balance of Payments (database) and OECD (2018), OECD Economic Outlook (database).
Under this baseline scenario, the external-debt-to-GDP ratio would be capped at around 89% (Table 2 and Figure 12). Under the alternative scenario assuming a current account deficit that remains at its recent level of 6% of GDP, the external-debt-to-GDP ratio would rise from 59% to 161%. Relaxing the assumption of real exchange rate stabilisation and assuming the Turkish lira depreciates by 2% per year in real terms, the long-term external-debt-to GDP ratio would increase much more.
The four factors identified as drivers of external debt (Box 3) point to high and increasing risks to its sustainability. These four factors interact and improvements in all of them are needed to ensure a sound external position:
i. The current account balance. The recent drift of the current account deficit, if not reversed, heralds a significant worsening in the external debt path. Stronger productivity growth and competitiveness gains in the business sector would help reduce it.
ii. The exchange rate. The sharp depreciation of the Turkish lira has pushed up the debt ratio. A permanent 2 percentage point increase from the 5% baseline annual nominal exchange rate depreciation would significantly increase the convergence level of the external-debt-to-GDP ratio to above 300%.
iii. The critical interest rate. The maximum interest rate that Turkey can afford to pay while remaining on a convergent external debt path, called the critical interest rate, has been on a declining trend since 2005.
iv. The share of foreign direct investment (FDI). Stronger net FDI inflows would help contain the build-up of external debt. The stock and flow of FDI are currently both well below comparable countries.
Among the drivers of external sustainability, the external interest rate depends on the global risk-free interest rate, which is expected to increase, and on Turkey’s risk premium. Recent OECD research found that countries’ risk premia are affected by their political stability and institutional credibility (Fournier et al., 2018[13]), in line with the findings of earlier OECD Surveys of Turkey (OECD, 2012[14]). New estimates for this Survey confirm that Turkey’s risk premia remain highly sensitive to the perceived quality of governance institutions (Box 4). They also reveal that the quality of the business sector (captured by its position in the international product space) facilitates cheaper borrowing from abroad. The presence of well-performing firms reduces risk premia, holding all other factors constant. Therefore, strengthening Turkey’s business sector would reduce external vulnerability not only by reducing the current account deficit via productivity and competitiveness gains, but also by securing cheaper external funding.
The composition of debt also matters for external vulnerability. The share of currency and deposits held by non-residents is relatively low in Turkey (10% against 20% of total external debt on average in the OECD), which limits financial risks in the face of volatile international capital flows. More broadly, the share of short-term debt is relatively low as well although it has increased from below 20% prior to the global financial crisis to over 30% in 2014, before declining to around 25% in 2017. Still, total debt service as a share of exports of goods and services and primary income approached 40% in 2017, the highest value among comparators after Brazil. At the same time, international reserves represent less than half a year of imports, which is fairly low compared to most other emerging countries, though similar to OECD peers such Poland, Mexico or Chile.
GDP growth, inflation and public debt are standard indicators influencing the risk perceptions of international investors. The quality of institutions also bears on these perceptions, not least the efficiency of the judicial system, the strength of regulatory institutions and political stability. Furthermore, a country’s possession of advanced know-how and its capacity to produce sophisticated goods and services may affect its ability to resist competitive pressures and to withstand shocks and can therefore reduce its riskiness.
To assess the impact of these factors on Turkey’s risk premia, panel regressions have been carried out for a sample of OECD and non-OECD countries (Table 3). The standard drivers of risk premia are shown to be relevant. The estimations accurately track the evolution of Turkey’s risk premia over the past decade. They also corroborate the view that an improvement in business sector sophistication helps reduce risk premia, highlighting the potential available for progress in this area in Turkey.
International risk premia paid by sovereign borrowers spill over to the cost of borrowing and equity of domestic firms. Turkey’s open capital account and competitive banking sector imply that changes in sovereign funding costs are promptly and fully reflected in business funding costs (Figure 13).
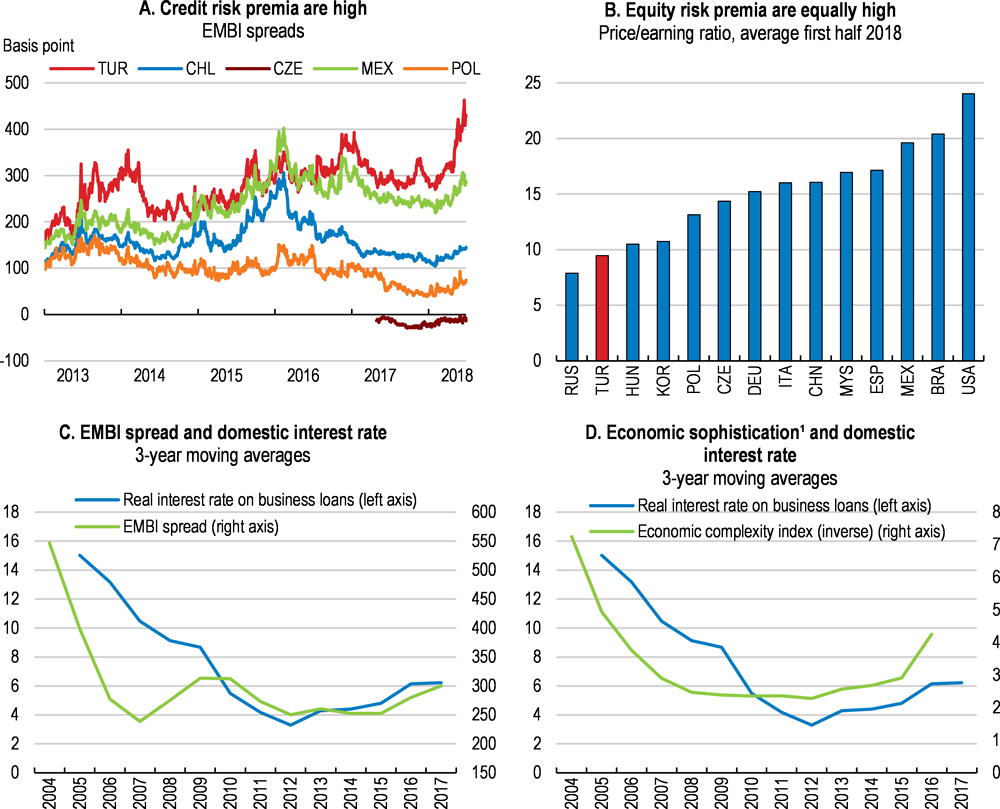
1. Economic sophistication (complexity) is measured by the knowledge intensity of an economy, as reflected in the diversity and ubiquity of its exports. See Note 1 in Figure 7 for more details. In the figure the inverse of the ECI (1/ECI) is plotted.
Source: Thomson Reuters Datastream (database); Central Bank of the Republic of Turkey; Observatory of Economic Complexity, Economic Complexity Index.
Keeping private credit and financial leverage in check
Turkey’s financial vulnerabilities have increased over the past decade. The debt of non-financial corporations as well as banks' dependence on external non-deposit funding have strongly increased (Figure 14). The massive government loan guarantees offered in 2017 alleviated short-term financial strains, but the share of own capital in the financing of businesses and banks is too low and must be increased to improve financial resilience. Bank capital ratios have also declined over the past decade. On the one hand, banks' capital adequacy remains strong in international comparison but, on the other hand, underlying risks, in particular currency mismatches, warrant stronger buffers.
Rising shares of foreign exchange (FX) deposits in total liabilities, and falling shares of FX loans in total loans, both largely reflecting the weakness of the Turkish Lira, have led to an increase in banks' on-balance FX positions from around TL 32 billion on average between 2014 and 2016 to more than TL 50 billion on average over the first quarter of 2018. At the same time, banks generally hedge open FX positions with off-balance sheet instruments leaving the total banking system's net FX position approximately at par (and even long during the first quarter of 2018).
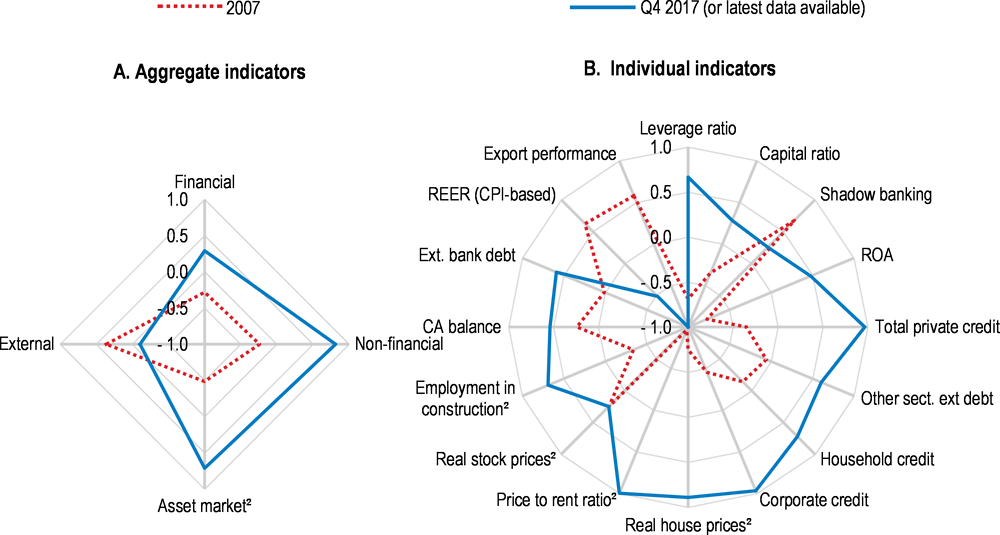
1. Each aggregate macro-financial vulnerability dimension is calculated by aggregating (simple average) four normalised individual indicators from the OECD Resilience database. Individual indicators are normalised to range between -1 and 1, where 0 refers to the long-term average, and a higher value denotes greater vulnerability. Financial dimensions include: leverage ratio, capital ratio (regulatory capital), shadow banking (% of total financial sector assets) and return on assets. Non-financial dimensions include: total private credit (% of GDP), other sector external debt (% of GDP), household credit (% of GDP), and corporate credit (% of GDP). Asset market dimensions include: real house prices, price-to-rent ratio, real stock prices and share of employment in the construction sector. External dimensions include: current account balance (inverted), external bank debt (% of GDP), real effective exchange rate, and export performance.
2. 2010 instead of 2007.
Source: Calculations based on OECD (2018), OECD Resilience Database, May.
The latest IMF Financial Sector Assessment recommended to reinforce the surveillance of non-performing loans and loan classifications to reduce risk exposures (IMF, 2017[15]). The significant increase in the share of loans reported as being “under close monitoring” between late 2017 and early 2018 (from around 4% to around 7 % of total bank portfolios) reflects progress in loan classifications and hints at a higher share of potentially problematic loans than previously assumed (CBRT, 2018[16]). Against this backdrop, relatively high loan loss provision rates of well above 70% provide a welcome buffer in the face of potential increases in non-performing loans.
The total debt of firms, households and government has been fairly stable since 2010, at around 200% of GDP, slightly above the OECD median according to national accounting standards. However, private leverage (debt-to-equity ratio) is considerably higher than in most OECD countries, in particular in the non-financial corporate sector where Turkey exhibits the highest leverage ratio across the OECD, illustrating the dearth of equity capital (OECD, 2017[17]). Total credit to private non-financial firms as a share of GDP increased from 20% in 2003 to 53% in 2010 and over 85% in 2017. Bank deposits increased more slowly, and the banking sector’s loan-to-deposit ratio reached the internationally high level of 120%, although it has stabilised since 2016. This ratio is particularly high in Turkish Lira as banks convert foreign currency liabilities (with low nominal costs) into domestic currency assets with higher nominal returns. The regulations introduced in May 2018 to align non-financial firms’ foreign exchange borrowing capacity with their ability to generate foreign exchange revenues, and the plans to extend these limits to all firms will increase business funding costs but are necessary given the magnitude of exposures and the associated risks (Figure 11, Panel B). As of March 2018, the foreign exchange debt of the private sector had attained USD 294 billion (35% of 2017 GDP), 85% of which was due by 2300 firms owing more than USD 15 million each and 50% by around 500 firms indebted by more than USD 100 million (CBRT, 2018[16]).
In contrast with the corporate sector, the soundness of household balance sheets has improved in recent years. The accumulation of credit card debt by potentially insolvent families has been contained by restricting the use of instalments and tying credit card limits to income levels. As a result, households' financial leverage has been on a declining trend since 2014 (CBRT, 2017[18]). The pace of deleveraging has slowed recently, as some of the prudential rules concerning housing loans, consumer loans and credit card instalments were relaxed. In September 2016, the loan-to-value limits of housing loans, the maturity limit of consumer loans and the instalment limit of credit cards were respectively extended from 75 to 80%, from 36 to 48 months, and from 9 to 12 months. This triggered an acceleration of retail and housing credit, which has stimulated housing demand, prices and construction (Figure 15).
There have been recurrent concerns about overvaluations in the Turkish housing market (IMF, 2016[19]). Some indicators suggest that the sector’s current cycle may have peaked in 2017. Real prices have started to fall, notably in Istanbul, newly granted housing occupation permits are down, and the unsold stock of apartments reached a historical level at above one million units at the end of 2017. The unsold stock is particularly large in the so-called “brand house” upper segment of the market. Against this backdrop the state-owned banks extended housing loans at concessional rates in Spring 2018. This is expected to stimulate housing demand in the short term, but risks re-fuelling excessive debt build-up among households.
Construction firms’ debt also remains among the highest in the business sector, and their interest cover ratios are among the lowest (Figure 15, Panel D). Any serious financial strains in the construction cluster could easily spill over, given the weight of the sector in the economy. Debt build-up in the construction cluster should be closely monitored and contained.
Higher housing debt calls for an increase in household savings in the future. In the short term, the strongest impulse to household savings is coming from the expansion of the voluntary pension system (BES). A government subsidy of 25% tops up the savings in long-term individual pension accounts managed by private fund managers. Automatic enrolment of all public and private sector employees in 2017 (with opt-out options) increased the number of participants from 6.6 million in 2016 to 10.3 million in 2017. As of June 2018, total savings of TL 84 billion were accumulated in these accounts, less than 2000 euros per person on average, but more than all other household investment vehicles in Turkey combined. However, due, among other factors, to the low returns achieved by BES-eligible funds so far, many participants (including half of all automatically enrolled participants in 2017) opted to withdraw from BES. Stronger competition between eligible funds and higher transparency of their performance would help improve their credibility and help the BES system to better fulfil its objectives.
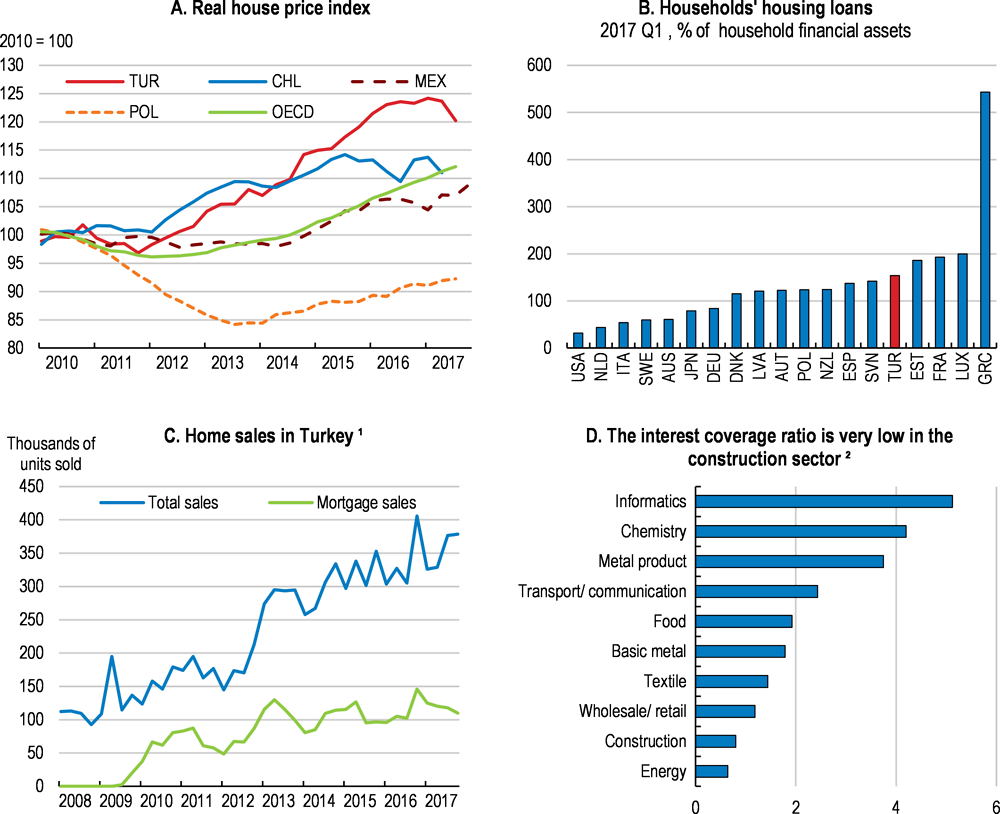
1. Number of units sold per quarter. It covers main cities and districts in 2008-12 and all settlements thereafter.
2. Interest coverage ratio (ICR) = Net operating profit (EBIDTA)/Interest expenses (including hedging costs) of firms listed in Borsa Istanbul. An ICR below 1.5 is generally considered as a sign of financial tension.
Source: OECD (2018), OECD Resilience (database), March; Turkstat and Central Bank of Republic of Turkey (2017), Financial Stability Report, May.
On top of the macro-financial vulnerabilities and challenges arising from the accumulation of aggregate external and internal debt, Turkey faces various domestic, regional and sectoral uncertainties (Table 4).
Macroeconomic policies
The macroeconomic policy stance has been supportive after the coup attempt in July 2016. Government spending increased strongly in the second half of 2016, and various tax incentives have been granted in 2017 and 2018. Additionally, the government has massively extended its Credit Guarantee Fund (KGF). Monetary policy remained supportive in the aftermath of the coup attempt, but was then tightened in several steps in 2017 and in the second quarter of 2018. The latest round of sharp monetary tightening and the simplification of the policy framework along international standard practices in June 2018 were highly welcome, but to fully restore the credibility of monetary policy the commitment of all stakeholders to central bank independence and actual progress with disinflation are indispensable.
Resuming fiscal consolidation and containing contingent liabilities
The headline fiscal position remained strong until early 2018, despite the considerable fiscal stimulus imparted in 2016 and 2017 partly due to stronger than expected growth. However, new spending pressures arose before the early elections in 2018, which are likely to override the consolidation objectives announced in the Medium-Term Programme 2018-20 published in Fall 2017. Whereas the MTP had projected a lower headline general government fiscal deficit, from -2.6% of GDP in 2017 to -2.2% and -2.1% respectively in 2018 and 2019, the IMF, after an analysis of the spending measures taken in early 2018, projected a widening to -2.9% of GDP in 2018 and -3.2% in 2019 (Figure 16). Furthermore, additional quasi-fiscal spending channels are being activated. Overall public finance transparency should be improved to monitor the actual fiscal stance to take account of all these developments, as underlined in past OECD Economic Surveys of Turkey (OECD, 2016[1]; 2014[2]).
The main areas where non-budgeted spending pressures augmented in 2018 include:
i. The conversion of 750 000 contract workers in the public sector into permanent government employees is increasing the public payroll and reducing the flexibility of public spending.
ii. New investment and employment subsidies not foreseen in the Medium-Term Programme 2018-20 have been introduced. One measure alone (the prolongation of the minimum wage subsidy which was to be discontinued at the end of 2017) will increase general government outlays (from the Unemployment Insurance Fund) by 0.2% of GDP. Other new subsidies have been announced, including a monthly subsidy of TL 883 (55% of the employment costs of a minimum wage earner) for each additional employee hired in 2018, and a new package of “project-based incentives” offered to selected investment projects.
iii. Defence spending will likely overshoot targets despite a significant increase in the 2018 defence budget, as a result of ongoing cross-border military operations.
iv. Two bonuses of TL 1000 each will be offered to all pensioners on the occasion of the two religious holidays in 2018, at a total fiscal cost of 0.7% of GDP.
v. A price compensation system is put in place, guaranteeing maximum diesel and gas oil prices to users at the price levels prevailing in mid-May 2018. Any changes in international oil prices and in the exchange rate which may entail domestic price increases after that date will be offset by symmetrical cuts in special oil taxes. The preparation and publication of revenue loss scenarios under alternative international and domestic/regional oil price and exchange rate assumptions would help measure the contingent fiscal liabilities of this scheme.
vi. The contingent liabilities of public-private partnerships (PPPs) in infrastructures are materialising, as a result of lower-than-predicted traffic in transportation facilities and of exchange rate depreciation (even though contingency payments for roads and direct payments for health sector PPPs stayed lower than budgeted in 2017, and likely in 2018). Public-private partnerships may entail further fiscal costs in the future as many of them contain minimum revenue guarantees denominated in foreign currency. This renders the contingent liabilities vulnerable to macroeconomic shocks. PPP liabilities are included in Medium-Term and Annual Budgets and in Annual Investment Programmes, and technical co-operation is ongoing between the Ministry of Finance and the World Bank and the IMF on the monitoring of the related fiscal risks. Nonetheless, only liabilities associated with PPP projects of a value of USD 14.6 billion, which were subject to debt assumption in case of early contract termination by the Treasury, have been included in the Treasury’s regular Public Debt Management Report so far. The total amount of PPP projects where different types of credit enhancement tools are provided as government liability including debt assumption by the Treasury is approximately USD 45.5 billion.
vii. Additional government guarantees will be provided to small business and trader and craftsmen loans in 2018, both from the Credit Guarantee Fund (KGF) and the Union of Craftsmen and Traders’ Credit Co-operatives (TESKOMB). Also, subsidized credits will be provided by the Union of Chambers and Commodity Exchanges of Turkey (TOBB) and by the SME agency KOSGEB. Additional credit facilities have been announced by public financial institutions in 2018, notably by the agricultural bank Ziraat, SME bank Halkbank and Turkish Eximbank. To the extent there is a support element in these loans, this subsidy content should be made transparent.
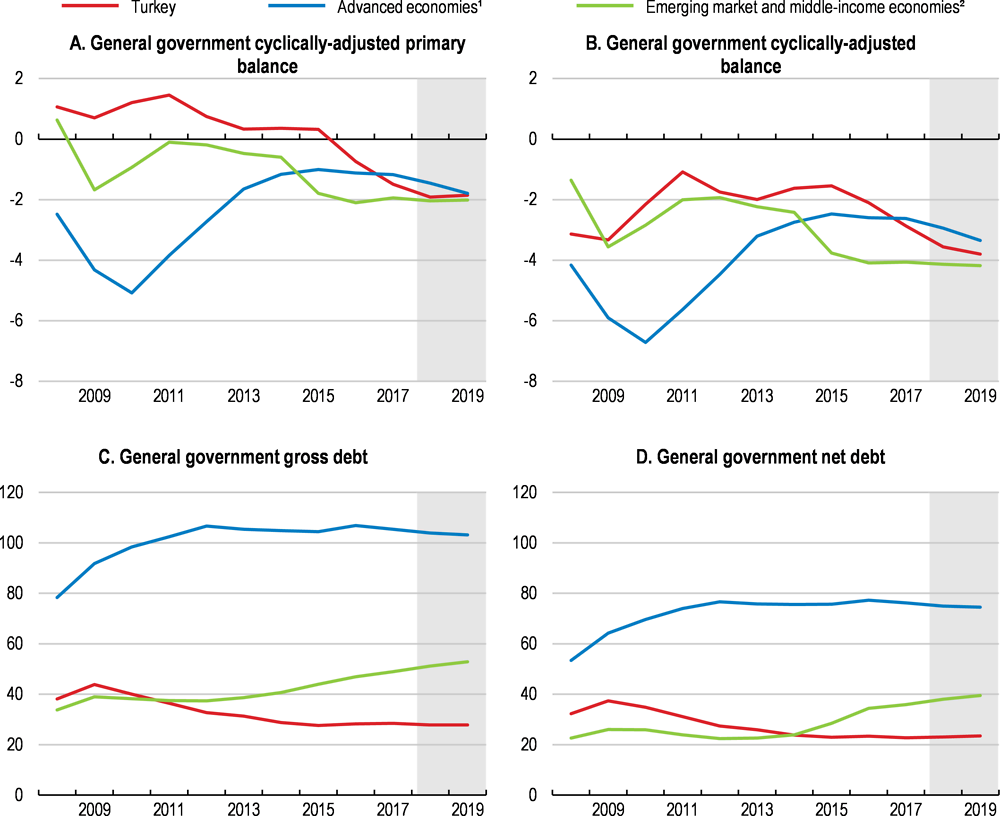
Note: Figures for 2018 and 2019 are IMF projections taking into account the targets of the Medium-Term Programme 2018-20 published in October 2017 but also the measures announced in early 2018.
1. 35 countries listed as advanced economies by the IMF.
2. 40 countries listed as emerging market and middle-income economies by the IMF.
Source: IMF (2017), Fiscal Monitor, April 2018.
While Turkey is one of the few OECD countries which still enjoy a “demographic window” - the working age population is growing more rapidly than dependent age cohorts – the window is rapidly closing. Even if the current trend increase in labour force participation - notably by female workers – and the increase in effective retirement age will partly alleviate the immediate impacts, both pension and health systems will face new pressures within less than a decade (Figure 17). Per capita public health spending is below OECD averages, but health spending pressures are building up due to ongoing transition to universal health insurance and the medical care provided to more than 3.5 million refugees. The fiscal implications of the ageing-related pressures on the pension system have not been formally quantified and discussed so far, but should be gauged and actively managed. Progress with respect to earlier OECD recommendations has been very limited in this area (Table 5).
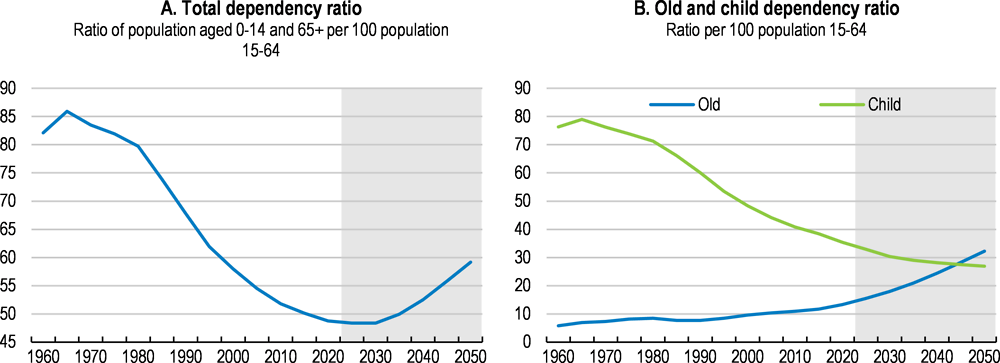
Note: The projection variant presented is the "zero-migration" one assuming medium fertility, normal mortality and no migration in 2015-50.
Source: United Nations, Department of Economic and Social Affairs, Population Division (2017). World Population Prospects: The 2017 Revision.
Re-prioritisation of expenditures
Public spending needs to be re-oriented to promote growth, job creation and social cohesion. The task is complicated by the fact that more than 70% of central government spending is earmarked, with half of that absorbed by the government wage bill. A recent study based on the Medium-Term Programme projects the share of earmarked spending to rise above 75% by 2020 (Dag, 2017[20]). Spending flexibility could be further reduced if borrowing costs of the Treasury continue to increase. The high level of rigidity limits room for additional public spending in crucial areas for inclusive growth, such as education, skills development, health and judicial infrastructures (Box 5).
Student enrolment rates have risen over the past decade at all levels, but quality has fallen short. Parents’ satisfaction with school quality is one of the lowest in OECD. Numeracy skills of 15 year-old students and working age adults are far below the OECD average (Figure 18). The relationship between these shortcomings and resource constraints has been empirically established (OECD, 2012[21]). Some key aspects of under-resourcing in the education system include:
i. Very few young Turkish citizens are enrolled in early childhood education, even though these early years lay the foundations for future skills acquisition, productivity and earning capacity. Only 9% of three year-olds are enrolled, against the OECD average of 78%. Enrolment rates of the 4 and 5 year olds reached respectively 50% and 70%, but remain below targets.
ii. Public expenditure per student is the lowest in the OECD. At purchasing power parity, public spending per student through primary and secondary school (ages 6-15) was USD 43 000 in 2014, against the OECD average of USD 124 000.
iii. Turkey has one of the largest differences in learning environments between public and private institutions: class sizes and student-teacher ratios are twice as large in public as in private institutions, implying inequalities in learning outcomes (OECD, 2017[22]).
iv. A large proportion of tertiary students study business administration and law, which are less onerous to teach than scientific and technical fields but offer below-average employment prospects. As tertiary education capacity is limited in these branches, the share of science, technology, engineering and mathematics (STEM) professionals is low, both among students and graduates, despite high demand by labour markets. Less than 20% of new university entrants can engage in these fields against the OECD average of nearly 30%.
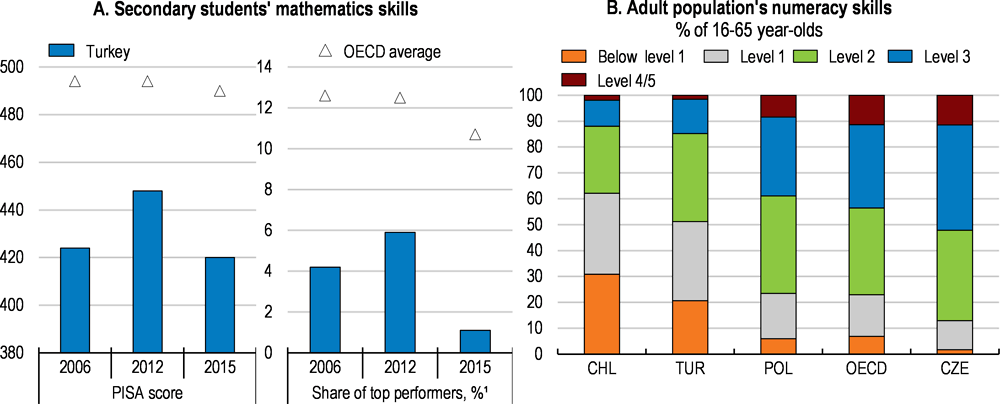
1. Proficiency level 5 or above on a scale of 1 to 6.
Source: OECD (2016), PISA 2015 Results: Excellence and Equity in Education (Vol. I) and OECD (2016), Skills Matter: Further Results from the Survey of Adult Skills.
Additional spending in education should be managed in the most effective possible way, to provide higher value for money. According to the performance budgeting goals of the 2003 Public Finance Law 5018 (which could not be implemented in the area of education so far), Turkey should engage in an ambitious effort to develop evidence-based spending rationalisation in education. A possible starting point could be the OECD’s evaluation and assessment frameworks for improving school outcomes (OECD, 2013[23]). Turkey’s domestic ABIDE database provides a good supportive infrastructure.1
← 1. This database covers all secondary school pupils and can help analyse the academic achievements of students exposed to different school contexts and curricula. Impact assessment controlling for socio-economic backgrounds and other personal characteristics would provide an evidence basis for detecting the school contexts, curricula and pedagogical approaches offering the best educational outcomes.
Redesigning the tax and benefit system to foster inclusive growth
On the revenue side, the low level and the composition of tax receipts are growth-friendly, but significantly less redistributive than in other OECD countries (Figure 19). In 2016, with a tax-to-GDP ratio of 26%, Turkey ranked 32nd out of 35 OECD countries. Compared to other countries, the tax structure is characterised by substantially higher revenues from goods and services taxes (including energy taxes) and higher revenues from social security contributions and value-added taxes. In contrast, the share of taxes on corporate income, personal income and property is low (OECD, 2017[24]). This notably reflects extensive tax evasion, calling for a more transparent and even-handed tax structure. The ongoing extension of digitised tax administration provides a basis for future reform initiatives in this area (Digitalisation in Taxation, 2018[25]).
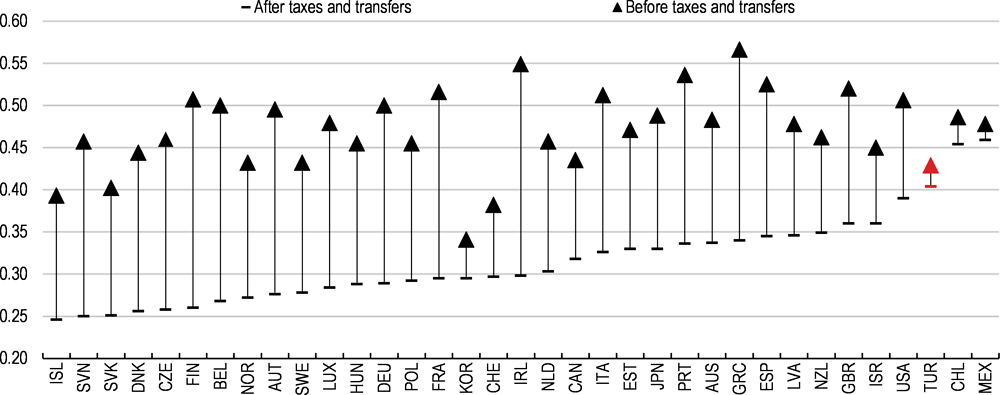
Source: OECD (2018), OECD Income Distribution (database).
Subsidies and tax incentives to the business sector have recently been expanded considerably. The Working Group on the Efficiency of Incentive Measures of the National Development Plan 2019-23 identified 75 different incentive and subsidy schemes in place in 2017. These state aid instruments available to particular types of regions, as described in Table 6, are also made available to particular types of projects:
“Priority projects” cover investments in 17 specific areas (spanning from rail and sea transportation to “high-technology” sectors according to the OECD definition). If these investments are realised in Type 6 regions and in the Organised Industrial Zones (OIZs) of Type 5 regions, they benefit from additional supports on top of existing incentives in these regions (Table 6). An exceptional extension was recently granted to investments in these sectors in all regions of Turkey, which then qualified for Type 5 region incentives irrespective of their regional location (see below) (Ministry of Economy, 2018[26]).
“Large-scale projects” concern investments of a minimum size (defined separately for each sector) in 12 selected sectors. Minimum investment scales span from TRY 50 million in car components, to TRY one billion in oil refining. Due to their large size these projects are expected to embody leading-edge technologies. They benefit from additional supports on top of the incentives available in the regions where they are implemented (Ministry of Economy, 2018[27]).
“Strategic projects” cover investments with a high promise to reduce import dependence. Projects fulfilling four conditions are eligible: i) a minimum investment scale of TRY 50 million, ii) implementation in an area where domestic production capacity is below current import volumes, iii) a firm-level value-added rate of at least 40%, and iv) upon completion, offering a potential to reduce imports by at least USD 50 million. They are granted additional benefits on top of the existing incentives in the regions where they are implemented (Ministry of Economy, 2018[28]).
“Regional Attraction Centers” are settled by the decision of the Council of Ministers, to benefit from the incentives available in Type 6 regions.
In March 2018, a set of 23 large-scale investment projects by 19 firms have been granted a package of aids denominated “project-based incentives”, which combined various elements described in Table 6, including a temporary extension of eligibility criteria for “priority projects”. The total volume of eligible investments was estimated at USD 34 billion (4% of 2017 GDP). The supported projects span a large set of sectors, from special metals, aluminium sheets and carbon fibers to railway engines, car batteries and diesel motors. The package was introduced with a special focus on the reduction of intermediate input imports that these projects are expected to deliver in the future.
To clarify the policy objectives set for these programmes, and to be less costly for public finances and less distortive for competition, the available set of incentives should be simplified and made more transparent. For this purpose, the legislated but not implemented annual report on state aids (which draws on the extensive monitoring and incentive-transparency experience of EU countries) can be utilised.
A regular Fiscal Policy Report, long advocated by the OECD (Table 8), would make the short- and long-term strengths and vulnerabilities of the fiscal system more transparent. Such a report should cover the general government sector as a whole. It would serve to implement the strategic and performance-oriented budgeting and the public sector reform objectives of the well-designed but still-pending 2003 Public Finance Law 5018. Its full enforcement would help achieve the fiscal savings needed to re-orient spending towards more growth and employment friendly uses.
Restoring monetary policy credibility requires joint commitment
Headline and core inflation have steadily risen from 6% in 2011 to double-digit levels in 2017, well above the official target of 5% (Figure 20, Panel A). Turkey had the highest average inflation rate among peer countries over the past five years (Panel B), with harmful impacts on economic predictability and competitiveness. Several measures including relaxed macro-prudential policies, public incentives and the Treasury-backed Credit Guarantee Fund (KGF) have improved overall credit conditions and strengthened aggregate demand, but in turn also weighed on the inflation outlook. Central banks do not generally respond to temporary shocks hitting headline inflation. Nonetheless, the worsening outlook in core inflation, which played a central role in the deterioration of expectations, pushed the central bank to increase its effective funding rate through 2017, without, however, modifying the standard policy rate and merely shifting its funding operations toward higher-cost late liquidity window instruments. These interventions did not suffice to re-anchor expectations and failed to avoid sizeable subsequent currency depreciation.
The central bank took more decisive action in the second quarter of 2018. The policy rate was successively increased by 75 and 300 basis points in April and May respectively. In June, the monetary policy framework was simplified around a standard one-week policy rate with a symmetric adjustment corridor of overnight (borrowing and lending) rates, and the policy rate itself was raised by an additional 125 basis points – above average expectations. A range of foreign exchange liquidity easing measures was also announced to the market, via the central bank’s reserve option and export rediscount credit channels. The return to a standard monetary policy framework responds positively to one of the past OECD recommendations (Table 8), and, together with the concurrent sharp tightening, should help restore credibility. The central bank should now present forward guidance as to how it plans to bring inflation toward the target ‒ which is its sole mandate. Plausible inflation forecasts should help spell out the targeted disinflation path and the intended orientation of policy interest rates required to achieve it.
The upward trend in inflation expectations calls for a joint and explicit commitment of the central bank, the government and social partners to the inflation target. A credible commitment by all stakeholders to the central bank's independence could bring down inflation expectations and contain exchange rate volatility, even without further tightening. In addition, the government can make increases in indirect tax, administrative price, public wage and official minimum wages more predictable, to minimise unexpected shocks to headline inflation which unsettle wage demands and pricing behaviour. These shocks also make the reading of the underlying inflation trends more difficult and disturb long-term inflation expectations. A commitment by the social partners to credible official inflation projections and to the long-term inflation target in private sector wage negotiations would also be highly supportive.
Several features of the economy magnify the challenge faced by the central bank. As in all open economies, inflation is highly sensitive to import prices and the exchange rate, which are in turn highly affected by inflation overshooting (Figure 20, Panel E). In line with (Borio and Filardo, 2007[29]) and (Zhang, 2015[30]), who found that global factors play an increasing role in inflation outcomes in open emerging economies, recent empirical analyses on Turkey confirm that the contribution of exchange rate and import prices to inflation is higher than that of domestic cyclical conditions (Kara, Ogunc and Sarikaya, 2017[31]), with only one-third of the components of the consumer basket found to be responsive to the domestic output gap (Atuk, Özmen and Sarikaya, 2018[32]). In addition, the stickiness of prices in several product and services markets (notably in unprocessed and processed food markets), the large weight in the consumer basket of goods and services whose prices are either administered or influenced by indirect taxes, and strong nominal increases in official minimum wages irrespective of labour market conditions, all contribute towards weakening the responsiveness of prices to cyclical developments and policies.
Against this backdrop, the Food and Agricultural Product Markets Monitoring and Evaluation Committee, an interministerial committee supported by the central bank, is seeking to address some of the structural factors underpinning inflation developments. The targeted trade liberalisation measures that it has recommended to control the periodic excesses observed in the price of food products such as cereals, pulses and red meat and to prevent speculative movements, have already been partly implemented. It is also advocating more structural measures to stimulate agricultural and livestock production, rationalise supply distribution chains and logistics in food products, and competition in wholesale and retail food products markets. The authorities hope that these efforts will serve to reduce food price volatility and improve the efficiency in food production and distribution in the longer term.
Turkey also faces the standard dilemma of catching-up economies with high inflation and an open capital account: tensions occasionally arise between price and real exchange rate stability (inflation and competitiveness) objectives (Rey, 2015[33]), (Obstfeld, Issing and Ito, 2015[34]). As shown in Box 6, the sensitivity of the central bank to the deviation of inflation expectations from the inflation target had weakened in recent years, while its sensitivity to output deviations from potential had increased. Strengthening the institutional setup by reinforcing central bank independence will be important to help improve the responsiveness of monetary policy to the deviation of inflation expectations from target.
The interest rate policy of an inflation-targeting central bank can be observed through the lens of a simple Taylor rule linking the policy interest rate to the deviation of inflation from target and the size of the output gap (Güney, 2016[35]); (Turkay, 2017[36]). This Box estimates Taylor rule specifications for different periods. The results suggest that the central bank responded significantly to the deviation of inflation expectations from target before the so-called taper tantrum in 2013, but no longer did so thereafter. Meanwhile, its response to output deviations and to exchange rate depreciation became significant and its reaction to the policy rate of the US Federal Reserve strengthened.

1. 5-day moving average.
2. This is the rate at which the central bank lends unlimitedly to banks, under the lender-of-last-resort function, within the last hour of the market days.
From January 2017 to May 2018, the central bank used this rate for funding and it became the main policy rate as of late November 2017 since all funding was provided through this facility.
Source: Turkstat; Central Bank of the Republic of Turkey and OECD (2018), Main Economic Indicators (database).
Structural policies
Turkey’s entrepreneurial dynamism stands out, despite challenging conditions for doing business (Figure 21). A large number of medium-sized firms now constitute a “growing middle” between large formal businesses and small, informal, low-productivity activities. This vibrant business sector underpins the Turkish economy’s resilience and helps achieve more inclusive growth. Nonetheless, human capital as well as institutional and regulatory frameworks still fall behind internationally. As analysed in previous OECD Surveys and despite several reform initiatives in recent years (OECD, 2016[1]; 2014[2]), these shortcomings continue to lead many firms to operate semi-formally in order to circumvent the most rigid regulations. This hinders the growth of the firms with the highest potential and slows down the transfer of resources to the best-performing parts of the economy.
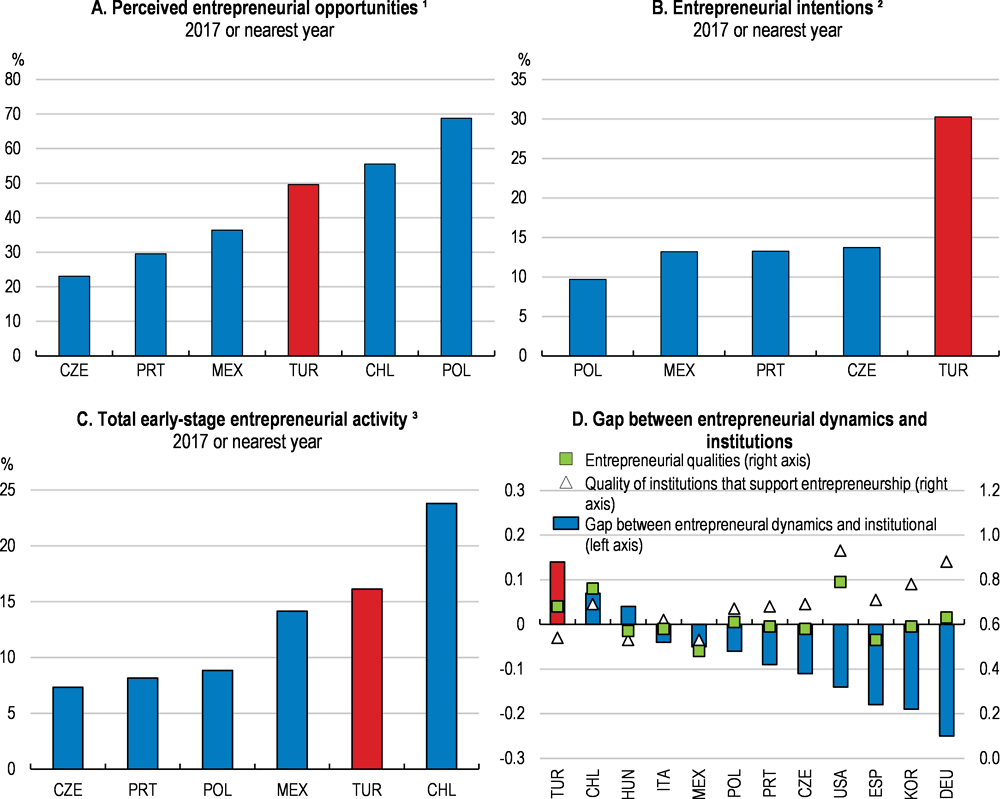
1. Percentage of 18-64 population who see good opportunities to start a firm in the area where they live.
2. Percentage of 18-64 population who are latent entrepreneurs and who intend to start a business within three years.
3. Percentage of 18-64 population who are either a nascent entrepreneur or owner-manager of a new business.
Source: Global Entrepreneurship Research Association, London Business School, Global Entrepreneurship Monitor (database, http://www.gemconsortium.org/data) and Global Entrepreneurship and Development Institute, Global Entrepreneurship Index 2018.
Promoting formalisation in the business sector
To overcome this “informality trap”, policymakers have recently expanded the financial incentives offered to formal businesses - including substantial social security contribution cuts for newly hired workers, and corporate tax allowances for up to 55% of eligible investment costs (Table 6 above). In contrast, regulatory reforms addressing the root causes of informality and semi-formality more directly have been delayed. Fresh OECD indicators of product and labour market regulation are not available but the yearly updates of the World Bank’s Doing Business indicators show that there is room for improvement in Turkey’s business-making environment in international comparison (Figure 22).
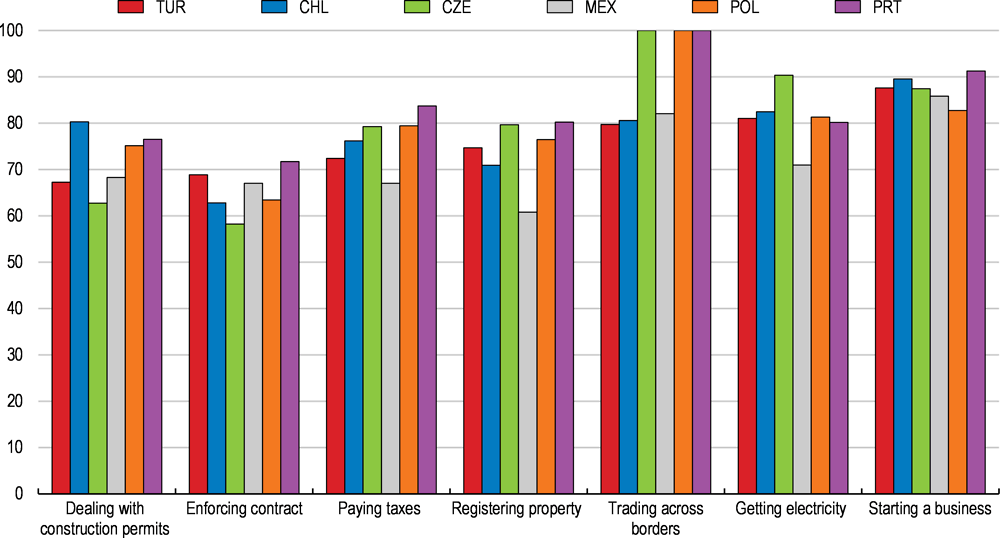
Source: World Bank, Doing Business Indicators 2018 (database, http://www.doingbusiness.org/). These scores do not take into account the impact of the measures which started to be introduced in 2018.
Labour market regulations remain more rigid than in comparable countries (Figure 24, Panel A), despite important reform efforts in recent years. These included the liberalisation of temporary work agency services (under still restrictive conditions), the introduction of a simplified dispute resolution mechanism, new legislation covering remote work (including telework), and easier hiring of qualified foreign workers. The rigidities documented in earlier OECD Surveys on the basis of the OECD Employment Protection Indicators (OECD, 2016[1]; 2014[2]) were only partly alleviated. The fixed-term employment contracts and the redundancy rules remain restrictive. Turkey also stands out as the OECD economy with the highest minimum/median wage ratio (Figure 24, Panel B). Following the substantial minimum wage increase in 2016, a slight increase in informality has been observed, somewhat contrasting with its trend decline. In the presence of large productivity and price disparities across regions, setting minimum wages regionally may be less damaging for employment, and for higher-productivity formal activities. The recent increases of the minimum wage at national level were nonetheless in line with the earlier OECD recommendation to maintain its real growth rate below labour productivity growth (Table 10).
Turkey faces also important challenges stemming from sizeable inflows of refugees. According to the Ministry of Interior figures, there were more than 3.5 million refugees from Syria alone in June 2018, 2 million of whom are of working age. Including refugees from Iraq and other countries, the total number of refugees approached 4 million. In 2017, around 600 000 refugees were employed as unregistered (informal) workers (Kaygisiz, 2017[39]). Ministry of Labour and Social Security figures indicate that, in contrast, only around 40 000 Syrian refugees had been granted official work permits by March 2018 (Milliyet, 2018[40]). The implied rate of informality of at least 95% eases the activation of refugees but is a formidable challenge for the operation of the Turkish labour market, where the authorities try to reduce informality. It also complicates the social inclusion of refugees.
Policymakers are aware of the need to further improve the employability of the low-educated majority of the working age population in the formal sector, as major imbalances persist in the labour market. Participation rates – including for low-skilled, young and female workers – are trending up and so is the employment rate, albeit from low levels. Net job creation is strong throughout the country but the labour force expands by around 3½% per annum on average and unemployment rates remain high, at around 10% (Figure 23).
The authorities are developing active labour market programmes and are reducing the formal employment costs of certain types of workers in given types of firms. The schemes are limited in coverage and duration, but should help test if upskilling efforts, combined with significant cuts in actual employment costs, may tangibly foster formal employment (Table 9). In addition to these measures, the government has more recently introduced a 100% social security exemption for young entrepreneurs (amounting to 35% of their declared earnings for up to a year), and extended the duration of one of the expiring regional social security contribution exemptions by one year.
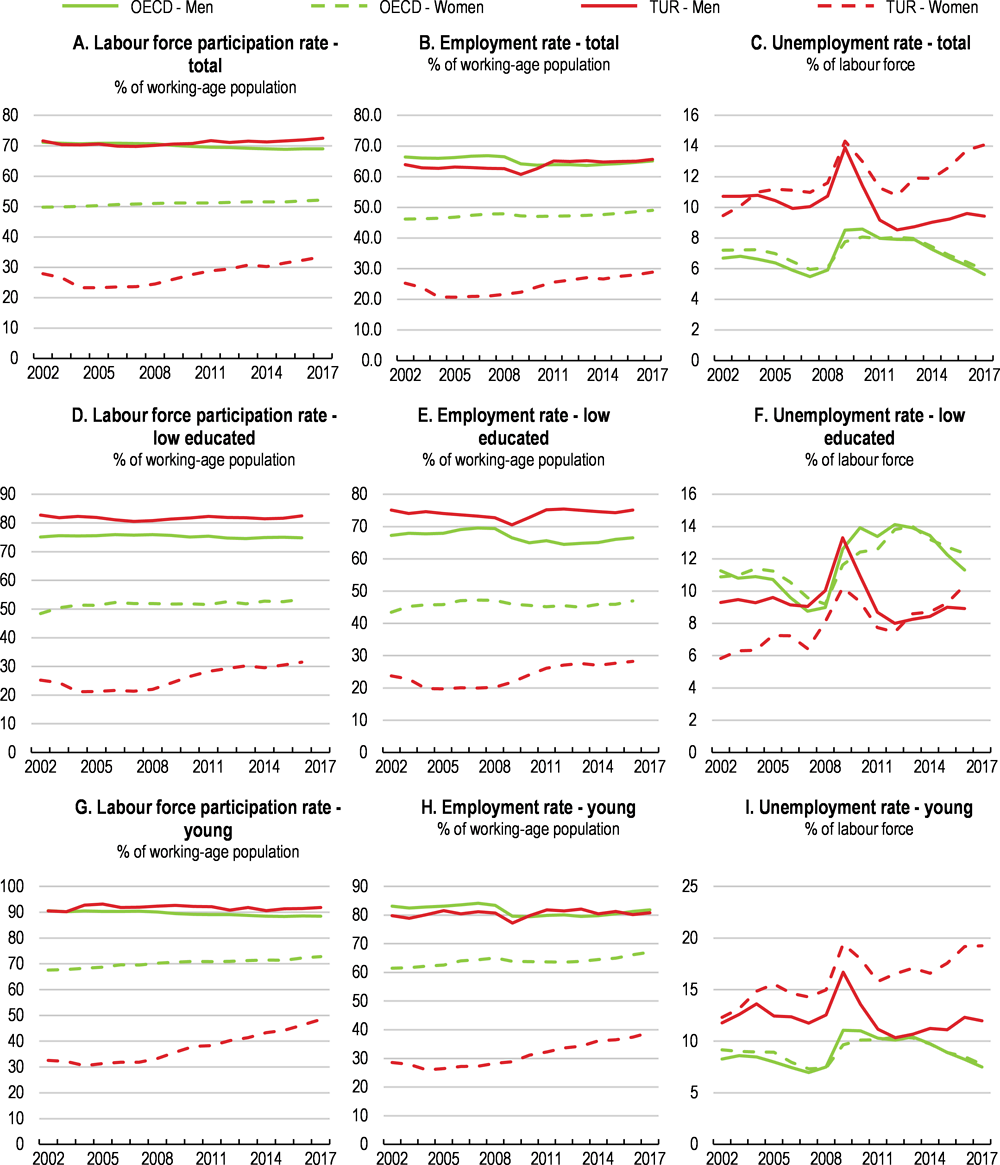
Note: The low educated population refers to the population who attained below upper secondary education. The young population refers to the population aged between 25 and 29.
Source: OECD (2018), OECD Labour Force Statistics (database); and OECD (2017), Education at a Glance (database).
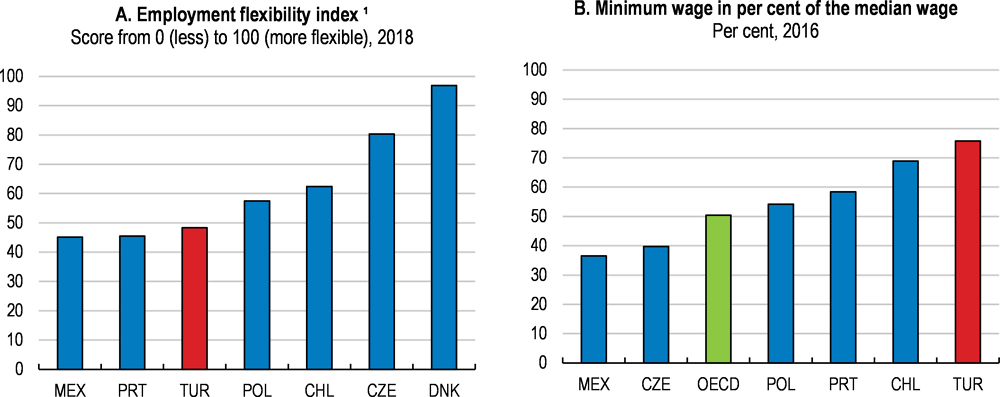
1. The higher the score (from 0 to 100), the more flexible labour regulation is.
Source: Lithuanian Free Market Institute (2018), Employment Flexibility Index 2018: EU and OECD countries, on the basis of the World Bank methodology and questionnaire for measuring labour regulations and OECD Labour Force Statistics (database).
Improving institutions and upgrading the business environment
The 2016 OECD Economic Survey of Turkey argued that attracting additional FDI, facilitating integration in global value chains and encouraging high-quality start-ups requires progress with the credibility of the rule of law, the fight against corruption, and the reduction of distortions affecting competition between formal and informal sectors (OECD, 2016[1]). In some of these areas, gaps vis-à-vis international good practices have widened lately (Figure 25). The EU Accession process, which played a major role on this front in the past, has stalled.
The Government has recently set itself a new ambitious goal of raising Turkey’s rank in the World Bank Doing Business indicators from 60th among 190 countries in 2017, to 20th within two years. A first law was adopted by Parliament in March 2018, to facilitate procedures for company establishment, and for the obtention of permits for construction and for access to infrastructure, telecommunications and municipal services. A companion law simplified the insolvency and bankruptcy procedures: firms can apply for rescue agreements before filing for bankruptcy, creditors are allowed to participate in procedures, and liquidations must be completed within 24 months.
Intellectual property protection has also improved. A new Law on Industrial Property Rights entered into force in 2017, replacing all existing decree laws in this area with a single compact law with specific chapters on Patents, Trademarks, Industrial Designs, Geographical Indications and Traditional Specialties. The administrative capacity of the Patent Institute (Turkpatent) has been reinforced for effective implementation. In the area of copyrights, new legislation on Intellectual and Artistic Works was forwarded to Parliament in April 2018. It aims at further alignment with the EU acquis, better fighting digital infringements and easier settlement of licencing disputes.
More generally, the material and human resources for judicial procedures, notably for economic cases, have been strengthened. Regional appeal courts were created to alleviate the burden of an excessive number of appeals to the Supreme Court and the ensuing delays. Courts specialised on commercial litigations are being established, which will have rapid access to expert witnesses. The budget of the Ministry of Justice was lifted from 1.4% of the government budget in 2012 to 1.7% in 2017 - amid a strong increase of the total budget itself.
Policymakers also intend to make Turkey’s Organised Industrial Zones (OIZs) and Technological Development Areas (TGBs) more attractive for business investment, to improve the business and technological services available for SMEs in OIZs, and to provide public support for digital transformations in small and large firms alike (Box 1). The National Development Plan 2019-23 is expected to spell out further policy objectives.
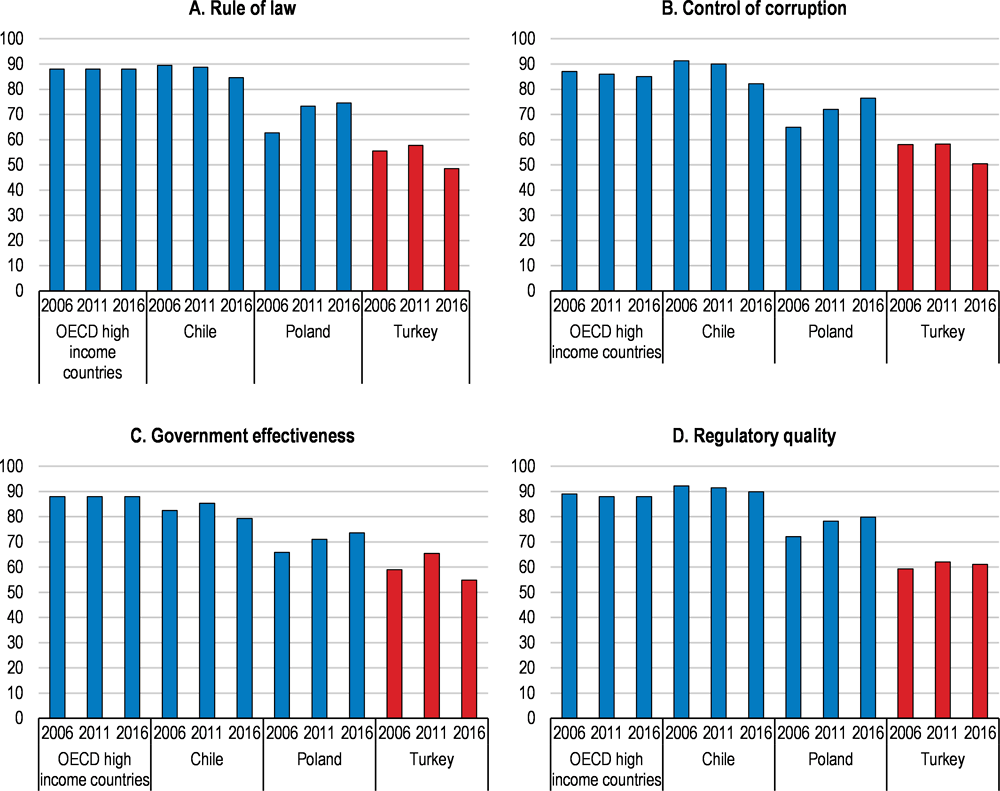
Source: World Bank (2017), Worldwide Governance Indicators, www.govindicators.org.
Key well-being challenges
Material living conditions have improved considerably
Relative to other OECD countries, Turkey has achieved substantial gains in well-being over the past decade. These improvements were largely generated by the employment and income gains from strong growth, thanks to the effective macroeconomic stabilisation and EU-convergence reforms of the 2000s, which benefitted all social groups. The main areas of progress included (OECD, 2017[41]):
-
Jobs and earnings. The rate of employment of the working age population rose by more than 6 percentage points since 2005 (versus 1.2 for the OECD average).
-
Unemployment. Amid rapid labour force growth and despite robust job creation, the rate of unemployment was close to 10% in early 2018, against an OECD average of 5.8%. Still, the long-term unemployment rate, at 2.2% in 2016, was half its 2005 level, and below the OECD average of 2.6%. The share of 15-29 year olds neither in education nor in employment (NEET) fell by 14 percentage points between 2008 and 2016, but remains high, at 28% (twice the 14% OECD average).
-
Housing. Housing affordability has improved and the average number of rooms per person remained stable. The share of people living in dwellings without basic sanitary facilities has fallen substantially but remains high at 6.5% ‒ over three times the 2.1% OECD average.
-
Work-life balance. The proportion of employees working regularly more than 50 hours per week declined from 50% in 2006 to 34% in 2016, still far above the 13% OECD average
-
Life satisfaction. Turkey’s citizens have reported improving life satisfaction since 2005. The average life satisfaction score is 5.5 on a scale of 10, against the 6.5 OECD average.
-
Environment. The proportion of people satisfied with their water quality is 4 points higher than 10 years ago. In contrast, exposure to PM2.5 air pollution increased by 12% between 2005 and 2013 and reached hazardous levels in many regions. Average exposure to PM2.5 was 21.8 μg/m3 in Turkey in 2015, exceeding the 14.5 μg/m3 OECD average.
Even so, quality of life is still below OECD averages on many dimensions (Figure 26), with important inequalities, both vertical (within population groups) and horizontal (between population groups such as men and women and residents in different regions).
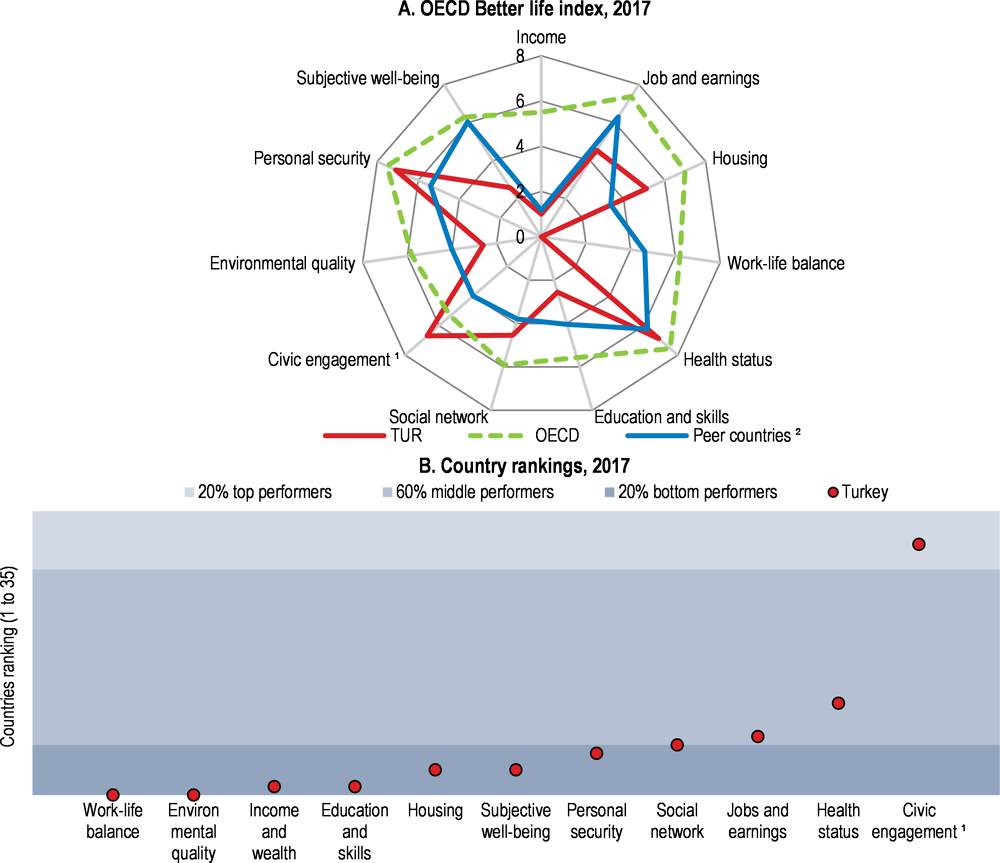
1. The OECD civic engagement benchmark is based on voter turnout and Turkey is ranked 6th. Other sub-indicators measuring participation in political activities are also available, but only for a smaller number of countries and are not included in the standard benchmark. Turkey ranks lower in these sub-indicators.
2. Chile, Mexico and Poland.
Source: OECD (2017), Better Life Index database, www.oecdbetterlifeindex.org.
Vertical inequalities in well-being
The most important vertical inequality in well-being concerns wealth and income distribution. Income gaps are driven by secular differences in inherited wealth, and by significant inequalities in the labour market positions of family bread-earners.
Concerning wealth distribution, according to one private sector study in 2014 (which is the only recent information source in this area), the share of the 1% wealthiest citizens in total financial and real estate wealth in Turkey is estimated to have grown from 41% in 2005 to 54% in 2014, higher than in comparable OECD countries such as Mexico and Chile; the share of the following 9% declined from 28% to 23%; and that of the following 90% declined from 31% to 22%, lower than in comparable OECD countries (Credit Suisse Research Institute, 2014[42]). A periodic wealth distribution survey by Turkstat would help generate official data in this important area. As the share of wealth and inheritance taxes is one of the lowest in OECD (at 1% of GDP despite the inclusion of lottery and hazard game taxes in this category) the tax system plays a negligible role in wealth redistribution.
The labour market positions of family bread-earners are very uneven. Despite an expansion of formal sector wage earning jobs over the past decade, only 40% of the male working-age and 15% of the female working-age populations are formally salaried. Informal jobs, including informally self-employed (mainly male) and unpaid family workers (mainly female), remain widespread (Figure 27). The pace of labour force growth at above 3% per year is putting permanent pressure on the labour market, and the supply of high-quality jobs by high-quality firms is falling short of demand. Past OECD Surveys showed that transition rates from lower-quality to higher-quality jobs were low in Turkey (OECD, 2014[2]) and they have not improved recently: the rate of informality outside agriculture even rose slightly in 2017. One third of Turkey’s total value added is estimated to be generated by informal activities (Medina and Schneider, 2018[43]).
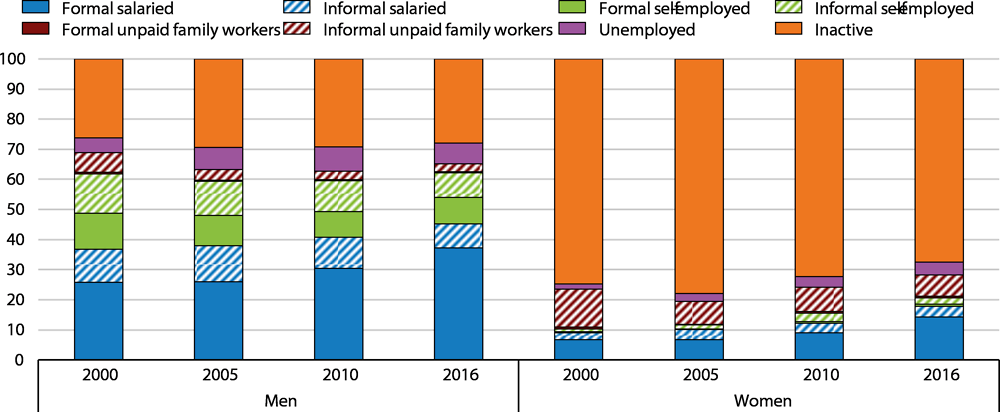
Note: Formal unpaid family workers are family members doing household work, paying social security contributions and earning pension rights.
Source: Turkstat.
Median household earnings grew more rapidly than average incomes – showing that growth has been inclusive (Boarini, Kolev and McGregor, 2014[44]). The lowest income deciles obtained the fastest income gains over the past decade, and the highest income decile the lowest. As a result, Turkey is one of the few OECD countries where the Gini coefficient of the income distribution has improved over the past decade. Nonetheless, partly due to the limited redistributive power of the tax and benefit system (OECD, 2016[1]), Turkey still exhibits one of the highest Gini coefficients at 0.40 in 2015 against the OECD average of slightly below 0.32.
Social expenditures, including cash transfers and in-kind services to the disadvantaged, grew more rapidly than in the other OECD countries ( (OECD, 2016[45])). (Figure 28, Panel B) benefitting mainly low-income elderly, people with disabilities, and families with members with special health problems (Kızıler, 2017[46]). The poverty rate (defined as persons living with less than USD 4.3 per day) fell from 13% in 2006 to 1.6% in 2016. Relative poverty (persons living with less than 60% of median income) decreased from 25% to 21%.
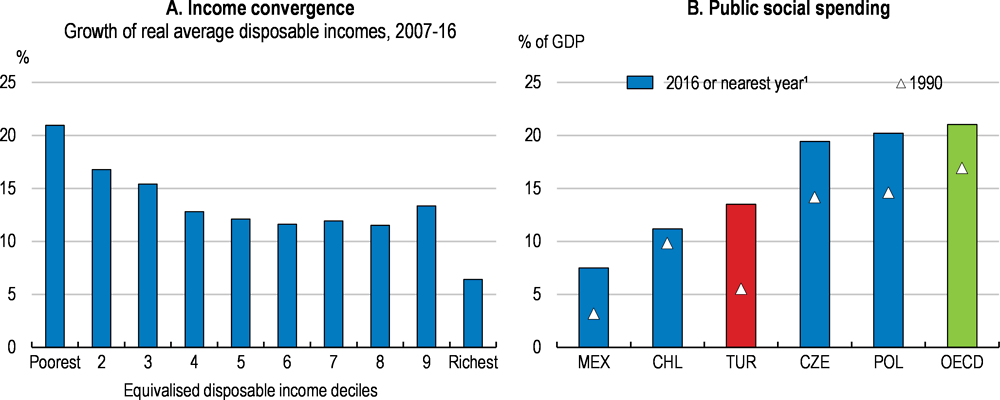
1. 2015 for Chile, 2014 for Turkey and 2012 for Mexico.
Source: Turkstat and OECD (2017), OECD Social Expenditure (database).
Vertical well-being inequalities are also affected by the interaction between material living conditions and broader measures of quality of life. In Turkey, lower income groups are becoming more satisfied with their lives, possibly as a result of improvements in material living conditions. In contrast, higher-educated and higher-income groups appear to experience a slight decline in life satisfaction. This may be related to their unfulfilled expectations in areas such as the educational opportunities for children, the cultural environment, civic life standards and environmental quality. Between 2012 and 2015, on a scale from 4 to 8, the average life satisfaction of Turkish citizens with only compulsory education increased from below 5 to 5.5, while that of citizens with high education edged down from 7.1 to 6.9 (OECD, 2017[47]). Nationwide, Turkey is among the countries where the relationship between material living conditions and quality of life appears weak (Figure 2).
Recent international surveys shed new light on Turkish citizens’ perceptions of their living standards. Turkish citizens appear more upbeat than the EU citizens about the gains they expect in their material living conditions over the next two decades (Vodafone, 2017[48]). The youth believe that they will live better than their parents, in higher proportion than in most other countries. Nevertheless, an earlier survey in 2014 had found that three quarters of young Turkish citizens declared that they may find better opportunities abroad, and a majority of them were prepared to move for this purpose (Vodafone, 2014[49]). Indeed, the proclivity to emigrate appears on the rise among the highly educated (Sirkeci, 2017[50]), pointing to risks of economically and socially costly brain drain.
Horizontal inequalities in well-being
Gender gaps
Gender gaps remain large in Turkey. They have long been driven by inequalities between men and women in educational attainment, labour force participation and decision-making. They were initially rooted in cultural patterns discouraging women’s labour force participation in urban areas, and were then entrenched by the ensuing severe shortage of child and elderly care facilities. While practically eliminated for the education age cohorts, adult women are still 20% less likely than men to have attained upper secondary or tertiary degrees, and their average rate of labour force participation is only 34% in 2016 against a 64% OECD average. In contrast to men, whose participation rate is close to the one observed in other OECD countries (above 70%), more than two-thirds of the women are inactive (Figure 27).
Recent initiatives to further develop pre-school education and to help families to better reconcile work and child care responsibilities (including an important increase in nursery support for working women and the option offered to both mothers and fathers to work part-time at the termination of paid maternity leave) may help to reduce this gap (Table 11). For those who work, however, the earnings gap vis-à-vis men is below the OECD average - at around 8% for median earnings of full-time employees against an OECD average of 14% (OECD, 2017[41]). Even so, overall, gender equality falls short of its expected level, given Turkey’s economic, social and educational achievements (Box 7).
The inequalities between male and female workers are particularly sensitive to their respective educational backgrounds on the one hand, and to the quality of their employer firms on the other hand. Higher educated women, who represent 30% of the 25-34 and 8% of the 45-54 cohort experience much smaller pay and employment status gaps than lower educated counterparts. The vast majority of highly educated women are employed formally. In formal enterprises, the average education level of women is above the average education level of men (OECD, 2016[51]). Moreover, women working for high quality enterprises appear to enjoy better opportunities than their counterparts in other countries. According to a 2016 survey, 41% of top management positions in the 100 most “female-friendly” companies in Turkey were occupied by women, not significantly below 53% in the United States. In the financial sector, the proportion is 56%, above many other countries. Such gender-friendly outcomes, however, are not observed in the remainder of the business sector: in the vast majority of firms there are no women in top management (McKinsey, 2016[52]).
The consequences of gender gaps for both well-being and economic growth are significant (McKinsey, 2016[52]). Should Turkish women’s labour force participation converge to today’s OECD average within 10 years, Turkey’s GDP per capita level could be around 20% higher than the baseline trend. Several measures over the past decade which reduced the employment costs of female workers in the formal sector stimulated higher quality job creation for women (Uysal, 2013[53]; Gürsel, Uysal and Acar, 2014[54]). Pilot projects have shown that good quality child and elderly care infrastructure at affordable costs are also crucial for Turkish women’s labour force participation (Ministry of Development, 2018[55]). If a comprehensive gender equality strategy encompassing this full range of factors is implemented, gender gaps may be reduced more rapidly in the future than they have been in the past.
On a range of 83 quantitative indicators covering economic participation and opportunity, access to education, political empowerment and health, Turkey ranked 131st among 144 nations in gender equality in 2017 (Figure 29).
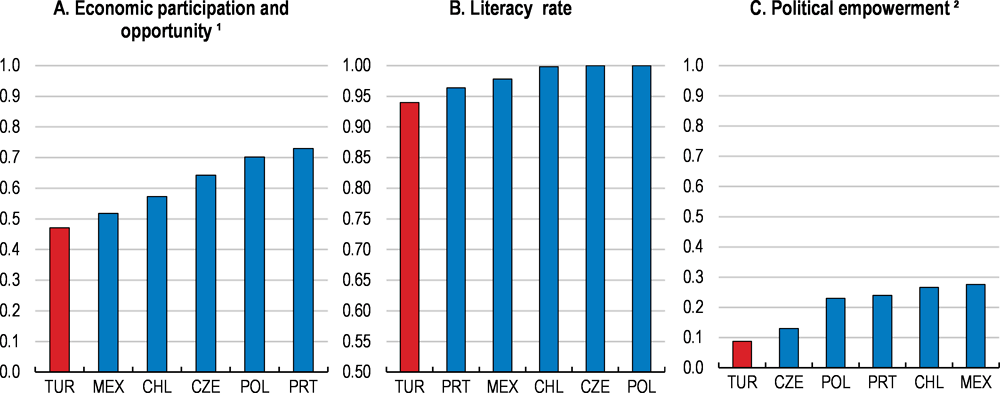
1. Includes labour force participation; wage equality for similar work (survey); estimated earned income (in USD PPP); legislator, senior officials and managers; and professional and technical workers.
2. Includes women in parliament; women in ministerial positions; and years with female head of state (during the past 50 years).
Source: World Economic Forum (2017), The Global Gender Gap Report 2017.
In economic participation and opportunity (which captures labour force participation, earned incomes and professional advancement), Turkey ranked 128th. Its ranking was also weak in political empowerment, at the 118th place: it ranked 108th in terms of the number of women deputies in parliament, and 135th for ministerial positions. Turkey ranked 59th in the health dimension, which is based on the sex ratio at birth (where Turkey tops the ranking) and on healthy life expectancy (where Turkey ranks 68th).
Regional gaps
Regional income disparities shrunk during the 2000s (Ministry of Development, 2014[56]) but remain higher than in most other OECD countries. A deep West-East divide persists in living and well-being standards, reflecting large inequalities in job quality and earnings (OECD, 2016[1]) (Yeldan et al., 2013[57]). Annual equivalised disposable income levels per person in 2016 ranged from around TRY 25 000 in large Western cities to around TRY 10 000 in Eastern and Southeastern provinces.
The broad Istanbul area captures a large part of the national income and wealth. Three provinces around Istanbul (Istanbul, Kocaeli and Bursa), with only 24% of the population, produced 38% of the country’s GDP in 2014 (the latest year for which data is available). Seven provinces in the East, with 20% of the population, produced 9% of GDP.
Geographical disparities across Turkey’s 81 provinces reflect differences in human capital endowment and in the quality and productivity of their business sectors (EDAM, 2016[58]). Istanbul and Ankara lead in almost all productivity drivers, but many of them do tend to converge over time. Middle-income provinces have been catching up economically but face enduring gaps in local social capital and education quality. The lowest-income provinces fall behind in primary factors of economic development such as labour force participation and job creation outside agriculture.
The Southeastern region faces special socio-political challenges. The average income level has improved over the past decade, but the fortunes of the different cities in the region appear to have diverged. For example, Gaziantep in the area of industrial development and Sanliurfa in agricultural development have achieved remarkable growth gains. Massive inflows of refugees from Iraq and Syria, which exert strong pressures on already strained local labour markets, are a common challenge in the region. The towns hosting the highest numbers of refugees experience positive demand effects in the short-term, but also face important strains on their education, health and housing infrastructures. Only 6% of the refugees live in camps, the rest are dispersed in the region and part of them in the larger Western cities.
A National Strategy of Regional Development 2014-2023 was adopted in 2014 as the basic reference document for regional policies. It provided a unified framework to the numerous regional development initiatives. These included the creation of 26 Regional Development Agencies in 2006 and a multitude of oft-changing regional tax incentives. The new Strategy aimed at distinguishing policies to foster inter-regional convergence (such as a standard regime of regionally differentiated but stable tax incentives) and policies promoting local efforts to cultivate technology, industry and service clusters. Yet, a new programme of Regional Attraction Centres (unforeseen in the National Strategy) was adopted in 2016 and amended in 2017. It aims at reducing disparities by offering substantial additional tax subsidies in the lowest-income regions.
High-quality job creation by high-quality firms is a prerequisite for enhancing well-being and reducing vertical and horizontal inequalities. There is ample room for progress in this area. Reducing the quality and productivity gaps between informal, semi-formal and formal activities by upgrading the former (with the help of training and technical support programmes) and facilitating the transfer of employment to the latter (with the help of regulatory reforms reducing the costs of operating in compliance with law) is key for income and working conditions to improve, in particular in lagging regions. Progress on this front would also help increase national and local tax resources for public services. Their provision at a higher level of quality for all, notably in education (from early childhood to adult education) and health services, is crucial for reducing well-being inequalities.
Environmental challenges
Turkey remains one of the lowest per capita emitter of CO2 in the OECD (Figure 30). In the past this was partly because carbon intensity in Turkey was well below most other countries, but it has increased in Turkey and fallen greatly in the OECD area. The difference in per capita emissions now largely reflects lower incomes in Turkey, but emissions are rising rapidly as the country grows. The current emphasis on the development of environment-friendly technologies is timely (Figure 30, Panel F). Turkey has also some of the highest taxation in the OECD on motor fuel, which is welcome, but action will be needed in other areas to keep CO2 intensity in check.
Strong growth has necessitated a rapid expansion in energy supply, which increased by 60% between 2005 and 2016. Electricity consumption rose even faster, by 70% over the same period. Most of the extra demand was met from imported energy, now supplying around three quarters of total energy needs. One of the government’s core policy objectives is to reduce import dependence. Renewables, especially hydro power, account for about a third of total electricity generation and the share has been increasing.
Turkey’s only significant conventional energy source is coal and there are plans for a significant expansion of coal-fired electricity generation. While this will increase energy independence, it will greatly increase CO2 emissions. Safety in coal mines has also been a challenge, with loss of life in mining accidents due to inadequate attention to safety measures according to a State Supervisory Council Investigative Report prepared following a particularly severe accident in 2014 (Küçük and Ilgaz, 2015[59]). As recommended by the International Energy Agency, policymakers should support investment in best-available technology for both mining and power generation, should encourage the upgrading of coal plant efficiency by rehabilitation, and should phase out old and inefficient coal-fired power plants. They should ensure safe conditions for coal miners, making the most of international experience and best practice and reinforcing inspections and monitoring (IEA, 2016[60]). The authorities indicate that important measures were taken in this area in the most recent period, including the reinforcement of safety inspection capacities with the ongoing creation of a Mining Safety Administration and the introduction of new safety procedures, including the introduction of systematic risk analyses in mines,
The decline of air quality is a major concern, due partly to burning coal in older power stations, and partly to geographic and landscape conditions with high exposure to Saharan and Middle-East dust and lower precipitations resulting in higher concentrations of suspended particles in the air. All in all, population exposure to dangerous levels of particulate matter far exceeds the EU and OECD averages, as well as the standards set by the EU and the World Health Organisation (Figure 31). Recent initiatives to improve the monitoring of local air and water pollutants are promising, as Turkey will have aligned its air pollution norms with EU standards in 2019, and 64 provinces among 81 which are identified as presenting “high air pollution risks” have started to implement “provincial clean air action plans” (Table 12). Rigorous surveillance of the health consequences of the decline in air quality should be made a priority.
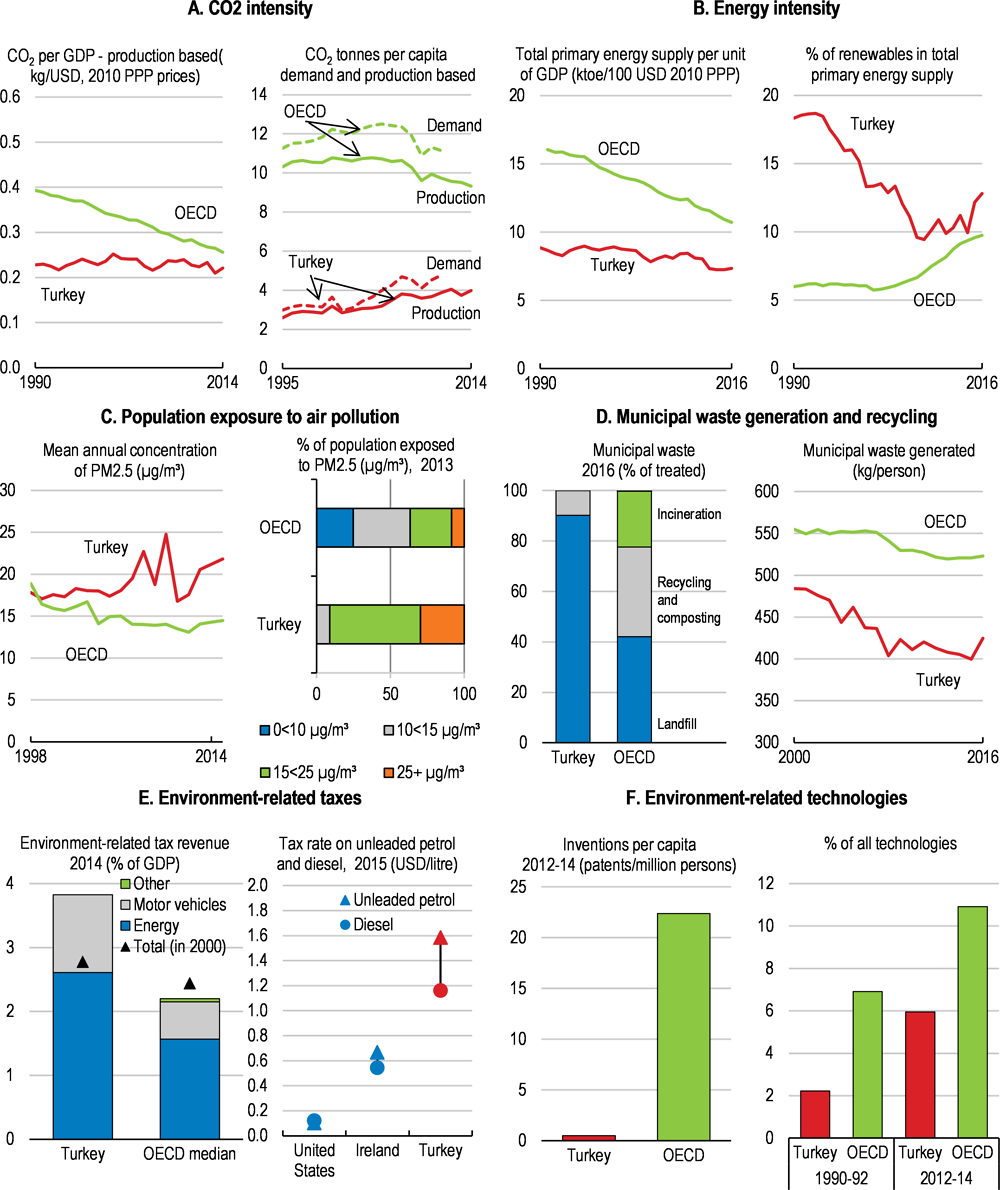
Source: OECD (2018), Green Growth Indicators. For detailed metadata click here.
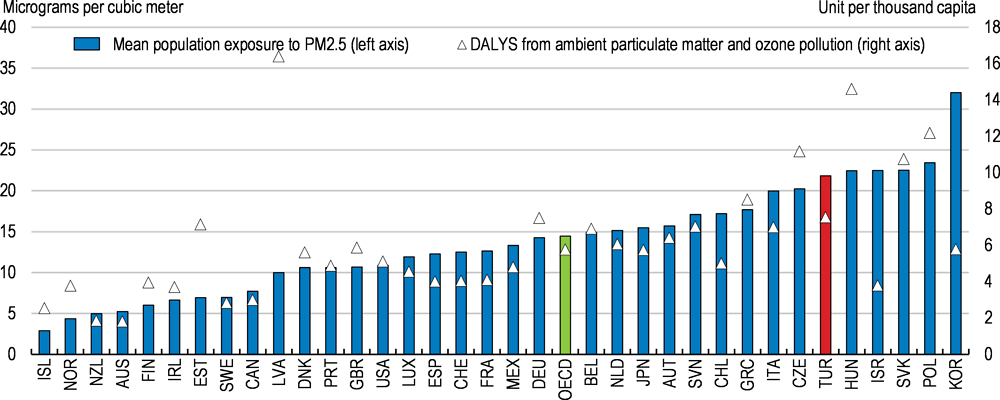
Note: Pollution exposure data based on combining data from satellite observations with ground-based data. DALYS stands for disability-adjusted life years. For example in Turkey in 2015, 7 years per thousand inhabitants were lost in the disabilities caused by local air pollution.
Source: OECD, Environment Statistics (database).
Municipal waste generation is lower than the OECD average, in line with lower incomes. However, recent economic growth seems to have arrested the decline in waste production seen after 2000 - despite efforts to increase the share of recycling. The bulk of waste continues to go to landfill. In per capita terms, the amount going to landfill in Turkey is over 50% above the OECD average. The 2015 transposition of the EU Waste Framework Directive into Turkish legislation is expected to foster the development of recycling facilities.
Revenue collected from environment-related taxation is significantly higher than elsewhere and, contrary to most countries, has increased since 2000. Almost all such revenue is raised from either fuel or vehicle taxes. Turkey has the highest taxes on motor fuel in the OECD but the tax per liter on petrol is 30% higher than on diesel, even though diesel produces more pollution per liter. The taxation of different sources of fossil fuel pollution should be harmonised.
Debt dynamics
The path of external debt as a share of GDP (Dt), or any other denominator that reflects the economy's capacity of servicing debt, is a result of i) net increments of external debt as a result of current account deficits net of interest payments (CADt); ii) inflows of foreign direct investment (FDIt) and iii) debt-ratio dynamics depending on the stock of debt at the beginning of the period, the average nominal interest rate (it), real growth of GDP (gt, or other revenues), the rate of currency appreciation (Δet), the change of the GDP deflator (πt) and the share of foreign currency in the stock of external debt (αt):
The separation between stock and flow terms has important consequences for external debt sustainability analyses. Indeed, current account deficits, adjusted for net FDI inflows, only determine the limit of the external debt ratio. An increase in the current account deficit raises the convergence level of the debt ratio, with possible effects on other fundamentals, including the interest rate. This in return may affect adversely the convergence condition itself. In contrast, the factor in (1) determines whether the debt ratio converges and at what speed. For convergence to take place, needs to be smaller than 1 in which case the limit of the debt-ratio L and half-life to convergence to this limit are obtained as:
Assessing vulnerability
The high share of foreign-exchange-rate-denominated debt in Turkey (around 95%), means that the sustainability of Turkey's external debt depends strongly on exchange rate developments. As a rule of thumb, nominal interest rates must not exceed nominal GDP growth in international currency (i-g-π-Δe < 0). Since 2010, the nominal effective exchange rate has depreciated at a rate well above the inflation and growth differential between Turkey and their trading partners. As a result, became greater than 1 in recent years, putting external debt on a non-sustainable path. Equation (1) together with the convergence condition <1 allows to derive a critical interest rate, that is the maximum interest rate Turkey can afford to pay given the paths for inflation, real growth and the exchange rate:
References
[32] Atuk, O., M. Özmen and C. Sarikaya (2018), “A Disaggregated Analysis of the Impact of Output Gap on Inflation and Implications for Monetary Policy”, Prague Economic Papers forthcoming.
[44] Boarini, R., A. Kolev and A. McGregor (2014), “Measuring well-being and progress in countries at different stages of development: Towards a more universal conceptual framework”, Working papers, No. 325, OECD DEVELOPMENT CENTRE, https://search.proquest.com/openview/401ca5240e11b74bd0358ebbd754e224/1?pq-origsite=gscholar&cbl=54431.
[29] Borio, C. and A. Filardo (2007), “Globalisation and inflation: New cross-country evidence on the global determinants of domestic inflation”, Working Papers, No. 227, Bank for International Settlements, https://www.bis.org/publ/work227.pdf (accessed on 09 May 2018).
[16] CBRT (2018), Financial Stability Report May 2018, Central Bank of the Republic of Turkey.
[18] CBRT (2017), Financial Stability Report November 2017, http://www.tcmb.gov.tr/wps/wcm/connect/6c95b5fe-4815-4064-a9a4-80ff33b51906/fulltext25.pdf?MOD=AJPERES&CVID=&CACHE=NONE&CONTENTCACHE=NONE.
[42] Credit Suisse Research Institute (2014), Global Wealth Report 2014, https://publications.credit-suisse.com/tasks/render/file/?fileID=5521F296-D460-2B88-081889DB12817E02.
[20] Dag, M. (2017), “Evaluation of the Flexibility of Budget Expenditures in Turkey: a Periodic Analysis”, in Murat Aydin, Nihal Sirin Pinarcioglu, O. (ed.), Current Debate in Public Finance Administration & Environmental Studies Volume 13, IJOPEC, https://books.google.fr/books?id=_spEDwAAQBAJ&pg=PA117&lpg=PA117&dq=evaluation+of+the+flexibility+of+budget+expenditures+in+turkey&source=bl&ots=XrO2IBdXwl&sig=DF7saHV0OS3HhTCESW9WuuqY_zc&hl=fr&sa=X&ved=0ahUKEwi037fP34zaAhWsBsAKHYzCDSwQ6AEIOzAA#v=onepage&.
[25] Digitalisation in Taxation (2018), Digitalisation in Taxation – Taxation Turkey, 2018, https://taxationturkey.com/e-transformation-in-tax-environment/.
[58] EDAM (2016), TÜRKİYE İÇİN BİR REKABET ENDEKSİ, EDAM, http://edam.org.tr/wp-content/uploads/2016/11/rekabet_web.pdf.
[38] Estrada, G., D. Park and A. Ramayandi (2016), “Taper Tantrum and Emerging Equity Market Slumps”, Emerging Markets Finance and Trade, Vol. 52/5, pp. 1060-1071, https://doi.org/10.1080/1540496X.2015.1105596.
[13] Fournier et al. (2018), “Long term interest rate determinants”, Working paper (forthcoming), OECD, https://www.google.fr/_/chrome/newtab?espv=2&ie=UTF-8.
[12] Gönenç, R. (2017), “The middle income plateau: Trap or springboard?”, OECD Economics Department Working Papers, No. 1446, OECD Publishing, Paris, https://doi.org/10.1787/9cba114b-en.
[35] Güney, P. (2016), “Does the central bank directly respond to output and inflation uncertainties in Turkey?”, Central Bank Review, Vol. 16/2, pp. 53-57, https://doi.org/10.1016/J.CBREV.2016.05.001.
[54] Gürsel, S., G. Uysal and A. Acar (2014), “Kadin İşgücü Piyasasinda Çarpici Gelişmeler”, No. 14/160, BETAM.
[6] Hausmann et al., R. (2014), The atlas of economic complexity: Mapping paths to prosperity, https://atlas.media.mit.edu/static/pdf/atlas/AtlasOfEconomicComplexity_Part_I.pdf.
[7] Hausmann, R. (2017), What should countries do to catch up? The challenge of technology diffusion, New Approaches to Economic Challenges - OECD, http://www.oecd.org/naec/naec-seminars-2017.htm.
[60] IEA (2016), Energy Policies of IEA Countries: Turkey 2016 Review, International Energy Agency, https://www.iea.org/publications/freepublications/publication/EnergyPoliciesofIEACountriesTurkey.pdf.
[15] IMF (2017), Turkey: Financial Sector Assessment Program : Financial System Stability Assessment, IMF, Washington, D.C..
[19] IMF (2016), IMF Country Report Turkey: Selected Issues, IMF, Washington, D.C., http://www.imf.org.
[31] Kara, H., F. Ogunc and C. Sarikaya (2017), “Inflation Dynamics in Turkey: A Historical Accounting”, CBT Research Notes in Economics, No. 1703, https://econpapers.repec.org/paper/tcbeconot/1703.htm.
[39] Kaygisiz, İ. (2017), Suriyeli Mültecilerin Türkiye Işgücü Piyasasina Etkileri, Frederich Ebert Stiftung.
[46] Kızıler, N. (2017), “Türkiye'de yoksullukla mücadele ve sosyal transfer harcamaları”, Journal of Life Economics, Vol. 4/11, https://www.ceeol.com/search/article-detail?id=582224, pp. 77-100.
[59] Küçük, F. and A. Ilgaz (2015), “Causes of Coal Mine Accidents in the World and Turkey.”, Turkish thoracic journal, Vol. 16/Suppl 1, pp. S9-S14, https://doi.org/10.5152/ttd.2015.003.
[52] McKinsey (2016), Turkey's potential for the future: Women in Business.
[43] Medina, L. and F. Schneider (2018), “Shadow Economies Around the World: What Did We Learn Over the Last 20 Years?”, https://papers.ssrn.com/sol3/papers.cfm?abstract_id=3124402.
[40] Milliyet (2018), “105 bin yabancı uyrukluya çalışma izni verildi (105 thousand foreigners were granted work permit, according to Ministry of Labour and Social Security officials)”, http://www.milliyet.com.tr/105-bin-yabanci-uyrukluya-calisma-siyaset-2635520/.
[55] Ministry of Development (2018), 2018 Yili Programi, Ministry of Development.
[56] Ministry of Development (2014), National Strategy of Regional Development, 2014-2023, http://www.resmigazete.gov.tr/eskiler/2015/03/20150324M1-1-1.pdf.
[27] Ministry of Economy (2018), Büyük Ölçekli Yatırımların Teşviki, https://www.ekonomi.gov.tr/portal/faces/oracle/webcenter/portalapp/pages/content/htmlViewer.jspx?contentId=UCM%23dDocName%3AEK-167548&parentPage=yatirim&_afrLoop=26244202349629020&_afrWindowMode=0&_afrWindowId=9ha2tzjt6&_adf.ctrl-state=vbwmo85z_473#!%40%4.
[26] Ministry of Economy (2018), Öncelikli Yatırımların Teşviki, https://www.ekonomi.gov.tr/portal/faces/oracle/webcenter/portalapp/pages/content/htmlViewer.jspx?contentId=UCM%23dDocName%3AEK-167551&parentPage=yatirim&_afrLoop=26244187955784482&_afrWindowMode=0&_afrWindowId=null&_adf.ctrl-state=vbwmo85z_452#!%40%40%3F_.
[28] Ministry of Economy (2018), Stratejik Yatırımların Teşviki Uygulaması, https://www.ekonomi.gov.tr/portal/faces/oracle/webcenter/portalapp/pages/content/htmlViewer.jspx?contentId=UCM%23dDocName%3AEK-167545&parentPage=yatirim&_afrLoop=26244212701210879&_afrWindowMode=0&_afrWindowId=azzce0z2y&_adf.ctrl-state=vbwmo85z_494#!%40%4.
[10] Nicoletti, G., D. Andrews and C. Timiliotis (2018), “Going digital: What determines technology diffusion among firms?, Working Party No. 1 on Macroeconomic and Structural Policy Analysis 22-23 March 2018, OECD Conference Centre”.
[34] Obstfeld, M., O. Issing and T. Ito (2015), “Trilemmas and trade- offs: living with financial globalisation”, No. 480, Bank for International Settlements, https://www.bis.org/publ/work480.pdf.
[4] Ocean Health Index (2016), Ocean Health Index 2016 Annual Report, https://issuu.com/lindsaymosher/docs/2016_annual_report_.compressed.
[9] OECD (2018), Achieving inclusive growth in the face of digital transformation and the future of work, http://www.oecd.org/g20/OECD_Achieving%20inclusive%20growth%20in%20the%20face%20of%20FoW.pdf.
[11] OECD (2018), The long-view: scenarios for the world economy 2060.
[22] OECD (2017), Education at a Glance 2017: OECD Indicators.
[41] OECD (2017), “How's life in Turkey?”, in How's Life? 2017: Measuring Well-being, OECD Publishing, Paris, https://doi.org/10.1787/how_life-2017-42-en.
[47] OECD (2017), How's Life? 2017: Measuring Well-being, OECD Publishing, Paris, https://doi.org/10.1787/how_life-2017-en.
[17] OECD (2017), OECD Economic Outlook No. 102, OECD, http://www.oecd-ilibrary.org/fr/economics/data/oecd-economic-outlook-statistics-and-projections/oecd-economic-outlook-no-102-edition-2017-2_05b705e7-en?isPartOf=/content/datacollection/eo-data-en.
[3] OECD (2017), OECD Science, Technology and Industry Scoreboard 2017: The digital transformation, OECD Publishing, Paris, https://doi.org/10.1787/9789264268821-en.
[24] OECD (2017), Revenue Statistics 2017 -Turkey, https://www.oecd.org/tax/revenue-statistics-turkey.pdf.
[1] OECD (2016), OECD Economic Surveys: Turkey 2016, OECD Publishing, Paris, https://doi.org/10.1787/eco_surveys-tur-2016-en.
[51] OECD (2016), OECD Economic Surveys: Turkey 2016, OECD Publishing, Paris, https://doi.org/10.1787/eco_surveys-tur-2016-en.
[45] OECD (2016), Social Expenditure Update, OECD, http://www.oecd.org/social/expenditure.htm.
[2] OECD (2014), OECD Economic Surveys: Turkey 2014, OECD Publishing, Paris, https://doi.org/10.1787/eco_surveys-tur-2014-en.
[23] OECD (2013), Synergies for better learning : an international perspective on evaluation and assessment..
[21] OECD (2012), Does money buy strong performance in PISA?, PISA IN FOCUS 2012/02 (February), OECD, https://www.oecd.org/pisa/pisaproducts/pisainfocus/49685503.pdf.
[14] OECD (2012), OECD Economic Surveys: Turkey 2012, OECD Publishing, Paris, https://doi.org/10.1787/eco_surveys-tur-2012-en.
[33] Rey, H. (2015), “Dilemma not Trilemma: The Global Financial Cycle and Monetary Policy Independence”, No. 21162, National Bureau of Economic Research, Cambridge, MA, https://doi.org/10.3386/w21162.
[37] Sahay, R., V. Arora and T. Arvanitis (2014), “Emerging Market Volatility: Lessons from the Taper Tantrum”, Staff Discussion Note, No. 14/09, IMF, https://www.imf.org/external/pubs/ft/sdn/2014/sdn1409.pdf.
[50] Sirkeci, I. (2017), Migration from Turkey to the UK, International Migration Institute, University of Oxford, https://doi.org/10.1080/13691830600761487.
[5] TIM (2018), Exporter Tendencies Survey.
[36] Turkay, M. (2017), “Heterogeneity across emerging market central bank reaction functions”, Central Bank Review, Vol. 17/3, pp. 111-116, https://doi.org/10.1016/J.CBREV.2017.06.002.
[53] Uysal, G. (2013), “Kadin İstihdamina Verilen Teşvikler İşe Yariyor”, No. 13/151, BETAM.
[48] Vodafone (2017), Vodafone Tüm Dünyada Yeni Marka Stratejisini Duyurdu - Vodafone Medya Merkezi, http://medyamerkezi.vodafone.com.tr/basin-bultenleri/vodafone-yeni-marka-stratejisini-duyurdu.
[49] Vodafone (2014), Vodafone Institute Survey Talking about a Revolution: Europe’s Young Generation on Their Opportunities in a Digitised World, http://www.vodafone-institut.de/wp-content/uploads/2015/09/VFI_YouGov_EN.pdf.
[57] Yeldan, E. et al. (2013), Orta Gelir Tuzagi'ndan Cikis: Hangi Turkiye? Cilt 2: Bolgesel Kalkinma ve Ikili Tuzaktan Cikis Stratejileri, TURKONFED, http://www.turkonfed.org/Files/ContentFile/ogt-raporu-ii-cilt.pdf.
[8] Yildirim, M. (2018), “Kompleksite ve Urun Uzayi Metodolojisiyle Turkiye”, Working papers, No. 1806, https://ideas.repec.org/p/koc/wpaper/1806.html.
[30] Zhang, C. (2015), “The Effect of Globalization on Inflation in New Emerging Markets”, Emerging Markets Finance and Trade, Vol. 51/5, pp. 1021-1033, https://doi.org/10.1080/1540496X.2015.1039894.