Chapter 2. Improving transport and energy infrastructure investment
Poland has significantly upgraded its infrastructure network over the past decade. However, bottlenecks still weigh on productivity growth and environmental and health outcomes. The EU 2014-20 programming period is an opportunity to improve the management of infrastructure investment. Regularly updating national infrastructure strategies and promoting cost-benefit analyses and ex post evaluations would increase the coherence of sectoral development plans. Strengthening local governance and ensuring the independence of the network industry regulators and the Competition Authority would also be good moves. At the same time, rebuilding fiscal buffers and promoting long-term financing instruments will be critical over the medium term, while increasing environmental taxation and road pricing would promote greener investment. As many local governments lack administrative capacity, relying more on central government assistance for project management and public procurement procedures would improve infrastructure delivery. In the transport sector, the country allocated most recent funding to roads, but it plans significant investment in railway and urban public transport in 2014-20. Strengthening metropolitan governance, building up medium-term infrastructure management capabilities and reducing funding uncertainty would ensure more efficient spending. In the energy sector, electricity generation capacity is tight, while regulatory uncertainty, administrative burdens and a lack of interregional and international trade capacity has hampered the development of renewables. The authorities are seeking to develop nuclear power, but they need to take fully into account tail risks involved and its long-term costs. More energy efficiency investment would also be valuable, as current support systems do not provide sufficient incentives.
Infrastructure is key for productivity and social welfare
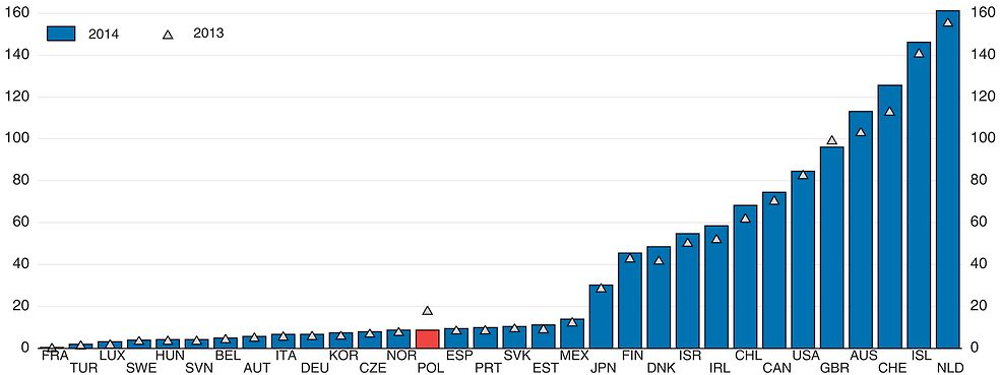
Improving infrastructure is a key requirement for keeping the economy on a steep long-term growth path, enabling productive private investment and the creation of new activities. Poland has made significant progress to upgrade its transport and energy infrastructure over the last 20 years (Figure 2.1, Panels A and B). The increase in public investment since 2003 has helped to significantly reduce infrastructure bottlenecks and smoothed the economic downturn during the global financial crisis and the European turmoil (OECD, 2014a). However, the perceived quality of overall transport infrastructure and electricity supply remains lower than in most OECD countries (Panels C and D), and infrastructure needs are still substantial. The current investment plans until 2030 and 2050 foresee sizeable investment in transport and energy infrastructure (Ministry of Economy, 2015a; Ministry of Infrastructure and Development, 2014). Until 2020, structural and cohesion funds from the European Union that assist in the financing of numerous infrastructure projects are set to reach nearly 3% of 2013 GDP per year (European Commission, 2015a). Strengthening the planning and management of public and private infrastructure investments, as well as improving the regulatory environment, would enhance the short- and long-term impacts of new infrastructure on productivity, growth and well-being (OECD, 2015a; IMF, 2015).
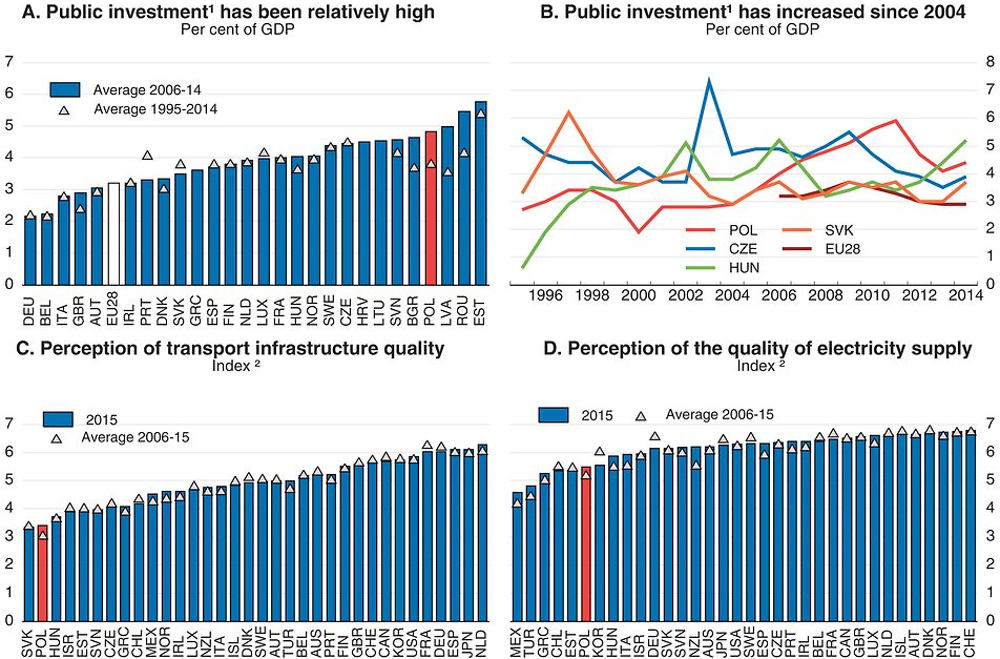
1. Gross general government fixed capital formation.
2. Index from the lowest perceived quality (0) to the highest (7).
Source: OECD (2015), National Accounts Database; World Economic Forum (2015), The Global Competitiveness Report 2014-15.
Improving transport infrastructure and developing public transport, as planned in the EU 2014-20 programming period, is an important challenge. Investment imbalances between road and rail infrastructure, consumer preference for car ownership, as well as relatively low car use taxation have led to a steady decline of public transport modes (OECD, 2014a and 2015b). At the same time, Poland’s economy has exhibited a growing dispersion of GDP per capita across metropolitan areas, while residential mobility is low (Figure 2.2). Furthermore, the safety of the rail and road networks is lagging in international comparison (Figure 2.3, Panel A). Developing more efficient transport infrastructure, notably urban rapid transit, is important to reduce the sector’s environmental impacts and local labour market mismatches, and to sustain regional development (OECD, 2014b and 2014c). At the macroeconomic level, lowering transportation costs would improve access to markets and regional resource re-allocation and boost agglomeration effects, productivity and economic growth. This could counteract the slowdown in potential growth associated with the rapidly ageing population and low fertility rates.
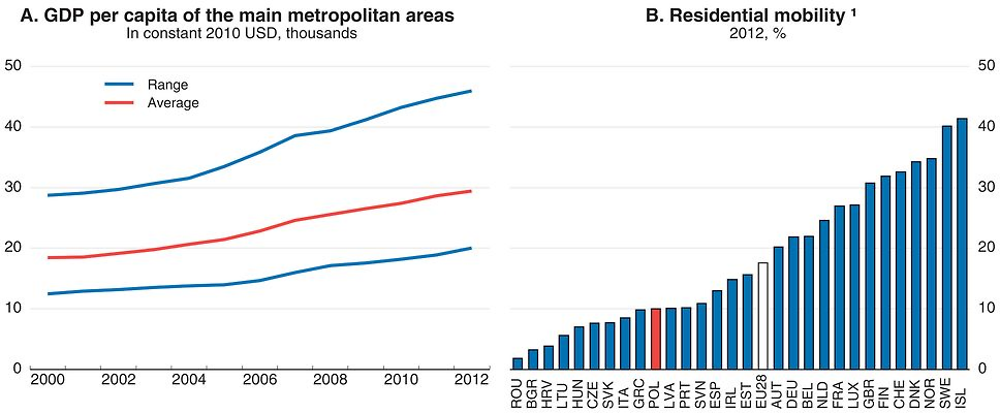
1. Share of population having moved to another dwelling within the last five-year period.
Source: OECD (2015), Metropolitan Database; and Eurostat, SILC Database.
Emissions of greenhouse gases (GHGs) are another vital issue. Urban air pollution is elevated, contributing to climate change and leading to substantial health costs (Figure 2.3, Panel B; European Commission, 2015a). The government is planning to increase spending on public transport in 2014-20 and to progressively reduce the share of coal in the energy mix. However, coal’s share in primary energy supply remains the highest in the OECD, despite its gradual reduction over the last decade, and the GHG emissions of the energy sector are relatively high (Figure 2.4). Ageing electricity generation capacity and limited international trade capacity also lower the safety of electricity supply in tail events, such as the 2015 heatwave (European Commission, 2015b). Further connections to neighbouring countries and international energy markets would increase competition on wholesale and retail markets and help to reach European environmental objectives in a cost-efficient way, while easing the balancing of intermittent renewable energies.
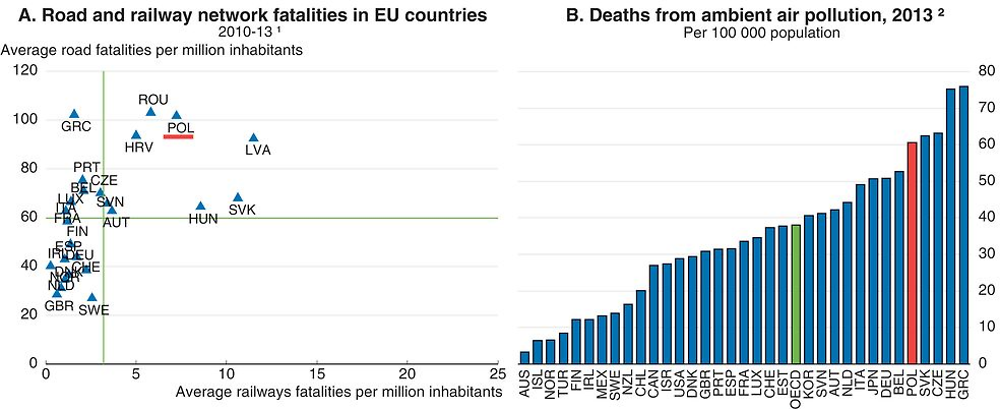
1. The vertical and horizontal lines correspond to the un-weighted European averages.
2. Deaths from ambient particulate matter and ozone pollution.
Source: Eurostat (2015), Transport safety statistics. OECD calculations based on Institute for Health Metrics and Evaluation, http://viz.healthmetricsandevaluation.org/gdb-compare/.
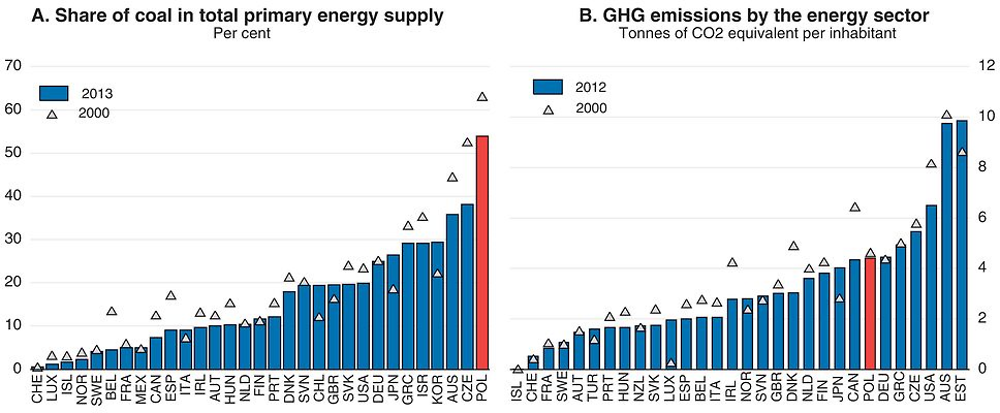
Source: IEA (2015), World Energy Statistics and Balances (databases); OECD (2015), Greenhouse gas emissions in tonnes of CO2 equivalent for the energy sector.
The co-financing of EU funds and new infrastructure and maintenance needs after 2020 will require substantial government resources. However, a number of obstacles still hinder the appraisal and selection of projects and efficient infrastructure spending. Careful planning, effective spending controls, appropriate mobilisation of tax revenue and well-functioning redistribution mechanisms across layers of governments would improve infrastructure investment. Strengthening regulatory frameworks, improving public procurement procedures and coordination among the different stakeholders would also lead to more efficient infrastructure spending. At the same time, developing risk capital from infrastructure funds that can be sold to long-term investors could support infrastructure financing.
This chapter reviews the overall regulatory and financing frameworks surrounding infrastructure investment and then focuses on the transport and energy sectors. The main results are:
-
Despite significant progress in redesigning the regulatory framework, regulations and institutions could better ensure competitive neutrality. Infrastructure planning would be strengthened by better integrating policy and investment priorities across ministries and local governments, and by stepping up the professionalisation of public procurement procedures.
-
Significant headway has been made to extend the road network. However, the density of high-speed roads remains lower than elsewhere, local road maintenance has been poor, and rail investment is lagging. The new rail and road investments planned under the 2014-20 EU perspective are welcome, but, over the medium term, developing road pricing is needed to ensure sustained investment and maintenance of the existing network and develop public services.
-
Power generation capacity remains under-diversified, and the current regulatory framework does not provide sufficient incentives for new investment. The functioning of the new programme for energy efficiency and the development of nuclear projects need to be monitored closely and international electricity trade capacity developed, as planned.
An overarching strategy and a sound institutional framework are key to improving infrastructure
Economic growth and better environmental and health outcomes call for higher infrastructure investment. The ongoing implementation of the EU funds strategy 2014-20 provides further opportunities to strengthen infrastructure governance. At the same time, policy developments should ensure that infrastructure investments are integrated into a broader agenda of sustainable development and maintenance, since beyond 2020 EU funding may be substantially reduced.
Better integrating strategic infrastructure plans across objectives and levels of government
Historically, public investment, private investment and GDP growth have moved together in Poland (Rostowski, 2009), as better public capital and infrastructure allow productivity gains and encourage private investment. Public investment may be necessary to correct market failures and finance long-term projects in the transport and energy sectors. The delivery of mostly irreversible capital investment involves a high level of risk-taking and the need for long-term financing, whereas the development of infrastructure networks is often associated with positive and negative externalities – such as lower congestion costs or higher pollution – that can lead to socially non-optimal levels of capital investment. Well-chosen public investment can raise output and employment, both in the short and long terms by crowding in private investment (OECD, 2015a; Abiad et al., 2015; Eden and Kraay, 2014). However, not all public investment creates economically valuable capital, and institutional arrangements need to ensure the efficient allocation and the quality of projects, notably by sound cost-benefit analysis, efficient public procurement and public-private partnership procedures, as well as the development of governance capacities.
General investment strategies across all levels of government have been progressively adopted. The authorities have over time designed key long-term national development strategies: the National Spatial Development Concept 2030 in 2011, the National Development Strategy 2020 in 2012, and the Long-Term National Development Strategy 2030 in 2013. These plans, together with the partnership agreement and the operational programmes for use of EU structural and cohesion funds, represent the framework for co-ordinating sectoral policies. However, appropriate connections between national and local roads are still sometimes lacking (World Bank, 2011). A first top-down strategy for the whole transport sector, the Transport Development Strategy to 2020 (with perspectives to 2030), was adopted only in 2013. Responsibilities for policies that affect urban areas are scattered across separate ministries that administer various components of what ought to be an integrated spatial policy (OECD, 2011a and 2015c). Likewise, in the past, many concurrent infrastructure plans were not well integrated into an articulated strategy. In addition, local spatial plans cover only 30% of the country, and slow compulsory land purchasing, complicated tendering procedures and insufficient use of external audits have led to significant implementation delays (Kierzenkowski, 2008; Laursen and Myers, 2009). As a result, infrastructure planning and financing are still perceived as relatively weak, even if much better than at the turn of the century. This perceived weakness correlates positively in international comparison with the volatility of public investment (Figure 2.5).
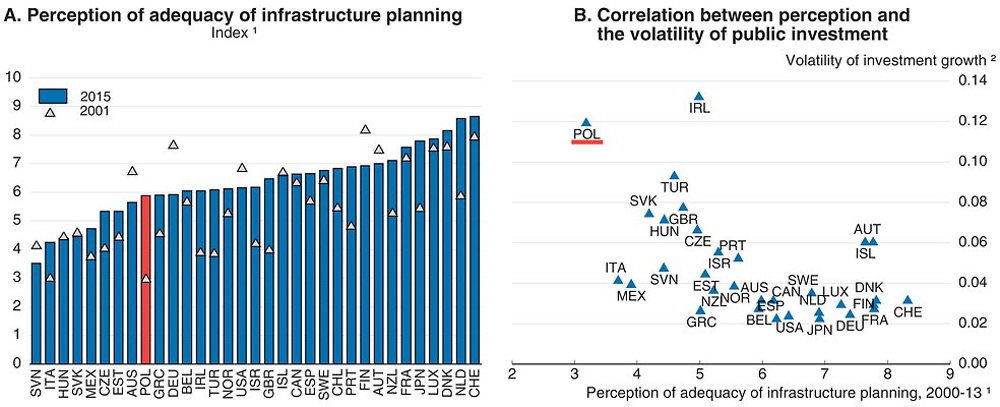
1. Agreement of managers to the statement “maintenance and development of infrastructure are adequately planned and financed”, from 0 (disagreement) to 10 (full agreement).
2. Standard deviation of nominal public investment growth over 2000-13.
Source: World Competitiveness Center (2015), IMD World Competitiveness Online; OECD, National Accounts Database.
The government presented its medium-term plans for the road and rail sectors and a draft energy strategy in 2013-15. The National Transport Strategy to 2020 (with perspectives to 2030) presents the main goals of transport development. Its implementation programme, adopted in 2014, presents the specific investments to be carried over 2014-20, notably with the use of EU funds. While investments under the 2007-13 EU financial perspective focused on roads, funding for the railway sector is set to increase in 2014-20, notably urban transport projects to address congestion and sustainability issues (Box 2.1). The current draft “Energy Policy of Poland until 2050” also foresees partially replacing and complementing existing coal-fired power plants with high-efficiency coal plants and a sharp increase in renewable energy sources supported by new gas plants as both reserve capacity and a basis for co-generation with heat (Ministry of Economy, 2015a). In addition, a first nuclear power plant is to be commissioned by 2030. These represent steps in the right direction providing a comprehensive view of the country’s infrastructure needs and how the government plans to satisfy them. However, they would need regular updates, and improving coordination between ministries and setting clear jurisdictions would also reduce policy uncertainty and could expedite infrastructure investment, notably in the transport sector.
The National Transport Strategy to 2020 (with perspectives to 2030) is the first global strategy for the transport sector adopted in Poland. This document, published in 2013, aims to ensure coordination between all transport modes and infrastructure projects. It sets the main goals and priorities for the transport sector, including logistics and urban transport. It aims at improving transport accessibility, safety and efficiency, and Poland’s international connections.
The implementation programme of this Strategy, adopted in 2014, specifies the priorities in the railway, road, maritime and inland waterways sectors to be reached in 2014-20 to ensure coordination between transport modes and infrastructure projects. It also sets criteria for project selection in the use of EU funds.
Besides the use of EU funds, the Strategy and its implementation programme also determine all the sectoral transport programmes, notably for roads and railways. The financing of these two programmes involves the state budget, the national road and railway funds (Box 2.2) and public-private partnerships. The authorities adopted two documents that set out investment priorities in September 2015:
-
The 2014-23 National Road Construction Programme (with a view to 2025) foresees new infrastructure investment, notably the construction of 35 ring roads, for a total amount of PLN 107 billion (6.2% of 2014 GDP), maintenance expenditures and land acquisitions worth PLN 46.8 billion (2.7% of 2014 GDP) and road safety measures (PLN 4.8 billion, 0.3% of 2014 GDP). This includes the carry-over of some expenses from the current 2011-15 National Roads Construction Programme for PLN 14.5 billion (0.8% of 2014 GDP).
-
The 2014-23 National Railway Programme assumes that PLN 67.5 billion (3.9% of 2014 GDP) will be spent on railway infrastructure by 2023. It is expected that the projects to be carried out as part of the programme will reduce the time needed to travel between the main cities in Poland, establish rail as an alternative to road and air transport, improve accessibility for some regions and strengthen the existing connections between regions.
Ex ante and ex post cost-benefit analysis (CBA) should play a larger role in the development of infrastructure strategies and the choice of specific projects. At the stage of the feasibility studies, EU regulations require a CBA of all major investment projects applying for assistance. However, several past strategies and policy documents in key areas failed to include either a proper CBA or estimates of the cost of inaction. Only limited studies of the impact of pollution on human health and on ecosystems have been carried out and taken into account in prioritising policy responses (OECD, 2015b). Moreover, the feasibility studies may have a limited impact on the choice of the final options to achieve the project’s objectives. Therefore, beyond the feasibility studies, a more consistent use of CBA could help identify projects with the largest social returns, facilitate prioritisation and reduce fiscal risks. A central body could be in charge of securing uniform CBA, taking into account environmental and health impacts and other policy objectives, by building up in-house expertise, and mandatory independent counter-expertise could also be used for the largest projects, as in France. In addition, standardised ex post evaluations for large infrastructure projects should be required by national legislation so as to help identify best practices and trade-offs between policy measures and improve cost efficiency (Crozet, 2013; ITF, 2014).
The coordination of investment strategies across all levels of government is improving. Sub-central governments were responsible for about half of total public investment in 2014, above the OECD average and other Central and Eastern European countries. For example, local governments owned more than 95 % of road infrastructure in 2013 (Ministry of Infrastructure and Development, 2015a). The lack of co-ordination between the various levels of government, and between jurisdictions at the same level, has been a source of inefficiency. Polish legislation includes voluntary mechanisms for inter-municipal collaboration; however, there are no specific financial incentives to encourage it. Around 60% of municipalities are engaged in some kind of inter-municipal collaboration, but integrated urban planning is underdeveloped (OECD, 2011a). The outcomes of some environmental projects have been undermined by their geographic dispersion and the lack of clear delimitation of functional areas served by the infrastructure (European Commission, 2012). A welcome recent law foresees the creation of metropolitan governance associations in 2016, notably for transport and spatial planning, but these will remain voluntary. In addition, under the 2014-20 EU perspective, new ex ante conditionality mechanisms could ensure better coordination. Indeed, the new perspective focuses on the integrated management of urban areas and their linkages with their rural counterparts, irrespective of administrative boundaries, while urban and transport developments used to be separate objectives.
The decentralisation of the allocation of EU funds over 2014-20 will give a more prominent role to local governments in infrastructure investment, and there will be a need to increase their accountability and resources, as local tax autonomy remains limited (Blöchliger and Nettley, 2015). Decentralisation of competences in infrastructure management has not been followed by comparable fiscal decentralisation to Poland’s 16 regions, 380 counties and 2 478 municipalities (OECD, 2013a). Specifically, regional and local governments depend on central government transfers to implement infrastructure and maintenance work not supported by EU funding, since they have a limited right to impose taxes and levies. Moreover, the general grant system does not fully take into account the high costs of public services for core cities compared to suburban areas, due to high wages and land prices and the concentration of public services at the core of most metropolitan areas (OECD, 2011a). In the 2014-20 EU funds allocation, transfers from the central government to local municipalities will take into account alignment with the national transport plan and the coordination of municipal policies within metropolitan areas, but such mechanisms should be made permanent to match infrastructure finance and future maintenance costs. The introduction of metropolitan fiscal equalisation schemes could also help to better account for cost variation among municipalities.
Municipalities have far-reaching responsibilities for setting their own development policies. They design areas for certain purposes through legally binding local land-use plans. However, the quality of land administration appears relatively low (Figure 2.6, Panel A). The digitalisation of plans, the availability of information and the ease of land dispute resolution appear to lag behind most OECD countries (World Bank, 2015). Moreover, around 70% of the municipal territory lacks local spatial plans (Ministry of Regional Development, 2012). In the absence of local plans, municipalities may grant building permits based on administrative decisions that do not ensure coherence with spatial plans. Residential developments on greenfield sites have to fulfil certain minimal conditions: a neighbouring plot has to be developed with housing, and there also has to be access to a public road. This does not ensure coherence with spatial planning and tends to favour housing developments along public roads (Halleux et al., 2012; Krajewska et al., 2014). Indeed, urban sprawl has expanded rapidly (Panel B; Veneri 2015), and most metropolitan areas in Poland have experienced decreasing population density in the urban core along with increasing density in the suburbs (Panel C). An envisaged reform of spatial planning would impose much stricter conditions regarding connection to infrastructure to grant building permits on land without local spatial plans, while investors would be allowed to develop infrastructure for the municipality to comply with conditions for planning permission. It would also reduce the scale and scope of compensation municipalities have to pay to owners when they restrict the use of their land to create or update local spatial plans. This reform would support the development of local spatial plans and should be implemented swiftly. If it proves insufficient, the release and integration of municipal spatial plans with other local economic development plans and metropolitan strategies should be made mandatory in order to improve coordination among the different stakeholders.
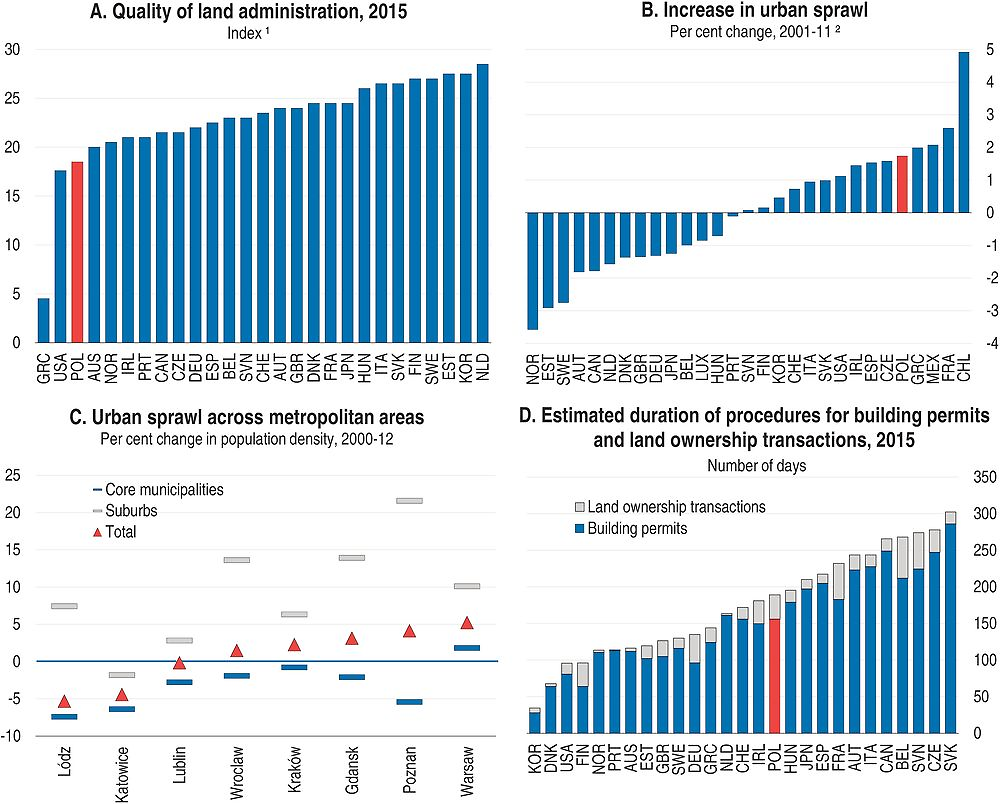
1. From 0 to 30 (best practices).
2. Change in population decentralisation within metropolitan areas (Veneri, 2015).
Source: World Bank (2015), Doing Business 2016; P. Veneri (2015), “Urban spatial structure in OECD cities: Is urban population decentralising or clustering?”, OECD Regional Development Working Papers, No. 2015/13; OECD (2015), Metropolitan Database.
Regulations for project approvals could be streamlined for specific infrastructure projects. The application procedures for building permits and land ownership transfers are slightly lengthier than in the average OECD country (Figure 2.6, Panel D). For a typical warehouse, obtaining a permit requires 16 procedures, takes 156 days and costs 0.3% of the construction value (World Bank, 2015). But procedures are much more cumbersome than in other European countries for windfarms (EWEA, 2010). Before the recent election there was a draft law before the parliament reforming spatial planning regulations. The parliamentary approval process of this reform needs to be resumed swiftly. This, together with foreseen amendments to the construction law, would improve the investment process; however, progress remains limited so far (European Commission, 2015c). In addition, large infrastructure projects need further authorisations. For example, various levels of government have been in charge of environmental impact assessments (EIAs) since the 1980s, depending on project size (OECD, 2015b). However, limited public participation and lack of trust among stakeholders contribute to frustration with EIA procedures by the administration, investors and the public. The national court of auditors has stated that, in several cases, notably for road and renewable energy projects, stakeholder views were ignored (NIK, 2014a). Better integrating public consultations into the elaboration of regulations and promoting in-depth evaluation of regulations in specific sectors would help improve the regulatory framework (OECD, 2015d). Improving the national anticorruption framework (see below) would also be crucial in limiting conflicts of interest in permit issuance. In the past, many local authorities have conditioned the issuance of wind farm permits on donations to the municipalities, and many windfarms were built on land owned by local government employees and politicians (NIK, 2014a).
Efficient transport and energy infrastructure in Poland would benefit from expanding the broadband and digital infrastructure. Poland lags behind most OECD countries for some indicators of Internet and cloud-computing use by households and firms (Figure 2.7, Panels A and B). Investments in broadband and digital infrastructure should be implemented at the same time as road, rail and energy investment whenever possible to reduce the overall costs for the public sector, as planned in the 2014-20 operational programme for digital Poland (European Commission, 2015d). The development of broadband communication networks and services holds the potential for tremendous innovation in transport and energy investment. For example, by allowing employees and independent professionals to work remotely rather than in centralised offices, teleworking could cut costs and commuting time; but it remains particularly limited in Poland (OECD, 2010). Similarly, the development of “smart” grids and integrated Intelligent Transport Systems could allow better energy and transport choices, while empowering businesses and consumers. More generally, the increasing amount of real-time, fine-grained data enables more targeted and cost-effective infrastructure maintenance, service improvements and investment decisions. However, this would also require significant upgrading of the skills of the population (Panel C) to foster innovation, and Poland’s current R&D in eco-innovation appears particularly low by EU standards (Panel D).
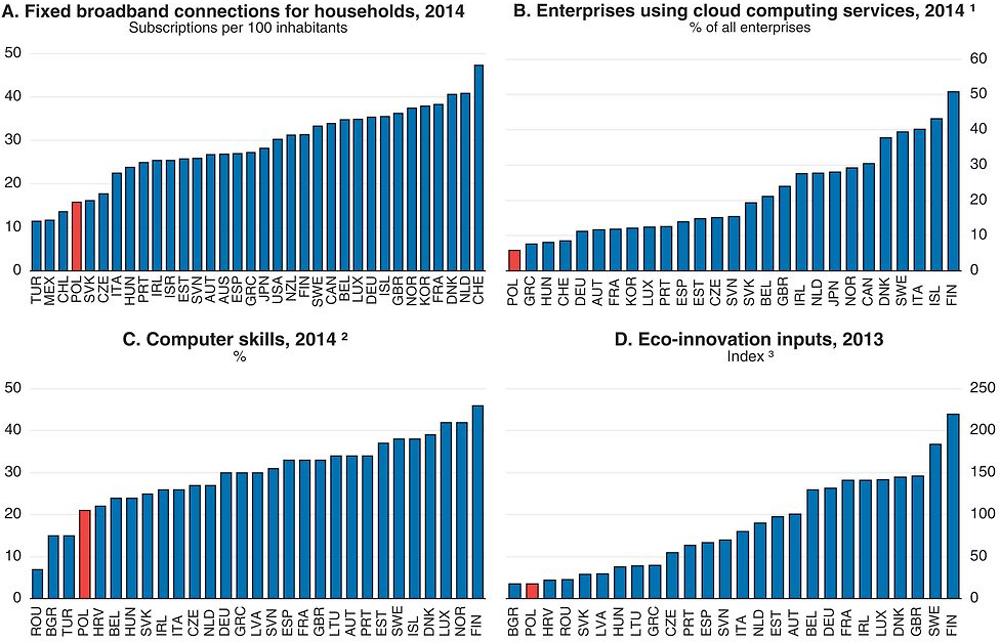
1. Cloud computing refers to ICT services used over the Internet as a set of computing resources to access software, computing power, storage capacity and so on.
2. Share of individuals aged 16 to 74 reporting to have carried out five or six specific tasks related to computer use.
3. Index from 0 (lowest levels of inputs) to 300. The index is based on three indicators: government investments in environmental and energy R&D, green early-stage investments and total R&D personnel.
Source: OECD (2015), Digital Economic Outlook 2015 and OECD Science, Technology and Industry Scoreboard 2015; Eurostat (2015), Individuals’ Level of Computer Skills; European Commission (2015), Eco-Innovation Scoreboard.
Green taxes could better internalise externalities to strengthen green investment (and help raise higher revenues). A broad-based strategy is needed to improve environmental quality and contribute to reaching the goal agreed at COP21 in Paris to hold the increase in global average temperature to well below 2°C above preindustrial levels and achieve a balance between GHG emissions and removals in the second half of the century. The government has implemented the polluter-pays principle with taxes on air and water pollutants. Yet, they are often not high enough to take into account environmental and health externalities (OECD, 2015b). Revenues from environmentally related taxes are somewhat below the OECD average, while revenues from vehicle taxes are well below it (Figure 2.8). Poland is one of the few OECD countries where passenger vehicle tax rates are not based on environmental criteria (OECD, 2012a). This favours importing second-hand vehicles, and the large and old car fleet magnifies the weaknesses of the road network, with high long-term costs for health, public safety and public finances. Another problem is that diesel accounts for the majority of motor fuel but is taxed at a lower rate than petrol (as in most other OECD countries), despite the fact that its CO2 emissions per litre are higher and its combustion emits more local pollutants (Harding, 2014).
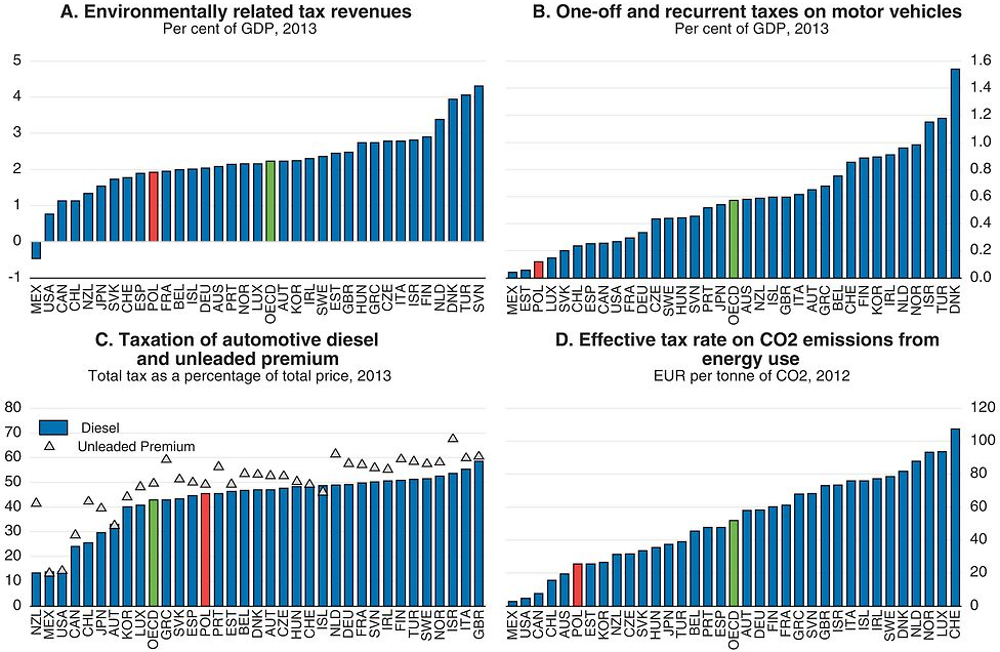
Source: OECD (2014), Consumption Tax Trends 2014; OECD (2015), Environmental Taxation and Revenue Statistics (databases); OECD (2013), Taxing Energy Use – A Graphical Analysis.
The effective economy-wide tax rate on CO2 emissions from energy use is also low (Figure 2.8, Panel D), particularly relative to other OECD-European economies. Household coal use for heating, often in inefficient systems, is not subject to environmental taxation, although this is a significant source of urban air pollution, and it is also not subject to the EU Emissions Trading System (EU-ETS, see below). A tax could reinforce the government’s subsidy programmes to replace inefficient heating systems in households and its plans to move towards district heating (see below). CO2 and energy taxes have been an important element in a broader Swedish plan to cut residential-sector emissions by promoting district heating (OECD, 2011b).
Infrastructure financing in Poland has so far relied heavily on EU funds, which co-finance public investment and contribute to economic growth. With EUR 68 billion allocated over 2007-13 (22% of 2007 GDP), inflows of EU funds to Poland were the highest in the EU in absolute value and among the largest as a share of domestic GDP. Poland’s absorption of EU funds accelerated significantly after the simplification of financial management and control procedures in 2010. By the end of 2013, nearly all available funds had been contracted by operational programme beneficiaries (Ministry of Infrastructure and Development, 2013). EU funds are set to reach EUR 78 billion in 2014-20, around 20% of 2013 GDP (Figure 2.9). In particular, the new Operational Programme Infrastructure and Environment amounts to EUR 32 billion (of which EUR 28 billion from EU funds), with transport continuing to be the primary recipient (Ministry of Infrastructure and Development, 2015a; European Commission, 2014a).
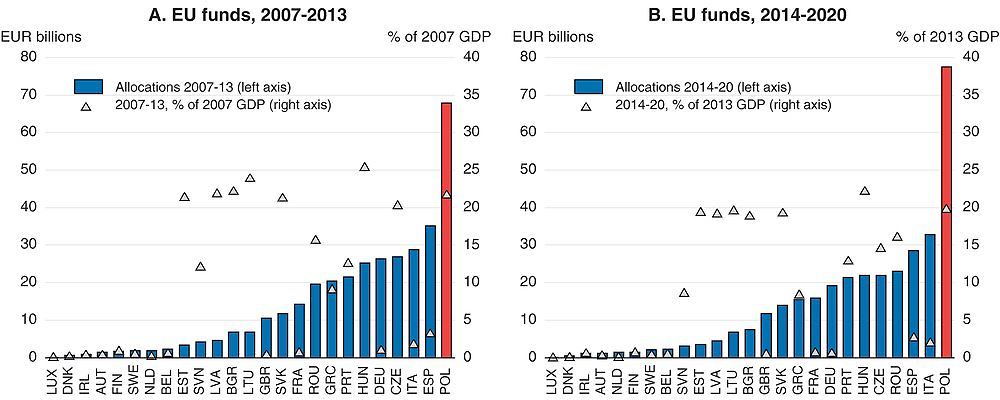
← 1. Only recipients from both periods are shown.
Source: European Commission (2014), “Summary of the Partnership Agreement for Poland, 2014-20”; European Commission (2013), Analysis of the Budgetary Implementation of the Structural and Cohesion Funds in 2012.
Bridging transport and energy infrastructure gaps will require significant fiscal discipline. The government will need to co-finance important investments over 2014-20, and EU funds are likely to be gradually phased out thereafter. In addition, much of the current infrastructure funding relies on increased borrowing from the European Investment Bank (EIB) and the state-owned development bank, BGK. The current level of borrowing may be unsustainable, as infrastructure needs remain substantial, and maintenance costs are increasing. Large-scale investments, which require external funding, may put additional pressure on public finances, notably for local governments that are subject to tight budget constraints and binding debt rules.
Strengthening public procurement capabilities
Strengthening public procurement capabilities would improve investment quality and value for money. Poland made substantial progress in achieving efficient infrastructure spending during the 2007-13 programming period for EU structural and cohesion funds (Kierzenkowski, 2008). However, red tape and a lack of competition still appeared to affect public procurement practices in 2014 (European Commission, 2015e). Though the speed of the procedures and the proportion of contracts involving competitive tenders were above the EU average, 45% of award notices registered in the European electronic tender database attracted only one bidder, the EU’s largest share with Croatia (Figure 2.10, Panel A). Large projects, notably road infrastructure development tenders, attract more bidders according to the data collected by the Public Procurement Office: for public work contracts, 40% of procedures received five or more tenders in 2014. However, the low number of bids for smaller tenders may prevent efficient road and rail network maintenance. Tender advertising has been dematerialised and information is easily available, but the government should introduce simplified procedures, and the use of information notices prior to the tender advertising could be developed further, notably for contracts with values below the EU public procurement thresholds (NIK, 2015a). Administrative requirements in public tenders often remain complex, especially compared with the limited capacities of SMEs and young firms. Indeed, only 14 percent of SMEs bid for any public contracts, though this may also be explained by contracting entities’ distrust of them (European Commission, 2014b). The 2014 rise in the threshold for application of the Public Procurement Act from 14 000 to 30 000 euros could allow simplified procedures, but risks of corruption and anti-competitive practices will need to be closely monitored. In any case, the Public Procurement Office should continue to collect data on these small contracts.
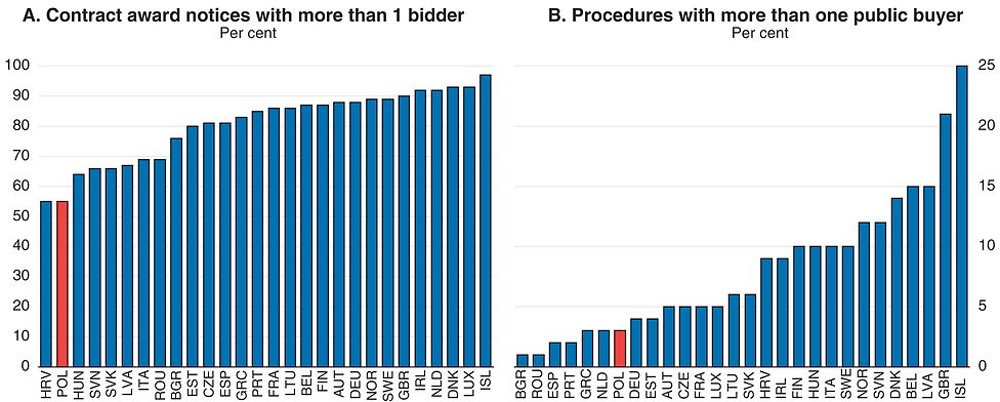
Source: European Commission (2015), Single Market Scoreboard – Public Procurement.
The initial choice of contractor does not take well into account quality considerations, despite recent legislative changes. In August 2014, the public procurement law has required the use of additional criteria in public tenders beyond price. Moreover, in July 2015 the Council of Ministers adopted recommendations on the application of social clauses in the governmental administration. These recommendations oblige public authorities to analyse the possible application of social clauses in all procurement procedures in order to promote employment of disabled persons, unemployed persons, other disadvantaged persons, and youth in vocational training, as well as firms employing staff on permanent contracts. However, in about 90 % of awarded contracts, price was the only contract-award criterion until 2013 (Public Procurement Office, 2015) and a lack of attention to quality considerations in award criteria still hamper public procurement. Indeed, technical performance was used together with price in only 15% of the procedures concluded between October and end-2014 (Public Procurement Office, 2015). Contracting authorities should define the requirements of the contract to provide the contractors with enough freedom to propose different technical solutions and use quality criteria to assess the different tenders. In particular, for complicated projects, such as new infrastructure, technical details, methodologies, execution and organisation should be more systematically taken into account both in contract specifications and bid assessment, in addition to timing, guarantees and references that are frequently assessed by contracting authorities. Environmental impact should also be explicitly considered (OECD, 2014a). The insufficient use of technical performance criteria and excessive emphasis on the lowest price could lower quality and increase the risks of leaving projects unfinished if contractors go bankrupt. A well-known example is COVEC, a Chinese company, which was supposed to build a stretch of the A2 highway but pulled out because the final costs would have been twice the amount of its initial bid. In addition, international evidence found that favouring low prices at the awarding stages may induce larger ex post renegotiation if the initial commitments are not binding (Decarolis, 2014). Though not often used, competitive dialogues should be developed, as they could help civil servants appreciate crucial technical details for large infrastructure projects. In this context, the recent introduction by the railway infrastructure manager (PKP PLK) of a two-stage system, in which contractors will be vetted at the outset for production and financial potential, is welcome.
Ensuring an efficient application of public procurement procedures would require additional central government assistance for local governments and developing joint purchasing offices, as procedures combining several public buyers are relatively infrequent (Figure 2.10, Panel B). Many local governments lack in-house capacity, and sometimes the financial resources, to conduct procedures and hire external advisors. Indeed, numerous irregularities have been found in local roadbuilding projects (NIK, 2014b), and, as in other OECD countries, the market concentration of the construction sector makes it fertile ground for bid-rigging, notably for large projects. A first step would be to introduce additional central government technical assistance through expertise and upfront resources for the preparation of large projects. For example, a dedicated central preparation facility could reap economies of scale as local governments cannot all develop skills to deal with infrastructure projects. It could also help local government in organising financing (EIB, 2014) and would avoid potential conflicts of interest when hiring external experts. More generally, 16 106 Polish institutions held public tenders in 2014 (Public Procurement Office, 2015), and developing central purchasing offices, boosting cooperation between municipalities through an integrated e-government system, and enhancing staff skills to deal with complex selection criteria would help ensure more efficient practices. It is encouraging that the establishment of a central purchasing group in the railway company PKP at the end of 2012 led to significant savings. The announced introduction of mandatory e-submissions for public tenders in 2016 is an opportunity to increase cooperation across local governments, as current e-government procedures remain fragmented and lack common standards (European Commission, 2015c). A comprehensive e-procurement strategy, as recommended by OECD (2014d), to encourage the transition to e-procurement and to co-ordinate its implementation would save money, improve transparency, reduce delays and increase competition. The authorities acknowledge this and plan to introduce better coordination through the 2014 National Integrated Informatisation Programme (PZIP).
Improving the judicial review of public procurement disputes and appeals and strengthening ex post monitoring capacities would increase the effectiveness of procurement practices. In particular, equal treatment of different appeals by the national chamber of appeals (KIO), which reviews public procurement decisions, is unlikely, as many appeal procedures are instructed by a unique civil servant (NIK, 2015a). Moreover, on-site monitoring has been sometimes lacking. As much as 70% of the national road sections built in 2008-13 have defects, according to the court of auditors, and many local road managers exercise weak supervision over maintenance and investment works (NIK, 2014b and 2015b). This may increase incentives for strategic low bidding with prospective renegotiation. Therefore, the government should aim at increasing information available to tendering authorities about the costs borne by private companies. Encouraging the use of joint purchasing offices for local governments and providing additional central-government assistance and training for civil servants would help.
Road and rail infrastructure investments and procurement procedures are particularly at risk of corruption in Poland (CBA, 2013). International corruption cases involving Polish officials have been frequent (Escresa and Picci, 2015), and corruption is still perceived as widespread and hampering business competition (Figure 2.11). Preventing public entities from artificially dividing contracts into parts and awarding them without applying the rules and procedures set out in the Public Procurement Law would limit some of the risks (NIK, 2015a).
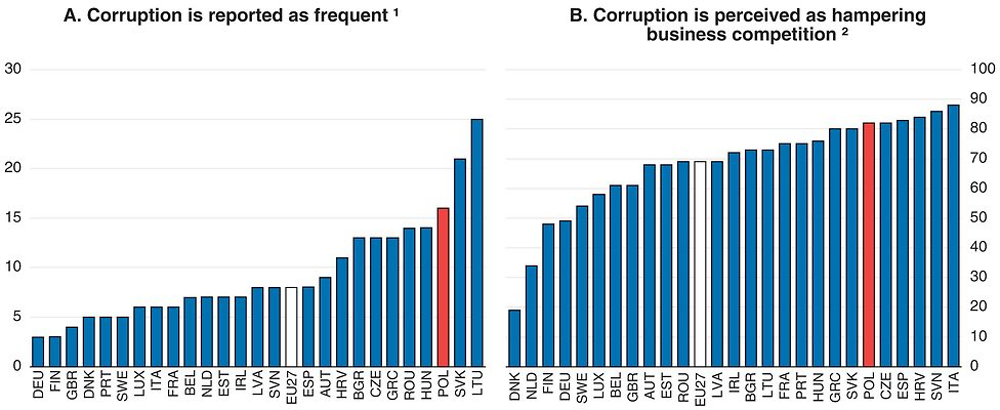
1. Percentage of respondents admitting they experienced or witnessed a case of corruption in the 12 months preceding the survey.
2. Percentage of respondents who agree with the statement that favouritism and corruption hamper business competition.
Source: European Commission (2014), Special Eurobarometer 397, Corruption Report.
Broader measures are also needed to address corruption risks. Management and supervisory board positions in the numerous state-controlled companies may be subject to potential conflicts of interest; the establishment of a non-partisan appointments committee to select candidates would help alleviate them (European Commission, 2014c). Introducing “cooling-off periods” for senior civil servants leaving the public sector would reduce revolving-door opportunities. Strengthening whistle-blower protection and the independence of the Central Anti-Corruption Bureau, which is responsible for verifying the declarations of private interests, would also be helpful (European Commission, 2014c). Currently, Polish public officials are not even temporarily restricted from lobbying and interacting with their former subordinates or colleagues when they leave the public sector, unlike in most OECD countries. The level of disclosure and public knowledge of the private interests of political advisors and senior civil servants is relatively low (OECD, 2015e). Furthermore, there is no specific legislation concerning the protection of whistle-blowers apart from general provisions in the Labour Code on unfair dismissal, which in any case does not apply to those on civil law contracts. Therefore, fear of employer retaliation may discourage whistle-blowing. A first step would be to rapidly implement the previous government’s 2014-19 anticorruption strategy that included developing awareness campaigns, revising public tender rules and strengthening the monitoring of state-owned enterprises (Ministry of Interior, 2014).
Mobilising private sources of infrastructure investment
Private investor participation in infrastructure provision could lead to greater efficiency in its management and delivery (OECD, 2015f). Developing Public Private Partnerships (PPPs) could thus lower expenditures over the medium and longer term. As elsewhere in Europe, the complementarity between PPPs and EU funds has been weak (EPEC, 2012): only a dozen projects combining EU funds with a PPP structure have been completed to date in Poland. In particular, PPP use for infrastructure projects has so far been limited, and large projects have been difficult to complete (Figure 2.12). Almost all of the 342 procedures started in 2009-14 were by local governments (Ministry of Economy, 2015b). Completion rates were particularly low for transport infrastructure and in the energy sector: among those 41 cases, only 4 were finalised. The Ministry of Infrastructure and Development released a draft version of changes to the law on Special Purpose Vehicles in September 2015 to boost road construction based on commercial rules.
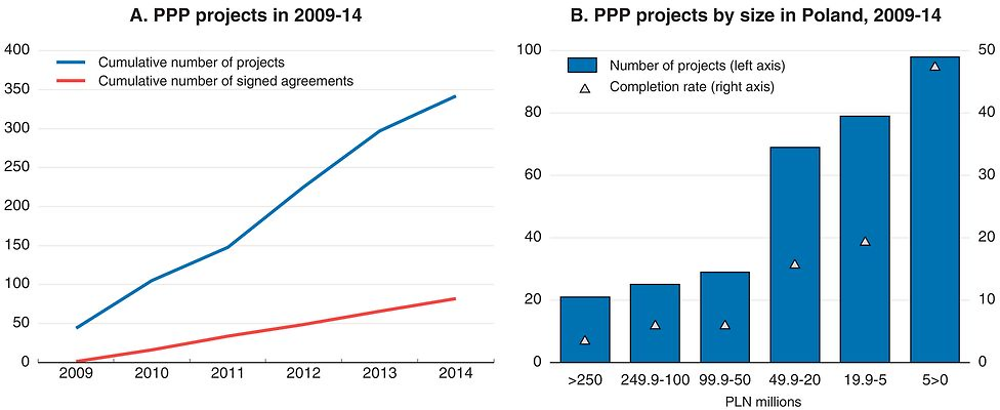
Source: Ministry of Economy (2015), Raport PPP.
Infrastructure projects are, in principle, attractive assets for private equity investors and debt providers. They tend to offer stable returns, low volatility and good hedges against inflation surprises. However, the experience of other OECD countries, such as Portugal and Spain, shows that careful design of PPPs is needed to avoid cost overruns, limit renegotiation risks and contain future fiscal liabilities. In areas where PPPs are deemed to potentially improve infrastructure delivery and operation, the authorities should make their decisions based on feasibility analysis and collect relevant data to allow ex post assessment at a predetermined date. This would help to develop procedures to assess longer-term value-for-money differences between standard public procurement and PPPs (Burger and Hawkesworth, 2011; OECD, 2012b). The current and estimated future fiscal costs of each PPP needs to be transparently accounted for in public budgets. Only in this way can these costs be adequately scrutinised through CBA.
Limited administrative capacity hinders PPP development in Poland. Despite the new 2008 PPP law, the procedures may be too complex to be carried out by inexperienced local governments that sometimes lack funding and capacity to hire external advisers. In addition, central responsibilities are split between different ministries, though two ministries in charge of PPPs were merged into the Ministry of Economic Development in 2015, and there is no central PPP unit (EPEC, 2014). Existing structures allow information sharing between different public PPP stakeholders, but the development of a central structure advising local governments in designing and implementing PPP procedures could be helpful, and the government is currently working on developing such a structure. It could ensure further monitoring and appropriate renegotiation guidelines and skills and avoid potential conflicts of interest when hiring external consultants. Encouraging co-operation between local governments would also be positive. For example, the City of Poznań and nine neighbouring municipalities have recently invested more than 200 million euros (including 82 million euros from the Cohesion Fund) to reorganise waste management (European Commission, 2015f), and other municipalities could build on this experience. Further public-sector involvement in PPPs’ preparatory phase could also help improve the completion rates. In a recent ITF study for a PPP port-rail link in Slovenia, a full business case, CBA and risk analysis of the project, including land acquisition, had all been completed before the authorities issued a call for interest (ITF, 2015). Only then the private partners inspected the design and whether they could improve it. This would reduce the current long time-frame of PPP projects for infrastructure (preparation, implementation and operation) that poses significant political risks.
Strengthening long-term finance tools would support infrastructure financing. Poland benefited from funding by the EIB and the European Bank for Reconstruction and Development (EBRD) of around 0.1% of Polish GDP in 2014 (EUR 5.5 billion and EUR 0.6 billion, respectively). Both institutions raise funds on capital markets and relend them on favourable terms, notably for infrastructure projects. Recent initiatives, notably the European Fund for Strategic Investments (EFSI) and Polish Investment Programme (PIR) and the announced Polish Development Fund (PFR) (Boxes 2.2 and 2.3), aim to facilitate the provision of long-term loans and to crowd in private finance, though they may also be used for public investment. However, such measures may have large deadweight losses. Indeed, lending by public entities may favour market-viable but politically favoured activities, distorting competition in a context where public ownership remains widespread (OECD, 2014a).
Three main EU instruments aim to attract private infrastructure:
The Connecting Europe Facility (CEF) is intended to be a catalyst for further private and public funding by giving infrastructure projects credibility and lowering their risk profiles, thereby attracting private investors. One of the CEF’s key elements is more systematic use of innovative financial instruments, such guaranteed loans, to provide a funding alternative to traditional grants and fill financing gaps for strategic investments.
The Loan Guarantee Instrument for Trans-European Transport (LGTT) has been introduced to partially cover risks for network projects of common interest and to receive income from user charges. The LGTT normally guarantees a maximum of 10% of senior debt (20% in exceptional instances) up to a maximum of EUR 200 million per project. This support substantially enhances credit quality, thereby encouraging a reduction of risk margins applied to senior project loans. It is available for as much as 5 to 7 years after project completion.
In addition, the Commission and the European Investment Bank (EIB) set up the European Fund for Strategic Investments (EFSI) in July 2015. Its capital consists of a EUR 5 billion contribution from the EIB and a EUR 16 billion guarantee from the EU budget, half of which is to be paid in, in a back-loaded manner, over 2016-20 by reallocating existing budget funds. The EFSI capital of EUR 21 billion will be used to raise around three times as much funding by issuing bonds, and the funds thus raised will be used as “first-loss protection” to attract other private or public sources to finance projects of about four times the risk-bearing capacity. Hence, every EUR 1 of EFSI capital is expected to result in about EUR 15 of real investment, with estimated total investment volume of EUR 315 billion (2.2% of 2014 EU GDP) (OECD, 2015a). Poland announced that it will contribute EUR 8 billion (0.1% of 2014 Polish GDP) to EFSI projects through the state-owned development bank (BGK) and the Polish Investments for Development (PIR) (European Commission, 2015g).
The EFSI focuses on financing infrastructure investment and innovation and SME financing. Such funding may help correct market failures and trigger further private-sector investment. The implementation of the EFSI started with the appointment of its steering board in July 2015. Projects seeking EFSI support will be submitted to the EIB (and the European Investment Fund for SME financing), which will carry out project selection. In turn, the EIB will seek the approval of the EFSI Investment Committee to benefit from the EFSI guarantee. This is expected to allow the EIB to finance riskier projects.
The state-owned development bank (BGK) was established in 1924 and managed assets worth 3% of GDP in 2014. It is in charge of several welfare and housing policies and a low-interest loan programme for SMEs. It also manages the national road and railway funds. However, it has little autonomy in infrastructure financing for these two funds, focusing instead on project finance. Indeed, the two funds are financed through earmarked revenues from fuel taxes and road tolls, bond issuance, bank and EIB loans and EU funding, while the Council of Ministers and the state-owned road infrastructure manager (GDDKiA) make their own decisions as to their investment programmes.
BGK provided start-up funds for the Polish Investments for Development (PIR), created in 2013. This state-owned investment fund has share capital of EUR 0.3 billion and assets worth EUR 1.6 billion (0.1% of 2014 GDP). It aims to provide long-term finance for commercially viable projects, mostly in the infrastructure sector. Independent investment committees supervise the strategy of four funds targeted at infrastructure, local governments’ and business investment, through debt and equity financing.
The new government announced the creation of the Polish Development Fund (PFR) in February 2016. The fund will integrate some existing institutions, notably BGK and PIR, and aims at increasing their efficiency. It will finance not only infrastructure projects but also SMEs, business investment, export promotion and innovation.
The national road fund and local governments have been able to issue substantial amounts of debt since 2007. Nevertheless developing the long-term investor base would increase the supply of finance for infrastructure investment. While pension funds were among the main buyers of the bonds issued by the state-owned development bank (BGK), their size has begun to decrease (Figure 2.13). The 2014 pension reforms shrank their role, as most people switched to the public pension scheme for their mandatory contributions, and voluntary contributions to private pension funds remain small. In addition, pension funds had to hold a minimum of 75% of their assets in equities in 2014, and that floor will only gradually decrease to 15% in 2017. Moreover, pension funds are now forbidden to invest in Treasury securities and State Treasury guaranteed securities, including bonds issued by BGK on behalf of the National Road Fund. In principle, foreign institutional investors could supply long-term project finance, but European capital markets remain fragmented. Moreover, bank funding for infrastructure may be constrained in maturities and volume, while pressures on public finance may reduce state transfers to BGK over the medium term. Therefore, strengthening the local long-term investor base would be helpful, as only the largest investors have the capacity to directly fund infrastructure projects because of their large size and long-term horizon (Della Croce and Yermo, 2013).
← 1. The figure refers to autonomous pension funds. It includes all pension plan types managed by pension funds (occupational, personal, defined benefit and defined contribution plans). However, it excludes pension insurance contracts, which represent most of the private pension assets in some countries, such as Denmark and France.
Source: OECD (2015), Pension Funds in Figures.
Some regulatory reforms would also foster private investment in infrastructure. OECD evidence suggests that reducing barriers to entry in network industries can foster higher rates of infrastructure investment (Sutherland et al., 2009). Formal entry barriers have decreased substantially in Poland, according to the OECD indicators of the stringency of regulations in network industries – ETCR – (Figure 2.14, Panel A), but widespread public ownership may lead to potential competition issues limiting investment (Panel B). For example, natural gas volumes exchanged on the power exchange are growing rapidly, but the historical supplier (PGNiG and its subsidiary PGNiG Obrót Detaliczny) still controlled 89% of the market for end users in 2014, including production, imports, storage, wholesale and retail sales and distribution, despite legal and functional unbundling (ERO, 2015). Further political involvement in the nomination of the presidents and board members of some state-controlled companies, as envisaged (PAP, 2016), could lead to conflicts of interest and regulatory uncertainty, deterring investment (OECD, 2015g).
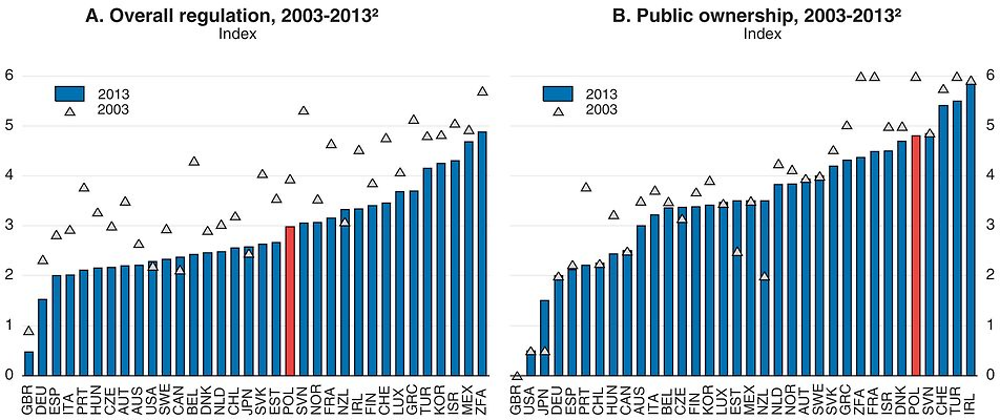
← 1. Average of the energy and rail sectors.
2. Index scale from 0 to 6, from least to most restrictive. 2008 value for the United States.
Source: OECD (2015), Regulation in Energy, Transport and Communications (ETCR) Indicators.
OECD cross-country evidence shows that infrastructure investment is curbed by regulatory uncertainty (Égert, 2009). In Poland’s case there is scope to reinforce the independence of the main network regulators, including the Competition Authority, to lower such uncertainty (Égert and Goujard, 2014). All regulators should have fixed-term, non-renewable mandates during which they cannot be dismissed without fault and which prevent revolving-door opportunities. But the railway network regulator, UTK, for example, reports to the Minister responsible for Transport, and its President does not serve for a specific term and may be removed at any time. This creates poor incentives, especially when it comes to supervising the government-controlled infrastructure manager and network operators. Moreover, in September 2013, the open-ended contract of the Energy Regulatory Office President was transformed into a five-year fixed-term contract that can, however, be renewed once. Finally, the political independence of the president of the Competition Authority is not fully guaranteed, despite important improvements. The open-ended contract and the fact that (s)he can be recalled without justification potentially expose the Authority to political pressures.
Improving transport infrastructure would strengthen productivity and health outcomes
Transport infrastructure needs remain substantial. From 2003 to 2011 such investment increased sharply, and was heavily weighted towards roads (Figure 2.15, Panels A and B). The road network’s length has risen more than fourfold since 1999. Even so, motorway density remains below neighbouring countries’ such as Hungary and the Czech and Slovak Republics, and the perceived quality of the transport network is still poor (Panel D). The next phase of EU funds and the new national investment programmes foresee a more balanced allocation of funds across transport modes (Box 2.1). In addition, the new perspective aims to improve Poland’s transport network connectivity with its neighbours. This focus is welcome, as international road connectivity is low, which can significantly deter foreign trade (Bougheas et al., 1999), and the quality of trade and transport infrastructure is considered as the main impediment to logistics performance in Poland (World Bank, 2014). OECD evidence shows that Polish exports could rise by about 18% if the ratios of road distance to great-circle distance for international road connections were similar to their national counterparts (Braconier and Pisu, 2013).
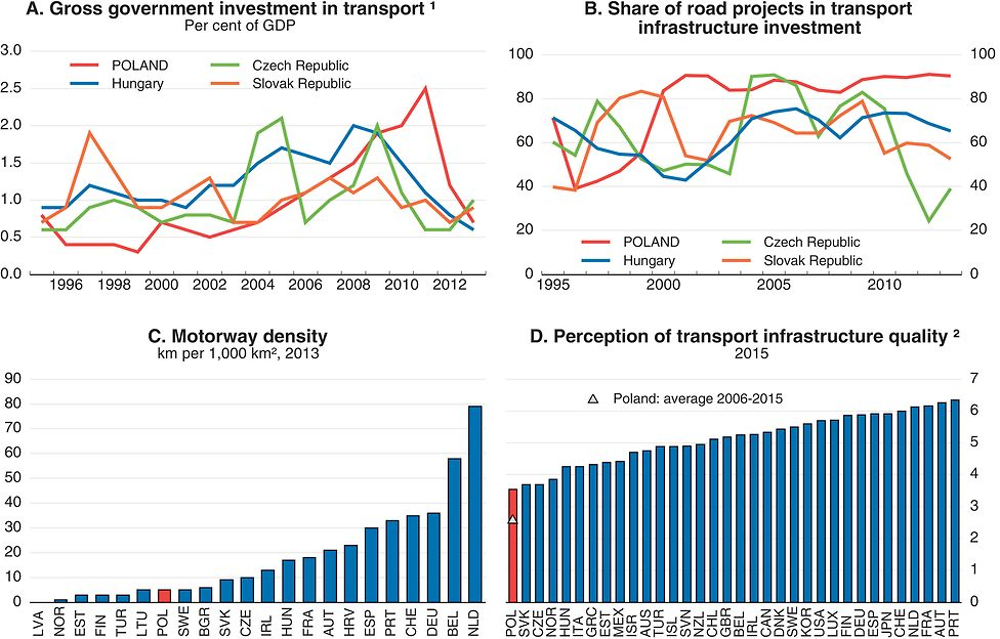
1. Gross general government fixed capital formation.
2. Index from the lowest perceived quality (0) to the highest (7).
Source: OECD (2015), Transport Infrastructure Investment and Maintenance Spending; Eurostat (2015), Road, Rail and Navigable Inland Waterways Network; World Economic Forum (2015), The Global Competitiveness Report 2014-15.
Developing integrated transport programmes and implementation plans
Transport responsibilities, notably for the management of the road network, are fragmented. National roads, covered by the National Road Construction Programme (Box 2.3), account for 60% of overall traffic (Ministry of Infrastructure, 2011) but represent less than 5% of overall network length. Municipalities were the main level of government responsible for the growth of the overall road network during 2005-13 (Table 2.1). However, many local governments neglect or lack technical capacities to plan the development of their local roads. For example, despite a statutory obligation, many local authorities do not maintain up-to-date records of road conditions (NIK, 2014b). The absence of such information makes it difficult to analyse metropolitan, regional and national needs. The National Strategy of Regional Development 2010-20 aims to strengthen vertical and horizontal partnerships at different levels of development management, through “territorial contracts” between the central and regional governments (OECD, 2011a), but progress has been modest.
The 2014-20 EU perspective is an opportunity to enhance the metropolitan governance framework and improve urban planning. The funding allocation seeks to increase the involvement of urban areas in infrastructure and project management and will delegate certain functions to them. The planned creation of voluntary metropolitan associations in 2016 is also welcome (see above). Recent OECD cross-country evidence suggests that this could have sizeable positive long-term effects on labour productivity (Ahrend et al., 2014), notably by improving transport linkages. However, collaboration among local governments has been limited so far. They prepare transport plans and strategies in the context of EU funds disbursement, but there is insufficient coordination across levels of government, and strategies are only irregularly updated (World Bank, 2011). Moreover, existing Polish metropolitan governance bodies serve primarily as fora for policy exchange, without formal powers, and usually cover a limited fraction of the actual metropolitan area (Ahrend and Schumann, 2014).
Insufficient public transport and poorly functioning housing markets have negative effects on growth and well-being in urban areas, in which more than half of the population is located (OECD, 2015c; 2013b). In particular, the significant increase in urban sprawl in the main cities (Figure 2.6) has led to lengthening commuting times (GUS, 2015a), while heavy road traffic contributes to high urban air pollution (Figure 2.3). At the same time, low-density development increases the costs of public transport relative to private cars. The integration of the different modes of transport remains poor (European Commission, 2015c), and most Polish cities lack easy ways for passengers to get comprehensive information about public transport and buy tickets. The 2014-20 operational programme for EU funds foresees the construction and modernisation of intermodal terminals for passenger and freight transport, and intermodal projects linking railways, seaports and airports will benefit from extra points when competing for EU grants. This will require significant investments in rail rolling stock and appropriate funding, which may be lacking, despite some dedicated EU funding for passenger services. Better integrating transport infrastructure plans, and land-use and social policies could reduce commuting times, trade costs and negative environmental externalities. For example, residential development should favour relatively high-density construction near existing transport nodes; where local authorities permit linear sprawl, they could be required to set aside dedicated road space for buses or trams along routes that will inevitably become congested; and planning should facilitate the development of orbital transport links within agglomerations as well. Such policies would also help maximise the benefits of agglomeration externalities.
Improving road asset management and developing road pricing
Spending on roads is heavily tilted towards new investments, given weak incentives to undertake road maintenance. The share of maintenance in total road spending has declined sharply, though the percentage of roads in good condition has risen slightly to over 60% since 2005 (Figure 2.16; GUS, 2011 and 2015b). The savings from deferring maintenance may be outweighed by the resulting need for more expensive measures in the long term (Crist et al., 2013). Many sub-central governments lack asset-management systems and a long-term vision to maintain their infrastructure assets and fully take into account the future costs of new roads (NIK, 2014b). By contrast, the national road manager (GDDKiA) has developed asset-management strategies, and it should try to transfer its experience to local governments through a central platform (World Bank, 2011). However, the financing of national and local roads also poses specific challenges for the development of efficient road-management mechanisms.
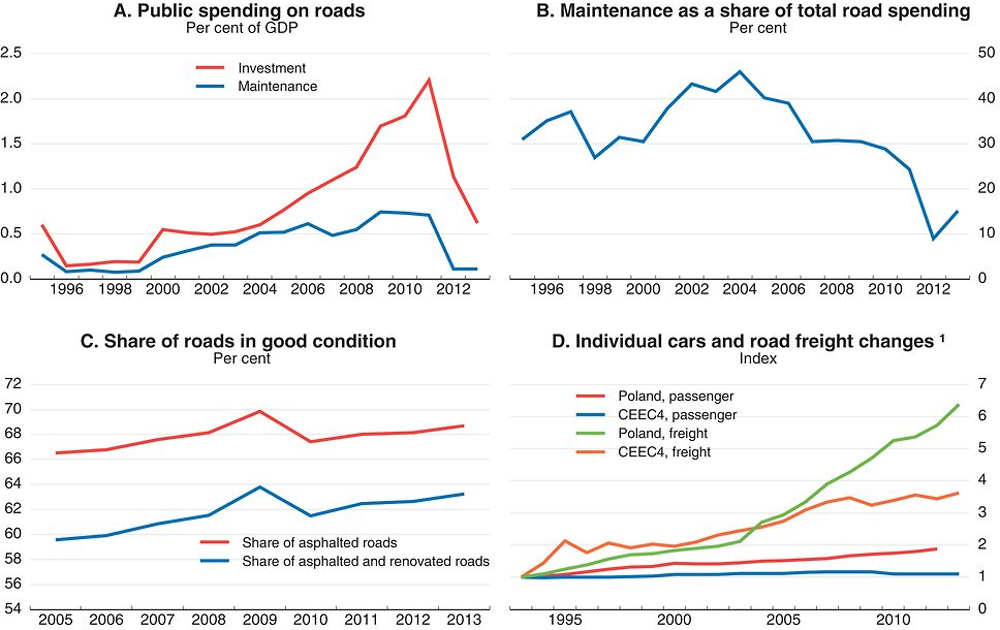
1. Index 1993=1. Volume in passenger- and tonne-kilometres.
Source: OECD (2015), Transport Infrastructure Investment and Maintenance Spending; OECD calculations based on GUS (2015), Road Transport in Poland in the years 2012, 2013 and GUS (2011), Road Transport in Poland 2005-09; OECD (2015), Transport Activity Statistics.
Long-term revenues and expenditures of the agencies in charge of managing road infrastructure could be better aligned. Past EU financing plans have focused on new investment and more efforts will need to be dedicated to maintenance in the future. At the central level, spending has been defined according to a long-term horizon (Box 2.1). The National Road Fund collects revenues from road user charges, mostly fuel taxes. The national road manager uses these revenues and specific government grants to finance new national infrastructure and maintenance and reimburse existing debts. However, the structure of local road financing creates uncertainty over the budget for maintenance in the long term, as local governments alone cannot afford to finance the repairs or construction of local roads. Funding is provided via equalisation mechanisms and resources specifically allocated by the central government, and spending decisions are taken as part of annual budget processes. This may hamper the development of efficient road asset-management strategies, such as multi-year contracting with the private sector. Central government grants have recently declined (NIK, 2014b), which partly explains the drop in maintenance spending. The government increased funding for local roads over 2016-19 to PLN 4 billion (0.2% of 2014 GDP) from PLN 3.2 billion over 2012-15 and envisages increasing transfers to local governments to improve road maintenance, notably through greater attributions of VAT revenues. Yet, earmarking effectiveness has been imperfectly monitored in the past, and some local authorities have neglected road maintenance, creating further backlogs.
The authorities should pursue reforms of public infrastructure pricing to ensure that long-term costs, including environmental and health externalities, are fully recovered and avoid cross-subsidisation across transport modes. Road users do not pay the full cost of usage, and this may partly explain the decline of rail transport. Moreover, the National Road Fund needs regular transfers from the state budget, despite the proceeds of road pricing. Poland’s main road user charges include fixed registration fees and an excise tax on fuel. The registration fees are largely independent of the vehicle type. Heavy vehicles have to pay specific fees only on a small part of the network, and the regulated fees were less than half their equivalents in the Czech Republic or Slovenia in 2012 (ITF, 2013). As a large part of road maintenance costs are attributable to heavy vehicles, this situation may in turn imply an inefficient allocation of capital investment in the freight sector between rail and road, if it results in a cost advantage for heavy goods vehicles over long distances.
Road pricing could be expanded and include larger weight-related charges on trucks to encourage investment and maintenance. In 2011 an electronic toll system (viaTOLL) replaced the former vignette system for heavy vehicles above 3.5 tonnes and buses. It is enforced on a small part of the national network (initially 3 140 km of national roads, expressways and highways, but extended by 251 km in June 2015) (viaTOLL, 2015). Current legislation foresees that almost all motorways will be tolled, and its implementation would be a step in the right direction. A well-advertised programme of infrastructure investment and maintenance could improve public acceptance of new road charges. More targeted but still market-based measures may be especially suitable for addressing externalities in terms of congestion and local environmental impacts. These externalities are highly variable across time, location and types of road users and are therefore difficult to deal with through regulations or vehicle and fuel taxes. Congestion and urban road charges would lead to a better use of road infrastructure. However, the current legislative framework prevents local authorities from setting congestion fees or urban tolls. They should be allowed to set fees that vary according to time of day or location. This approach has been used successfully for access to central London, Oslo and Stockholm. Charging fees would make users consider congestion costs when making transport decisions, and the additional funds collected could help finance urban public transport.
Strengthening the rail infrastructure investment framework
The railway infrastructure has only been partly modernised, with the result that the shares of rail freight and passenger transport have declined: indeed, passenger traffic has shrunk by about one-half since 1993, though it regained some ground in 2015 (Figure 2.17; UTK, 2015a). Over 2007-13 the authorities allocated only EUR 5 billion in EU funds to modernise and expand rail infrastructure. Only a few new railway lines were opened by end-2015. Well over half of all trains and numerous small train stations have not been modified to meet the needs of disabled passengers (UTK, 2014), and only a quarter of the network allows speeds greater than 120km/h (Ministry of Infrastructure and Development, 2015b). Poor quality is reflected in public attitudes and passenger satisfaction surveys (Figure 2.18). The allocation of access rights to railway operators also needs to improve. Because of deficient infrastructure monitoring and information systems the 2011 level of Polish access rejections was among Europe’s highest, and the punctuality of freight cargo was poor, despite the weak utilisation rate of the network (European Commission, 2014d).
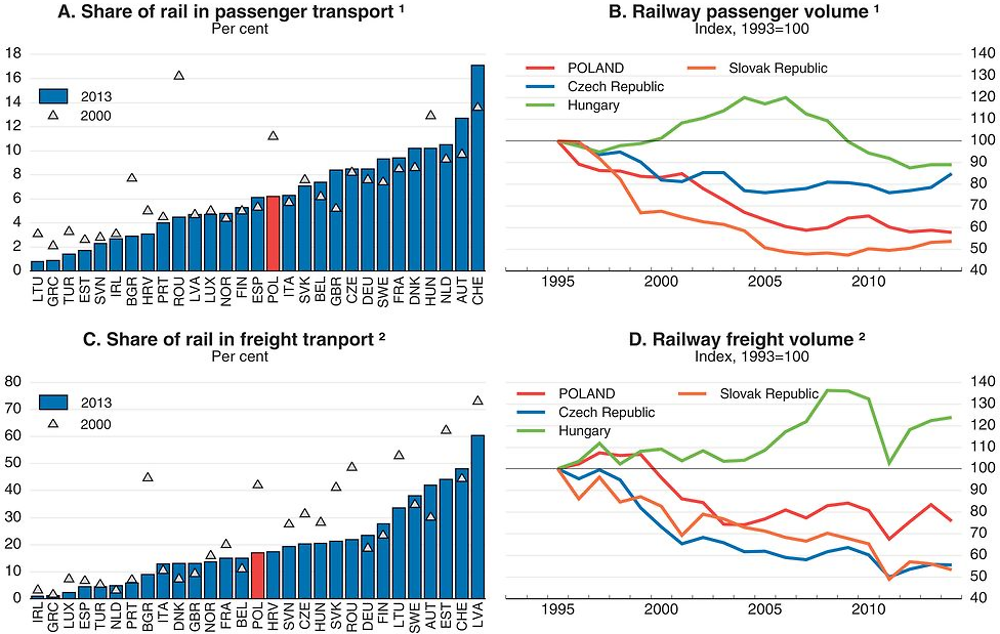
1. Volume of passenger transport in passenger-kilometres.
2. Volume of freight transport in tonne-kilometres.
Source: Eurostat (2015), Transport Statistics; OECD (2015), Transport Activity Statistics.
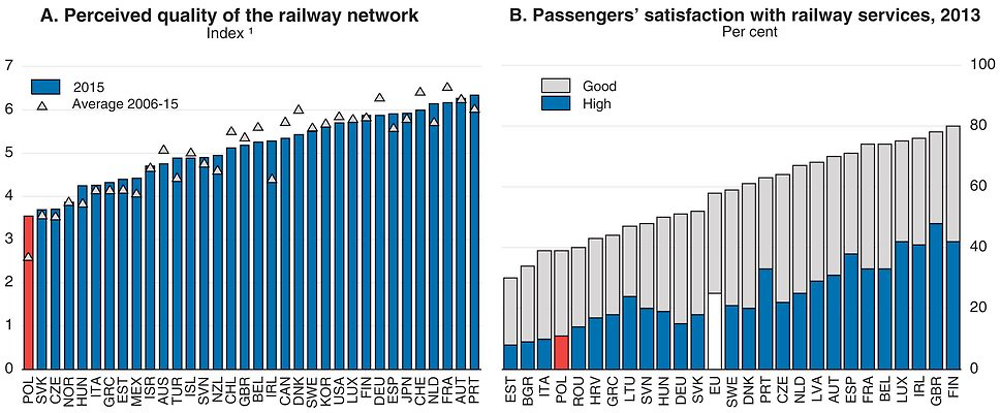
1. Index from the lowest perceived quality (0) to the highest (7).
Source: World Economic Forum (2015), The Global Competitiveness Report 2014-15; European Commission (2013), Europeans’ Satisfaction with Rail Services.
The density of the railway system remains above the European average, but it has fallen rapidly whereas it has been constant in other CEECs (Figure 2.19). Railways still suffer from poorly structured financing, and long-term negligence of even the shrunken network has exacerbated maintenance needs. The European Commission (2014e) estimates that there was systematic underinvestment in maintenance from 1996 to 2010. Over half the rail infrastructure requires significant repair work (UTK, 2014). The infrastructure manager, PKP PLK, is aware of these deficiencies, and the Nationwide Railway Programme adopted by the Council of Ministers in 2015 foresees rail infrastructure investments totalling PLN 67.5 billion (3.9% of 2014 GDP) until 2023. The focus on modernisation and maintenance of the most important lines is welcome, as it could lower management fees and lead to closure of unprofitable parts of the network. However, this could also have negative consequences, as freight companies may need to adopt longer itineraries. Passenger stations also require specific attention, as despite the dense network, the number of railway stations is particularly low, and citizens perceive them as remote (European Commission, 2014e).
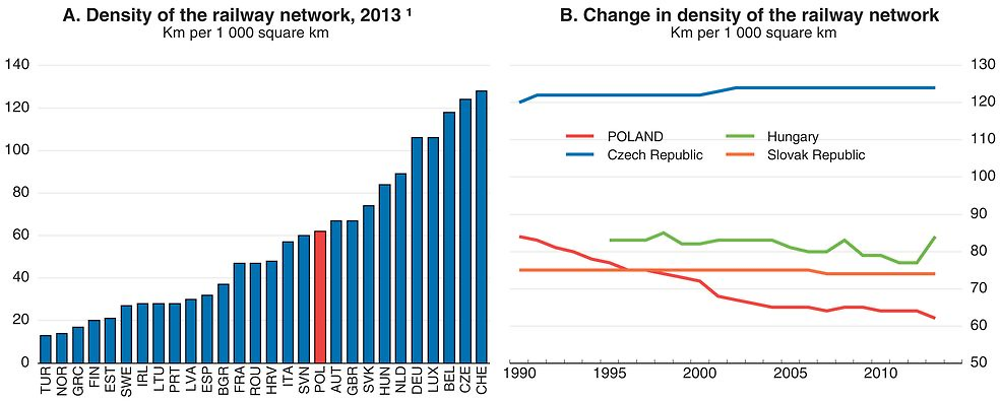
1. Or most recent year.
Source: Eurostat (2015), Road, Rail and Navigable Inland Waterways Networks.
Despite the planned significant increase in funding, rigid and insecure national financing hampers project preparation and implementation. The infrastructure manager, PKP PLK, signs three-year maintenance contracts with the state, but the specific budget allocations are decided yearly. As large maintenance projects are lengthy and uncertain, this gives PKP PLK little leeway to schedule such work and develop a comprehensive asset-management strategy. Indeed, in the past, funding at specific points in time has sometimes been lacking to ensure the timely delivery of railway projects (NIK, 2013 and 2015c). This led to increased volatility in railway infrastructure access charges. In addition, most local governments offer only one-year contracts to rail service providers for passenger services. This creates high uncertainty and hampers investment in the rolling stock and new entry. Indeed, there are several examples of tenders for public rail service contracts that have not been able to attract a single bidder (European Commission, 2013a). However, a 2014 law increased the predictability of track access charges, and a welcome draft programme aims to ensure more stable financing over 2016-23, notably for maintenance.
Strengthening the position of the regulator (UTK) and the rail infrastructure manager would help ensure proper incentives for investment. Poland has liberalised the freight sector, and the burden of regulation in the sector appears limited, according to OECD indicators (Figure 2.14). The infrastructure manager’s legal and financial independence is safeguarded through accounting separation (European Court of Justice, 2013), and the main freight company, PKP Cargo, was partly privatised in 2013. However, several railway operators and the infrastructure manager are controlled by the state and local governments, which may in principle lead to conflict of interests when it comes to allocating infrastructure use to competitors. It is the role of UTK to ensure application of all regulations covering the issue of access to infrastructure. UTK independence is not fully guaranteed, although it regularly imposes penalties in case of lack of maintenance or refusing the rail access charges proposed by PKP PLK (UTK, 2015b). As in other network industries with strong public ownership, the President of UTK is appointed for an indefinite period and can be recalled by the Prime Minister at his/her discretion. In fact, the Prime Minister used this prerogative in 2012 and dismissed the UTK’s last President. Enhanced political independence could be insured through a fixed-term non-renewable mandate defining clear dismissal conditions. In the period 2004-13 the Competition Authority found anti-competitive conduct in the cargo market six times: five involved abuse of dominance, the other was a case of an anti-competitive agreement (OECD, 2013c). Rail access charges for freight were high in international comparison in 2013, notably compared to those for passenger operators (Figure 2.20; World Bank, 2011), but rail access charges declined on average by about 20% and 12% in 2014 for freight and passenger trains, respectively.
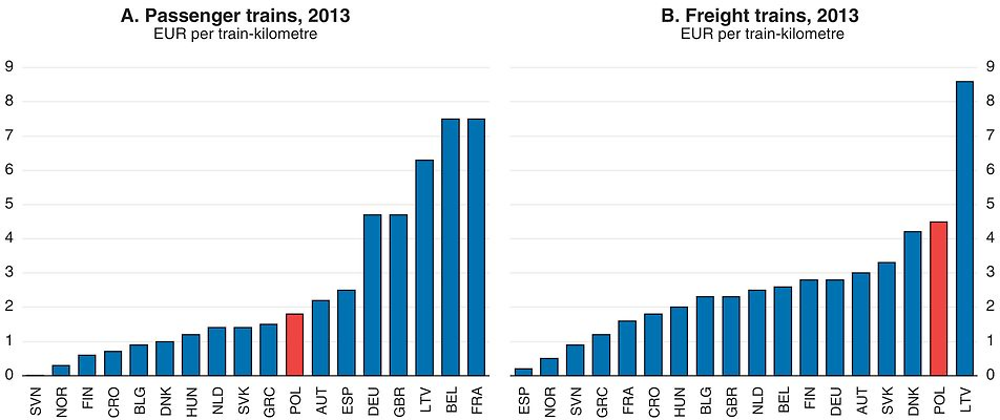
Source: Independent Regulators’ Group – Rail (2015), 3rd Annual Market Monitoring Report 2014.
There is room to improve the administrative and organisational capacity of the railway infrastructure manager. In the past, PKP PLK has been unable to make full use of the dedicated EU funds, infrastructure projects suffered from many delays, and the supreme audit office concluded that it was not properly prepared to use EU funds (NIK, 2013). The delays mostly resulted from errors in pre-design, design and as-built documentation, frequent changes in projects and unforeseen additional costs. In this context, the current plans of PKP PLK to streamline operations and improve investment quality are welcome. Under the 2014-23 National Railway Programme (Box 2.1), new documents and tender rules will be set, increasing attention paid to co-operation with contractors, some activities standardised, and additional training opportunities made available to staff.
Cumbersome regulations also hamper the procedures for designing and implementing projects (European Commission, 2015c). In the bidding over the 2007-13 EU structural funds, it took on average more than a year from when documents were submitted until a financing agreement for rail infrastructure projects was signed (NIK, 2013). In January 2015 new procedures were introduced to facilitate the implementation of such investment. They set a deadline of 45 days for the delivery of building permits, simplify some administrative requirements for project location when land ownership is not settled and introduce more advantageous conditions for the use of land during the construction phase (Republic of Poland, 2015). If efficiently implemented, such measures should increase investment. In addition, sidings operators who connect freight stations to the main railroads could be allowed to conduct small-scale maintenance work in-house. This could lead to some savings and reduce PKP PLK’s legal and organisational requirements. However, such possibilities should be limited to small-scale work and could impose additional work on the regulator, UTK.
Ensuring appropriate development of seaports and airports
Large-scale port projects have major implications for investment in regional transport systems. In Poland the recent expansion in seaport activity has led to increased investment after a drop through most of the 2000s (Figure 2.21, Panel A). New investment in equipment, more favourable VAT treatment for some importers and the congestion at other large European ports led to a sharp increase in turnover in 2015. In the first semester, goods handled in the port in Gdansk increased by 12 percent year on year. However, the perceived quality of seaport infrastructure remains poor (Panel B), and ports had low apparent labour productivity in 2012 (Eurostat, 2015a). Procedures for obtaining project documentation and making relevant administrative decisions are slow, while public administration proved partly ineffective in the past (NIK, 2012a). This, together with port fees that are administratively regulated, may hamper the funding of future investments, especially those with private-sector involvement.
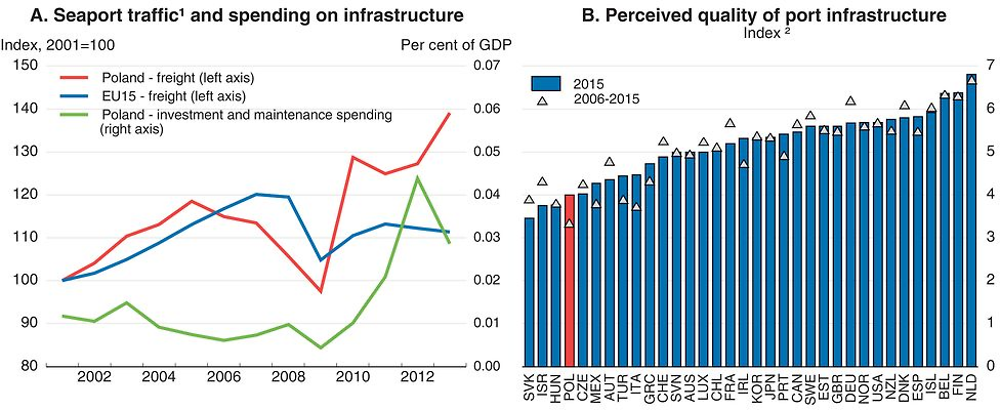
1. Freight tonnes handled in all ports.
2. Index from the lowest perceived quality (0) to the highest (7).
Source: OECD (2015), Transport Infrastructure Investment and Maintenance Spending; Eurostat (2015), Gross Weight of Goods Handled in all Ports; World Economic Forum (2015), The Global Competitiveness Report 2014-15.
Seaports remain insufficiently connected to the rail network, and the low quality of inland waterways limits their catchment areas. Besides the need to upgrade overall rail infrastructure (see above), particular attention should be paid to ports’ accessibility. Indeed, inefficient trans-shipment from road to rail also hinders rail and sea transport, though national strategic documents foresee future integrated development. Modernising inland waterways, as planned by the government (which created a new full minister for the development of the maritime economy and waterways) could also be effective. Insufficient funding has led to a rapid degradation of inland waterways, and 90 % of inland routes no longer meet the legal requirements for their use (NIK, 2014c). In turn, the poor infrastructure prevents ship owners from investing in new river fleet. The share of inland waterways in freight transport declined steadily from 0.2% in 2008 to close to nil in 2013 (Eurostat, 2015b).
By contrast, air transport has increased significantly over the past decade (Figure 2.22), and significant progress has been made to assess airport infrastructure needs and develop infrastructure. In a recent survey of the European Court of Auditors (2014), Poland was the only country among Estonia, Greece, Italy and Spain that had developed a global framework for the development of aviation infrastructure, and the two examined airport investments (Gdańsk and Rzeszów) were positively assessed. However, capacity for investment planning and monitoring may sometimes be lacking. The supreme audit office recently concluded that Warsaw-Modlin airport failed to properly prepare investment projects, specify tender requirements and efficiently monitor ongoing investments (NIK, 2015d). Moreover, the existing infrastructure still suffers from a lack of integration with public transport systems. A few large airports still do not have direct rail links; they are only being progressively set up.
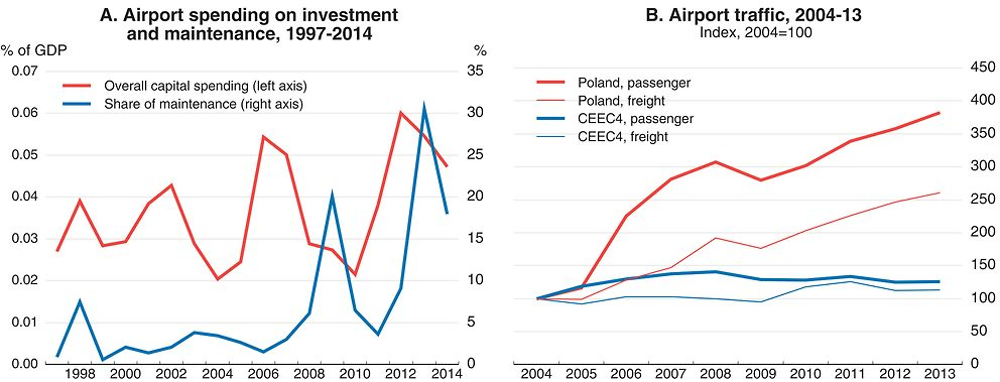
Source: OECD (2015), Transport Infrastructure Investment and Maintenance Spending; Eurostat (2015), Freight and Mail Air Transport and Air Passenger Transport.
Promoting appropriate energy infrastructure investment
Poland’s electricity sector faces two main challenges: ensuring the replacement of old capacity and providing incentives for diversification of the energy mix away from coal. The power generation stock is ageing – nearly half of today’s generating capacity is more than 30 years old (IEA, 2011) – and offers little spare capacity (Figure 2.23). Heavy reliance on coal has led to high emissions of CO2 and other pollutants (Figure 2.24), which have heavy human health costs not only to Polish residents but to wide swathes of neighbouring-country populations (EEA, 2011). Substantial new investment is required in the short and medium term to satisfy electricity and heating demand. Increasing supply diversification could allow more resilience to extreme temperatures and drought, such as those that occurred in summer 2015, when large-scale end-users suffered brown-outs, as coal-fired plants are heavily reliant on water for cooling, and wind generation was almost not working at all. The switch to low-emissions power generation will need to rely on the development of renewables and investment in technologies that are more capital intensive than those based on fossil fuels. In addition, improving energy efficiency and demand management through “smart” grids and meters also call for efficient price signals and new investments.
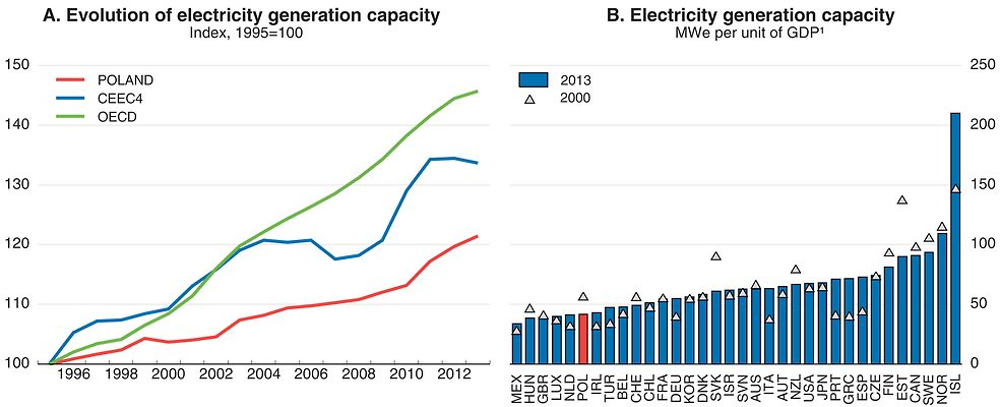
1. Thousand US dollars at 2005 purchasing power parities and prices.
Source: IEA (2015), Electricity Information 2015.
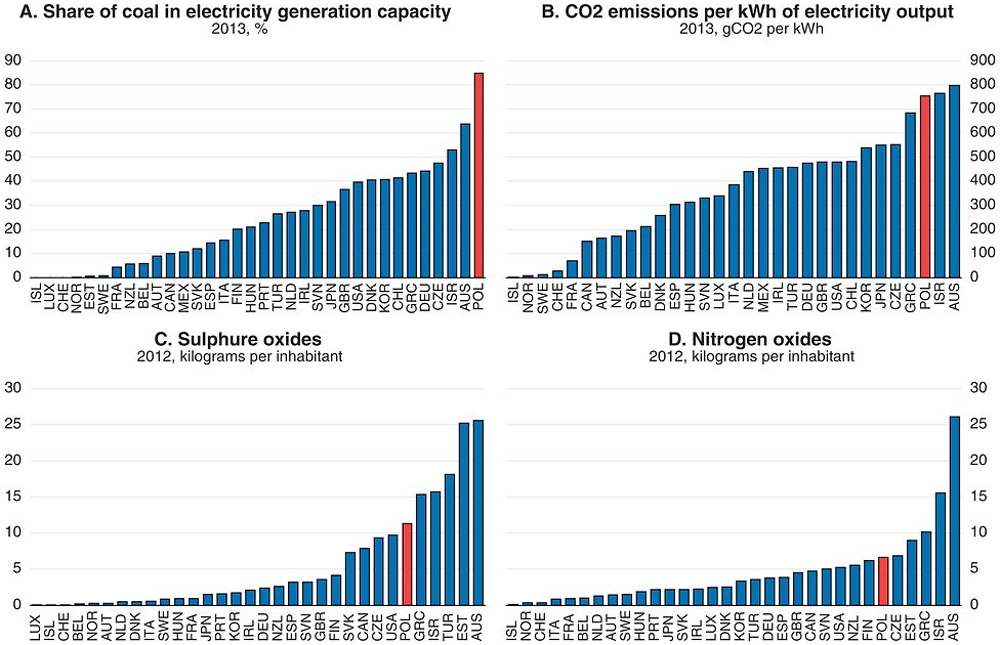
Source: IEA (2015) Electricity and Heat Generation and CO2 Emissions from Fuel Combustion; OECD (2015), Emissions of Air Pollutants.
Ensuring better incentives for new generating capacity
The draft “Energy Policy of Poland until 2050” (set to replace 2009’s “Energy Policy of Poland until 2030”) foresees significant changes in power supply and generation by 2050 (Figure 2.25). Existing hard-coal-fired power plants would be partially replaced and complemented by high-efficiency coal plants and a sharp increase in renewable energy sources supported by new gas plants that would constitute reserve capacity and would be used in combination with heat production. In addition, by 2030 a first nuclear power plant will be commissioned. Government policies aimed at a higher share of nuclear power need to take fully into account tail risks and its short- and long-term environmental costs to ensure competitive neutrality between different electricity sources. For the Polish nuclear programme to cover long-term costs the final price of electricity should cover the full costs of long-term waste management and decommissioning. Already in 2012 Poland put a tax on radioactive waste, levied per MWh of electricity generated by nuclear energy (OECD, 2015b), and 2012-13 amendments to the Atomic Law Act imposed strict safety and environmental standards. However, cost estimates for long-term waste storage are extremely uncertain, nuclear technologies are very capital-intensive, and differing regulatory requirements, technical capacities and financial conditions lead to a wide range of estimated costs in OECD countries (NEA/IEA/OECD, 2015).
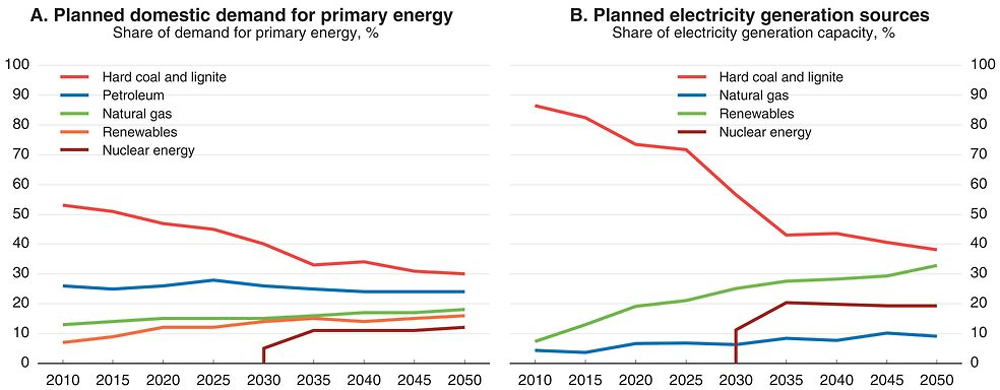
Source: Ministry of Economy (2015), Draft of the Energy Policy of Poland until 2050.
As in other European countries incentives for power generation investment are partly determined by the EU-ETS. Polish emissions in sectors covered by the EU-ETS are dominated by those from coal-fired power generation (EEA, 2013). As in the rest of the European Union, the average level of emissions has fallen below the allocated amount of permits, except in 2008 under the first two phases of the system. Under the third phase of the EU-ETS (2013-20), a declining cap is set on the total amount of emissions, and companies receive or buy emission allowances, which they must surrender for each tonne of CO2 emitted from covered facilities. Prices rebounded slightly as total emissions permits fell in 2013 and 2014 (Figure 2.26). Moreover, the majority of permits are no longer given away for free but are sold at auction to the power, heating and other participating sectors. Though Poland received a derogation of EUR 405 million worth of free allowances for distribution to certain generating installations, conditional on modernisation investment of equivalent value, the remaining allowances, worth about EUR 703 million over 2013-20, will be auctioned. The auction revenues are intended to further support the transition to lower-carbon energy sources. Such “earmarking” is potentially problematic, however, leading to dependence of expenditure on an uncertain revenue stream; yet, using some of the revenue in this way may help promote public acceptance for the policy. This, together with the carbon price increase resulting from the lower level of the overall cap and the 2018 introduction of a market stability reserve for allowances that would guarantee minimum carbon prices (European Commission, 2015h), will affect the energy mix. However, several practical barriers, such as regulated tariffs, national market fragmentation and regulatory uncertainty may still prevent the EU-ETS from endogenously determining an optimal energy mix.
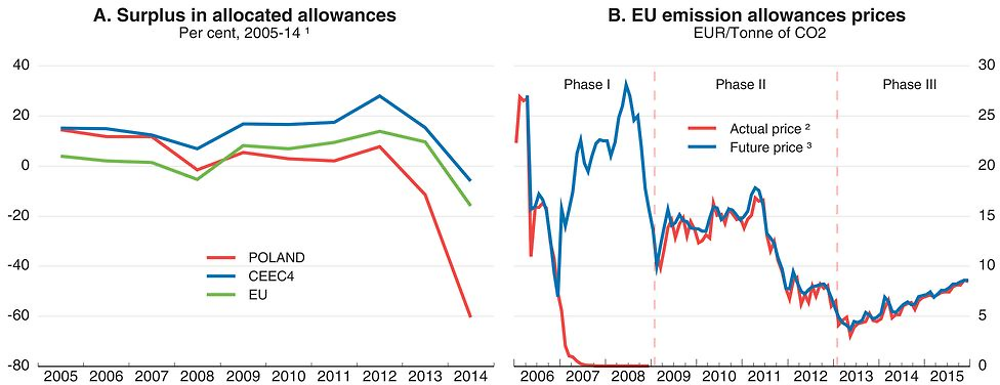
1. Difference between allocated and verified emissions divided by allocated emissions permits. CEEC4 is the weighted average of Hungary and the Czech and Slovak Republics.
2. Settlement price (monthly averages).
3. Future contract price for December of year t+1 (monthly averages).
Source: EEA (2015), EU ETS data viewer (database), www.eea.europa.eu/data-and-maps/data/data-viewers/emissions-trading-viewer; ICE Intercontinental Exchange and Datastream.
The Polish international trade capacity for electricity is tight and implies a need for more investment in low-emissions technologies to achieve any given emissions-reduction target at the European level, whereas a deeper integration with neighbouring electricity markets would spread the burden more efficiently across countries. More trade capacity is also important for energy security and for competition on wholesale and retail markets. With only 2% of its electricity generation capacity available for trade with other EU member states in 2014 (according to European Commission estimates) and low import and export flows (Figure 2.27), Poland’s trade capacity does not facilitate buffering between transmission system operators (TSOs), and power outages are relatively frequent (CEER, 2013). The trade capacity of Polish interconnections is constrained by its use for short-term unscheduled flows from neighbouring countries, notably Germany, to third countries (mainly Austria) (ACER, 2015). However, trade capacity would still reach only 7% of the installed generation capacity, even after accounting for restrictions due to unscheduled flows. New international links with neighbouring countries are planned under the February 2015 European Commission recommendation and the 2014-20 EU funds programme. The recent completion of the construction of the EU “project of common interest” (PCI) interconnection between Lithuania and Poland doubles the level of Poland’s trade capacity to 4%. Completion of another identified PCI, the interconnection between Vierraden, Germany and Krajnik, Poland, would bring Poland’s trade interconnectivity above the 2020 threshold of 10% fixed by the European Commission (2015b).
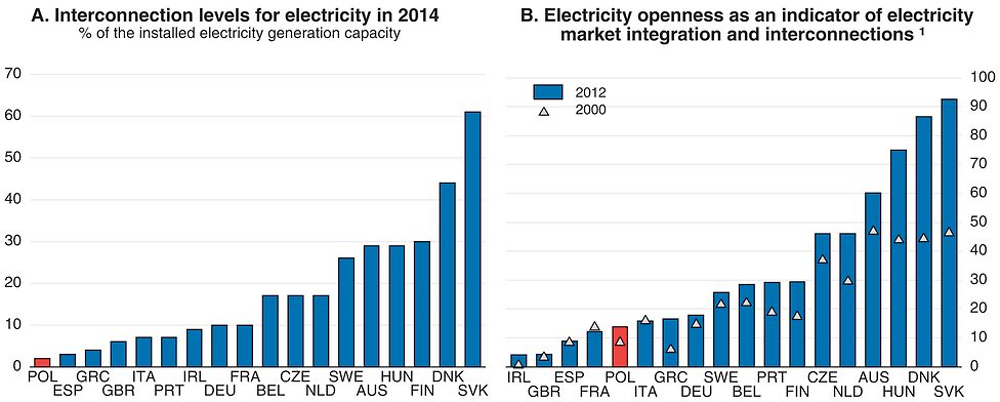
1. Electricity openness is calculated as the ratio of electricity imports plus exports over electricity consumption.
Source: European Commission (2015), Achieving the 10% Electricity Interconnection Target, Making Europe’s Electricity Grid Fit for 2020; IEA (2015), World: Electricity/Heat Supply and Consumption.
In any case, the current low wholesale electricity prices could lead to significant underinvestment in new capacity and shortages over the medium term. For example, the Polish TSO recently stated that achieving significant investment in new generating capacity will be challenging (PSE, 2015). Retail power prices to households and firms are relatively low (in euro terms) by European standards, and wholesale prices are, as elsewhere in Europe, declining and volatile (Figure 2.28). Marginal cost pricing in a wholesale market for a non-storable good such as electricity and the increasing availabilities of subsidised electricity from renewables have created issues for investment and the long-term financing of fixed costs, in particular in low-carbon generating capacity. Under some conditions, introducing a capacity market, as currently discussed, could favour investment. With such a mechanism, the authorities would certify reliable sources of generation capacity and set mandatory certificate targets electricity suppliers would have to buy. Certificate sales could thus improve the returns from new power stations and encourage investment in both peak-load generation and demand management, including load shedding during critical hours. In 2013 the Ministry of Economy, utility companies and the regulator started working on a capacity mechanism, and in January 2014 the TSO introduced an operational power reserve mechanism. It provides reserve power available in the event of losses of capacity generation. However, it does not have the same characteristics as a capacity mechanism, as prices for capacity are set in advance by the regulator and, at 37.3 PLN/MWh, the 2015 level was below the market price. If Poland decided to introduce a capacity market, it would need to closely monitor risks for wholesale market fragmentation, as such national schemes may limit import competition.
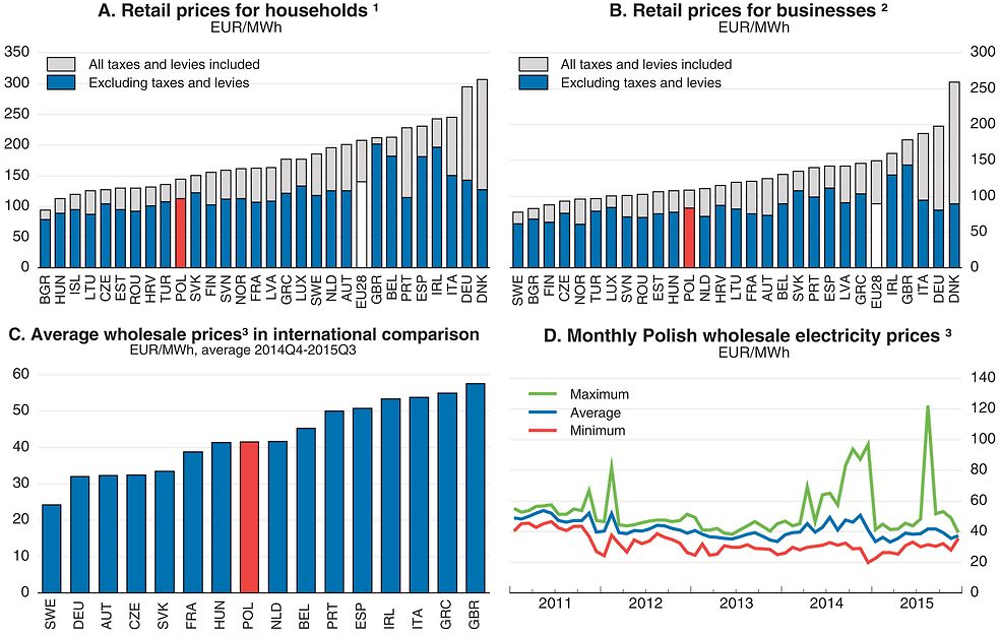
1. Price in the first semester of 2015 for annual use of 2 500 – 5 000 kWh.
2. Price in the first semester of 2015 for annual use of 500 – 2 000 MWh.
3. Base-load prices, maximum and minimum over daily observations.
Source: Eurostat (2015), Energy Price Statistics; European Commission (2015), Quarterly Reports on European Electricity Markets, 2014Q4 to 2015Q3, TGE-Polish Power Exchange.
Developing renewable energy sources
Poland’s energy policy also aims to diversify the energy mix towards renewables. In line with EU regulations, the renewables share in final gross energy consumption should reach 15% by 2020. Poland is on track to reach this target (European Commission, 2015c). Since 2000, wind power has been the fastest growing renewable source of electricity, followed by solid biomass (which, however, accounts for almost half of all renewable electricity generation), while the share of hydropower has decreased steadily. However, at 11% in 2013, the share of renewables in electricity generation was half the OECD average and stood below the target of Poland’s 2010 National Renewable Action Plan, despite significant improvements (Figure 2.29; Ministry of Economy, 2010). Indeed, until 2015, support for renewables was based on “green certificates” (renewables generators got revenue from selling both electricity and “green certificates”) and mandatory quotas for power companies, which favoured co-firing of biomass with coal in existing power plants but relatively weak incentives for the development of new technologies, as the price of “green certificates” went down following the expansion in co-firing power plants. Moreover, co-firing plants may not allow a long-term solution. The European Commission is currently revising the technical requirements for large power plants, and the draft regulations foresee more stringent criteria for emissions (to take effect in 2020), which would lead to the retirement of old coal plants, which provide the bulk of co-firing.
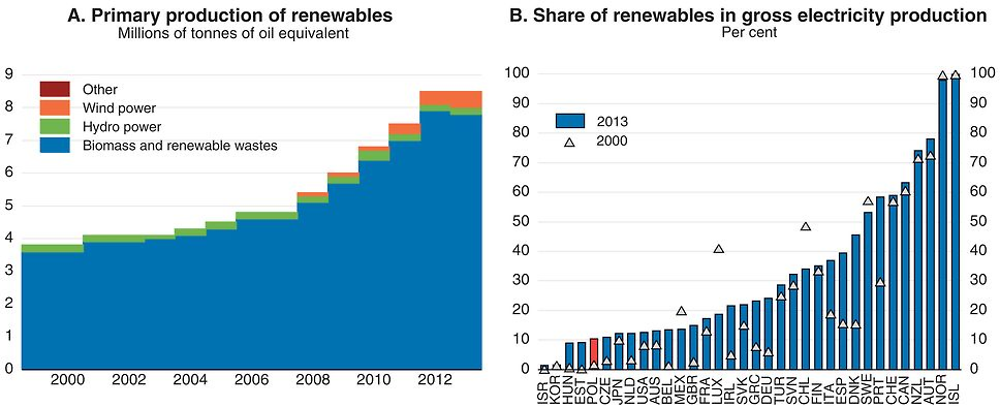
Source: OECD (2015), Green Growth Indicators; Eurostat (2015), Supply, Transformation and Consumption of Renewable Energies.
A new renewable energy law was approved by the Polish government in April 2014 to take effect in 2016. The long elaboration of the new regulatory system, as well as delays in the transposition of the EU Renewable Energy Directive (European Commission, 2013b), have created significant uncertainty that has deterred some investment. The new system will be based on auctions and guaranteed prices, though many details remain undefined. Support to co-firing of biomass with coal will be gradually phased out over 15 years. This could effectively eliminate the current oversupply of green certificates and boost their prices and investment in renewables. However, wind producers appear to have frontloaded their investment in 2013 to benefit from the current support system, as future auction conditions are expected to be less favourable. Indeed, the new law could allow more stable financing but will also probably lower overall public spending on renewables.
Developing electricity transmission capacity and ensuring easy access to the grid by streamlining administrative procedures could also foster the development of renewables. The ability to move generated electricity over long distances inside Poland, from potential windfarm locations in the North to more industrialised regions, remains insufficient. In the North applications for connecting renewables-based installations to the grid by far exceed the available capacity (IEA, 2011). Ensuring third-party access to the grid is especially important for renewable energy developers, as uncertain grid access increases project risk, and delayed connection affects a project’s cash flow. Moreover, the long time needed to obtain a building permit also limits the development of wind power. For onshore wind farms the procedures took 43 months in 2008, more than the double the European average, with only Portugal, Spain and Greece having longer delays (EWEA, 2010), and the process was still not transparent in 2014 (NIK, 2014a). The absence of clear requirements with regard to the scope of the environmental impact analysis was a major cause. In addition, developers have to deal with eight authorities for the necessary paperwork (NIK, 2012b and 2014a). Financing may also have been lacking for some private-sector renewables projects that were deemed more risky by banks. The new EFSI and PIR (Boxes 2.2 and 2.3) could finance new renewables capacity.
Developing high-efficiency combined heat and power (CHP)/cogeneration using renewable energies and gas, as planned in the draft Energy Policy of Poland until 2050, would also help increase energy efficiency and lower urban air pollution. District heating is Poland’s most common form of heat supply and holds tremendous potential for cogeneration and reducing GHG emissions (CODE2, 2014). Moreover, new buildings have to be connected to existing heating networks, unless they can be connected to a higher-energy-efficiency heating source. However, 88% of the existing CHP plants rely on coal (Ministry of Economy, 2012), while low wholesale electricity and heat prices limit investment opportunities. Since 2007, another tradable certificate system, comparable to the “green certificates” for renewables, forces electricity distributors to buy some CHP-produced electricity from high-efficiency plants and small producers. In addition, CHP plants benefit from reduced connection fees to the electricity grid. However, regulatory uncertainty has been high: the tradable certificate schemes stopped in 2013 but were reintroduced in 2014 for four years. This led to low and volatile prices of CHP certificates and limited new investments. Moreover, municipalities, responsible for defining local energy and heat plans, have often failed to develop or implement such plans, in the absence of skilled staff and legal sanctions (Ministry of Economy, 2012). Defining a stable support scheme beyond 2018 and providing expert support would encourage investment in new CHP plants.
Raising energy efficiency
There is significant potential to improve efficiency in the energy sector, notably by strengthening yet another system of certificates, this one labelled “white”. According to the Energy Efficiency Law, passed in April 2011, energy (electricity, gas and heat) suppliers have to improve efficiency via reducing losses in production, distribution, transmission and the end-use sector. The white certificate programme was eventually established in 2013 to favour enhancement of energy efficiency undertakings (OECD, 2012a; Égert, 2012). The law requires that claimed efficiency gains be subject to energy-savings audits, for which firms will be rewarded with such certificates. If they miss their targets, they have to either purchase white certificates or pay a substitution fee. Though the system is supposed to be the main pillar of energy efficiency improvements, results of the first tender were disappointing: only 1.4 % of the obligation was met using white certificates, the rest being met by payment of the substitution fee (OECD, 2015b).
Poland has made some progress in boosting the energy efficiency of residential buildings. However, energy consumption for space heating has been stable at a high level and represents a larger share of household income than in most OECD countries, even those with similar GDP per capita (Figure 2.30). Energy efficiency remains low due to the continuing use of low-efficiency individual boilers for heating and hot water, coupled with high heat losses because of poor thermal insulation in some buildings (IEA, 2011). Moreover, the exposure of the urban population to air pollution by particulate matter continues to be well above the EU average, and the number of deaths attributable to indoor air pollution from solid fuels is high.
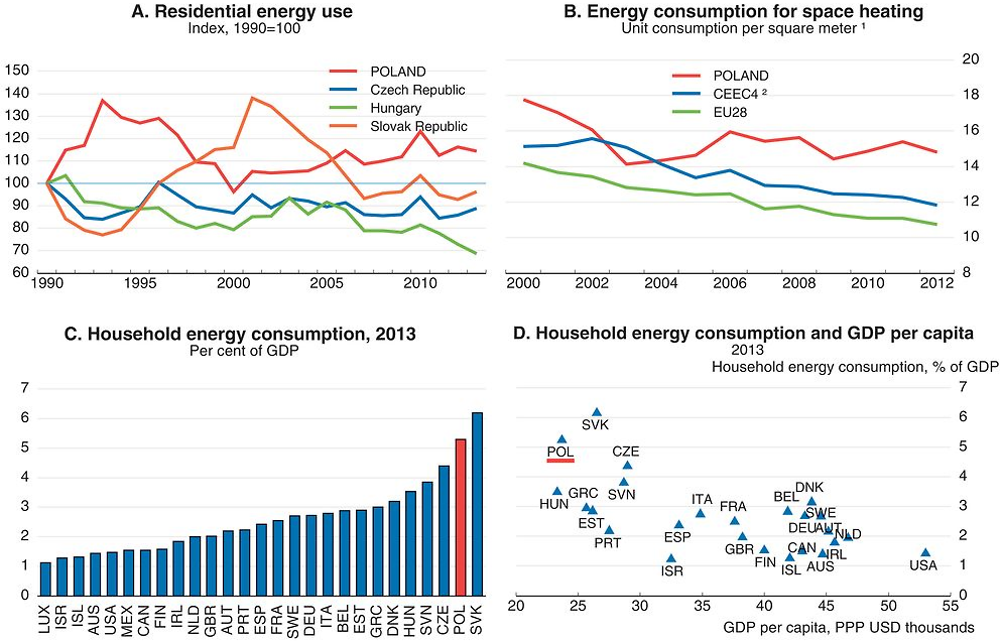
1. Kilograms of oil equivalent per square meter corrected for climatic conditions.
2. Unweighted average of Hungary and the Czech and Slovak Republics. The 2010 value is used in 2011-12 for Hungary.
Source: OECD (2015), Final Consumption Expenditure of Households and National Accounts Database; Eurostat (2015), Final Energy Consumption of the Residential Sector; Odysee-Mure database.
The Thermo-Modernisation Fund, overseen by the Ministry of Infrastructure and Development and managed by BGK, has been the key instrument for thermal improvement investment in existing buildings since 1998 (OECD, 2015b). It has provided subsidised loans mainly to building owners and local governments to renovate apartment buildings and has helped develop energy audit services. Between 2004 and 2013 its subsidies totalled PLN 1.5 billion, but dependence on transfers from the central government budget has led to severe funding fluctuations: for example, no money was received in 2010, and the funds available were divided by three from 2011 to 2012 (BGK, 2014). In 2015, the Fund’s budget was around PLN 300 million (Republic of Poland, 2015). However, besides a lack of sufficient and stable funding, it has been hampered by complexity and the perception of risk, which has put off some commercial banks and potential investors (Rekiel, 2014). Under the 2014-20 EU operational programme “Infrastructure and Environment”, EUR 421 million will be available for housing and public-building insulation, and EUR 150 million for energy efficiency projects in large enterprises. In addition, a new support scheme was implemented by the National Fund for Environmental Protection and Water Management (NFOSiGW) in 2015. It aims to improve the thermo-modernisation of single family houses and has a planned budget of PLN 400 million for 2015-23. The first call for applications is planned in the second quarter of 2016.
In 2013, Poland also implemented a new programme of subsidies for the construction of energy-efficient houses (through NFOSiGW), with a budget of PLN 300 million over 2013-18, through the partial repayment of mortgages (Republic of Poland, 2015). However, only 112 projects (for a total of PLN 2 million) had been committed by June 2015. Ambitious technical conditions required by the programme may appear stringent to households, and the grants are subject to personal income tax, which may limit their attractiveness for investors. As a result, one bank pulled out of the programme in 2015. Besides funding and the regulatory burden, there are many barriers to improve building energy efficiency relating to awareness, information and technical expertise. The 2015 Act on energy performance of buildings aims to increase consumer information by imposing an obligation to conduct an energy performance certification of some buildings. A national plan aimed at increasing the number of low-energy buildings was announced in July 2015, and new technical requirements on the energy performance of buildings were introduced to achieve the objectives of the Directive on the Energy Performance of Buildings (Republic of Poland, 2015).
More generally, smart or intelligent grids and smart meters could allow network operators to modulate electricity demand during peak periods via demand withdrawal. By smoothing daily, weekly and annual peak demand they would also be helpful in lowering GHG emissions related to electricity consumption. This could also increase households’ awareness of their energy consumption, result in reduced energy consumption and increase the energy efficiency of investment. However, investment in such technologies appears lagging, as in other CEECs (European Commission, 2014f; OECD, 2012a), though Poland plans to finish deploying smart grids by 2020 and EUR 150 million have been allocated to this end under the 2014-20 EU operational programme “Infrastructure and Environment” for smart or intelligent grids.
Strengthening the energy regulatory framework and the gas market
Strengthening the regulatory framework would be instrumental in reducing uncertainty and risks and achieving the right price signals for new energy investments. While Poland has made good progress in complying with EU regulations related to the energy sector, the regulatory protection of incumbents, the complexity of regulatory procedures and state involvement in competitive segments of energy markets are far from OECD best practice (OECD, 2014a; Égert and Goujard, 2014). The historical operator (PGE) is still the most dominant player in generation and wholesale electricity supply, and the Treasury is a major shareholder in four of the five main distributors. These four capital groups are indirectly government owned and vertically integrated by ownership with major generators. They are also heavily involved in supplying businesses and households. The sector regulator reckons this to be a regulatory challenge (ERO, 2012). The preponderance of public ownership and the lack of effective ownership separation between electricity producers and distributors may blur the price signal for investment decisions in generation capacity, limit incentives for cost control and curb entrepreneurial dynamism.
The gas market is being liberalised. Gas prices are close to the EU average for firms and households (Figure 2.31). At the end of 2012, a gas exchange was created, and the volume of gas traded on it is increasing. However, despite legal and functional unbundling, improved third-party access and increasing interconnection capacities to neighbouring countries, competition remains weak. Besides the concentration of the wholesale market (see above), PGNiG has a de facto monopoly position in importing, production, distribution and supply, though the imports of gas to Poland by other companies has recently increased (Ministry of Energy, 2015). Moreover, regulated tariffs for final consumers, notably large users, may also lower competitive pressures. Indeed, the European Commission (2013c) has argued that Poland violates EU regulations regarding domestic gas markets by regulating gas prices for users other than households, and the European Court of Justice ruled that Poland was not compliant with the EU Gas Directive in September 2015. In 2013, 78 % of gas supplies were imported under the long-term Yamal contract from Russia (ERO, 2014), and PGNiG was selling gas to consumers at regulated tariffs below the wholesale price of its Russian imports.

1. All taxies and levies included. Price for annual use of 2 778-27 778 MWh.
2. All taxies and levies included. Price in the first semester of 2015 for annual use of 5.6-55.6 MWh.
3. Unweighted average of Hungary and the Czech and Slovak Republics.
Source: Eurostat (2015), Energy Price Statistics.
Poland’s capacity to import gas from other EU countries has risen, but barriers to trade (including import diversification requirements) should be revised. New gas interconnections and expansion of the existing ones with neighbouring countries would ensure a more diversified gas supply. In turn, this could foster the development of renewables in electricity generation capacity by offering temporary peak-load capacity. Poland has improved considerably its interconnections with Germany, and the investment enabling physical reverse flows at the border with Germany was completed in 2014. In 2016, the liquefied natural gas (LNG) terminal in Swinoujscie (owned by Polskie LNG S.A., a subsidiary of the gas transmission operator, OGP Gaz-System S.A.) will allow gas to be imported from Qatar. The gas transmission operator plans further investment in interconnections, notably with the Czech and Slovak Republics and Lithuania, and intends to strengthen the domestic network, in particular by expanding distribution in the West and South.
Strengthening infrastructure strategy and planning
-
Improve the infrastructure selection process: systematically publish cost-benefit analyses (CBAs) with sufficient details; make mandatory independent evaluation for investment projects exceeding a certain amount; bolster the technical quality of CBAs with the creation of a reference centre able to help agencies involved in the analyses.
-
Integrate environmental and health criteria to the evaluation of infrastructure projects. Develop ex post evaluations to identify and promote best practices.
-
Ensure funding for infrastructure investment includes long-term resources for maintenance. Increase incentives for collaboration across levels of government. Develop and regularly update local spatial plans.
-
Improve infrastructure management by reducing the fragmentation of responsibilities across ministries and setting up permanent metropolitan governance institutions.
Enhancing incentives for capital investment
-
Develop and implement clear climate change policies aligned with European and international objectives.
-
Introduce fixed-term, non-renewable mandates for the President of the Competition Authority and all sectoral regulators, during which they cannot be dismissed without fault, and prevent revolving-door opportunities. Pursue privatisation in competitive segments of the economy.
-
Rationalise and standardise purchasing procedures, centralise orders and promote e-procurement take-up, through an integrated national strategy. Bolster local-government capacity by providing central-government technical assistance for large infrastructure projects.
-
Strengthen the anti-corruption framework, by better protecting whistle-blowers. Ensure the full independence of the Central Anticorruption Bureau.
Improving the efficiency of transport infrastructure investment
-
Ensure total independence of the railway infrastructure manager from the operators. Allocate long-term contracts for railway infrastructure management and services based on tenders.
-
Reform arrangements for managing and funding national and local road infrastructure to enhance consistency of decision-making with regard to expenditure and revenue. Allow local governments to design local electronic tolling systems to limit congestion and pollution.
-
Review and revise transport taxes and charges, with a view to better internalising the environmental and health impacts of various transport modes. Set appropriate road prices to help finance new investments.
Getting the right incentives in the energy sector
-
Invest in interconnections with neighbouring countries in the electricity and gas sectors. Install “smart meters” for electricity more widely to improve demand management.
-
Ensure that the new law on renewables, together with the EU-ETS, provides appropriate incentives for investment in new generation capacity. Streamline regulatory procedures for new energy investment projects. Evaluate the need for a capacity market to help finance baseload and peak-load capacity.
-
Monitor the development of the market for “white certificates”. Modify its parameters if needed to ensure it effectively supports energy efficiency investment. Reform the current programme for the construction of energy-efficient houses to ensure a higher take-up.
Bibliography
Abiad, A., D. Furceri and P. Topalova (2015), “The macroeconomic effects of public investment: Evidence from advanced economies”, IMF Working Paper, No. 15/95.
ACER (2015), Opinion of the Agency for the Cooperation of Energy Regulators No. 09/2015, Agency for the Cooperation of Energy Regulators.
Ahrend, R., E. Farchy, I. Kaplanis and A. Lembcke (2014), “What makes cities more productive? Evidence on the role of urban governance from five OECD countries”, OECD Regional Development Working Papers, No. 2014/05, OECD Publishing.
Ahrend, R. and A. Schumann (2014), “Approaches to metropolitan area governance: A country overview”, OECD Regional Development Working Papers, No. 2014/03, OECD Publishing.
BGK (2014), Dane liczbowe Funduszu Termomodernizacji i Remontów, State Development Bank.
Blöchliger, H. and M. Nettley (2015), “Sub-central tax autonomy: 2011 update”, OECD Working Papers on Fiscal Federalism, No. 20, OECD Publishing.
Bougheas, S., P. O. Demetriades, and E. L. W. Morgenroth (1999), “Infrastructure, transport costs and trade”, Journal of International Economics, Vol. 47, No. 1, pp. 169-89.
Braconier, H. and M. Pisu (2013), “Road connectivity and the border effect: Evidence from Europe”, OECD Economics Department Working Papers, No. 1073, OECD Publishing.
Burger, P. and I. Hawkesworth (2011), “How to attain value for money: Comparing PPP and traditional infrastructure public procurement”, OECD Journal on Budgeting, Vol. 2011/1, pp. 1-56, OECD Publishing.
CBA (2013), Anticipated Corruption Threats in Poland, Central Anti-Corruption Bureau.
CEER (2013), CEER Benchmarking Report 5.1 on the Continuity of Electricity Supply, Data update, Council of European Energy Regulators.
CODE2 (2014), Cogeneration Roadmap for Poland, Cogeneration Observatory and Dissemination Europe.
Crist, A, J. Kauppila, J. Vassallo and B. Wlaschin (2013), “Asset management for sustainable road funding”, ITF Discussion Paper, No. 2013-13, International Transport Forum.
Crozet, Y. (2013), “High speed rail performance in France: From appraisal methodologies to ex-post evaluation”, ITF Discussion Paper, No. 2013-26, International Transport Forum.
Decarolis, F. (2014), “Awarding price, contract performance, and bids screening: evidence from procurement auctions”, American Economic Journal: Applied Economics, Vol. 6, No. 1, pp. 108-32.
Della Croce, R. and J. Yermo (2013), “Institutional investors and infrastructure financing”, OECD Working Papers on Finance, Insurance and Private Pensions, No. 36, OECD Publishing.
Eden, M. and A. Kraay (2014), “Crowding in and the returns to government investment in low-income countries”, World Bank Policy Research Working Paper, No. 6781.
EEA (2011), “Revealing the costs of air pollution from industrial facilities in Europe”, European Energy Agency Technical report, No 15/2011, European Environment Agency.
EEA (2013), Trends and Projections in Europe 2013: Tracking Progress towards Europe’s Climate and Energy Targets until 2020, European Environment Agency.
Égert, B. (2009), “Infrastructure investment in network industries: The role of incentive regulation and regulatory independence”, OECD Economics Department Working Papers, No. 688, OECD Publishing.
Égert, B. (2012), “Climate change policies in Poland: Minimising abatement costs”, OECD Economics Department Working Papers, No. 953, OECD Publishing.
Égert, B. and A. Goujard (2014), “Strengthening competition in Poland”, OECD Economics Department Working Papers, No. 1125, OECD Publishing.
EIB (2014), 2014-2020 JESSICA Evaluation Study for Nine Polish Regions: Kujawsko-Pomorskie, Łódzkie, Lubelskie, Małopolskie, Mazowieckie, Śląskie, Świętokrzyskie, Wielkopolskie, Zachodniopomorskie, European Investment Bank.
Escresa, L. and L. Picci (2015), “A new cross-national measure of corruption”, World Bank Economic Review, 24 July.
EPEC (2012), Poznan Waste-to-Energy Project, Poland, Using EU Funds in PPPs Case Study, European PPP Expertise Centre.
EPEC (2014), Establishing and Reforming PPP Units Analysis of EPEC Member PPP Units and Lessons Learnt, European PPP Expertise Centre.
ERO (2012), National Report 2012, The President of the Energy Regulatory Office in Poland.
ERO (2014), National Report 2014, The President of the Energy Regulatory Office in Poland.
ERO (2015), National Report 2015, The President of the Energy Regulatory Office in Poland.
European Commission (2012), Expert Evaluation Network Delivering Policy Analysis on the Performance of Cohesion policy 2007-13, Year 2 – 2012, Task 2: Country Report on Achievements of Cohesion policy Poland, Brussels.
European Commission (2013a), Impact Assessment Accompanying the documents Proposal for a Regulation of the European Parliament and of the Council Amending Regulation (EC) No 1370/2007 Concerning the Opening of the Market for Domestic Passenger Transport Services by Rail, Brussels.
European Commission (2013b), “Renewable Energy: Commission refers Poland and Cyprus to Court for failing to transpose EU rules”, European Commission Press Release, No. 13-259.
European Commission (2013c), Internal Gas Market: the Commission takes Poland to Court over Regulated Gas Prices for Business Consumers, Brussels.
European Commission (2014a), Summary of the Partnership Agreement for Poland, 2014-2020, Brussels.
European Commission (2014b), 2014 SBA Factsheet Poland, Brussels.
European Commission (2014c), Poland, Annex to the EU Anti-Corruption Report, Brussels.
European Commission (2014d), Fourth Report on Monitoring Development of the Rail Market, Brussels.
European Commission (2014e), “Infrastructure in the EU: developments and impact on growth”, European Economy Occasional Paper, No. 203.
European Commission (2014f), Smart Grid Projects Outlook 2014, Brussels.
European Commission (2015a), “Commission refers Poland to the Court of Justice of the EU over poor air quality”, European Commission – Press release, No. 15-6265.
European Commission (2015b), “Achieving the 10% electricity interconnection target – Making Europe’s electricity grid fit for 2020”, Energy Union Package – Communication from the Commission to the European Parliament and Council, COM(2015) 82 final.
European Commission (2015c), “Country report Poland 2015”, Commission Staff Working Document, COM(2015) 85 final.
European Commission (2015d), OP Digital Poland, Brussels.
European Commission (2015e), Single Market Scoreboard – Public Procurement, Brussels.
European Commission (2015f), More than €82 million from the EU Cohesion Fund to Improve Waste Management in the City of Poznań, Brussels.
European Commission (2015g), “Investment plan for Europe: Poland will contribute €8 billion”, European Commission – Press release, No. 15-4818.
European Commission (2015h), “Greenhouse gas emissions: Creation of a market stability reserve approved”, European Commission Press Release, No. 666/15.656/15.
European Court of Auditors (2014), “EU-funded airport infrastructures: Poor value for money”, Special Report of the European Court of Auditors, No. 21.
European Court of Justice (2013), Judgment of the Court (First Chamber) of 30 May 2013 – European Commission v Republic of Poland (Case C-512/10), ECLI:EU:C:2013:338.
Eurostat (2015a), National Accounts Aggregates by Industry, Kirchberg, Luxembourg.
Eurostat (2015b), Modal Split of Inland Freight Transport, Kirchberg, Luxembourg.
EWEA (2010), Wind Barriers: Administrative and Grid Access Barriers To Wind Power, European Wind Energy Association.
GUS (2011), Road Transport in Poland 2005-2009, Central Statistical Office of Poland.
GUS (2015a), Time Use Survey 2013, Central Statistical Office of Poland.
GUS (2015b), Road Transport in Poland in the years 2012, 2013, Central Statistical Office of Poland.
Halleux, J-M., S. Marcinczak and E. van der Krabben (2012), “The adaptive efficiency of land use planning measured by the control of urban sprawl. The cases of the Netherlands, Belgium and Poland”, Land Use Policy, No.29, pp. 887-898.
Harding, M. (2014), “The diesel differential: Differences in the tax treatment of gasoline and diesel for road use”, OECD Taxation Working Paper, No. 21, OECD Publishing.
IEA (2011), Energy Policies of IEA Countries: Poland 2011 Review, IEA/OECD, OECD Publishing.
IMF (2015), Making Public Investment More Efficient, International Monetary Fund.
ITF (2013), Road Taxation Database, OECD Publishing.
ITF (2014), Major Transport Infrastructure Projects and Economic Development, OECD Publishing.
ITF (2015), “Port investment and container shipping markets”, ITF Round Tables, No. 157, OECD Publishing.
Kierzenkowski, R. (2008), “Bridging the housing gap in Poland”, OECD Economics Department Working Papers, No. 639, OECD Publishing.
Krajewska M., S. Źróbek and M. Šubic-Kovač (2014), “The role of spatial planning in the investment process in Poland and Slovenia”, Real Estate Management and Valuation, Vol. 22, No. 2, pp. 52-66.
Laursen, T. and B. Myers (2009), “Public investment management in the new EU member states”, World Bank Working Paper, No. 161.
Ministry of Economy (2010), National Renewable Action Plan, Warsaw.
Ministry of Economy (2012), Report Evaluating Progress Towards Increasing the Share of High-Efficiency Cogeneration in the Total Annual Production of Electricity in Poland, Warsaw.
Ministry of Economy (2015a), Polityki energetycznej Polski do 2050 roku, Warsaw.
Ministry of Economy (2015b), Raport PPP, Warsaw.
Ministry of Energy (2015), Sprawozdania z wyników monitorowania bezpieczeństwa dostaw paliw gazowych za okres od dnia 1 stycznia 2014 r. do dnia 31 grudnia 2014 r., Ministertwo Energii.
Ministry of Infrastructure (2011), Programu Budowy Dróg Krajowych na lata 2011-2015, Warsaw.
Ministry of Infrastructure and Development (2013), Post py w realizacji Narodowej Strategii Spójno ci 2007-13 – stan na 29 grudnia 2013 r, Warsaw.
Ministry of Infrastructure and Development (2014), Budownictwa i Gospodarki Morskiej, Strategia rozwoju transportu do 2020 roku (z perspektywą do 2030 roku), Warsaw.
Ministry of Infrastructure and Development (2015a), Project National Roads Construction Programme for the years 2014-23 (with a view to 2025), Warsaw.
Ministry of Infrastructure and Development (2015b), National Railway Programme for 2023, Warsaw.
Ministry of Interior (2014), Rządowy Program Przeciwdziałania Korupcji na lata 2014-2019, Warsaw.
Ministry of Regional Development (2012), Koncepcja Przestrzennego Zagospodarowania Kraju 2030, Warsaw.
NEA/IEA/OECD (2015), Projected Costs of Generating Electricity 2015, OECD Publishing.
NIK (2012a), NIK on the Conditions of Seaports’ Development, Supreme Audit Office, Warsaw.
NIK (2012b), NIK on Renewable Energy Sources, Supreme Audit Office, Warsaw.
NIK (2013), NIK on Infrastructure Investments of PKP PLK SA, Supreme Audit Office, Warsaw.
NIK (2014a), NIK about Wind Farms, Supreme Audit Office, Warsaw.
NIK (2014b), NIK about Local Roads, Supreme Audit Office, Warsaw.
NIK (2014c), NIK on Inland Shipping, Supreme Audit Office, Warsaw.
NIK (2015a), NIK on Public Procurements, Supreme Audit Office, Warsaw.
NIK (2015b), NIK on Road Maintenance and Repairs, Supreme Audit Office, Warsaw.
NIK (2015c), NIK o funkcjonowaniu grupy kapitałowej PKP, Supreme Audit Office, Warsaw.
NIK (2015d), NIK o budowie lotniska w Modlinie, Supreme Audit Office, Warsaw.
OECD (2010), OECD Information Technology Outlook, OECD Publishing, https://doi.org/ 10.1787/it_outlook-2010-en.
OECD (2011a), OECD Urban Policy Reviews Poland, OECD Publishing, https://doi.org/ 10.1787/9789264097834-en.
OECD (2011b), Economic Survey of Sweden, OECD Publishing, https://doi.org/10.1787/eco_surveys-swe-2011-en.
OECD (2012a), OECD Economic Surveys: Poland 2010, OECD Publishing, https://doi.org/10.1787/eco_surveys-pol-2010-en.
OECD (2012b), Recommendation of the Council on Principles for Public Governance of Public-Private Partnerships, OECD Publishing.
OECD (2013a), Poland: Implementing Strategic-State Capability, OECD Public Governance Reviews, OECD Publishing, https://doi.org/10.1787/9789264201811-en.
OECD (2013b), OECD Regions at a Glance 2013, OECD Publishing, https://doi.org/10.1787/reg_glance-2013-en.
OECD (2013c), “Recent developments in rail transportation services”, OECD Policy Roundtables, DAF/COMP(2013)24, OECD Publishing.
OECD (2014a), OECD Economic Surveys: Poland 2014, OECD Publishing, https://doi.org/ 10.1787/eco_surveys-pol-2014-en.
OECD (2014b), How Was Life?: Global Well-Being Since 1820, OECD Publishing, https://doi.org/ 10.1787/9789264214262-en.
OECD (2014c), How’s Life in Your Region? Measuring Regional and Local Well-being for Policy Making, OECD Publishing, https://doi.org/10.1787/9789264217416-en.
OECD (2014d), OECD Recommendation of the Council on Public Procurement, OECD Publishing.
OECD (2015a), “Lifting investment for higher sustainable growth”, in OECD Economic Outlook, Vol. 2015/1, OECD Publishing, https://doi.org/10.1787/eco_outlook-v2015-1-en.
OECD (2015b), OECD Environmental Performance Reviews, Poland 2015, OECD Publishing.
OECD, (2015c), Strategic Expenditure Reviews, Overview of Housing Policy Interventions in Poland, GOV/RDPC/URB/RD(2015)2, OECD Publishing.
OECD (2015d), OECD Regulatory Policy Outlook 2015, OECD publishing, https://doi.org/10.1787/9789264238770-en.
OECD (2015e), Government at a Glance 2015, OECD Publishing, https://doi.org/10.1787/gov_glance-2015-en.
OECD (2015f), Fostering Infrastructure Investment: Lessons Learned from OECD Investment Policy Reviews, OECD Publishing.
OECD (2015g), OECD Guidelines on Corporate Governance of State-Owned Enterprises, OECD Publishing, https://doi.org/10.1787/9789264009431-10-en.
PAP (2016), “W niektórych państwowych firmach prezesa wskazywać będzie szef MSP”, 7 January 2016, Polish Press Agency.
PSE (2015), Konsultacje projektu Planu rozwoju w zakresie zaspokojenia obecnego i przyszłego zapotrzebowania na energię elektryczną na lata 2016-2025, Polskie Sieci Elektroenergetyczne.
Public Procurement Office (2015), Report on Functioning of Public Procurement System in 2014, Urząd Zamówień Publicznych.
Rekiel, M. (2014), “Thermo-modernization program in Poland”, Presentation made at the 2nd Workshop on Energy Efficiency in Buildings, 15-16 May, Energy Community Secretariat, Vienna.
Republic of Poland (2015), National Reform Programme 2020, Update 2015/2016, Council of Ministers.
Rostowski, A. (2009), “Public investment, transport infrastructure and growth in Poland”, European Commission Country Focus, No. 11.
Sutherland, D., S. Araujo, B. Égert and T. Koźluk (2009), “Infrastructure investment: Links to growth and the role of public policies,” OECD Economics Department Working Papers, No. 686, OECD Publishing, https://doi.org/ 10.1787/225678178357-en.
UTK (2014), An Assessment of Rail Market Operations and Rail Traffic Safety in 2013, Urzad Tranportu Kolejowego.
UTK (2015a), Kolejowe przewozy pasażerskie w Polsce – dane kwartalne, Urzad Tranportu Kolejowego.
UTK (2015b), Liczne nieprawidłowości w procesie utrzymania sieci trakcyjnej – Prezes UTK stwierdził naruszenie przepisów przez PKP PLK na linii nr 151 Kędzierzyn-Koźle – Chałupki, Urzad Tranportu Kolejowego.
Veneri, P. (2015), “Urban spatial structure in OECD cities: Is urban population decentralising or clustering?”, OECD Regional Development Working Papers, No. 2015/13, OECD Publishing, https://doi.org/10.1787/5js3d834r3q7-en.
ViaToll, (2015), New Roads in the viaTOLL System, 24-06-2015.
World Bank (2011), “Poland, Transport Policy Note: Toward a sustainable land transport sector”, World Bank Report, No. 59715-PL.
World Bank (2014), Connecting to Compete 2014: Trade Logistics in the Global Economy, The World Bank.
World Bank (2015), Doing Business 2016: Measuring Regulatory Quality and Efficiency, The World Bank.