Chapter 2. Boosting skills for all1
Strong and adequate skills are essential to support workers’ productivity and to ensure robust employment outcomes. Developing workers’ skills would also increase their personal satisfaction and wages, contributing in making growth more inclusive. The Netherlands performs well in terms of competences of a large part of the population. Moreover, the country has been successful in adjusting the required level of skills over time. The education system plays a key role in developing skills and achieves good results, but there is room to make vocational education and lifelong learning less job-specific to better adapt to new economic trends. There is scope to use more effectively existing skills at work of youth entering the labour market and entrepreneurs, and to reduce labour market mismatches. Another challenge is to help some people to acquire skills by facilitating their labour market integration – in particular first- and second-generation immigrants, long-term unemployed, and people with low educational attainment and health problems –, which requires stronger targeted active labour market policies.
Skills (or competences) are an important determinant of employment and productivity. People acquire, use and maintain or lose skills over their whole life span. Skills are a bundle of knowledge, attributes and capacities that can be learned and extended through formal and informal learning, and that enable individuals to successfully perform an activity or task (OECD, 2012a). Therefore, qualification/diplomas attained or the number of years of formal education and training are only an approximation of skills. People need both cognitive skills (such as literacy, numeracy, and science) and non-cognitive skills (such as collaboration, communication or entrepreneurship).
Skills in the Netherlands
Snapshot on today’s skills
Many Dutch adults have robust skills, as measured by the results of the OECD Programme for the International Assessment of Adult Competencies (PIAAC) (OECD, 2013a). Young adults aged 16 to 24 have among the highest average proficiency scores for cognitive skills among the countries that participated in PIAAC. Dutch adults aged between 16 and 65 also have above-average skills in the OECD, with almost 20% reaching the two highest levels of proficiency (Level 4 or 5) in literacy and numeracy, and nearly 40% being proficient at the mid-level (Level 3).
Despite progress achieved, the skills of some people are lagging behind. First-generation immigrants and those with less than upper secondary education have literacy skill levels which are significantly lower than those of natives and tertiary education graduates (Figure 2.1). As some countries focus their immigration policies on skills of new migrants, this reduces comparability, but second-generation immigrants also have lower proficiency levels and are the only group with a score below the OECD PIAAC average, which is an important challenge for education and skill policies. Literacy proficiency of youth is significantly higher than that of the old, who also have lower skills relative to peers in top OECD performers.
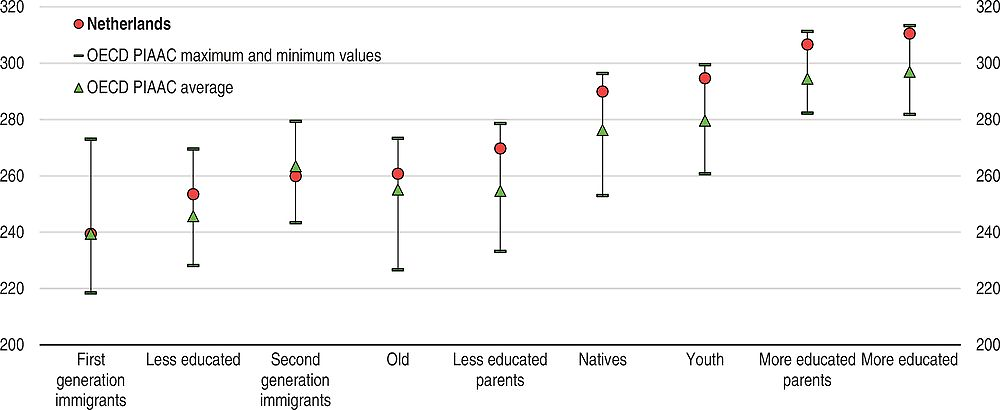
← 1. The estimates show the means for each socio-demographic group. Youth: 16-24 year-olds; Old: 55-65 year-olds; Natives: native-born and native language; First-generation immigrants: foreign-born and foreign language; Second-generation immigrants: native-born and foreign language; More educated: tertiary education; Less educated: less than upper secondary education; More educated parents: at least one parent attained tertiary education; Less educated parents: neither parent attained upper secondary education. 22 OECD countries participated in the OECD Programme for the International Assessment of Adult Competencies (PIAAC).
Source: OECD (2013), OECD Skills Outlook 2013: First Results from the Survey of Adult Skills.
Expected trends in occupations and qualifications
Between the mid-1990s and 2010, the Dutch labour market was affected by a polarisation in occupations depending on the content of tasks (Figure 2.2), although its magnitude is smaller than in other countries (Van den Berge and ter Weel, 2015). However, labour market polarisation is underway in many other leading OECD countries and is mainly driven by technological changes (Autor and Dorn, 2013; OECD, 2015a). The demand rose for skills needed to perform abstract tasks (problem-solving, intuition, persuasion and creativity, in occupations such as law, medicine, science or engineering) and for skills necessary to do non-routine manual tasks (requiring adaptability, visual and language recognition, and personal interactions in services occupations such as personal health assistance or security). Both expanded before the global downturn and have been somewhat resilient since then (Figure 2.2). Conversely, the demand was subdued for skills crucial to execute routine tasks (based on well-understood procedures such as book-keeping, clerical and administrative work, repetitive production or monitoring) before 2008 and has been hit heavily by the global downturn (Figure 2.2). Demand could fall further as routine tasks are replaced by robots or outsourced to developing countries. However, the polarisation of the labour market is unlikely to continue indefinitely, with some middle-skilled jobs that combine job-specific and generic skills being likely to persist in the coming decades (Autor, 2015).
To adjust to the challenge of a more versatile labour demand, the Netherlands’ labour force has been steadily becoming more qualified over time. Between 2005 and 2013, medium-level qualifications fell by 2 percentage points and low-level qualifications declined by almost 4 percentage points, but high-level qualifications increased by 5 percentage points. In 2005, 30% of the labour force was highly educated and this proportion was nearly 5 percentage points higher than in the European Union (CEDEFOP, 2015). In 2013, 35% of Dutch workers had high-level qualifications, 40% had medium-level qualifications and nearly 25% had low-level qualifications.
Looking ahead, experts concur that the Netherlands will require more high-level qualifications, which are projected to reach about 45% of the labour force in 2025, 7 percentage points more than in the European Union (CEDEFOP, 2015; ROA, 2011). In parallel, medium-level qualifications are projected to shrink by nearly 4 percentage points and low-level qualifications by around 6 percentage points. Among jobs to be created between 2013 and 2025, one in three will be for professionals in science, engineering, healthcare, business and teaching; one in ten for managers; one in ten for technicians and associate professionals; and one in six for service and sales workers. In parallel, the proportion of medium- and low-level qualifications will decline further, with job openings increasing by less than implied by replacement needs. In terms of sectors, future employment growth is expected in business and other services, and the distribution and transport sectors; jobs prospects should be weaker but remain positive for the primary and construction sectors; however, manufacturing jobs should continue to fall.
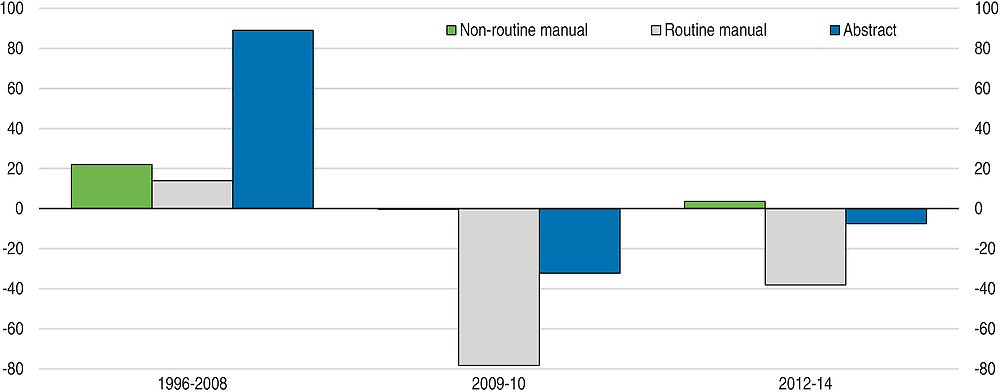
← 1. Refers to population aged between 15 and 64. Abstract tasks refer to problem-solving, intuition, persuasion and creativity. Occupations attached to abstract tasks include managers, professionals, technicians and associate professionals. Routine manual tasks refer to well-understood procedures such as book-keeping, clerical and administrative work, repetitive production or monitoring. Occupations attached to routine tasks include clerical support workers, craft and related trades workers and plant and machine operators and assemblers. Although plant and machine operators and assemblers also include occupations such as drivers that should be classified as non-routine manual occupations, it is classified under routine manual occupations due to lack of data at 2-digit levels. Non-routine manual tasks refer to those requiring adaptability, visual and language recognition, and personal interactions. Occupations attached to non-routine tasks include service and sales workers. Occupations such as skilled agricultural, forestry and fishery workers, elementary occupations, armed forces occupations and those with no responses are not included. There is a structural break in the data due to change in classification in 2010/11. ISCO 08 classification 1-digit level.
Source: Eurostat (2015), Employment and unemployment (Labour Force Survey) (database), October.
Incidence of labour market mismatches
There are several types of mismatches, which can affect skills, qualifications, and/or field of study. Skill mismatches measure the level of actual skills relative to that needed in a specific job. Qualification mismatches occur when workers have a different level of qualification than required by the job. Field-of-study mismatches appear when workers are trained in a field but are working in another one. According to the PIAAC survey, the incidence of total labour market mismatch in the Netherlands is about 45%, which is high in absolute terms but is comparatively one of the lowest percentages in the OECD (OECD, 2015b).
Skill mismatches are among the lowest in the OECD. According to the PIAAC survey, around 90% of workers are well matched for each literacy and numeracy skills, which is close to 5 percentage points higher than the OECD average. This is a strong performance given the fact that skill mismatches can be temporary at an individual level, for instance as it may take time for a worker to find a job that fits his skills, but then part of the skill mismatches can be persistent at the aggregate level. One empirical estimate suggests that reducing skill mismatches to the best practice level would boost aggregate productivity by around 4% in the Netherlands (Adalet McGowan et al., 2015).
Some Dutch workers are affected by under-qualification, which requires upskilling. Under-qualified workers may have the skills required at work, but there is a risk that this may result from employers’ lowering the job content rather than being successful in identifying employees’ real skills. According to the PIAAC survey, a third of Dutch workers are mismatched by qualifications, close to the OECD average, but there is large heterogeneity. Over-qualification is the second-lowest in the OECD after Italy, with 15% of workers reporting to underuse their skills, but such workers face a large wage penalty in the Netherlands (Montt, 2015). Just below 20% of workers are under-qualified, that is report having lower qualifications then required by their jobs, which is the third-highest percentage in the OECD after Italy and Sweden.
Developing skills at school
To support access to the labour market, a well performing education system should combine robust quality, efficiency and equity, with the latter associating high fairness and inclusiveness. High quality and efficiency are essential to sustain strong growth in innovation-driven economies such as the Dutch one. High fairness means students are able to achieve their educational potential irrespective of their background. Insufficient fairness might result in school failure, leading to increased dropout rates. An equitable education system should also be inclusive by giving everyone a chance to get at least the minimum level of skills necessary to function well in the society. Insufficient inclusiveness of the education system might result in lower labour market attachment, resulting in weaker economic growth.
To reduce the risk of different forms of mismatches, it is important to address the discrepancy between student choices and the demand for skills. While allowing students certain flexibility in choosing the programme according to their preferences, their choices need to correspond to current and future employers’ needs. Targeted grants for students who learn in areas of skills shortage or a provision of workplace training can support the balance of skills’ supply and demand. However, it is also essential for the education system to equip workers with general skills, ensuring flexibility needed to adapt job-specific skills to changing demand, in particular in vocational programmes. Results of the PIAAC survey indicate that Dutch workers in high-skilled clerical occupations are more affected by structural changes in their workplace and report more frequently new ways of working than in the OECD (OECD, 2013a).
Making compulsory education more equitable in imparting basic skills
Early childhood education and care (ECEC) increases academic achievement later (OECD, 2014a). In the Netherlands, nearly all children participate in ECEC from age 4 at the latest. However, there remains important scope for improving the pedagogical and educational quality of ECEC before age 4, which is a key priority (OECD, 2016). Moving towards an integrated system of pre-schools and childcare with a unified program would support quality and equity, and facilitate children’s transition into primary education. Better ECEC would also help disadvantaged children to close the gap with the others, and would help immigrant children to improve language proficiency, in particular second-generation immigrants. As a result, skill gaps for immigrant students could narrow. Extending the opening hours of ECEC facilities would also expand the possibilities for those who care for children at home, who are overwhelmingly women, to work full time.
The overall quality and equity of the Dutch education system are good. According to the latest 2012 Programme for International Student Assessment (PISA) test, the mean performance of students places the Netherlands among top ten OECD achievers in terms of reading and science, and in top five in mathematics (OECD, 2013b). However, Dutch students perform less well in problem solving relative to countries with similar scores in mathematics, reading and science (Figure 2.3). The proportion of resilient students – who are socio-economically disadvantaged but perform among the top 25% of students, after accounting for socio-economic status – is comparatively high at around 8.5%, against the OECD average of 6.5%. Social mixing exists, as a higher percentage of disadvantaged students attend schools with students from better-off backgrounds than the OECD average (OECD, 2012b). Also, disadvantaged Dutch schools have a lower average student-teacher ratio than advantaged ones and additional funds are allocated to disadvantaged schools.
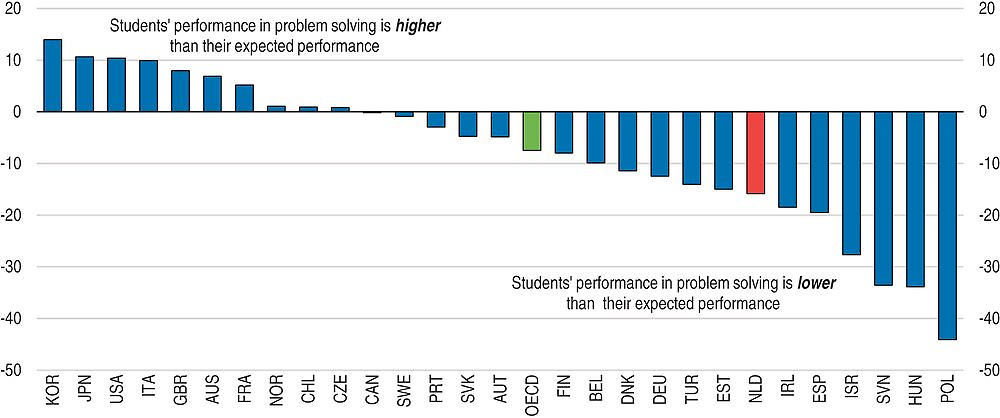
← 1. Each student’s expected performance is estimated, using a regression model, as the predicted performance in problem solving given his or her score in mathematics, reading and science. Thus, this figure shows a ranking of countries in relative performance by comparing students from each country with students in other countries who have similar scores in mathematics, reading and science. Differences are not statistically significant for France, Norway, Chile, Czech Republic, Canada, Sweden, Portugal, Slovak Republic and Austria.
Source: OECD (2013), PISA 2012 Database.
Despite notable policy efforts, there is scope to ensure greater equity in education by increasing teacher quality in schools with higher proportions of disadvantaged students (so-called disadvantaged schools). The proportion of teachers with university (Master) degree is just below 15% in disadvantaged schools as compared to 50% in advantaged schools, which is one of the largest gaps in the OECD (OECD, 2013b). The government has been working towards improving teacher education and employment conditions, and addressing shortages of teachers’ qualifications for languages, mathematics and sciences (European Commission, 2015), which is welcome and should continue. In particular, further improving the career structure of teachers by providing them greater opportunities for personal development and career advancement is important (Nusche et al., 2014; OECD, 2016).
Teachers are less well paid compared to the OECD average when considering earning of tertiary-educated workers as a benchmark (Figure 2.4), although the maximum possible salary is one of the highest in the OECD (OECD, 2014b). Wages increase with experience, but they are not differentiated according to the type of school (Bonhomme et al., 2012). While general wage increases would be costly, the authorities could consider raising wages of teachers who upgrade their skills. Training teachers, who report having difficulties in personalizing their teaching, to work with students with disadvantaged backgrounds and reflecting such skills in their relative wages would help to attract more qualified teachers (OECD, 2015c), in particular to disadvantaged schools. School boards, which are allowed to differentiate teachers’ wages, could play an instrumental role in this respect.
← 1. 2011 for Canada, Chile, Ireland, New Zealand, Portugal, Spain and Sweden. Teachers’ salaries either refer to actual salary, including bonuses and allowances, for teachers aged 25-64 or to statutory salary after 15 years of experience and minimum training. Figure for Belgium is calculated as the unweighted average of the data for the Flemish and French Communities of Belgium. Data for the United Kingdom refers to England.
Source: OECD (2014), Education at a Glance 2014.
Increasing student mobility between tracks and raising minimum educational standards would enhance student performance more widely. Tracking and streaming of students at age of 12 used to be based on the advice of the primary school and on a comprehensive test (Cito test) (OECD, 2015d), but the school’s opinion based on teacher’s qualitative assessment has recently taken precedence over the test results. Early tracking is positive for talented pupils. However, selection weakens performance of students assigned to follow inadequate tracks, especially if subsequent mobility between tracks is not good (OECD, 2016). Ensuring high minimum curricular standards in all tracks, corroborated by regular performance assessment (such as the partially implemented Rekentoets test to ensure basic knowledge in mathematics at the end of high school), would improve skills. In parallel, greater curriculum alignment and differentiated teaching would support upward mobility between secondary tracks, helping to shift students to more appropriate tracks (OECD, 2016).
The school system should be more inclusive in equipping immigrant students with generic skills. Dutch native students perform considerably better in the PISA mathematics tests than immigrant students, even after accounting for the socio-economic background (OECD, 2013b). The skills gap persists even when comparing the results of native and second-generation immigrant students (Figure 2.5). Immigrants’ children are overrepresented in disadvantaged schools, which has a detrimental effect on their achievements (OECD, 2013b). In addition, there is a high degree of school competition, which may result in worse outcomes as socio-economically disadvantaged immigrant parents are less likely to benefit from greater choice (OECD, 2012c). Although access to all relevant information regarding school choice is publicly available in the Netherlands, immigrant parents may be impeded to send their children to the most appropriate school because of language barriers, resource constraints, or the lack of knowledge of the Dutch school system (OECD, 2015c). Assisting parents of immigrant students would help families to make well informed decisions on school choice.
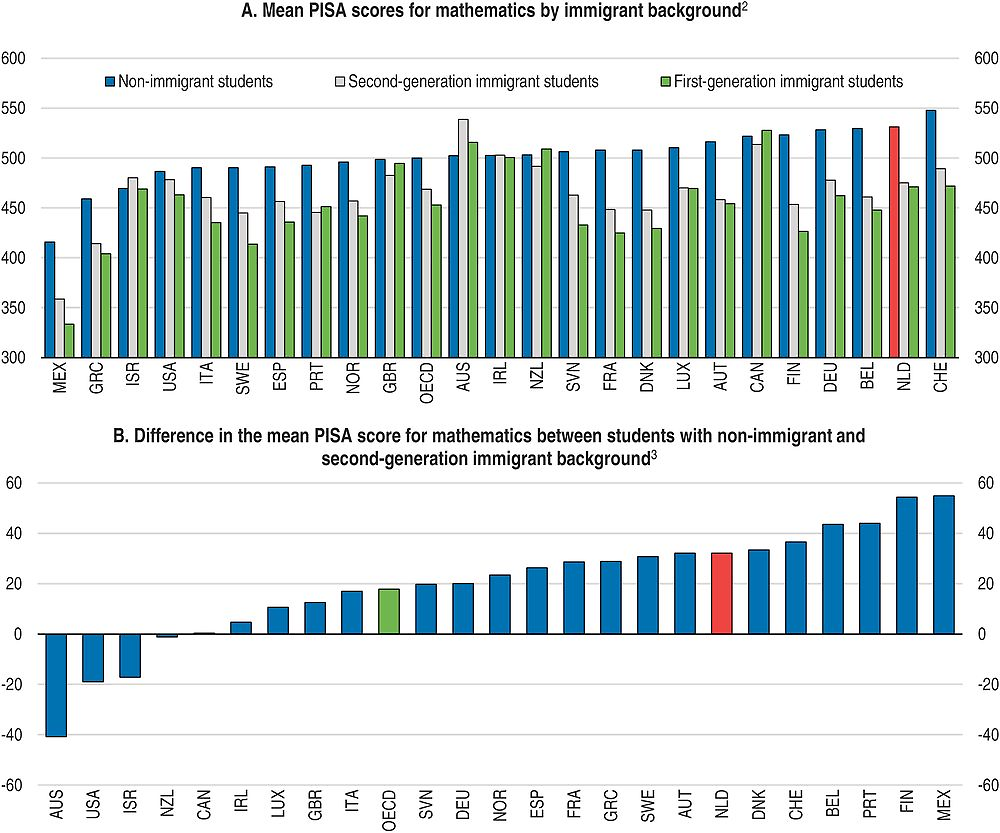
← 1. First-generation immigrant students refer to foreign-born students. Second-generation immigrant students refer to native-born students with foreign born parents.
2. Countries are ranked in ascending order of the mean PISA scores of non-immigrant students.
3. After adjusting for students’ socio-economic status. Differences for Canada, Ireland and New Zealand are not statistically significant. The larger the difference in mean PISA scores for mathematics between students with non-immigrant and second-generation immigrant background, the less successful second-generation students are in closing the gap with native students.
Source: OECD (2013), PISA 2012 Database.
Early exposure to the Dutch language would help to develop immigrants’ language skills, in particular when starting at an early age. The lack of basic literacy proficiency is not only holding back foreign-born students, but also those immigrant children who were born in the Netherlands. Evidence suggests that early childhood education and care (ECEC) has a highly beneficial impact on language proficiency and on basic education outcomes of children with a lower educated immigrant family background (OECD, 2014c). The Netherlands is among top OECD performers regarding the attendance rate of immigrant children in ECEC, but the rate is below the one for natives (OECD, 2015e). Introducing universal language diagnostic tests and providing support in pre-school education, as in Austria and Germany, would be additional options (OECD, 2014c).
Ensuring stronger formation of generic and higher skills by vocational education and training
Vocational education and training (VET) is well developed partly owing to early tracking, but its perceived image and quality is relatively low (Figure 2.6), and a better balance is needed between imparting practical and generic skills. Occupational skills are essential to facilitate entry into the labour market, yet key information-processing skills help in updating one’s skills, changing jobs and retraining. Nearly 70% of Dutch students enrolled in upper-secondary education follow vocational programmes, among the highest rates in the OECD (OECD, 2014b). The absolute performance of vocational education is strong according to the PIAAC survey, with the mean literacy and numeracy proficiency scores for adults aged between 16 and 29 significantly above the OECD mean for the same group (OECD, 2013a).
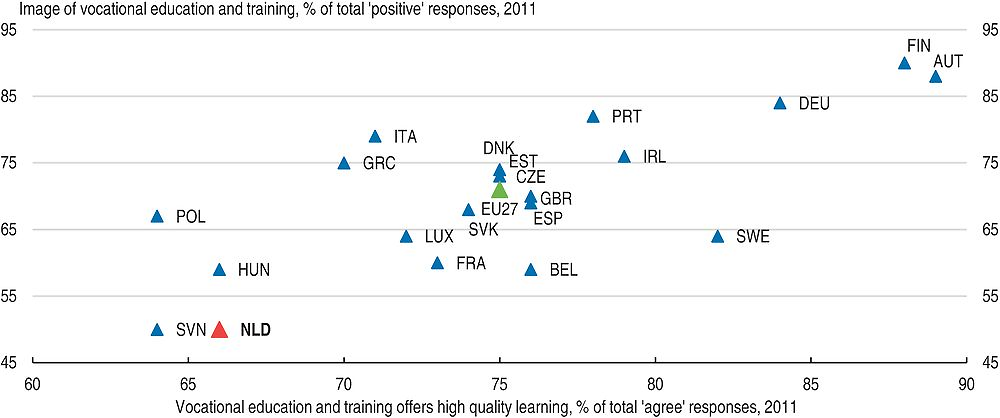
Source: European Commission (2011), “Attitudes towards vocational education and training”, Special Eurobarometer, No. 369, September.
Despite a robust VET system, the performance gap to general upper secondary education for graduates aged 16 to 29 is the highest for numeracy proficiency among OECD countries with PIAAC results, and the second-highest for literacy proficiency (after Germany). Moreover, VET graduates at or below the 25th percentile are not able to understand and respond to dense and lengthy texts, and to process less explicit mathematical information, i.e. they are at or below mid-level (Level 3) and 5% score at the lowest competence level. By contrast, young Dutch adults with the same position in the skill distribution, but who have completed a programme with general orientation, do not face similar problems (OECD, 2013a). Stronger emphasis on the development of generic skills in vocational tracks, without undermining the development of professional skills, would allow greater mobility across jobs over workers’ professional life, especially if demand for more complex skills continues to rise over time.
Greater emphasis on the development and the quality of post-secondary VET qualifications would allow students to acquire higher level skills. Despite rising enrolment rates, there are few options available to Dutch students to continue education beyond upper-secondary VET other than tertiary education (OECD, 2014d). Work-related private courses aim to fill this gap in provision, but they have an insufficient visibility and often focus on specific needs of one employer. Yet, technological progress is likely to continue to raise demand for more complex skills. Strengthening the quality and the range of postsecondary VET, as done by other OECD countries, would help match the trend of rising demand for medium- and higher-level qualifications, which are projected to reach 82.5% of the labour force in 2025, against less than 80% today (CEDEFOP, 2015). The authorities have been making progress in this direction, notably by developing a system of certifications, and they also announced the creation of new post-secondary VET programmes in October 2014.
There is also scope to improve the provision of skills within the current VET system. The lowest level of upper-secondary VET (MBO 1) has a high incidence of young people with disadvantaged background, who face difficulties to enter the labour market, although the programme does not intend to lead to a labour market qualification. Creating a single pre-vocational education programme at lower secondary level and making MBO 1 the main entry route into higher VET programmes would facilitate the integration of students from disadvantaged background, and improve the overall reputation of the VET system (OECD, 2014d). Another issue is to continue updating the skills of VET teachers and trainers, which could be addressed through regular industry placements integrated into teachers’ careers and by facilitating the entry of industry practitioners into the teaching staff (currently limited by requirements to have an academic qualification) (OECD, 2014d).
Developing advanced skills
The strong results of the PIAAC survey indicate that high quality education system is successful in transferring advanced skills (OECD, 2013a). Young adults aged 16 to 29 who have acquired academically-oriented qualifications have outstanding information-processing skills, well above the OECD average, with one in two recent graduates having the proficiency Level 4 or higher. These results are positively correlated with the above-average results of different editions of the PISA test. Moreover, the Netherlands is one of the three leading OECD countries (along with Norway and Sweden) where only less than 7% of 16-65 year olds do not have basic skills to use information and communication technology (ICT).
Over the last twenty years, tertiary education has expanded considerably giving solid foundations to the build-up of skills, but the system should also develop courses aimed to raise non-cognitive skills. Good command of cognitive skills enables workers to perform better on their jobs, however many employers value equally workers’ ability to analyse, evaluate and synthesise information, instead of simply learning facts and concepts. Complex judgmental skills such as critical thinking and problem solving are valuable because they enable employees to apply their knowledge in new situations and environments. Results of the PIAAC survey for Dutch workers aged 16-29 suggest that they use their problem-solving skills, as well as co-operation, self-organisation and learning at work less frequently than their peers in other OECD countries (OECD, 2013a). The authorities have recently published a strategic agenda for higher education and research over the next decade, in which they acknowledge that the current system is too focused on the acquisition of knowledge. Recent introduction of a new student loan system should release resources to explore ways at creating courses that would encourage graduates to combine their skills more productively.
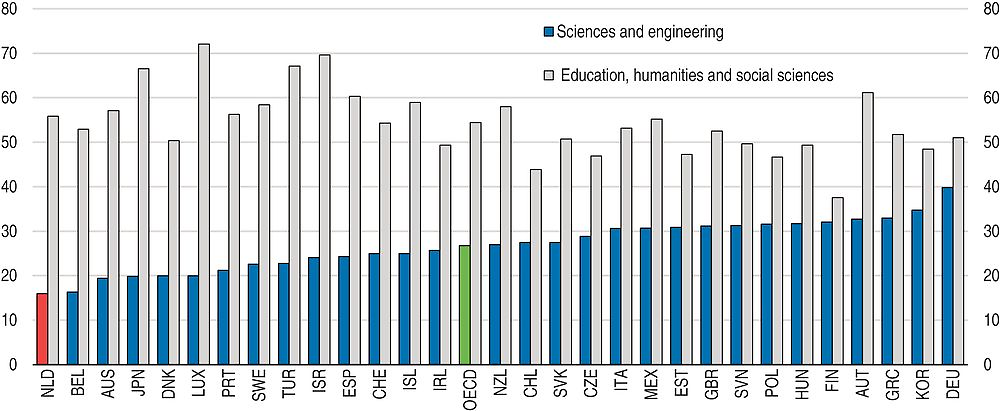
The Netherlands belongs to the group of innovation-driven economies at the world technology frontier in many sectors, but the supply of science and engineering skills is poor (Figure 2.7). High demand for science, technology, engineering and mathematics (STEM) skills finds its reflection in a very low unemployment rate for this group of workers, well below the national unemployment rate and among the lowest in the European Union (European Parliament, 2015). Despite good employment prospects for STEM graduates, the Netherlands has difficulties to encourage young people to follow scientific, engineering and technical degrees, in particular at the tertiary and doctoral level. Nearly 40% of the population aged 20-29 participate in tertiary education, significantly above the European Union average of slightly more than 30%, but enrolment rates in STEM-related degrees (science, mathematics, computing, engineering, manufacturing and construction) are among the lowest in the European Union (OECD, 2014e).
Source: OECD (2015), Education at a Glance 2015.
The authorities have started to addresses this issue. Different stakeholders have created the Bèta Techniek platform, whose main objective is to improve matching of supply and demand of talented professionals (European Parliament, 2015). The government has also signed a Technology Pact, whose aim is to ensure the supply of STEM-skilled labour in areas of shortage, established instruments to identify skills sought by individual top sectors (Human Capital Agendas), and strengthened technical education (by setting up Centres of Expertise) (OECD, 2014e). The first results of this approach are promising.
The Netherlands should continue efforts to ensure sufficient supply of labour equipped with STEM skills to sustain the development of the Dutch economy. Well-informed career choices and student counselling might be important elements of improving the attitudes for science (European Parliament, 2015). Addressing gender stereotypes and stimulating confidence of women to follow STEM courses would also improve their graduation rate in STEM, which is below the OECD average (OECD, 2013c).
Using skills more effectively at work
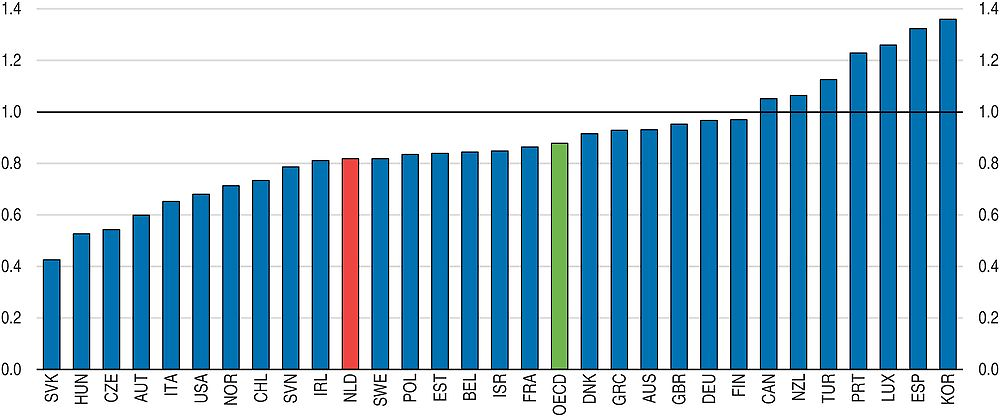
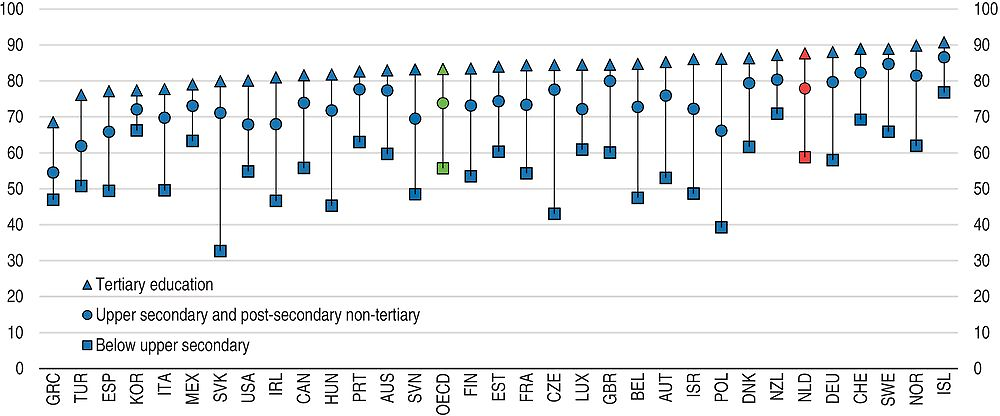
Higher education levels lead to better employment outcomes (Figure 2.8), but educational attainment is only an approximation for skills, which creates a challenge for youth entering the labour market. Moreover, while the overall level of skills is high in the Netherlands, their use at work is relatively low (Figure 2.9). A large number of Dutch enterprises do not hire any employees, which holds back growth and may reflect gaps in skills needed for running larger businesses. Greater mobility on the labour market and better lifelong learning would reduce different forms of labour market mismatches and support a more effective use of skills.
← 1. Data for Chile and France refer to 2013.
Source: OECD (2015), Education at a Glance 2015.
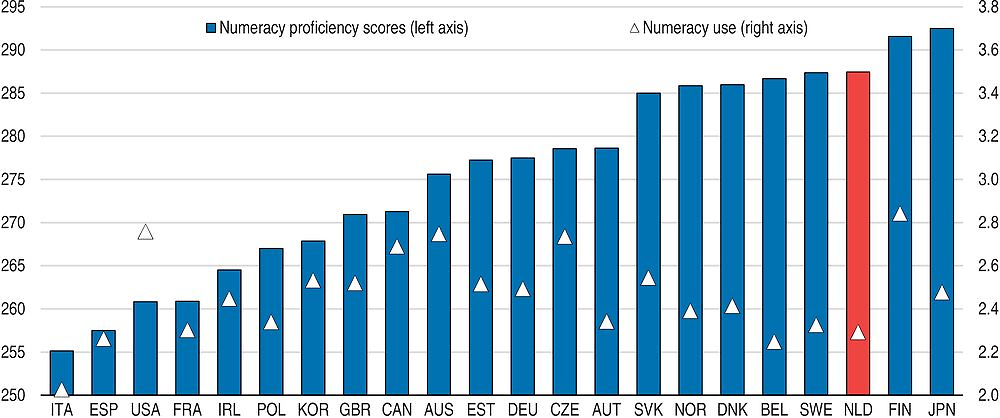
← 1. The following tasks are used to construct the measure of numeracy use: calculating prices, costs or budgets; use of fractions, decimals or percentages; use of calculators; preparing graphs or tables; use of algebra or formulas; use of advanced math or statistics (calculus, trigonometry, regressions). For each task, a value of 1 indicates that the task is never carried out at work; a value of 2 indicates that it is carried out less than once a month; a value of 3 indicates that it is carried out less than once a week but at least once a month; a value of 4 indicates that it is carried out at least once a week but not every day; and a value of 5 indicates that it is carried out every day. Data for Belgium refers to Flanders. Data for the United Kingdom refer to England and Northern Ireland.
Source: OECD (2015), OECD Employment Outlook 2015.
Improving the transition from school to work to foster the benefits of youth skills
The transition of Dutch young people to employment is smooth, which notably suggests adequate skills, but youth could gain further capabilities through internships. The gap between the unemployment rates of youth (15-29) and prime-age (30-54) workers is among the lowest in the OECD and it declined between 2007 and 2013 despite subdued gross domestic product (GDP) growth. The employment rate of youth aged between 25 and 29 exceeds 80% and is the second-highest in the OECD after Switzerland. Internships during formal education are well developed, but less so after the end of the studies as close to 80% of students report not having completed any and only 5% one, the respective European Union averages being just below 65% and just above 20% (European Commission, 2013a). This compares with nearly 80% of Dutch considering traineeships to be helpful for finding a regular job, and a third who are offered an employment contract at the end of an internship. However, post-education internships need to be well regulated, in particular regarding adequate remuneration, maximum length of trial periods and inclusion of learning content (OECD, 2015f). Promoting internships abroad, which are weakly developed in the Netherlands and the rest of the European Union, would also improve language skills of youth.
← 1. 2013 for Australia.
Source: OECD (2015), OECD Employment and Labour Market Statistics (database), November.
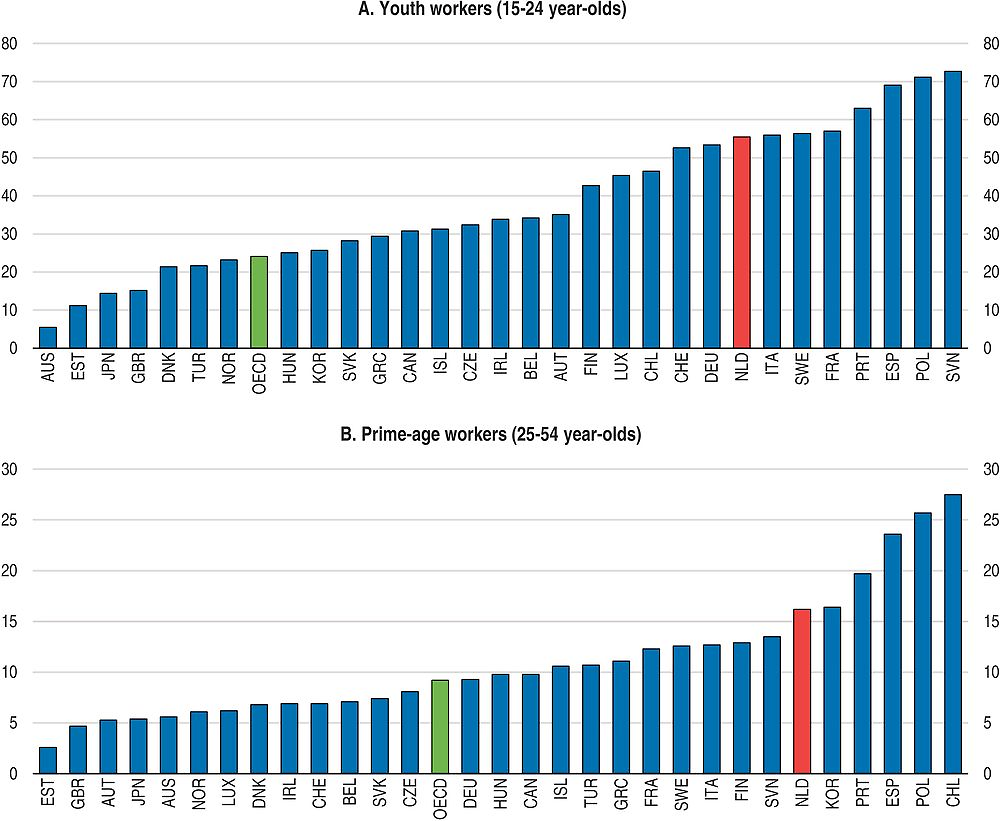
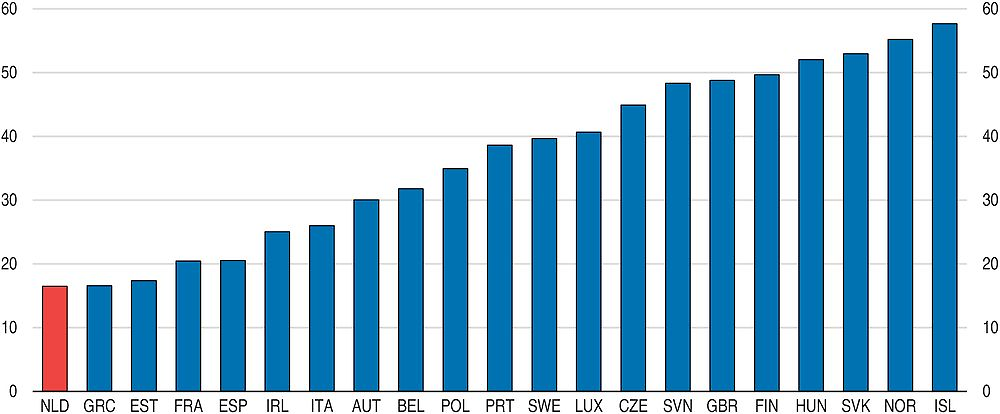
Temporary contracts lead to less intensive skill use, which matters when entering the labour market. Over a half of Dutch youth joining employment are offered temporary contracts, surpassing in this respect a number of OECD countries (Figure 2.10, Panel A). Some youth could work part-time on fixed-term contract while studying, but temporary contracts are also comparatively high for prime-age workers (Figure 2.10, Panel B). While a temporary job might be a stepping-stone in youth’s career, recent estimates indicate that less than a fifth of Dutch workers on temporary contracts in 2008 moved on a full-time permanent contract three years later. This was the lowest transition rate in the OECD (Figure 2.11), although it could partly be explained by the high prevalence of part-time work in the Netherlands and weak growth prospects of the Dutch economy in 2011. Earlier OECD studies (OECD 2013a) and results of the PIAAC survey suggest that temporary contracts are associated with a lower use of cognitive skills relative to permanent contracts. In the Netherlands, this difference is higher than the OECD average, in particular for the use of reading and writing (OECD, 2015f). In addition, temporary employment creates less possibilities of employer-sponsored training, which might further hold back skill development and trap workers in fixed-term contracts (OECD, 2006).
1. 2007-10 for the Czech Republic, France, Greece, Sweden and the United Kingdom. 2006-09 for Norway and the Slovak Republic. 2005-08 for Ireland.
Source: OECD (2014), OECD Employment Outlook 2014.
The Netherlands should further decrease asymmetries in employment protection legislation that apply to permanent and fixed-term contracts, which are high as discussed in Chapter 2 of the 2014 Economic Survey (OECD, 2014f), which would be beneficial for skill development by making it more affordable for firms to opt for permanent contracts. The government has implemented welcome reforms by reducing the duration of consecutive temporary contracts from 3 to 2 years and by extending the period between two consecutive contracts from 3 to 6 months. Regarding permanent contracts, the government has capped severance payments (at EUR 75 000 or a year’s salary, whichever is higher) and linked them to tenure rather than age, which is an important step forward. However, the cap could be further reduced. The dismissal system has been simplified, which is also a commendable step forward, but it is important that the new system ensures swift decision-making.
Strengthening entrepreneurial skills
The Netherlands has a high potential to develop its enterprise sector, but poor entrepreneurial skills could be a barrier in starting a business. Attitudes towards entrepreneurship are strong, as nearly 80% of people view starting a business as a desirable career choice and slightly more than two-thirds consider that successful entrepreneurs receive high status (OECD, 2015g). However, less than 10% expect to start a business within three years (GEM, 2015). Self-employed are less taxed than employees, but financial incentives to move from inactivity to self-employment are low as the marginal implicit tax rate is high, with nearly 80% of the earnings increase being taken away essentially by lower benefits (OECD, 2015a). Beyond also access to finance issues (OECD, 2014f; see Chapter 2), lack of adequate capabilities could be another impediment. For 15% of adults self-employment is difficult owing to a lack of relevant entrepreneurship skills, almost twice as much as in the European Union (European Commission, 2013b). Around 45% of 18-64 years old report to have the skills and knowledge required to start a business, less than in the best-performing OECD countries including the United States, Canada and Austria (GEM, 2015).
Micro-enterprises with less than ten employees are predominant as in most countries, and almost 80% of businesses in the Netherlands (including self-employed) do not have any employees, the second-highest percentage in the OECD after Poland (OECD, 2015g). Business entry and exit rates are low, resulting in the lowest churn rate of employer enterprises across industry, services and construction sectors in the OECD. Yet, firms become more growth-oriented when their size rises. The number of high-growth enterprises (annual growth in employment or turnover greater than 20% a year) as a percentage of enterprises with ten or more employees is high among OECD countries, in particular high-income ones (Figure 2.12).
Enterprise policy is very supportive in the Netherlands (Government, 2014; OECD, 2014f), but the quality of entrepreneurship education could be improved. At about 35%, the take-up rate of entrepreneurship courses is among the highest in the European Union (European Commission, 2013b). Also, Dutch experts are very positive about the way the education system encourages entrepreneurial skills (Panteia, 2014). The percentage of adults reporting that school education equipped them with competences and know-how necessary for running a business is only about the European Union average (European Commission, 2013b), but this may not fully reflect recent changes in policies. Between 2008 and 2013, the government was implementing a programme “Education and Entrepreneurship” with the aim to stimulate entrepreneurial attitudes among students and recent graduates. The effectiveness of the programme has been assessed and the main conclusions have been used for designing new evidence-based educational initiatives or amending ongoing ones, such as the “Foundation for Young Entrepreneurship”, which should be continued.
There are several avenues to foster the development of entrepreneurial skills (OECD, 2014g). Beyond offering entrepreneurship courses, schools could also rely on interactive and hands-on methods such as role playing and business simulations, which could become more complex and realistic at higher education levels. Outside of formal education system, creating online stand-alone programmes through web-based platforms would be a flexible way to deliver training at a low marginal cost to potential or existing business owners. Business development would also be strengthened by using experienced entrepreneurs for peer-to-peer learning – involving counselling, coaching and mentoring – while applying selection criteria for participants to control costs. To be more effective, training programmes could also be integrated within broader support packages, including finance and counselling as the firm develops. Tailoring training programmes to local needs would improve targeting to groups under-represented or disadvantaged in entrepreneurship, such as the “Work for Yourself” scheme in Amsterdam designed for unemployed people to become self-employed.
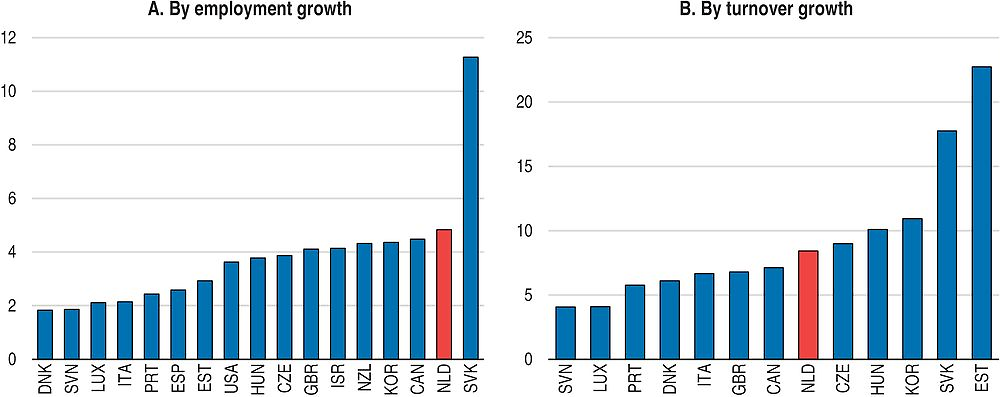
← 1. 2011 for Denmark, Luxembourg and Slovenia. 2012 for Spain. 2013 for Israel and Korea. High-growth enterprises, as measured by employment (or turnover), are enterprises with average annualised growth in employees (or turnover) greater than 20% a year, over a three-year period, and with ten or more employees at the beginning of the observation period. Data are calculated by taking the unweighted average of sectoral figures (i.e. industry, services and construction). Data for the United States are calculated as the unweighted average on only industry and construction.
Source: OECD (2015), Entrepreneurship at a Glance 2015.
Reducing labour market mismatches
The prevalence of the field-of-study mismatch is comparatively small, but reducing saturation (there are more graduates than workers) in some fields and promoting skill transferability would help to lower it further. Around 35% of Dutch workers work in a different field than their original specialisation, which is below the OECD average of close to 40%, but this is almost ten percentage points higher than in best-performing Finland. For almost 60% workers the field-of-study mismatch is independent of other forms of mismatches, but for a third of workers it is associated with a mismatch in qualifications (Montt, 2015). Therefore, the field-of-study mismatch is mainly driven by saturation, followed by poor skill transferability (workers are working in a different field and they are mismatched in terms of skills or qualifications). Robust anticipation systems of future vacancies and comprehensive information provided to students help to reduce saturation effects (Quintini, 2011), and the Netherlands has developed high-quality databases which could be made available more widely. In parallel, greater employers’ recognition that some skills are moveable across fields would improve skill transferability.
Adult learning is well developed in the Netherlands, but training courses are short and provide training within the sector, which may limit cross-sectoral mobility. Overall participation in adult learning is one the highest in the OECD, especially among young employees with high proficiency levels (OECD, 2014b). In 2016, the authorities plan to launch a pilot programme to foster lifelong learning in higher education and to counter falling participation in courses leading to diploma in part-time education (European Commission, 2015). But higher participation is needed among workers who could face the greatest difficulties to adapt throughout their working life, including older workers, and people with low educational attainment and skills (as measured by the PIAAC survey). Strengthening lifelong learning for disadvantaged workers would require increasing public support for employers to provide training, and promoting cooperation between the education system and the business sector, especially in tertiary education. Since July 2015, the civil code requests an employer to provide training for the current job, the continuation of employment contract or when the worker is made redundant. An employer can subtract incurred training costs from the dismissal compensation of a redundant worker, but only if the latter agrees on this and the training has broadened skills beyond what is needed for the current job. Supporting older workers’ skills through lifelong learning to ensure a better alignment of their wages and productivity would lift another barrier to mobility.
Better recognition of foreign qualifications would decrease related mismatches among first-generation immigrants. Lack of formal assessment and validation of foreign diplomas increases the risk of over-qualification (OECD, 2014c). The over-qualification rate of highly educated immigrants at just below 25% is not high as compared to other OECD countries, although it has increased more than the rate for the native-born (OECD, 2015e). The underutilisation of relevant qualifications is more of a recent phenomenon related mostly to recent migrants from the European Union (SER, 2014). The percentage of immigrants applying for accreditation of their foreign qualification is low partly as a result of the lack of awareness regarding the possibility of such recognition procedures (OECD, 2014c). In order to encourage immigrants to apply for recognition of their foreign qualifications, the Netherlands has recently set up a one-stop shop for processing all applications, which is welcome. Improving matching of migrants who have the right qualifications with existing labour shortages in technical fields would be a further step forward (SER, 2014).
Recognizing informal skills of immigrants without fully recognized qualifications or without formal qualifications would support a better use of their skills. A special procedure validating immigrants’ informal competencies and making this information available to potential employers would be an important step forward. In the Netherlands, public employment services assess and validate informal skills of foreign-born, but they do not have an immigrant specific tool such as Denmark’s “Competence Card”. In Denmark, immigrants’ professional, linguistic and general skills are registered on a digital competence card, thus helping to connect employers and migrants (OECD, 2014c).
Acquiring skills through work
There remains an important potential to support people’s skills by facilitating their transition into work or to work longer, which favours informal on-the-job learning (Figure 2.13). This type of learning could represent as much as around 95% of learning according to recent studies (Borghans et al., 2014). This requires stronger active labour market policies to help inactive youth, immigrants and long-term unemployed; to create better conditions for avoiding sickness and disability; to reduce disincentives for women to work longer; and to support older workers’ attachment to the labour market.
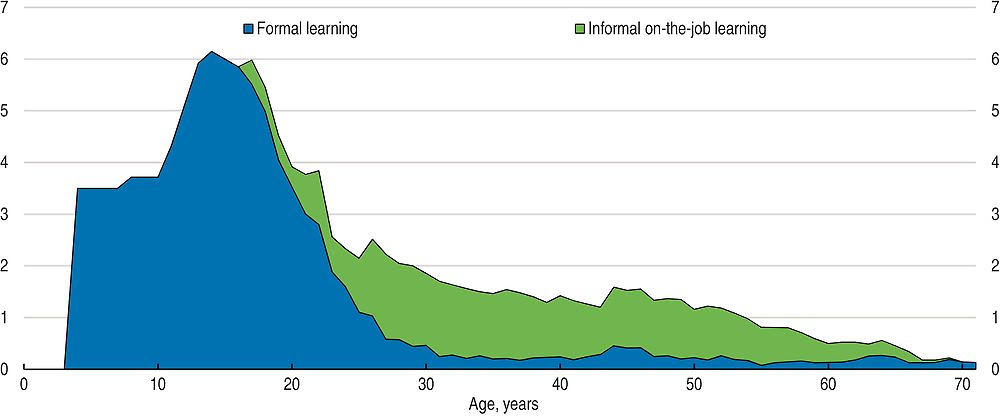
← 1. Including all days (i.e. weekends, holidays) of the year.
Source: Lex Borghans (2007), “Zonde van de tijd; Leren in Nederland vanuit een economisch perspectief” (Pity of the time: Learning in the Netherlands from an economic perspective), TPEdigitaal 1(1), 2007, pp. 95-118.
Putting the skills of youth lagging behind into action
Young people failing to enter the job market gradually lose skills that they do not use, hence becoming less employable and risking to move into unemployment or inactivity. In the Netherlands, this risk is low when considering the overall population of young people. At just below 10%, the proportion of youth aged 15-29 who are neither in employment nor in education or training (NEET) is lower than the OECD average of 15%, although it is slightly higher than in best-performing Luxembourg, Japan and Iceland. However, the proportion of youth immigrants aged 15-24 who are NEET is more than double than for the same cohort of natives (Figure 2.14). The same is true for youth unemployment as immigrants are much more likely to be unemployed as compared to Dutch natives (OECD, 2015e).
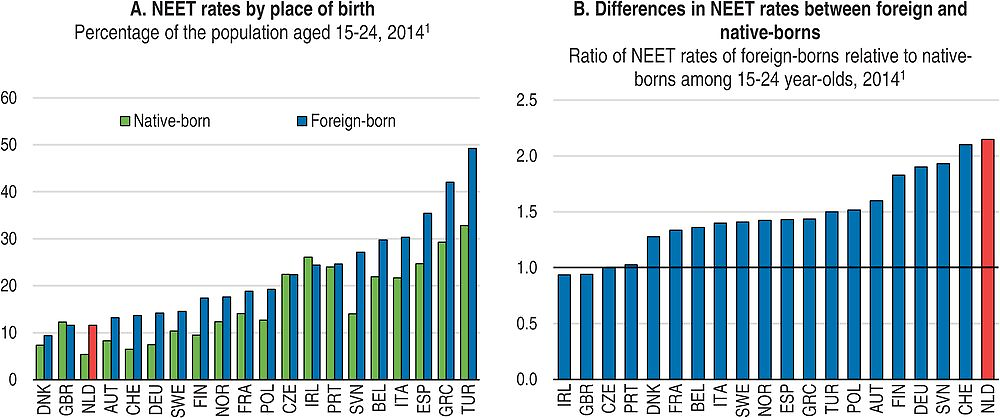
1. Data refer to Q1-Q3 2014. NEET: not in employment, education or training. The results for NEET in European countries are overestimated because they are based on three quarters, including summertime, when under-declaration of school enrolment of students is commonly observed.
Source: OECD (2015), International Migration Outlook 2015.
Increasing the level of educational attainment and cognitive skills would further reduce the likelihood of becoming NEET, but this is not a perfect guarantee. The results of the PIAAC survey show that in all OECD countries except Japan, the lower the level of literacy and numeracy skills, the higher the NEET rate. In the Netherlands, the NEET rates of high- and medium-skilled youth are quite similar, respectively at about 3.5% and 5% both for literacy and numeracy. Simultaneously, low-skilled youth are significantly more at risk of becoming NEET, as the NEET rate is almost 20% for low literacy skills and slightly more than 15% for low numeracy skills (OECD, 2015f). However, barriers to youth employment exist independently of the level of educational attainment. While the largest group of Dutch NEET people (around 45%) has not attained upper secondary education, many of them have an upper secondary or post-secondary non-tertiary degree (nearly 45%) and some have even completed tertiary education (just below 15%). In some cases, the NEET status can reflect personal choice, for instance young women who decide to have and look after children.
Bolder active labour market policies are needed to help Dutch youth who are NEET to put their skills to work and/or to upgrade them. Around 60% of them are inactive and do not seek employment (OECD, 2015f). Spells of unemployment and inactivity may send negative signals to employers, but also weaken labour supply through skill erosion and lower self-confidence. Dutch NEETs who did not participate in education or training in the 12 months prior to the PIAAC survey had significantly lower literacy skills than those who did, and this gap was larger than in other OECD countries (Figure 2.15). As a result, Dutch inactive youth can lag even further behind active and outstandingly performing Dutch adults. Therefore, it is important that access to social benefits remains conditional on active job-search, and the participation in further education and training (OECD, 2015f). Yet, the type of obligation should depend on an assessment of individuals’ skills and specific labour market barriers.
← 1. NEET: not in employment, education or training. Data for Belgium refers to Flanders. Data for the United Kingdom refer to England and Northern Ireland. The OECD aggregate is calculated as the unweighted average of the data shown.
Source: OECD (2015), OECD Skills Outlook 2015: Youth, Skills and Employability.
Reducing disincentives for women’s full-time work
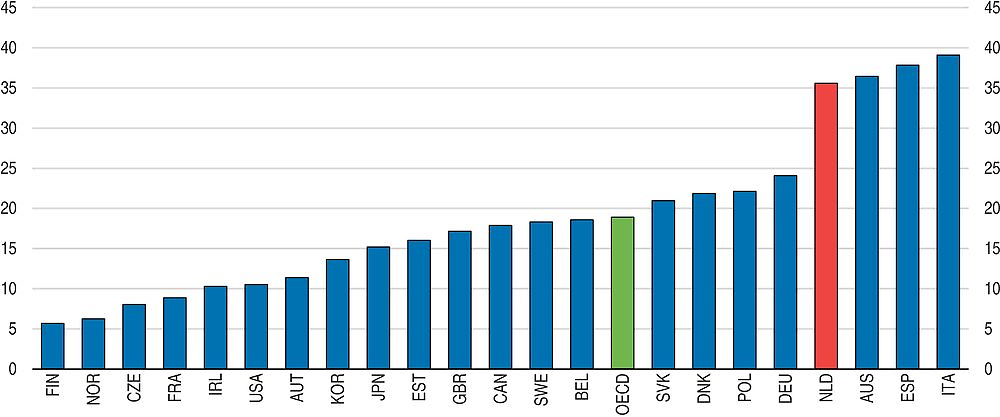
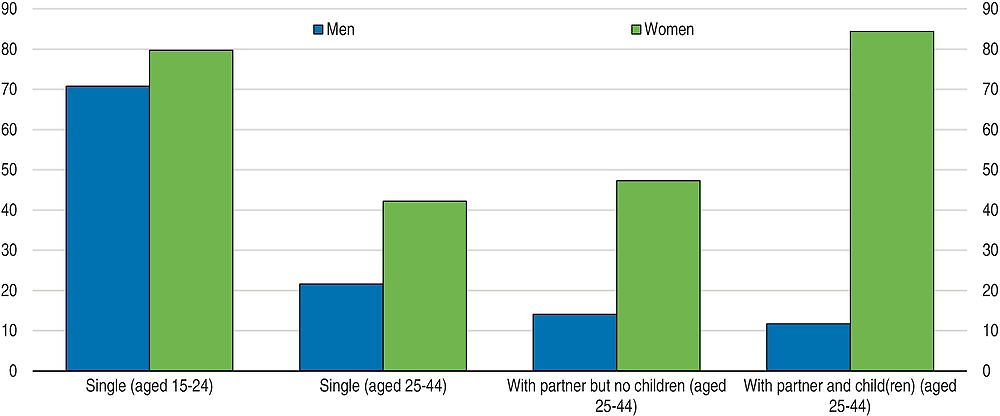
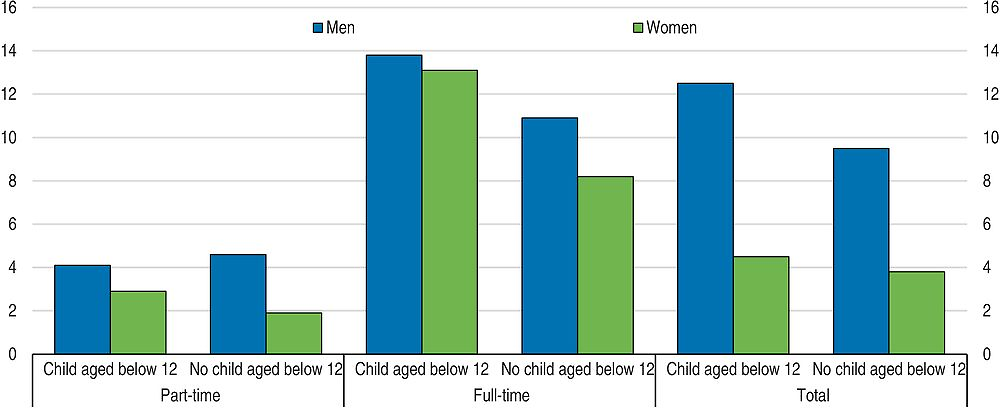
In the Netherlands, part-time employment is significant. As a proportion of total employment of persons aged 15 and over, men’s part-time employment represents 20%, two times the OECD average, and women’s part-time employment is 60%, almost two and a half times the OECD average (OECD, 2015h). Women’s share in part-time employment exceeds 70%. Large prevalence of part-time work could reflect social preferences and work-life balance choices. While many young men and women combine part-time work and study, women work part time nearly twice as much as men when they leave the education system and are singles (Figure 2.16). However, women’s greater propensity to work part-time is one of the factors lowering their pensions relative to men, contributing to a sizeable gender gap in pension. At about 40%, this gap is in the Netherlands among the highest in the European Union (Burkevica et al., 2015). Also, there are fewer women than men in management positions, but full-time working mothers have managerial responsibilities nearly as often as full-time working fathers (Figure 2.17).
Source: Statistics Netherlands (2015), “Arbeid en sociale zekerheid” (Labor and social security), Statline, December.
Source: Statistics Netherlands (2015), “Full-time working mothers as often employed at managerial level as full-time working fathers”, Press release, March.
It is important to minimize the influence of the tax and benefit system on the decision to work part time. Self-reported difficulties to find full-time work can explain only around 13% of the total part-time work, against an OECD average of about 20%, which indicates that involuntary part-time work is low. However, financial disincentives for moving from part-time work to full-time work are high. The combined effect of taxes and lost benefits results in 65% of extra earnings being taken away (Figure 2.18). Recent tax changes that penalise extra work less are a step forward.
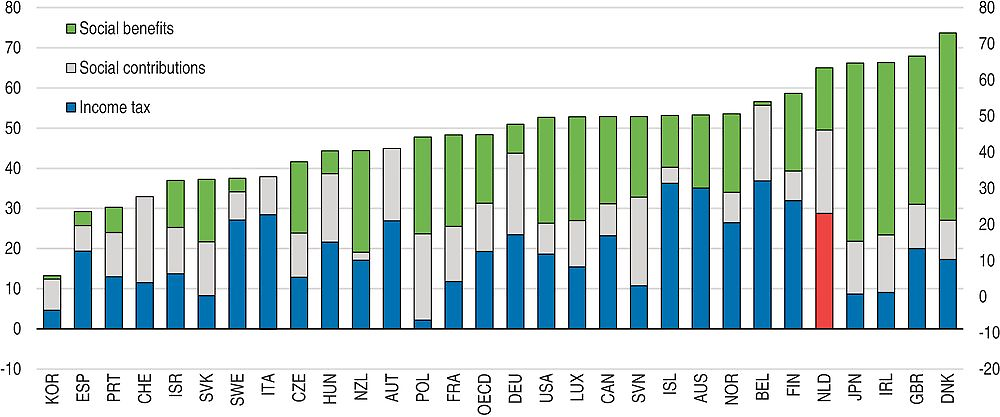
← 1. Transition tax rates for part-time employee (working 20 hours) moving into full-time work (working 40 hours). Social benefits include family, housing and in-work benefits as well as social assistance. The results are computed as the average of four sets of typical families: single adult living alone, single-earner couple without children, single parent with two children, single-earner couple with two children. The OECD aggregate is calculated as the unweighted average of the data shown.
Source: OECD (2015), In It Together: Why Less Inequality Benefits All.
Additional policies are needed to make the choice between full-time and part-time work more neutral, which would enhance skill utilisation. Childcare facilities are well developed but are open for a limited number of hours, which leads to an extensive use of informal childcare (European Commission, 2014). Nearly 50% of women and slightly more than 10% of men report having reduced their working hours to take care of the youngest child in the family (Janta, 2014). Also, the proportion of women working part time increases significantly as the family expands (Figure 2.18). Extending the opening hours of childcare facilities would remove one barrier to full-time work. Also, training for part-time workers could be less frequent because the expected return could be lower than for full-time workers, which can reduce women’s accumulation of skills and their ability to change jobs.
Sustaining older workers’ skills by fostering work incentives
The labour force participation rate of 55-64 olds rose by nearly fifteen percentage points between 2007 and 2014, which is a major progress. At about 65%, the participation rate is above the OECD average of close to 60%, but it remains below the level in best-performing OECD countries where it is around or above 75% (Switzerland, Norway, Sweden and New Zealand). Progress in lifting the employment rate was less significant, as the unemployment rate doubled over the crisis to almost 8% in 2014. At 60%, the employment rate for those between the age 55 and 64 is somewhat above the OECD average, but it lags behind for those between 65 and 69. The full-time equivalent employment rate of 55-64 is also below the OECD average given the high incidence of part-time work, in particular for women (OECD, 2014h).
Significant pension reforms have raised the use of skills at an older age and should be implemented as scheduled. The statutory retirement age has been creeping up, and was 65 and two months in the state pension system in 2014 (OECD, 2015i). It will be raised to 66 years in 2018, and to 67 in 2021, and subsequently be linked to life expectancy, which is commendable. As from 2014, the statutory retirement age for occupational (second-pillar) pensions has been increased to 67 and, from 2015, linked to life expectancy at the age of 65.
More than 40% of the long-term unemployed are over the age of 50, but important reforms have aimed to address this barrier to effective skill use. In part, this high rate is explained by labour institutions (Graaf-Zijl et al., 2015). Beyond improving the efficiency of public employment services and lowering the cap on severance payments, further benefit reforms are needed. Older workers over the age of 60 and who become unemployed can benefit, at least until 2020, from an income allowance (once the regular unemployment benefit insurance has expired) which can be extended to retirement age. The allowance should be coupled with activation policies to make re-entry to work a credible option and by linking training to skills needed in a specific job (OECD, 2014h).
Avoiding skill depreciation due to unemployment and health problems
Important reforms have helped to contain the incidence of sickness, disability and mental disorders in the Netherlands, but the costs of these problems remain large. Sickness absence has fallen considerably over time, but at more than 3% in 2013 it remained above the OECD average of around 2.5%. Disability benefits had been used as a major pathway to early retirement, until the deployment of a major reassessment programme in 2004-09. Since then, targeted reassessments occur on a random basis. As a result, inflows into disability benefits have been reduced, but almost 10% of the working-age population received a disability benefit in 2012, compared with an OECD average of just above 5%. The employment rate of people with mental health problems is comparatively strong in the Netherlands, but it is nearly 15 points lower than the employment rate of those without such problems (OECD, 2014i). The cost of mental health disorders is around 3% of GDP in the Netherlands, with more than half of these costs due to lost employment, poor productivity and benefit spending rather than direct health care costs.
Further policy steps are needed to limit the impact of different forms of illness on skills. Employers have strong financial incentives to prevent sickness absence, being legally obliged to pay a sick leave at 70% of the salary for two years (often topped up to 100% in the first year). The introduction of a collective insurance for the second year, currently under discussion, should lower this incentive, but on the other hand it should support the development of businesses, in particular of those with no employees. An additional step forward would be to develop early interventions, for instance by providing workers with the possibility for preventive consultation with their occupational health care providers (OECD, 2014i). On the beneficiary side, high benefits payment levels would need to be reduced as they could lead to moral hazard. The initial replacement rate could be lowered and then phased out over time to ensure the right balance between income security during sickness absence and return-to-work incentives. Addressing the issue of sickness absence is important as after two years people can apply for disability benefits, which raises the risk of skill depreciation by increasing distance from the job market.
Further progress in reforming disability benefits would contribute to re-activate existing skills, but stimulating labour demand is also needed. Since 2015, access of non-working youth to disability benefits has been closed for new applicants with remaining work capacity, who can instead apply for social assistance. Employees who have been sick for two years and have an earnings capacity loss of more than 35% are eligible for schemes for partially and fully disabled, but only one-fourth of beneficiaries are significantly incentivised financially to resume regular work (OECD, 2014i). Disability reassessments are targeted at those under the age of 50 and the authorities have started to reassess the work capacity of 60 000 young people, and if they can work their disability benefits will be reduced to raise work incentives. A more generic reassessment of the eligibility to disability benefits should be considered, especially for those over 50, which would help to avoid losing valuable competences by increasing re-entry to work for this group. Incentives to re-use skills by older partially disabled employees are also diminished by an income allowance introduced in 2006, which can be extended to retirement age. However, insufficient labour demand for disabled workers’ skills could be an important barrier, and different stakeholders have recently committed to create 100 000 jobs in the private sector and 25 000 in the public sector until 2026. Missing these targets will result in quotas being imposed on firms with at least 25 employees.
The Netherlands has started important reforms with a view to digitalise public employment services (PES), and to devolve greater responsibilities to municipalities for benefit provision and labour market integration. To prevent that unemployment and sickness absence morph into disability and mental health problems, the PES could play a greater role. In 2012, the PES was involved in finding a job only in about 5% of cases (against an average of nearly 10% in the OECD) and its services were used by half of the unemployed (against by two-thirds in other OECD countries), despite spending around 0.4% of GDP more on labour market programmes and PES administration than in the OECD (OECD, 2015h). In parallel, the number of job seekers per PES staff member was relatively high compared to other OECD countries, estimated at 125 in 2011, against between 20 and 55 in the United Kingdom, Denmark, Belgium, Austria and Germany (OECD, 2014j). However, the unemployment rate has increased significantly since then and, between 2011 and 2015, the budget of the PES was halved as a result of fiscal consolidation (OECD, 2015h).
Currently, re-integration services are not provided in the first three months of unemployment insurance benefits, which saves costs because many of those who are recently unemployed find jobs anyway, but also creates risks of skill depreciation and reduced employability for workers, in particular those who turn out to have poor job prospects. Only 10% of most disadvantaged unemployed can benefit from intensive support from month four onwards (OECD, 2015h). Nevertheless, retraining possibilities have been stepped up to improve job transition for the unemployed since March 2015, which is welcome. The experience of OECD countries suggests that best-practice PES include job-search verification, early and high-intensity personalised counselling interventions, programmes developing work experience and labour market training for long-term unemployed, liaising with employers to both fill vacancies and improve the matching of jobs with skills, and performance management and evaluation of instruments to ensure that PES interventions are cost effective (OECD, 2015h).
Rapid identification of unemployed with psychological problems, the development of work plans in the early stage of sickness absence, and the introduction of financial incentives to improve the effectiveness of activation policies by the PES would be additional steps in the right direction (OECD, 2014i). Also, municipalities should have sufficient means and knowledge to activate people with skills detached from the labour market.
Enhancing immigrants’ labour market integration
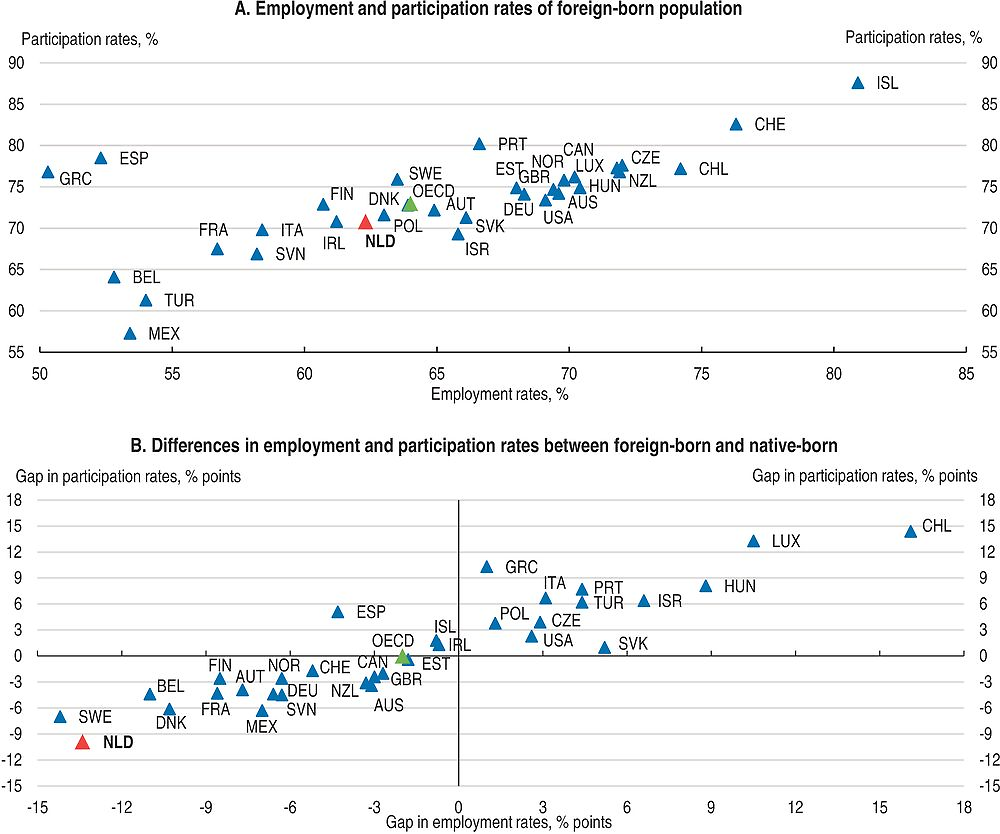
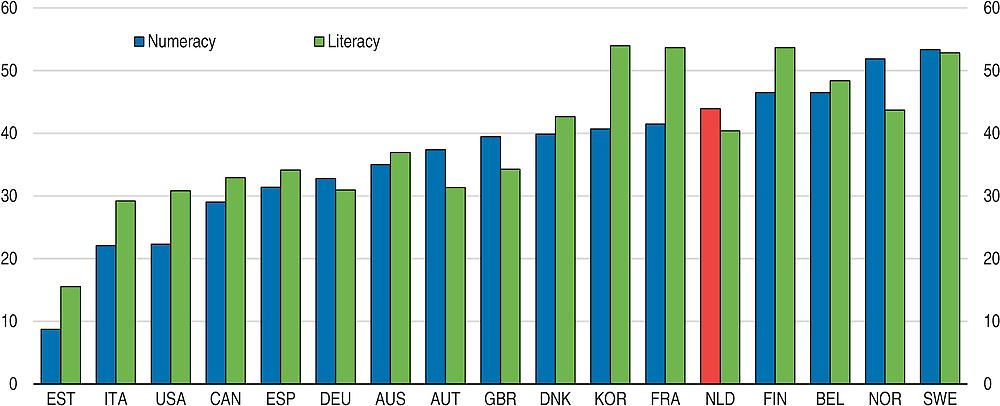
Immigrants constitute an important part of the Dutch workforce, but their labour market integration is weak. Both the share of foreign-born population and the combined proportion of first- and second-generation immigrants stand close to the OECD average, respectively at about 10% and 20% of total population. As result of the recent surge in the number of asylum seekers, which more than tripled between 2013 and 2015 reaching nearly 60 000 asylum requests in 2015, the share of immigrants in the labour force is expected to increase. The gap in employment rates between immigrants and native-born in the Netherlands is the largest in the OECD. The employment rate for foreign-born population was slightly below 65%, which resulted in a gap of almost 15% as compared to natives (Figure 2.19). The employment gap for women and the lower educated is even larger (OECD, 2015e). The participation rate among immigrants is around 70%, which is not the lowest rate relative to other OECD countries, but it is almost ten percentage points lower than for natives and represents the most important difference in the OECD (Figure 2.19). Immigrants are overrepresented among the low-educated working-age population, whereas the reverse is true for the highly educated. Results of the PIAAC survey also show a wide skill gap between foreign- and native-born adults (Figure 2.20).
← 1. 2013 for the OECD aggregate and Chile. 2011 for Israel. Working-age population refers to those aged between 15 and 64.
Source: OECD (2015), “Employment, unemployment and participation rates by sex and place of birth”, OECD International Migration Statistics (database), October.
← 1. Only statistically significant differences are shown. The differences between the two categories are adjusted for differences associated with all of the following variables: age, gender, education, socio-economic background, and type of occupation. Countries are ranked in ascending order of difference in numeracy scores (native-born and native language minus foreign-born and foreign language adults). Data for Belgium refers to Flanders. Data for the United Kingdom refer to England and Northern Ireland.
Source: OECD (2013), OECD Skills Outlook 2013: First Results from the Survey of Adult Skills.
Stronger efforts to upgrade the skill set of first-generation immigrants would facilitate their labour market entry. Organising work schemes, especially for those with low or no qualifications, would help immigrants to demonstrate their informal competencies. The most successful work schemes are those that combine work experience (in the form of wage subsidies and/or work placements) with on-the-job training and language courses (OECD, 2014c). Effective language training is essential since the language deficit is considered as one of the main barriers to immigrants’ labour market integration (OECD/European Union, 2014). For instance, Denmark’s “Step model” successfully combines language training, state-financed work placement and wage subsidy (OECD, 2014c). However, immigrants in the Netherlands tend to be underrepresented in active labour market policies and are more likely to stay away from job-related training as compared to natives (OECD, 2014c, OECD, 2015e).
Beyond reducing the extent of labour market dualism which more negatively affects foreign-born than natives, reforming the tax and benefit system would also favour putting immigrants’ skills into work. The combination of high unemployment benefits as well as other social benefits and high taxes on wages can reduce work incentives, especially for those expecting to earn low wages. The OECD database with results of tax-benefit models shows that potential earning gains from taking up a low-paid job are small in the Netherlands. Since immigrants are mainly overrepresented among the low-skilled low-wage earner segment of the labour force, they are more likely to fall into unemployment and inactivity traps than natives (OECD, 2014c). The government has recently adopted a raise in the earned income tax credit for lower income-earners, which is a welcome step.
Discrimination is another obstacle to greater skill mobilisation of immigrants, and reintroducing equal employment policies would help to tackle it. Despite measurement issues, there is compelling evidence that discrimination on the basis of race or ethnicity is a barrier to jobs (OECD, 2008a; OECD, 2013d). With identical curriculum vitae but different names, immigrant applicants in the Netherlands have around 15% less chance of being invited for a job interview and this gap increases to 20% for low-educated candidates (Andriessen et al., 2012). Self-reported discrimination is considerable for the working-age population, and even higher for native-born offspring of immigrants between the age of 15 and 34 (OECD, 2015e; Andriessen et al., 2014). However, anti-discrimination laws without strong enforcement mechanisms are usually not sufficient in addressing discrimination (OECD, 2014c).
Instead, equal employment policies, which address non-intentional and indirect discrimination and are underpinned by robust monitoring and reporting systems, are more effective in ensuring equal opportunities, as shown by Canada, the UK and the US (OECD, 2013d). Between 1994 and 2003, the Netherlands required employers to register and publish the number of immigrants employed (Samen Act), but this practice was ended amid improving labour market outcomes for immigrants and employers’ objections. In 2014, the government introduced various measures to combat discrimination, such as creating a diversity charter for employers, starting an information campaign against discrimination, and setting up a team of six investigators focusing on workplace discrimination. Furthermore, The Hague police are introducing a quota system to get more immigrant officers into the service in order to stimulate diversity and combat discrimination. Nevertheless, reinstating an equal employment policy would help achieve the proportional labour market representation of immigrants.
International students graduating from Dutch universities constitute an ideal pool of highly skilled immigrants as they are already exposed to Dutch culture and language (OECD, 2008b). The policies in place to attract and retain international students focus on the provision of courses in English, the development of Dutch language skills, better information on study and career opportunities, as well as improved integration with Dutch students. Recently, a scholarship (Holland Scholarship) has been created for students from outside the European Economic Area. As a result, the number of international students enrolled in Dutch higher education has increased by around 50% between 2008 and 2013, reaching 9% of all students in higher education (OECD, 2015j). The authorities also offer one year job-search visas for recent graduates from Dutch universities and for those acquiring a Master’s degree or a PhD from an internationally highly-ranked university. However, the proportion of those who find a suitable job is low (OECD, 2014c), which would require extending the duration of job-search visas beyond one year and automatically attributing a work permit if a job contract is concluded (Gerritsen and Hoj, 2013).
Developing skills at school
-
Raise the educational and pedagogical quality of early childhood education and care further.
-
Further raise teachers’ qualification, in particular in disadvantaged schools, and subsequently their wages. Foster pupils’ mobility between secondary tracks.
-
Continue to improve vocational education and training by ensuring stronger formation of generic skills, without undermining the development of professional skills, and by expanding the range and quality of post-secondary qualifications.
Using skills more efficiently at work
-
To ensure higher prevalence of permanent contracts while enhancing resource allocation in the economy, further ease employment protection legislation on permanent contracts by continuing to reduce the cap on severance payments.
-
Enhance entrepreneurial skills by continuing the evaluation of the effectiveness of programmes in formal education, developing online stand-alone training programmes, and promoting peer-to-peer learning.
-
Reduce the incidence of qualification and field-of-study mismatches by enhancing career guidance and strengthening general lifelong learning.
Acquiring skills through work
-
Strengthen participation in upskilling for the unemployed and inactive youth who are neither in employment nor in education or training to encourage their labour market integration.
-
Cut disincentives for women’s full-time work by lowering income taxes for longer working hours as planned, and by raising opening hours of childcare facilities.
-
Recognise informal skills of immigrants on a digital competence card for employers, and offer work schemes, especially for immigrants with low or no qualifications, combining wage subsidies and/or work placements and on-the-job training as well as language courses.
-
Lower sickness and disability by encouraging preventive consultations and extending disability reassessments to workers above 50.
Bibliography
Adalet McGowan, M., D. Andrews and C. Criscuolo (2015), The Future of Productivity, OECD Publishing, Paris, https://doi.org/10.1787/9789264248533-en.
Andriessen, I. , H. Fernee and K. Wittebrood (2014), “Perceived discrimination in the Netherlands”, Netherlands Institute for Social Research, The Hague.
Andriessen, I., E. Nievers, J. Davegos and L. Fault (2012), “Ethnic discrimination in the Dutch labour market: its relationship with job characteristics and multiple group membership”, Work and Occupation, Vol.39, No. 3.
Autor D. (2015), “Why Are There Still So Many Jobs? The History and Future of Workplace Automation”, Journal of Economic Perspectives, Vol. 29, No. 3, Summer.
Autor, D. and D. Dorn (2013), “The Growth of Low-Skill Service Jobs and the Polarization of the U.S. Labor Market”, American Economic Review, Vol. 103, No. 5.
Bonhomme S., G. Jolivet and E. Leuven (2012), “Job Characteristics and Labor Turnover: Assessing the Role of Preferences and Opportunities in Teacher Mobility”, Centre for Economic Policy Research (CEPR) Discussion Paper No. 8841, February.
Borghans L., Fouarge D., de Grip A. and J. van Thor (2014), “Werken en leren in Nederland” (Working and learning in the Netherlands), Researchcentrum voor Onderwijs en Arbeidsmarkt, No. ROA-R-2014/3.
Burkevica I., A. Humbert, N. Oetke and M. Paats (2015), “Gender gap in pensions in the EU”, Research note to the Latvian Presidency, European Institute for Gender Equality.
CEDEFOP (2015), Skills Forecast, European Centre for the Development of Vocational Training.
European Commission (2015), “Education and Training Monitor 2015: Netherlands”, Directorate-General for Education and Culture.
European Commission (2014), “Female Labour Market Participation”, technical note.
European Commission (2013a), “The Experience of traineeships in the EU”, Flash Eurobarometer, No. 378.
European Commission (2013b), “Entrepreneurship in the EU and Beyond”, Flash Eurobarometer, No. 354.
European Parliament (2015), Encouraging STEM Studies for the Labour Market.
GEM (2015), Global Entrepreneurship Monitor – 2014 Global Report.
Gerritsen, M. and J. Høj (2013), “The Dutch Labour Market: Preparing for the Future”, OECD Economics Department Working Papers, No. 1012, OECD Publishing, Paris, https://doi.org/10.1787/5k4dlff4wcwl-en.
Government (2014), Enterprise policy at full speed – Progress Report on Enterprise Policy 2013, Ministry of Economic Affairs.
Graaf-Zijl M. de, A. van der Horst and D. van Vuuren (2015), “Long-term Unemployment in the Netherlands”, CPB Policy Brief, No. 2015/11.
Janta B. (2014), “Caring for children in Europe – How childcare, parental leave and flexible working arrangements interact in Europe”, Policy Brief, European Commission.
Montt G. (2015), “The System-Level Causes and Consequences of Field-Of-Study Mismatch”, Unpublished draft paper, OECD.
Nusche D., H. Braun, G. Halász and P. Santiago (2014), “OECD Reviews of Evaluation and Assessment in Education: Netherlands 2014”, OECD Reviews of Evaluation and Assessment in Education, OECD Publishing, Paris, https://doi.org/10.1787/9789264211940-en.
OECD (2016), Reviews of National Policies for Education – Netherlands, OECD Publishing, Paris, forthcoming.
OECD (2015a), In It Together – Why Less Inequality Benefits All, OECD Publishing, Paris, https://doi.org/10.1787/9789264235120-en.
OECD (2015b), Getting Skills Right: Assessing and Responding to Changing Skill Needs, OECD Publishing.
OECD (2015c), Immigrant Students at School: Easing the Journey towards Integration, OECD Publishing, Paris, https://doi.org/10.1787/9789264249509-en.
OECD (2015d), “Netherlands”, in Education Policy Outlook 2015: Making Reforms Happen, OECD Publishing, Paris, https://doi.org/10.1787/9789264225442-27-en.
OECD (2015e), Indicators of Immigrant Integration 2015: Settling In, OECD Publishing, Paris, https://doi.org/10.1787/9789264234024-en.
OECD (2015f), OECD Skills Outlook 2015 – Youth, Skills and Employability, OECD Publishing, Paris, https://doi.org/10.1787/9789264234178-en.
OECD (2015g), Entrepreneurship at a Glance 2015, OECD Publishing, Paris, https://doi.org/10.1787/entrepreneur_aag-2015-en.
OECD (2015h), OECD Employment Outlook 2015, OECD Publishing, Paris, https://doi.org/10.1787/empl_outlook-2015-en.
OECD (2015i), Pension at a glance 2015, OECD Publishing, Paris, https://doi.org/10.1787/gov_glance-2015-en.
OECD (2015j), International Migration Outlook 2015, OECD Publishing, Paris, https://doi.org/10.1787/migr_outlook-2015-en.
OECD (2014a), “Does Pre-primary Education Reach Those Who Need it Most?”, PISA in Focus, No. 40, OECD Publishing, Paris, https://doi.org/10.1787/5jz15974pzvg-en.
OECD (2014b), Education at a Glance 2014: OECD Indicators, OECD Publishing, Paris, https://doi.org/10.1787/eag-2014-en.
OECD (2014c), International Migration Outlook 2014, OECD Publishing, Paris, https://doi.org/10.1787/migr_outlook-2014-en.
OECD (2014d), OECD Reviews of Vocational Education and Training – A Skills Beyond Schools Review of the Netherlands, OECD Publishing, Paris, https://doi.org/10.1787/9789264221840-en.
OECD (2014e), OECD Reviews of Innovation Policy: Netherlands 2014, OECD Publishing, Paris, https://doi.org/10.1787/9789264213159-en.
OECD (2014f), OECD Economic Surveys: Netherlands 2014, OECD Publishing, Paris, https://doi.org/10.1787/eco_surveys-nld-2014-en.
OECD (2014g), Job Creation and Local Economic Development, OECD Publishing, Paris, https://doi.org/10.1787/9789264215009-en.
OECD (2014h), Ageing and Employment Policies: Netherlands 2014: Working Better with Age, OECD Publishing, Paris, https://doi.org/10.1787/9789264208155-en.
OECD (2014i), Mental Health and Work: Netherlands, OECD Publishing, Paris, https://doi.org/10.1787/9789264223301-en.
OECD (2014j), OECD Economic Surveys: Spain 2014, OECD Publishing, Paris, https://doi.org/10.1787/eco_surveys-esp-2014-en.
OECD (2013a), OECD Skills Outlook 2013: First Results from the Survey of Adult Skills, OECD Publishing, Paris, https://doi.org/10.1787/9789264204256-en.
OECD (2013b), PISA 2012 Results: Excellence Through Equity: Giving Every Student the Chance to Succeed (Volume II), PISA, OECD Publishing, Paris, https://doi.org/10.1787/9789264201132-en.
OECD (2013c), OECD Science, Technology and Industry Scoreboard 2013: Innovation for Growth, OECD Publishing, Paris, https://doi.org/10.1787/sti_scoreboard-2013-en.
OECD (2013d), International Migration Outlook 2013, OECD Publishing, Paris, https://doi.org/10.1787/migr_outlook-2013-en.
OECD (2012a), Better Skills, Better Jobs, Better Lives: A Strategic Approach to Skills Policies, OECD Publishing, Paris, https://doi.org/10.1787/9789264177338-en.
OECD (2012b), Equity and Quality in Education: Supporting Disadvantaged Students and Schools, OECD Publishing, Paris, https://doi.org/10.1787/9789264130852-en.
OECD (2012c), Untapped Skills: Realising the Potential of Immigrant Students, OECD Publishing, Paris, https://doi.org/10.1787/9789264172470-en.
OECD (2008a), Jobs for Immigrants (Vol. 2): Labour Market Integration in Belgium, France, the Netherlands and Portugal, OECD Publishing, Paris, https://doi.org/10.1787/9789264055605-en.
OECD (2008b), OECD Economic Surveys: Netherlands 2008, OECD Publishing, Paris, https://doi.org/10.1787/eco_surveys-nld-2008-en.
OECD (2006), OECD Employment Outlook 2006: Boosting Jobs and Incomes, OECD Publishing, Paris, https://doi.org/10.1787/empl_outlook-2006-en.
OECD/European Union (2014), Matching Economic Migration with Labour Market Needs, OECD Publishing, Paris, https://doi.org/10.1787/9789264216501-en.
Panteia (2014), Global Entrepreneurship Monitor – Netherlands.
Quintini G. (2011), Over-Qualified or Under-Skilled: A Review of Existing Literature, OECD Social, Employment and Migration Working Papers, No. 121, OECD Publishing, Paris, https://doi.org/10.1787/5kg58j9d7b6d-en.
ROA (2011), De arbeidsmarkt naar opleiding en beroep tot 2016 (The labour market by education and occupation until 2016), Research Centre for Education and Labour Market, Maastricht University, Maastricht.
SER (2014), “Abstract of advisory report on Labour Migration (Arbeidsmigratie)”, Social and Economic Council of the Netherlands.
Van den Berge W. and B. ter Weel (2015), Baanpolarisatie in Nederland (Job polarisation in the Netherlands), CPB Policy Brief.
← 1. The statistical data for Israel are supplied by and under the responsibility of the relevant Israeli authorities. The use of such data by the OECD is without prejudice to the status of the Golan Heights, East Jerusalem and Israeli settlements in the West Bank under the terms of international law.