Assessment and recommendations
Strong growth has raised incomes and reduced poverty but inequalities remain
Strong growth since the mid-1990s has raised GDP per capita by over 5% per year (Figure 1.A). The acceleration of structural reforms since 2014 and the move towards a rule-based policy framework have brought a new growth impetus and improved the outlook:
-
The reaffirmation of fiscal rules and the implementation of inflation targeting have improved predictability of macroeconomic policy and policy outcomes.
-
Licenses for oil, gas fields and coal mines have been auctioned under clear rules, thus ending the practice of discretionary allocation.
-
In the context of the Make in India initiative, foreign direct investment (FDI) rules have been changed, reducing the share of FDI inflows requiring government approval.
-
The simplification of administrative requirements, the scrapping of obsolete laws, the modernisation of bankruptcy laws, the removal of specific tax reliefs and greater reliance on e-government are improving the ease of doing business and reducing administrative delays, uncertainty and corruption.
-
Discretionary and earmarked grants from the central government to the states have largely been replaced by a higher tax share, empowering the states to experiment and tailor policies to local needs. A ranking system for the states on the ease of doing business has been introduced.
-
The implementation of a goods and services tax (GST), to replace a myriad of consumption taxes, could be a game-changer over the medium-run: it will help make India a common market and promote investment, productivity and competitiveness.
The pace of reform is quite remarkable given the complexity of the federal structure of government and the diversity in terms of culture, languages, geography and level of development across the country.
Growth has also become more inclusive as about 140 million people have been taken out of poverty in less than 10 years (Figure 1.B). India has relied on large welfare programmes including price-support for food, energy and fertilisers and has the world’s largest programme guaranteeing the “right to work” in rural areas. The on-going reform of these schemes towards better targeting of those in need, reducing administrative costs and corruption, and supporting financial inclusion could serve as best practice for many emerging economies. However, many Indians still lack access to core public services, such as electricity and sanitation. Public spending on health care, at slightly more than 1% of GDP, is low (OECD, 2014). Although almost all children have access to primary education, the quality is uneven. Female labour force participation remains low (OECD, 2014). However, some other indicators of gender equality have improved, such as female life expectancy at birth (which is now greater than that of men) and participation in education. Deprivation is pronounced in rural areas and urban slums although some states have performed better to reduce poverty.
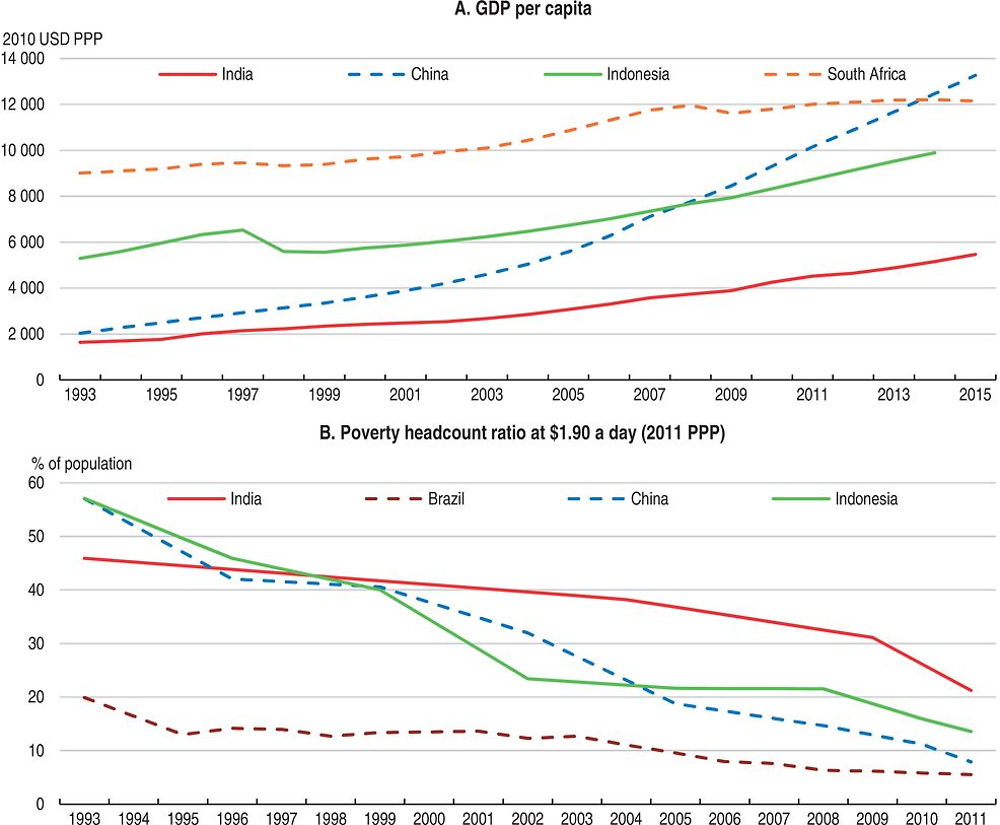
Source: OECD Economic Outlook 100 database; Central Statistics Office; World Bank World Development Indicators database.
A comprehensive tax reform should help to raise more revenue to finance much needed social and physical infrastructure, promote corporate investment, enable more effective redistribution and strengthen the ability of states and municipalities to better respond to local needs. The implementation of the landmark GST reform will contribute to make India a single market. By reducing tax cascading, it will boost India’s competitiveness, investment and job creation. The GST reform is designed to be initially revenue-neutral. It should be complemented by a reform of income and property taxes (Chapter 1).
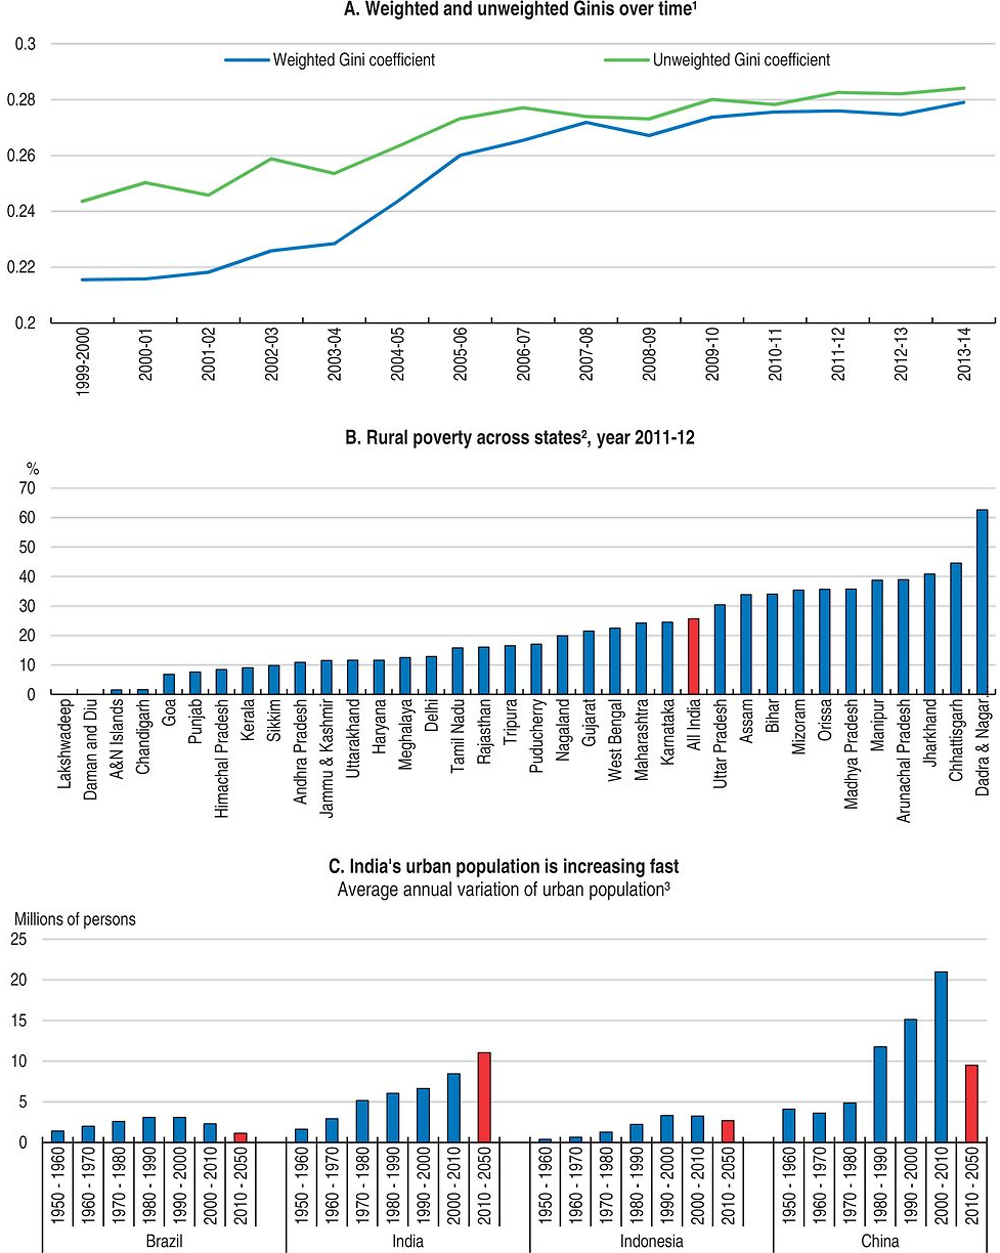
Achieving strong and balanced regional development is also key to promote inclusive growth. Inequality in income and in access to core public services between states and between rural and urban areas is large (Figure 2). Recent changes in India’s federalism model have given states more freedom and incentives to modernise regulations and tailor their public policies to local circumstances. Evidence regarding experimentation at the sub-national government level is rich and can serve to identify best practices (Chapter 2). Ranking states on the ease of doing business is opening a new era of structural reforms at the state level and will help unleash India’s growth potential. Raising living standards in poorer states would also require increasing productivity in the agricultural sector. As employment in the agricultural sector declines, urbanisation will gather pace. However, exploiting cities’ potential for job creation, productivity gains and improving the quality of life would demand better urban infrastructure.
1. The population data are from Census 2001 and 2011. For the other years, population was estimated by linear interpolation and extrapolation.
2. Poverty is calculated by using the Tendulkar methodology, which expresses the poverty line in terms of monthly per capita consumption expenditure based on a mixed reference period.
3. Forecasted data are shown in red.
Source: Reserve Bank of India; Central Statistics Office; NSSO; and United Nations, Department of Economic and Social Affairs, Population Division (2014).
Overcoming remaining structural bottlenecks would help maintain rapid growth and make it more inclusive. One of the key challenges is to create more and better jobs for the 1 million people entering the labour force every month. Less than 10% of the workers are covered by social insurance and labour laws and job creation in the formal sector has been slow over the past decade. Demographics will favour labour force growth up to 2040, as the population is relatively young and the labour market participation of women is still low. Furthermore, existing and new labour resources should gradually shift from the low-productivity agricultural sector and small/unorganised activities to the more productive manufacturing and service sectors. Meeting the aspiration of the growing labour force and reducing inequality arising from the labour market would require modernising labour laws and investing in skills.
Against this backdrop, the main messages of this OECD Economic Survey of India are:
-
Prosperity is rising quickly, but growth has not been sufficiently inclusive on a number of dimensions, as reflected in a still high poverty rate.
-
Comprehensive tax reform, building up on the recently passed Goods and Services Tax, would lift all boats.
-
Reducing the wide dispersion in living conditions across states and between urban and rural areas call for higher agricultural productivity, improved urban infrastructure, and liberalised product and labour markets.
India is growing fast, but private investment is weak
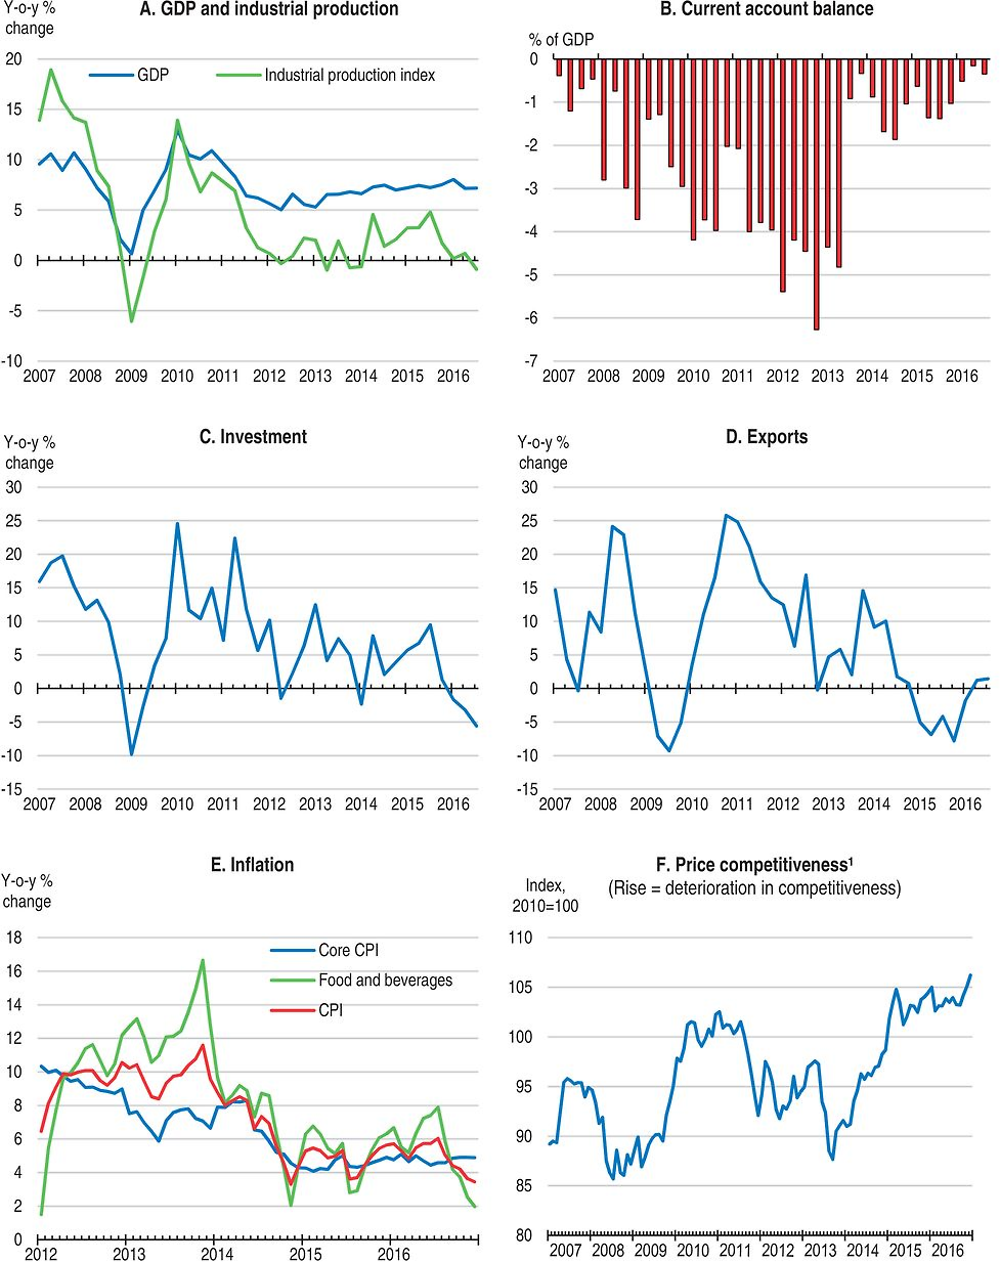
Economic growth has recovered since 2014 and India has become the fastest-growing G20 economy, with annual growth rates around 7.5% (Figure 3.A). Private consumption in urban areas has been buoyed by prospects of higher public wages and pensions while government investment and consumption remained strong. The return to a normal monsoon in 2016, after two consecutive years of bad weather, is supporting a recovery in agricultural income and rural consumption. The demonetisation has impacted consumption and other macroeconomic parameters, at least temporarily (Box 1). Despite sustained public investment, total investment declined in real terms in the first half of 2016 (Figure 3.C). Exports fell in the second half of 2014 and 2015 as external demand was weak and the real effective exchange rate appreciated. The hike in excise duties on precious metals, combined with the drop in demand from oil exporting countries, also hurt jewellery exports which account for 15% of total merchandise exports. However, exports bounced back early in 2016 and export orders are growing.
On November 8th 2016, the Prime Minister announced that existing INR 500 and 1000 notes (about USD 7.5 and 15 respectively) would cease to be legal tender on the same day. About 86% of the total value of notes in circulation were thus “demonetised”. However, persons holding notes were allowed to deposit these notes in their bank or post office accounts up to December 30th.
“Demonetisation” complements the many initiatives recently taken by the government to fight against corruption and the so-called “black money” and to reduce tax evasion. These include: agreements with many countries to share bank information; a 2016 law to curb benami transactions (i.e. properties purchased in the name of others) often used to deploy black money earned through corruption; and the scheme introduced for declaring black money after paying a penalty (tax amnesty for undisclosed income and assets).
Implementing the demonetisation has had transitory and short-term costs but should have long-term benefits. The temporary cash shortage and wealth destruction, as fake currency and part of the illegal cash will not be redeemed, have affected in particular private consumption. In the event, most institutions (including the OECD and RBI) have revised down growth projections for FY 2016-17 and FY 2017-18. The shift towards a less cash economy and formalisation should however improve the financing of the economy and availability of loans (as a result of the shift from cash to bank deposits) and should promote tax compliance.
1. Real effective exchange rates based on consumer prices. Differences in productivity gains are not reflected.
Source: OECD Economic Outlook 100 database; and Reserve Bank of India.
Robust growth has been accompanied by a rapid decline in inflation and the current account deficit. As net commodity importer, India has benefitted significantly from the fall in commodity prices, which has lowered pressures on inflation, on the current account deficit and on public spending via lower subsidies. Inflation pressures have been further contained by lower increases in minimum support prices vis-à-vis the past, the active management of food stocks to avoid spikes in food prices, still low capacity utilisation in the industrial sector, and the change in monetary policy framework aimed at anchoring inflation expectations. The decline in merchandise imports - reflecting weak (import intensive) business investment, lower demand for gold and large terms of trade gains - has contributed to keeping the current account deficit below 2% of GDP. Net foreign direct investment has rebounded and will likely more than fully finance the current account deficit in 2016.
The investment to GDP ratio has been on a downward trend for some years. Recently, low capacity utilisation and the weak financial position of some corporations have damped corporate investment. Several factors have added to these cyclical factors. First, the banking system has been weakened by poorly performing public banks, which suffer from high non-performing loans (see below). Banks also labour under the Statutory Liquidity Ratio, which requires them to hold the equivalent of 21.5% of their deposits in government securities. This reduces government funding costs, but distorts financial markets and limits lending to the private sector. Alternatives to bank funding, in particular a corporate bond market, are underdeveloped in India. Second, infrastructure bottlenecks (e.g. frequent power outages) coupled with the often long land acquisition process, have held back investment, in particular in the manufacturing sector (OECD, 2014). Third, taxation is an issue, with relatively high corporate income tax rates combined with frequent and lengthy tax disputes (Chapter 1). Fourth, the government has substantially deregulated foreign direct investment (FDI) in several sectors over the past two years. FDI inflows (foreign residents’ net buying and selling in India) have increased from USD 31 billion in financial year (FY) 2013-14 to USD 45 billion in FY 2015-16 as revealed by the Reserve Bank of India. However, restrictions on FDI were relatively stringent in 2016 compared to other BRIICS and OECD countries. Overall, chronically low investment, were it to continue, would eventually result in weaker productivity and growth.
India’s exposure to changes in global financial and trade conditions is relatively low. Household borrowing has increased, partly reflecting financial deepening, and has underpinned private consumption and the construction sector. Household debt is only 9% of GDP (Figure 4). The debt of non-financial corporations in relation to GDP is also relatively low but is highly concentrated in a few sectors (including infrastructure). Some corporations are highly leveraged (in particular in iron and steel, construction, and power sectors) and face difficulty in servicing debt. On the external side, the current account deficit has declined considerably, arising in part from a decline in oil prices and lower imports of capital goods and gold. India’s external liabilities are lower than in many EMEs, although a large share is denominated in foreign currency, and foreign exchange reserves have been replenished after the attack on the rupee in 2013.
Growth is projected to remain strong. The gradual implementation of the recommendations of the 7th Pay Commission will raise public wages and pensions by an estimated 16% to 23%. This is expected to continue to support consumption (Table 1). Private investment will pick up to some extent as excess capacity diminishes, deleveraging by corporates and banks continues and infrastructure projects mature. Inflation is projected to continue to decline, as the effectiveness and credibility of monetary policy strengthen and better weather conditions reduce pressures from food inflation. The gradual recovery in (import-intensive) corporate investment and lower remittance flows will weigh on the current account deficit. Robust FDI inflows should however mitigate India’s external vulnerability. The implementation of the Goods and Service Tax (GST, Box 2), from FY 2017-18 according to government plan, will support investment and competitiveness over the medium-term, raising GDP growth by 0.5 to 2 percentage points according to estimates (NCAER, 2009; Government of India, 2015c) even though it may have short-term adverse effects on inflation and consumption.
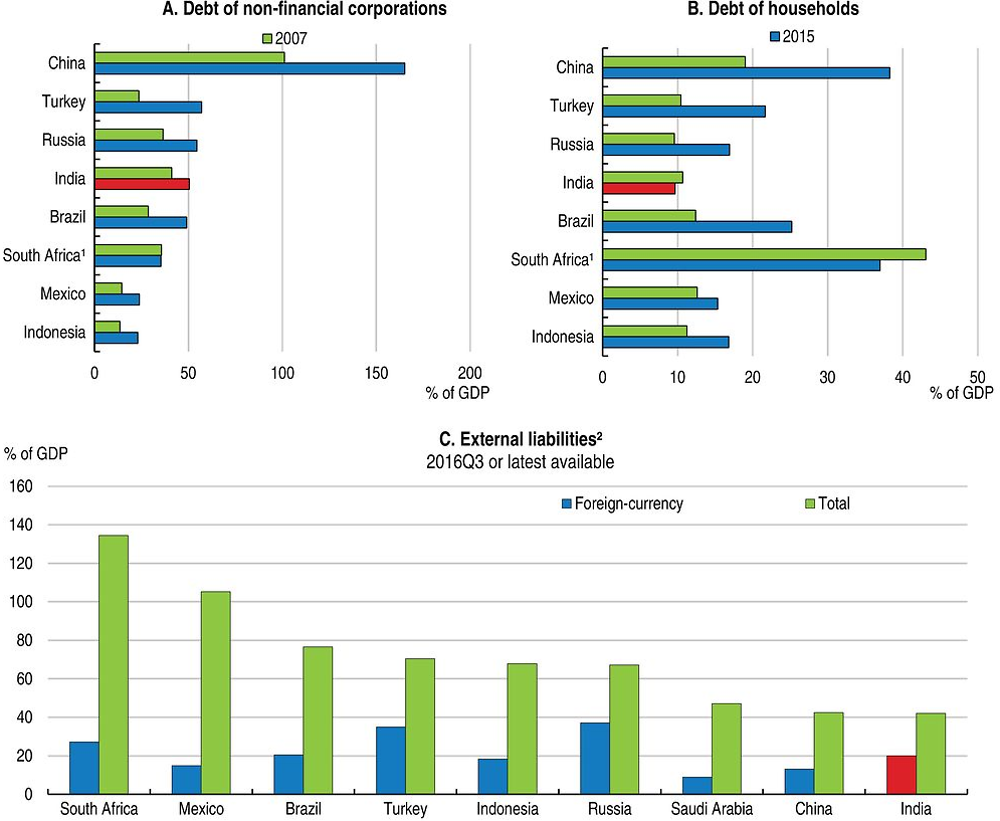
1. Data for South Africa refer to 2008 instead of 2007.
2. Foreign-currency external liabilities are approximated by the sum of a positive difference between debt securities issued by nationals and residents from the BIS debt securities database (a proxy for off-shore external bond liabilities) and external liabilities for financial derivatives and other investments (the latter includes bank loans) from the IMF international investment position database.
Source: Bank for International Settlements; and OECD calculations.
Key objectives of the GST
The GST will replace various taxes on goods and services levied by the central government and states by a single tax on value added. It will thus reduce tax cascading, facilitate a common national market, encourage voluntary tax compliance, reduce tax collection costs, support investment and improve competitiveness. All taxpayer services, such as registration, returns and payments will be available online, which would make compliance easy and transparent.
The GST reform is intended to be revenue neutral although it may affect the allocation of revenue both across states and between states and the central government. However, the central government has committed to compensate states fully for any loss in revenue they suffer in the five years following the implementation of the GST.
Designing the GST
The GST Council has been constituted, with a two-thirds vote share for the states. It is responsible for recommending tax rates, exemptions, threshold limits and special provisions for certain states and devising the mechanism for resolving disputes.
A four-rate structure has been proposed: 6% on essential items; two standard rates at 12% and 18%; and a higher rate of 26% on luxury goods. A tax over and above 28% will be imposed on some luxury, sin and demerit goods (including sodas, tobacco and luxury cars). There will be about 100 items exempted (mainly food). Petroleum products, alcohol, electricity and real estate are excluded. Firms with a turnover of less than INR 2 million (about USD 30 000) will be exempted except in the North-eastern states where a lower exemption limit of INR 1 million will apply. The complex rate structure creates the possibility of mis-declaration to benefit from lower rates or exemptions.
Administrative control will be split between the central government and the states. States will assess 90% of the businesses with an annual turnover of INR 15 million or less (about USD 221 thousand) while the central government will assess the remaining 10%. States will assess 50% of the larger businesses, with the remaining 50% assessed by the central government.
Next steps to implement the GST
The government’s objective is to introduce the GST from July 2017 as the existing system of indirect taxation is due to lapse in September 2017. The IT infrastructure is being developed and tax officers will have to be trained. Consultations, workshops and training sessions for the industry, traders, staff and all other stakeholders involved have begun.
India faces risks, some of which are hard to quantify (Table 2). Further structural reform is a clear upside risk for growth. Some states (including Maharashtra, Madhya Pradesh and Rajasthan) have taken the lead in reforming land and labour market regulations but it is still unclear whether others will follow up. There are also downside risks. Although the government is hopeful, rolling out the GST by April 2017 is an ambitious objective. Any slippage would risk delaying the investment recovery. The increase in public wages entails a risk for inflation, although this risk is limited given the small share of employees in the public administration in total employment (less than 2%) and the fact that implementation at the state level can be expected to be spread over some time. Risks to the banking sector remain elevated due to continuous deterioration in asset quality, low profitability and liquidity (RBI, 2016d). Slower efforts to clean up banks’ balance sheets and recapitalise public banks would raise uncertainties and have bearing on investment. Some risks are interconnected. If the Reserve Bank of India increases interest rates to address the inflation risk, the sustainability of corporate debt could be affected. India is not immune to external shocks and fragilities in the global economy. An increase in commodity prices could raise inflation, dampen private consumption and weigh on both the current account and fiscal deficit. India's largest export market is the United States (about 15% of merchandise exports) while China accounts for less than 4% of total merchandise exports. India’s economic performance is more sensitive to weather conditions than many other emerging economies since the agricultural sector still accounts for about 18% of GDP and almost 50% of total employment.
Monetary, financial and fiscal policies to set the foundation for stronger growth
A successful monetary policy framework
A flexible inflation targeting policy was implemented in 2015, as recommended in the previous OECD Economic Survey (OECD, 2014). The 2015 Agreement on Monetary Policy Framework between the government and the Reserve Bank of India (RBI) defined the price stability objective explicitly in terms of the target for inflation – as measured by the consumer price index – in the near to medium term: below 6% by January 2016 and at 4% (+/- 2%) for the FY 2016-17 and all the subsequent years. The 2016 amended RBI Act specified that the government, in consultation with the RBI, will set the target level once every five years. Although the 4% inflation target is ambitious given the rather long history of high inflation, it is consistent with economic studies on the maximum rate of inflation non-detrimental to growth in India (Mohanty et al., 2011).
The framework has been strengthened by the creation, in 2016, of a Monetary Policy Committee vested with monetary policy decision-making, which increases the operational independence of the RBI. The Committee is made up of the RBI governor, two others from the central bank and three representatives from the government, appointed for 4 years. The RBI governor holds the deciding vote in case of a tie.
The new framework and a more prudent policy stance have served India well so far. Confidence in the new monetary policy framework has contributed to curbing inflation expectations (Figure 5.A; Chinoy et al., 2016), to stabilising the rupee, and to attracting foreign capital. As inflation pressures have declined, the RBI has cut policy rates from 8% in December 2014 to 6.25% in October 2016. However, inflation has hovered above 5% and reaching the inflation target remains challenging going forward, especially if public sector wage rises spill over to other sectors or if commodity prices rebound. Bringing down inflation expectations further and establishing a solid nominal anchor to the Indian economy require monetary policy to continue erring on the prudent side until inflation clearly goes back close to the mid-range 4% target. This stance is also consistent with a Taylor rule (Figure 5.D). Overall, some monetary impulse is still to come as monetary policy transmission improves.
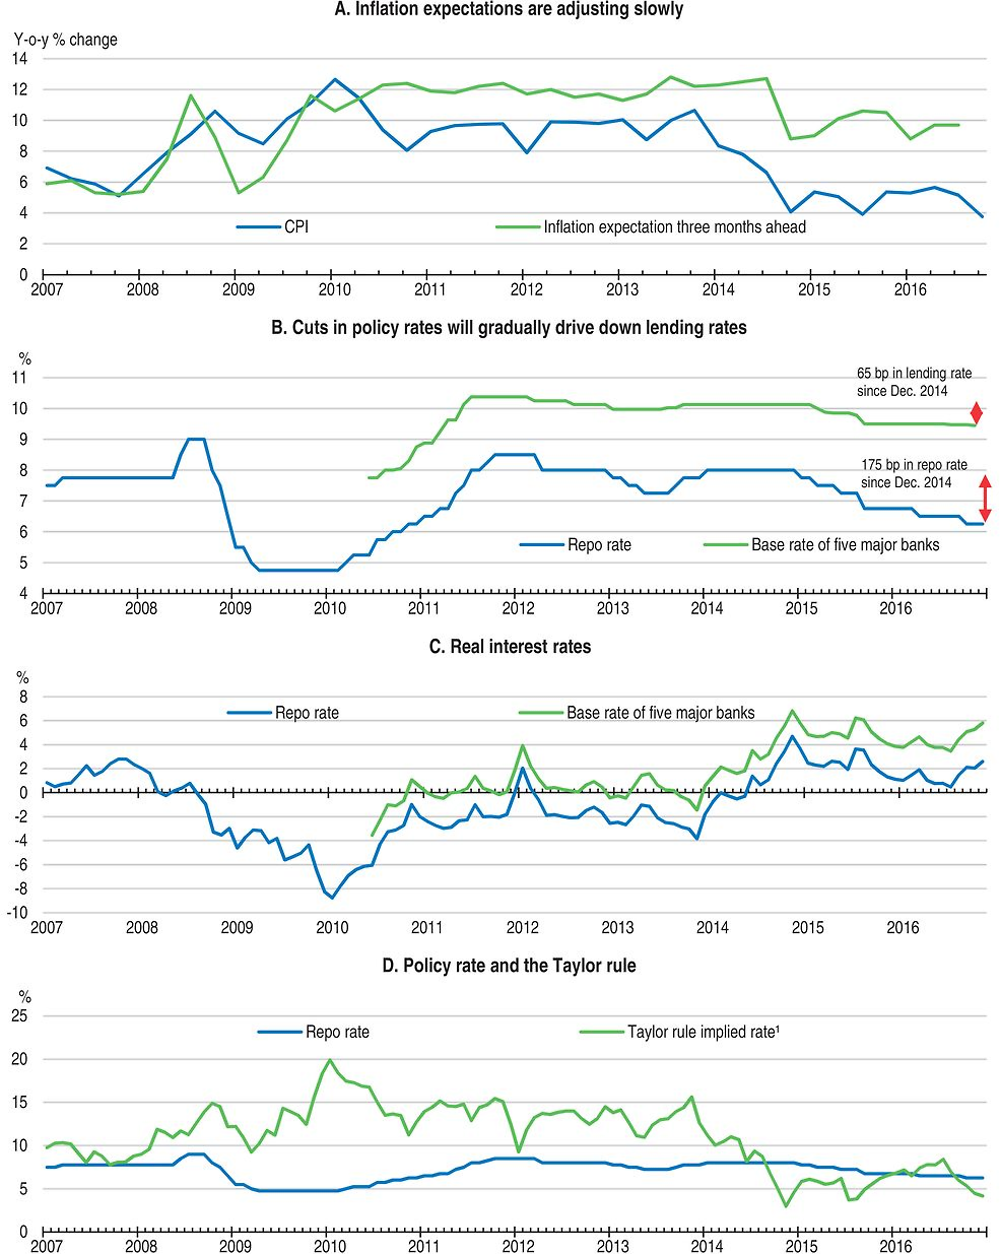
1. The Taylor rule is: nominal interest rate = real natural interest rate + inflation rate +0.5 (inflation gap) + 0.5 (output gap); the inflation target is taken to be 6% before February 2016 and 4% since February 2016; the natural interest rate is taken to be 1.75%, as suggested by Kumar Behera et al. (2015).
Source: Reserve Bank of India and OECD calculations.
Improving monetary policy transmission
Since 2014 lending rates have adjusted only partially to the decline in policy rates (Figure 5.B). The impact of monetary policy on real activity is reduced by weaknesses in the transmission mechanism, including administrative measures such as the requirement for banks to hold government bonds (the Statutory Liquidity Ratio, SLR), credit quotas for priority sectors and caps on deposit rates. Several measures have recently been taken to improve monetary policy transmission including: the deregulation of interest rates offered on small saving schemes, incremental cuts in the SLR, the reduction in the daily cash reserve ratio that banks must keep with the central bank, and regulatory changes to force banks to rely more on the marginal cost of funding when calculating lending rates. Easing further regulatory requirements on banks to hold public bonds and lend to priority sectors would strengthen transmission and reduce distortions in the banking system. This would also support the development of the corporate bond market.
Financial sector issues: improving banks’ health and promoting the corporate bond market
Banks’ stressed assets (including non-performing loans and restructured assets) have increased in recent years, reaching 12.3% of GDP in September 2016 (Figure 6.A). The increase in NPLs largely reflects greater recognition of them, rather than a further deterioration of underlying fundamentals. The RBI launched an Asset Quality Review (AQR) to identify stressed loans and ensure that banks were taking proactive steps to clean up their balance sheets (Rajan, 2016). Non-performing loans (NPLs) largely originate from delays in infrastructure projects and weaknesses in risk management (RBI, 2015a and 2015b; IMF, 2015 and 2016; Gynedi, 2014). Iron and steel and power industries are characterised by both high leverage and interest burden (RBI, 2016d). As such, many NPLs are backed by “real” assets which can be expected to become profitable when projects are completed. Public banks, which hold 70% of total commercial banking sector assets, hold an outsized share of NPLs (Figure 6.C).
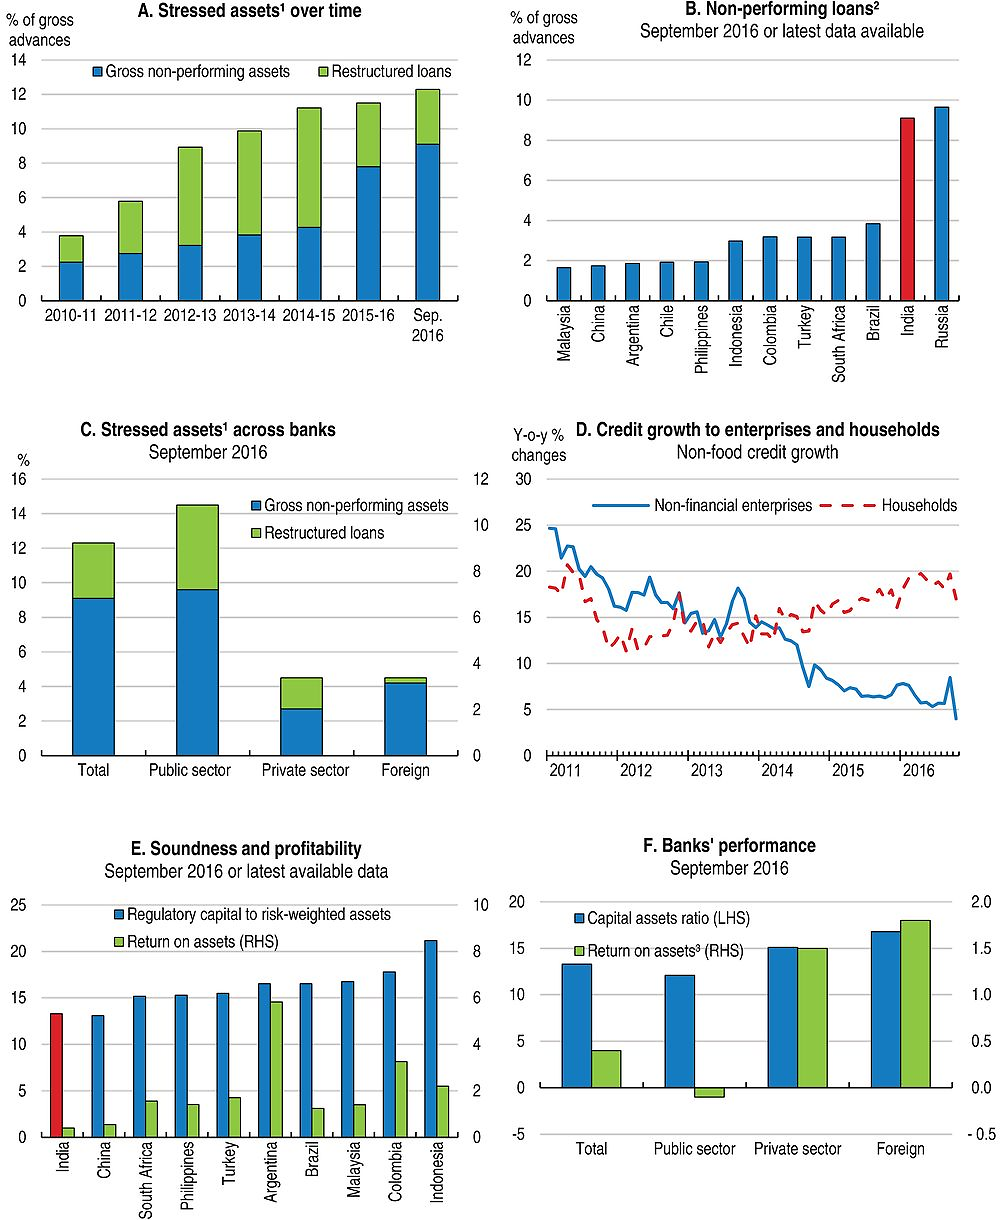
1. In percentage of gross advances. A restructured asset is an asset whose terms have been modified, including alteration of repayment period, repayable amount, instalments and rate of interest.
2. Ratio between non-performing loans (NPL) and total loan portfolio. NPLs are loans which ceased to generate income for the bank.
3. Return on assets is the net profit generated on total assets.
Source: Reserve Bank of India for panels A, C, D and F; IMF Financial Soundness Indicators database for panels B and E.
Measures have been taken recently to promote swift resolution of NPLs (Table 4), in line with recommendations in the previous OECD Economic Survey of India (OECD, 2014). The RBI has established a large borrower database for loans over INR 50 million, and banks need to regularly report on the status of loans. To give creditors more control over the stressed entity, the Strategic Debt Restructuring scheme introduced in June 2015 required all lenders to meet in a Joint Lending Forum and allowed secured creditors to convert loans to equity. The scheme for sustainable structuring of stressed assets (S4As) launched in June 2016 allows banks to convert up to half of corporate loans into equity-like securities, with banks working under the oversight of an external agency ensuring transparency. Foreign direct investment in asset reconstruction companies has been deregulated in 2016. A new bankruptcy code has been passed and is being implemented. The government also established six new Debt Recovery Tribunals. To curb banks’ exposure to large stressed corporate entities in the future, the RBI announced in August 2016 that banks will have to set aside higher provisions and assign higher risk weights for loans to large companies beyond a certain limit from April 2017. The Indian authorities should closely monitor these measures for their efficacy in speeding up resolution, and take remedial action where necessary.
Capital ratios of Indian banks, in particular public banks, are low in international comparisons (Figure 6.E and 6.F). The RBI publishes the results of stress tests twice a year. It concluded that, in aggregate, the banking sector can endure a crisis (RBI, 2016d) as the capital to risk-weighted assets ratio would remain above the regulatory threshold of 9% under the extreme scenario of a three standard deviations shock to NPLs. Yet, the stress test revealed that 23 banks – holding 41% of banks' total assets - might fail to maintain the required capital ratio. Performance of public banks is even worse, as the capital ratio of 20 of them (out of 26) is likely to fall below 9%. To reduce uncertainty, the stress tests results should be reported for individual banks.
Banks will need more capital to safeguard financial stability and meet Basel III requirements. According to the Indradhanush plan of the government, banks will need INR 1.8 trillion (1.4% of 2014-15 GDP) by end-March 2019 for this purpose. Capital transfers from the central government will finance part of the needs (INR 0.7 trillion). To avoid overburdening the budget, privatisation option could play a role and will require the government to lower the current 51% threshold below which the government share in public banks cannot fall, though golden shares could be used to ensure some degree of government control. The on-going consolidation process among public banks is welcome and should continue. However, some banks may need to be closed down or merged with other banks.
To provide adequate capital to the public sector banks and improve governance, the government launched the “Indradhanush” programme. This programme separates the posts of chairman and managing director, revamps the procedure for selecting independent directors and sets up the bank board bureau (a body of professionals and officials which started functioning in 2016) to replace the existing appointment board. This makes the recruitment for senior management of public banks more transparent. Efforts have also been made to increase public bank autonomy and strengthen their accountability. However, recruitment and wage setting remain subject to public sector rules which can make it difficult for the public banks to compete with the private banks in attracting talents.
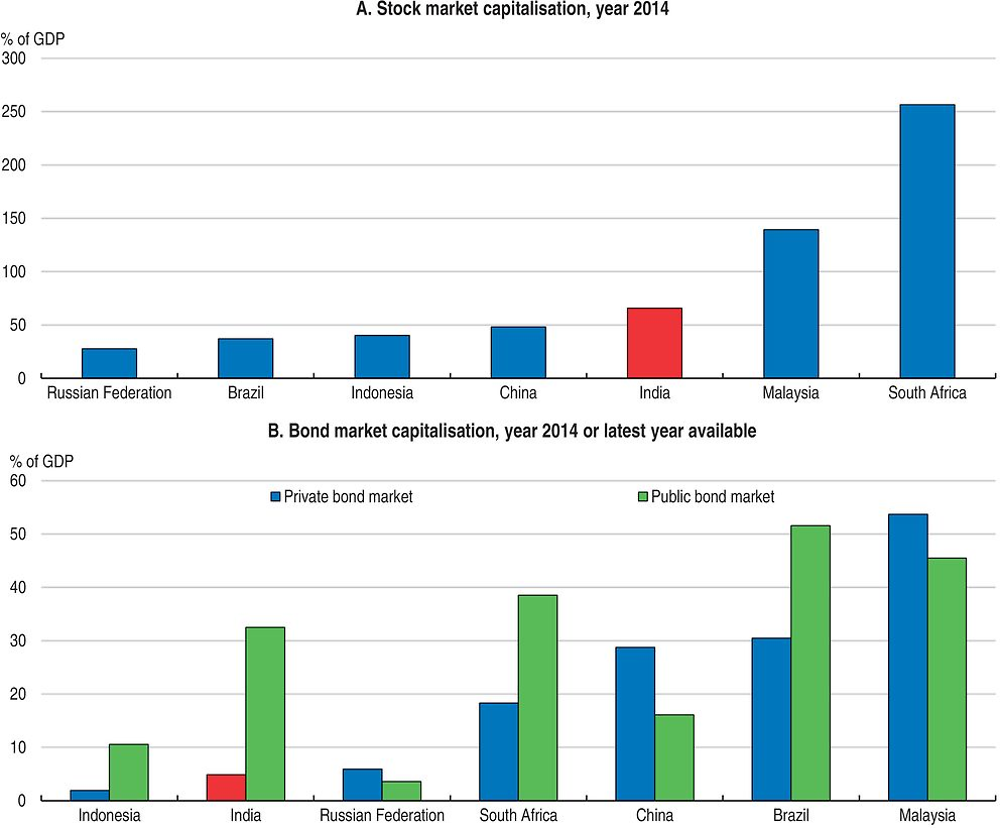
A more dynamic corporate bond market would support investment projects. Bond market capitalisation is relatively limited and dominated by public bonds (Figure 7). Domestic institutional investors, such as pension funds and insurance companies, have to hold a large share of their assets in government bonds. Foreign institutional investors face limits on corporate bond holdings which restrains the amount of long-term and stable money which could fund infrastructure investment projects. So-called “Masala bonds” – i.e. rupee-denominated bonds issued in the overseas market – were issued for the first time in 2016. To support the development of the corporate bond market further, the authorities should relax the restrictions on domestic and foreign investors as recommended in the 2014 OECD Economic Survey of India (Table 4). Implementing the recent RBI proposal to accept corporate bonds as collateral under the liquidity adjustment facility would also contribute.
Source: World Bank Financial Development and Structure Dataset.
Strengthening the fiscal framework
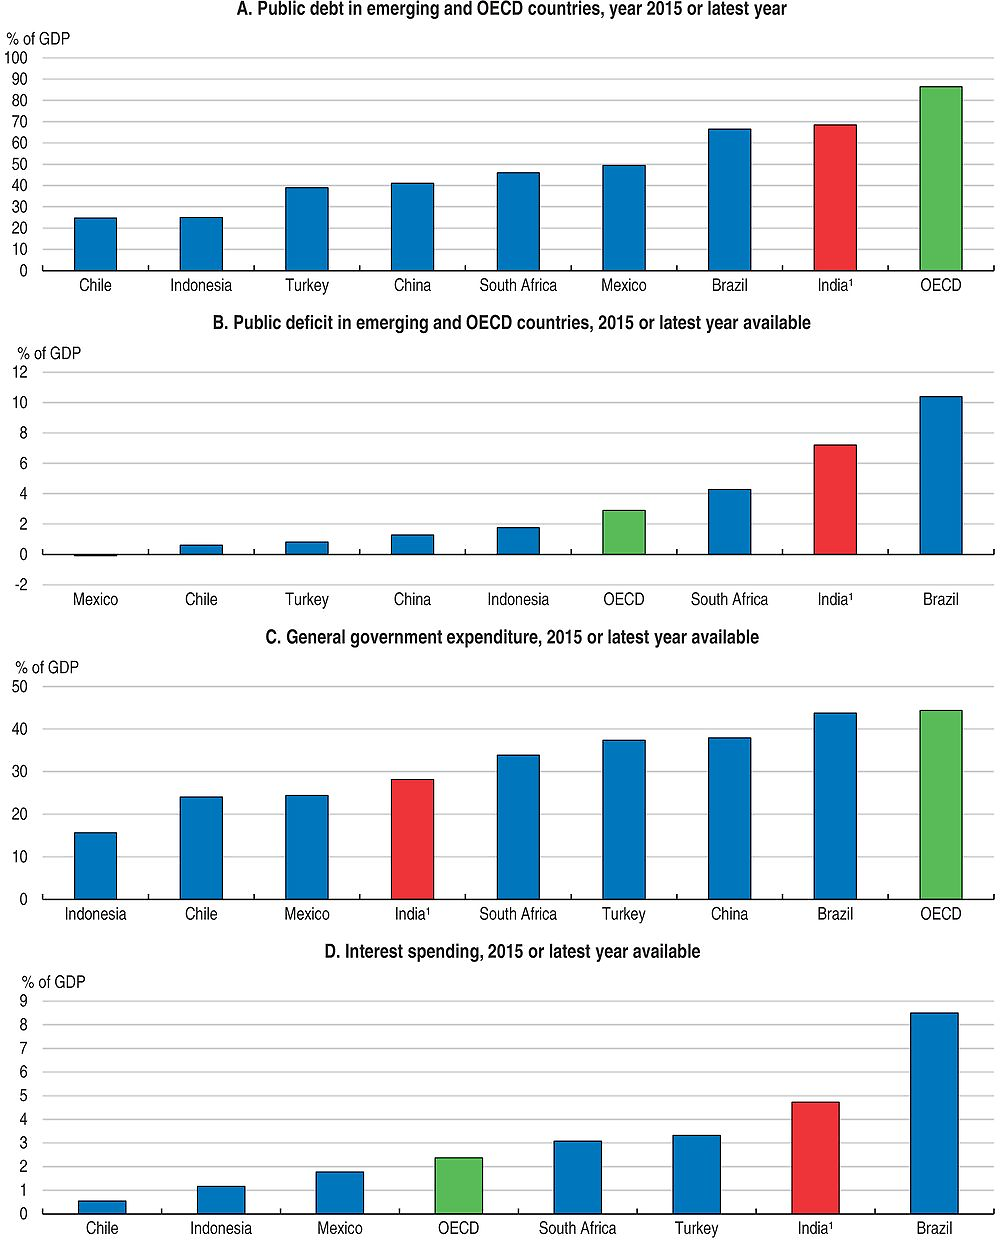
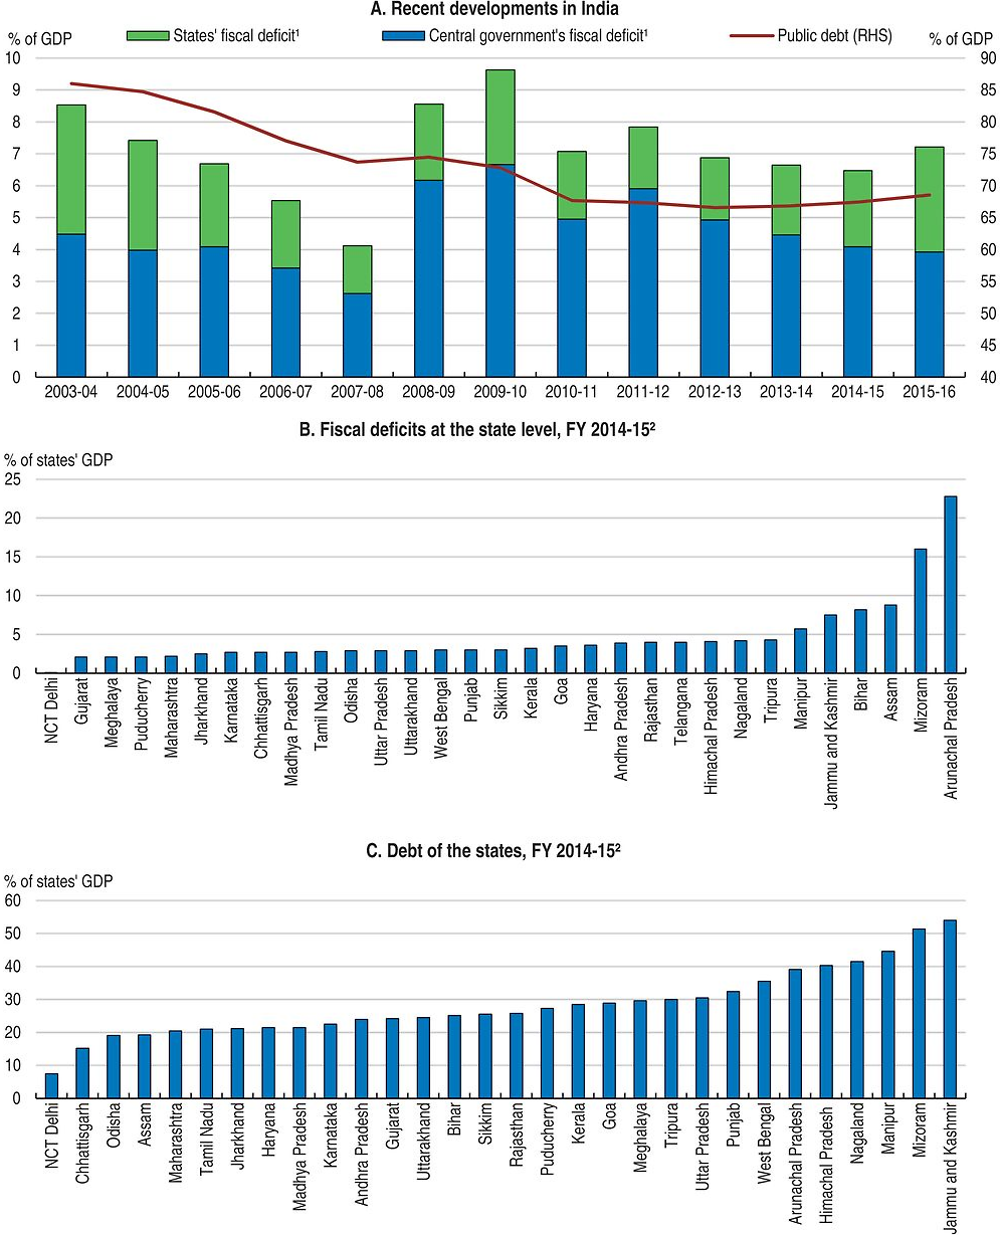
India’s public debt is high compared with other emerging economies (Figure 8.A) and interest payments account for a relatively large share of overall spending (Table 3). Public debt is largely denominated in rupees, reducing external vulnerabilities. Fiscal consolidation has been pursued by central government since FY 2012-13 and its deficit declined from 4.9% in FY 2012-13 to 3.9% in FY 2015-16. The government took advantage of low oil prices to eliminate diesel subsidies, to better target other subsidies (in particular for cooking gas) and to raise excise duties on petrol, diesel and coal. The service tax rate was raised from 12 to 15% (including the new Clean India earmarked tax). Dividends paid by public enterprises also increased. However, the deficit for the states has risen, resulting in an increase in the combined deficit and debt to GDP ratio (Figure 9.A), although there are large variation in fiscal positions across states (Figure 9.B).
1. Data for India are revised estimates by the Reserve Bank of India for the fiscal year 2015-16.
Source: OECD Economic Outlook 100 database; Reserve Bank of India; Brazilian ministry of economy; and World Bank World Development Indicators database.
1. Data for the fiscal year 2015-16 are revised estimates by the Reserve Bank of India.
2. Revised estimates by the Reserve Bank of India.
Source: Reserve Bank of India, September 2016 Monthly Bulletin; Controller General of Accounts; and Reserve Bank of India.
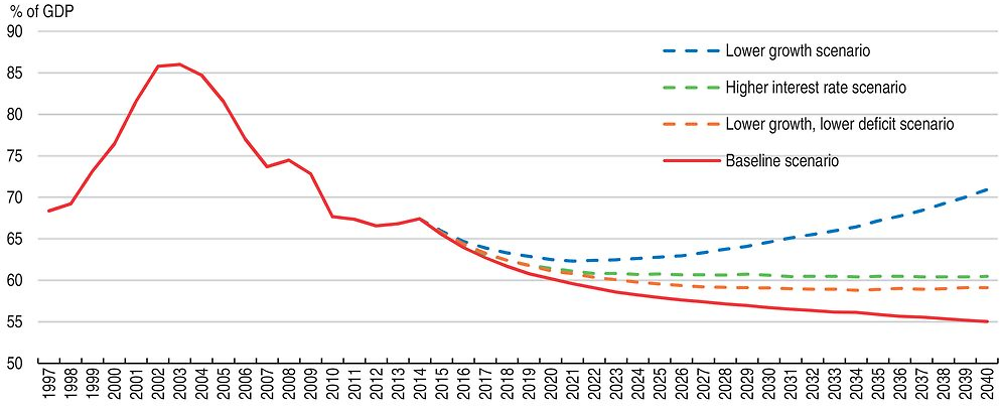
General government debt declined from 86% of GDP in FY 2003-04 to 69% in FY 2015-16, despite relatively large primary deficits, owing to the Statutory Liquidity Ratio, which holds down interest costs, and robust economic growth. Debt sustainability depends on growth, inflation, interest rates and fiscal policy (Figure 10):
-
In the baseline, “no policy change”, scenario, the primary deficit stays at 2.5% GDP (its level in FY 2015/16), inflation at 4%, real long-term interest rates of 2¾% (the average 10-year bond real rate in 2015 and the first half of 2016), and economic growth at 7.5%. The debt to GDP ratio declines to 55% of GDP in 2040.
-
If nominal interest rates were to rise gradually by one percentage point by 2025, the debt to GDP ratio would still decline to 60% of GDP in 2040.
-
However, if real GDP growth were to fall gradually to 5% by 2040, and no policy changes, the debt-to-GDP ratio would rise.
-
Even in this lower growth scenario, the public debt would stabilise at slightly below 60% of GDP if the primary deficit were gradually reduced by one percentage point of GDP.
Source: OECD calculations; and Joumard et al. (forthcoming A).
The central government Budget for FY 2016-17 targets a further reduction in the central government deficit to 3.5% of GDP. The recent increase of 16% to 23% in public wages and public employees’ pensions, as suggested by the Pay Commission (in India, the public wage structure is revised every 10 years), will increase central government spending for FY 2016-17 by an estimated 0.4% of GDP. Spending priority has also been given to the rural sector, recapitalising banks, and raising infrastructure spending on nuclear and renewable energy, roads, railways and ports. The financing of a large investment projects through public enterprises, i.e. off-budget, receipts from privatisation and the auction of telecom spectrum, as well as new efficiency gains stemming from the subsidy reform has helped contain the central government deficit. Still, the cost for a subset of commodities and services that the government subsidises is estimated at 4.2% of GDP (Government of India, 2015a) although a lower amount appears in the budget (1.8% of GDP for FY 2015-16).
Debt sustainability analysis highlights possible outcomes and risks going forward (Box 3). The current fiscal stance of a primary deficit of 2.5% of GDP will put the debt-to-GDP ratio on a declining path, assuming growth remains high (7.5%) and interest rates on the public debt do not rise (the baseline in Box 3). Even if interest rates were to rise somewhat, the debt-GDP ratio would still decline. However, a significant fall in growth would require tighter fiscal policy to keep the debt-GDP ratio from rising steadily (the last two scenarios in Box 3). Some tension may appear in that the Statutory Liquidity Ratio holds down public debt costs, but may also undermine growth by weakening the financial system. Public finance risks are underlined by India’s debt ratings, which are at the lowest investment grade. Against this backdrop, debt should be brought down gradually (in relation to GDP), which may well require some fiscal tightening, as the central government plans to do as reflected in the draft budget for FY 2017/18 (Box 4).
The FY 2017/18 draft Budget presented on February 1st, 2017, foresees a small further decline in the central government deficit from 3.5% of GDP in FY 2016/17 to 3.2% in FY 2017/18 (slightly higher than the previous 3% target).
Key measures include:
-
An increase in infrastructure spending, in particular transport (roads, railways and airports) and social housing.
-
New efforts to recapitalise banks, although the amounts is lower than in the previous year (INR 100 billion in FY 2017/18 against 250 billion in FY 2016/17).
-
A cut in the corporate income tax rate from 30% to 25% for small companies - those with a turnover of up to INR 500 million (about USD 7.4 million); the government expects this measure to benefit 96% of Indian enterprises.
-
A more progressive personal income tax structure, with a cut in the lowest personal income tax rate from 10% to 5% and a surcharge for high-income earners. Tax forms will be simplified.
-
New measures to encourage digital payments and discourage the use of cash, including tax concessions to small companies that transact digitally, a ban on cash transactions above INR 300 000 (about USD 4450) and limits on cash donations for political funding and charitable trusts.
-
Reforms to promote FDI, including abolishing the Foreign Investment Promotion Board and less stringent FDI regulations.
Institutional reforms: improving the budget process and the medium-term fiscal framework
The budget process has also been reformed to enhance public finance effectiveness. First, the budget session of Parliament started one month earlier than usual to ensure that the Finance Bill is passed before the start of the new fiscal year (April 1st). Second, the long-standing distinction between plan and non-plan spending, which resulted in a fragmented budgetary allocation and constrained the efficient management of public expenditure, has been abolished. Third, the coverage of the budget has been broadened to include the Railway budget. Fourth, the projections made by the Finance Commission form the basis for the budgetary medium-term framework.
The government also announced that it would examine the recommendations of the Fiscal Responsibility and Budget Management Committee for the medium-term fiscal strategy. The general government debt-to-GDP ratio is to become the main macroeconomic anchor of fiscal policy. The proposed roadmap requires debt to decline to 60% of GDP (40% for the central government and 20% for the states) by 2023, from 68.6% in FY 2015/16. The deficit target of the central government is to be lowered to 3% of GDP in the next 3 years. The proposed fiscal roadmap includes an escape clause in case of far-reaching structural reforms.
Committing to multi-year fiscal targets while allowing for a stabilisation role
A stronger fiscal framework would improve macroeconomic stability and provide fiscal space to finance key social and physical infrastructure. Although India’s public sector is relatively small, the heavy reliance on the corporate income tax makes revenues sensitive to the business cycle. Also, fluctuations in commodity and food prices affect India’s public spending through the large subsidy programmes for food, energy and fertilisers. The 2003 Fiscal Responsibility and Budget Management Act (FRBMA) required the central government to commit to multi-year fiscal targets, which were deferred to allow fiscal policy to react to the global financial crisis. Central government’s commitment to fiscal consolidation has been renewed, with the 2012 fiscal consolidation roadmap. The design and coverage of fiscal rules, however, remain key issues.
Contrasting with a deficit rule, a spending rule would allow the automatic stabilisers to work fully on the revenue side, where they tend to be most powerful. Public spending is low while many Indians lack access to quality public services and social insurance. Spending on infrastructure, health, education and other programmes which support inclusive growth should be given priority over less productive current spending and be allowed to increase over the medium term. But a structural increase in future spending would have to be accompanied by a structural increase in revenues. If the spending increase is planned, the revenue to pay for it should be pre-programmed.
To secure a decline in the public debt-to-GDP ratio over the medium term, fiscal consolidation efforts at the central government level need to be accompanied by fiscal prudence at a sub-national government level. Most states have their own fiscal rules (Buiter and Patel, 2010) which, in many cases, require the deficit to remain below 3% of the state's GDP (Kerala has a 2% limit). In addition, states cannot borrow on the market without central government approval. In FY 2015-16, the gross fiscal deficit for the states stood at 3.3% of GDP, compared to a 2.4% deficit according to budget number (RBI, 2016c). In 2016, states were given more flexibility in complying with the 3% rule, if they had a relatively low debt and debt service ratio in the preceding year.
Given the states’ wide-ranging spending responsibilities and their large share of tax revenue, medium-term fiscal targets should cover the states, or at least should be made consistent with states’ fiscal rules. As part of the fiscal decentralisation drive, states now receive a larger share of the general government “divisible tax pool” and rely less on earmarked grants. This should give states more autonomy to prioritise growth-enhancing spending items, such as hard and soft infrastructure. In recent years, states accounted for over 60% of total government investment spending. In the coming years, however, investment spending may be squeezed by likely wage and pension hikes and the partial takeover of the debt of states’ electricity distribution companies (3.5 % of GDP in total), affecting the quality of spending (RBI, 2016b).
Improving fiscal policy credibility
Better fiscal data help to contain fiscal risks and improve government accountability (Rastogi, 2015). In some areas, progress has been made and India fares relatively well. A Statement of revenue foregone with estimates of tax expenditures by key categories has been presented annually to parliament since the mid-2000s in the context of budget discussions. And in 2016, the government published information on the number of taxpayers per tax brackets. Nonetheless, policy would be enhanced by a number of measures (Buiter and Patel, 2010): compiling and publishing fiscal accounts for local governments; recording spending and receipts on an accrual basis rather than a cash basis; systematically reporting accounts of autonomous bodies, extra-budgetary funds and contingent liabilities; recording privatisation receipts and other asset sales not as revenue but as asset transactions (below the line) according to international accounting conventions.
To improve the government’s credibility and accountability, and watch over the implementation of the fiscal rules, India should establish an independent fiscal council. Fiscal councils exist in 24 OECD countries, including Chile and Korea, and also in South Africa. Their mandate differs widely, including the assessment of macro-economic and budgetary projections, impact of specific measures and long-term sustainability. So does their status: fiscal councils can be independent institutions (Germany and Portugal), paired with other independent institutions (Finland and France), under the legislative branch (Canada, Kenya, Korea, South Africa and the United Kingdom) or under the executive branch (Chile). Overall, evidence suggest that fiscal councils have had a positive impact on fiscal outcomes (Beetsma and Debrun, 2016; Debrun and Kinda, 2014; Debrun et al., 2013; Hagemann, 2011). International experience also suggests that independence of the fiscal council and a presence in the public debate are important for its effectiveness.
A fiscal council in India could monitor the implementation of the fiscal strategy, and in particular the consistency of the annual budgets with the medium-term path, and assess when a correction is required and at what pace. If the fiscal rules include escape clauses, the fiscal council should verify whether they are exercised in an appropriate way. This institution could carry out fiscal sustainability analysis and produce independent growth, inflation and public finance projections. It should also advise the government on how to improve the fiscal data, accounting and fiscal risk assessment.
A comprehensive tax reform to promote inclusive growth
India should raise more and better tax revenue to finance large spending needs for social and economic infrastructure. The landmark Goods and Services Tax (GST) reform will replace a large number of taxes on goods and services which currently account for the bulk of the total tax intake. It will contribute to make India a single market and, by spurring competition, it will promote productivity gains. By reducing tax cascading, it will support the manufacturing sector and investment. It is however designed to be revenue-neutral and thus does not provide an avenue for raising more revenue at least in the medium term.
A comprehensive reform of property, personal income and corporate taxes is needed to complement the GST reform. It should aim at raising more revenue to fund social and physical infrastructure in a way that support economic growth, promote social justice and empower sub-national governments to better respond to local needs.
Using personal income and property taxes to raise more revenue and promote inclusiveness
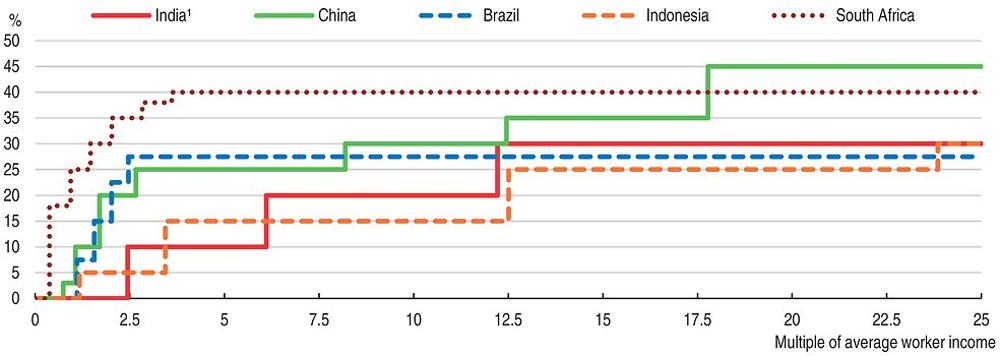
Personal income tax revenue is low and its redistributive impact is limited. As in many emerging economies, the low level of income of most people and a large informal sector pose challenges to raising revenue from this source (Table 5). Some countries, in particular South Africa, have however been more successful in engaging their population in the tax system. In India, only 53 million individuals paid personal income tax in 2014/15, i.e. about 5.6% of the population, reflecting the very large zero rate tax bracket and the exemption for agricultural income. An individual starts paying taxes when its income reaches 2½ times the average worker income in the organised sector (Figure 11). For those paying income taxes, the system embodies little progressivity since the top rate kicks in at a very high level by international standards (more than 12 times the average wage of a worker in the organised sector). A host of specific tax expenditures further reduces tax liabilities of the well-off, such as a tax allowance for the repayment of mortgage principal and interests. The taxation of capital income is low, even zero, in most cases. In addition, the Hindu Undivided Family (HUF) offers those with substantial property income an avenue to reduce their tax liabilities and complicates the implementation of an inheritance tax.
1. The average worker income is for the organised manufacturing sector as reported in the Annual Survey of Industries.
Source: Annual Survey of Industries; OECD Taxing Wages 2015; and Ministry of Finance of India.
The personal income tax (PIT) could raise more revenue and better contribute to horizontal and vertical equity. First, efforts to promote tax compliance and improve the ease of paying taxes should be strengthened. Tax compliance could be incentivised, e.g. by securing access to services (such as life insurance) to those filing a tax return for the first time. Second, agricultural income of rich farmers should be brought under the PIT ambit so to promote vertical equity and avoid tax evasion with non-agricultural re-categorised as agricultural income. The political economy of removing this exemption is however challenging. Third, most tax expenditures should be abolished since they benefit mostly the rich (e.g. tax allowance for the principal and interests of housing loans). Fourth, the PIT schedule (in particular income thresholds) could be brought more into line with other emerging economies, with more people paying taxes and top rates kicking in at a lower income level. Simulations by the OECD suggest that bringing the PIT schedule more into line with other emerging economies and abolishing tax expenditures would raise PIT revenue by at least 50% (Chapter 1).
There is also scope to raise more revenue by less distortive property taxes. Wealth in India is extremely concentrated and real estate accounts for the bulk of household assets. States levy stamp duties and registration charges on the sale of real estate, and municipalities levy some recurrent taxes. Raising more revenue from recurrent property taxes would require granting municipalities more power to implement them and set tax rates, and establishing up-to-date property values. In addition, India could introduce an inheritance tax, starting with a relatively high exemption threshold and low rates, since this would help promoting equal opportunity and inter-generational mobility (OECD, 2015d; Brys et al., 2016; Joumard et al., 2012).
Reforming company taxation to support investment by reducing distortions and improving certainty
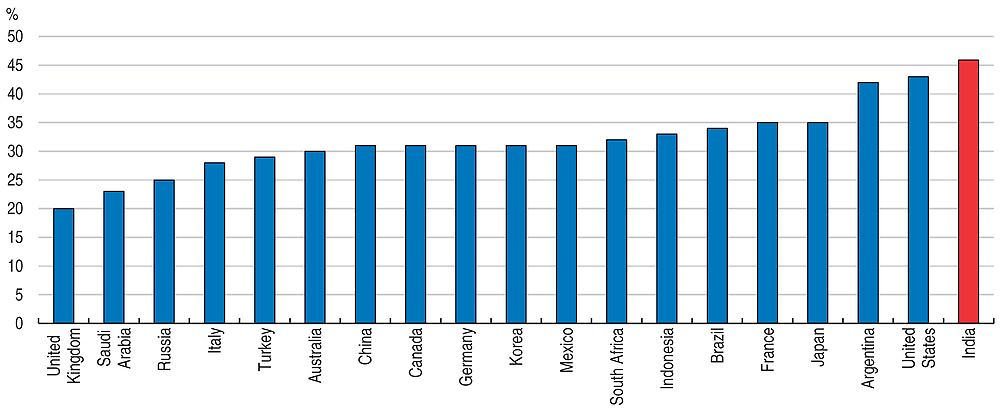
Creating a business-friendly tax environment is key to promoting investment, to raising India’s competitiveness and to creating more jobs. The statutory corporate income tax (CIT) rate, 30% plus surcharges adding to 34.6% for resident companies, is high by international standards. Enterprise surveys suggest that the high CIT rate is a major obstacle to business development. Tax concessions lower effective tax rates (to 23% in FY 2013-14) but create large variations across enterprises by size, sector and ownership. Tax concessions also raise uncertainty for investors, as tax law is often unclear and audits can be aggressive. The number of tax disputes is large and about 40% of them go through the court system, resulting in delays and further uncertainty (Thomas et al., forthcoming). Recent efforts to improve clarity in tax laws and their interpretation (e.g. on retrospective taxation) should continue so as to build a more predictable environment for investors.
The government plans an ambitious base-broadening and rate-reducing tax reform: the CIT rate for resident companies will be lowered to 25% over a five-year period and most tax concessions will be phased out as suggested in the past OECD Economic Survey of India (Table 6). The FY 2016-17 Budget introduced a reduced statutory rate for small and new manufacturing companies, but such targeted reductions should be temporary steps on the way to a single 25% rate and the elimination of most concessions (including overly generous depreciation allowances). This reform should be implemented as soon as possible.
The relatively high CIT rate makes it difficult to attract more foreign investment, as the statutory rate on foreign dividends is quite high (Figure 12). To increase India’s attractiveness, the distribution dividend tax should be replaced by a traditional withholding tax system, which may be reduced by tax treaties, and the non-resident CIT rate should be lowered to the resident rate.
Increasing the capacity and expertise of the tax administration and improving its management could help raising more revenue while making the system fairer. Many commendable measures have recently been taken to reduce the cash transactions, combat tax evasion and improve the ease of paying taxes. The government is also making efforts to clarify tax legislation and reduce the very high number of tax litigations. Still, the 2017 edition of the World Bank Ease of doing business survey indicates that India ranked 172nd out of 190 countries on the ease of paying taxes. Government’s efforts should thus be pursued to help boosting investment and growth. In particular, the audit process should be improved to reduce the number and length of tax disputes while the number of tax employees and their training should be lifted.
Source: Thomas et al. (forthcoming).
Promoting stronger and more inclusive growth
Lifting investment and productivity is essential for well-being. Making growth more inclusive also requires enabling the poor and providing equal opportunities for all. India has taken various initiatives in these directions and some of them can be considered as best practices for many other countries - the on-going reform of price support for the poor (including for cooking gas) together with financial inclusion initiatives are cases in point. However, additional reforms are needed to create more jobs in the organised sector and mitigate pressures on the environment. As agricultural employment shrinks and the working-age population grows, providing skills to match the needs of labour-intensive sectors will be also a key challenge for many years to come.
Achieving stronger long-term growth by lifting investment and productivity
India’s potential growth is high. According to OECD estimates, it stands at slightly above 7% in 2016, largely consistent with other estimates (Anand et al., 2014; Kumar Bhoi and Kumar Behera, 2016). However, it has been on a mildly declining trend since 2012, as the investment to GDP ratio dropped from 34% in 2011 to 30% in 2015 (Figure 13). Lifting investment is key to achieve stronger long-term growth. It will require: more and faster public investment to reduce infrastructure bottlenecks and crowd in private investment, faster and more predictable land acquisition, as well as further improvements in regulations towards foreign direct investment (FDI) and ease of doing business.
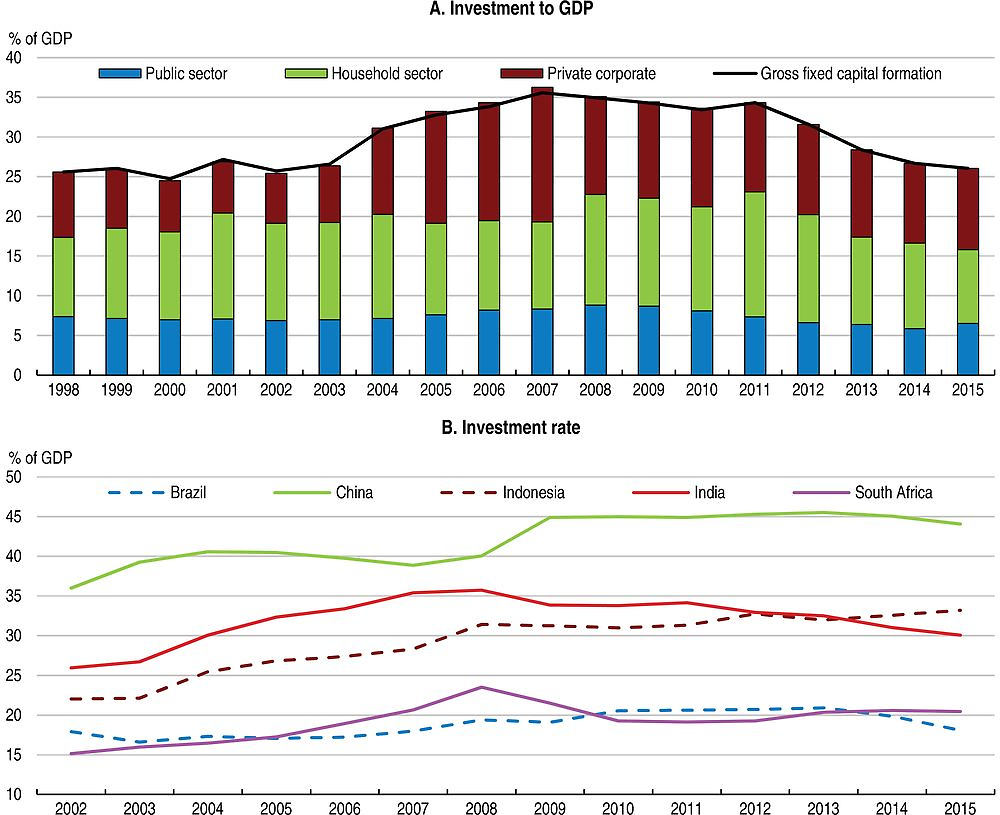
Source: OECD Economic Outlook 100 database; and Central Statistical Organisation.
More and faster public investment
To improve the quality of infrastructure and crowd in business investment, public investment has been raised, with priority given to energy and transport infrastructure. Road project awards have increased steadily since 2014 and several rail projects were approved, after years of low government investment, in particular to improve capacity to transport coal. For example, the Dedicated Freight Corridors (DFC) are ambitious rail infrastructure projects: two corridors - the Eastern DFC (1 840 route km) and Western DFC (1 502 route km) - are being constructed. The DFC project is expected to transform Indian transportation by implementing major infrastructural and operational innovations such as higher speed and carrying capacity. DFC will save 457 million tonnes of carbon dioxide in first 30 years of operation. A public-private partnership model was developed for railway stations so as to allow raising extra-budgetary funds. Investment in renewable energy, in particular solar capacity, has also surged.
To fast-track large public and private investment projects, the Project Monitoring Group has been set up in the Prime Minister’s Office to improve the coordination across levels of government, ministries and departments. The proportion of projects with time and cost overruns has declined. Average time and cost overruns for infrastructure projects remain high, however, raising the cost of capital of these companies, and ultimately weighing on banks’ balance sheets. Stretched budgets at the central government and state levels, complex and uncertain land acquisition process, stringent environmental and social clearances, combined with restrictive pricing rules for public utility services (in particular electricity and water), have also affected infrastructure investment. To attract equity investments for infrastructure, the government launched the National Infrastructure Investment Fund.
The case of electricity: power for all
A key condition for corporate investment to revive is to improve the supply of electricity. The government unveiled an ambitious plan to provide electricity supply for all by 2019. India has already made great strides in improving access to modern energy, reducing the number of people without access to electricity since 2000 (Figure 14.A). Power generation capacity has surged over recent years (IEA, 2015) but power outages are still frequent, affecting economic activity and investment. India ranks 88 out of 138 countries in terms of the quality of electricity supplied (WEF, 2016). As manufacturing relies heavily on good infrastructure, it suffers most (OECD, 2014). The 2014 World Bank Enterprise Survey reveals that electricity is the second most important obstacle for manufacturing firms.
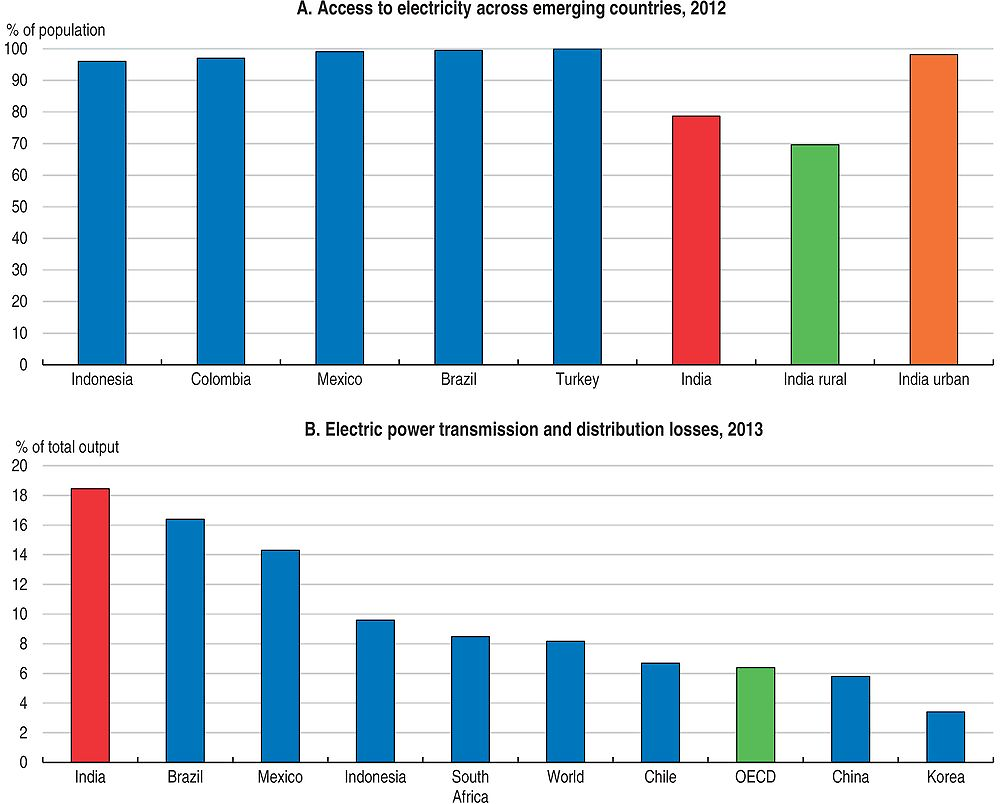
Source: World Bank World Development Indicators database.
The poor financial health of the states’ distribution companies triggers uncertainty for potential investors in power generation and results in poor quality of services in many regions. Power outages also adversely affect government’s priorities like “Make in India” and “Digital India”. A key reason behind distribution companies’ financial stress is that electricity tariffs are set below the cost of generation and delivery in most states. Cross-subsidisation is prevalent from industry to households. Electricity is even free for farmers in some states. Together with supply disruptions, the higher prices undermine the competitiveness of Indian firms. Overall, the average revenue of power utilities was 29% below the average cost of supply in 2014 (RBI, 2016b). As a result, electricity producers are often producing below capacity and are reluctant to invest while distribution companies are making losses and are unwilling to buy from electricity producers. Distribution companies’ accumulated debt stood at around 3.5 % of GDP in 2015. The very large transmission and distribution losses (Figure 14.B) provide an indication of the investment deficit.
To ensure financial viability of power distribution companies and support investment in the power sector, the government launched the UDAY scheme in 2015 (Box 5). Its success lies in prudent and effective management of the distribution companies by the states and electricity tariff increases (which are unpopular). In their absence, the UDAY scheme may simply add to the state governments' debt burden while liabilities at distribution companies build up again – earlier attempts to restructure power sector debt provide lessons in this regard. As of December 2016, 18 states and union territories, accounting for the bulk of distribution companies’ overall debt, have come under UDAY. The ensuing lowering of interest costs has been large and most of the states have made commendable efforts to reduce commercial and technical losses. However, few have significantly raised electricity prices. To support quality electricity for all, electricity tariffs should cover the economic costs of electricity provision. Enhanced communication on the main beneficiaries from subsidised electricity prices and expected improvements in electricity coverage rates and quality of electricity provision would help to unlock political economy considerations.
A prerequisite for promoting investment in power generation and in distribution is to address the financial troubles of power distribution companies – with outstanding debt INR 4.3 trillion, i.e. about 3.5 % of GDP.
Electricity is a shared responsibility between the central government and states, thus requiring a concerted reform effort. The tri-partite arrangement between the central government, states and distribution companies (Ujwal Discom Assurance Yojana, or UDAY scheme) envisages a target of reducing the losses to 15% by March 2019 from pre-UDAY level of about 26%. It entails:
-
Reducing distribution losses through mandatory smart metering, up-graded transformers and meters;
-
Reducing interest payments. Distribution companies will enter a tripartite agreement with the Ministry of Power and state governments; 75% of their outstanding debt will be taken over by the states and converted into lower-costs bonds over a 2-year period;
-
The debt of distribution companies taken over by the states will not be included in the calculation of fiscal deficit of respective States in the FY 2015-16 and 2016-17. The plan allows states to overshoot the fiscal deficit limit if funds are used to bail out distribution companies.
-
Strengthening financial discipline by requiring that future losses of distribution companies be taken up by states.
To increase the chance of UDAY to be implemented, compared with the 2012 Financial Restructuring Package which had similar objectives but little success, it is accompanied by incentives: if states perform well, they will be offered additional funding and supported with additional coal at notified (reduced) prices.
In December 2016, 18 states and union territories signed agreements with the central government to take over the outstanding debt of their power distribution companies and 4 states had given in principle approval. UDAY had addressed a large fraction of the debt of distribution companies, resulting in a substantial decline in interest costs. Twelve states had reduced distribution losses and at least eight had significantly narrowed the gap between average cost of supply and average revenue. To enable more states to join the scheme, the government extended the deadline by one year, up to end-March 2017.
The UDAY scheme could support investment in the power sector and have additional positive impacts. First, it could support the Make in India initiative: the manufacturing sector would be more competitive, were electricity bottlenecks removed. Second, it could contribute to reduce non-performing loans, which have weighed on the banking sector and thus on its ability to finance investment. Third, UDAY is expected to push states to raise electricity tariffs, in effect cutting electricity subsidies which have been highly regressive – the poorest 20% consume 45 kWh/month while the richest 20% consume 121 kWh/month, with less than 60% of rural households using electricity as the main source of lighting – and have contributed to low energy efficiency.
Easing land acquisition would underpin a pick-up in investment projects, especially in manufacturing
Difficulty in acquiring land remains a major constraint on the implementation of infrastructure and other investment projects. Land acquisition is often complex, costly and surrounded by uncertainty (Figure 15). In addition, uncertainty surrounding land titles and land acquisition interferes with credit markets, with more than 50% of corporate loans and 60% of retail loans having land and real estate as collateral (Krishnan et al., 2016).
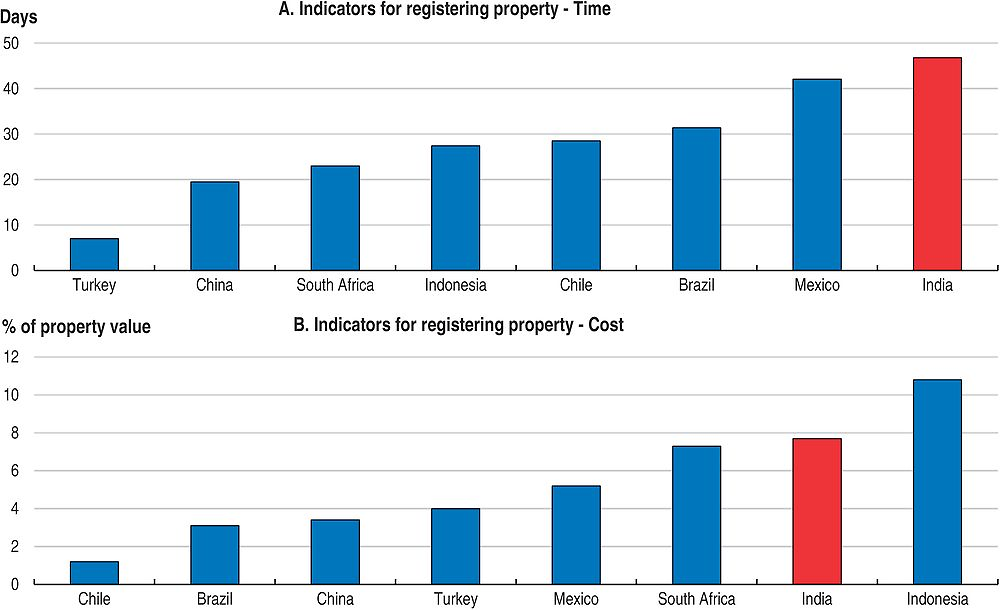
Source: World Bank Doing Business 2017 database.
Making the land acquisition process easier, faster and more predicable is key to boosting infrastructure and business investment projects. Government efforts to reform the Land Acquisition Act faced fierce opposition in Parliament in 2015 (Table 7). As land legislation is a shared responsibility between the central government and the states according to India’s constitution, the responsibility of reforming land laws have been left to the states. Some of them have taken the lead, with consent from the government of India. The state of Rajasthan passed legislation in 2016 providing statutory backing to land records, effectively guaranteeing land and property ownership. Rajasthan also passed a Land Pooling Bill which eases aggregation of small land holdings and should facilitate the development of adequate infrastructure. Gujarat eliminated the requirement of a social impact assessment and consent clauses for certain types of development projects. Maharashtra allowed the sale of certain publicly-owned lands that were previously slated only for leasing and allowed mid-size plots to be divided. These new laws should help create an efficient, transparent and modern land market, provide certainty of tenure and end litigation that often mires investment projects.
To clean up land titles, improve the quality of land registries (e.g. through digitisation) and overhaul the land litigation system at the national level, the impact of state reforms should be assessed and best-practices be identified and promoted. The National Institution for Transforming India (NITI Aayog), which replaced the Planning Commission in 2015, can play an important role in this respect.
Deregulating foreign direct investment
Several measures to promote foreign investment (FDI) have been introduced. The OECD FDI restrictiveness index reveals that India is among the top reformers (Figure 16.B). In the context of the Make in India initiative launched in 2014, FDI reforms have focused on civil aviation, defence, agriculture, pension and insurance funds, air transport, railways and construction (Table 8). Caps on FDI have been raised and more sectors have been brought under the automatic route avoiding the administrative burden associated with the government approval route. Combined with measures to improve the ease of doing business (see below), FDI deregulation has supported FDI inflows, with particular buoyancy in construction and services. Yet, the OECD FDI regulatory restrictiveness suggests that restrictions remained relatively high in 2015 compared with many emerging economies and OECD countries (Figure 16.A), in particular in services such as media, financial and business services, holding back potential economy-wide productivity gains.
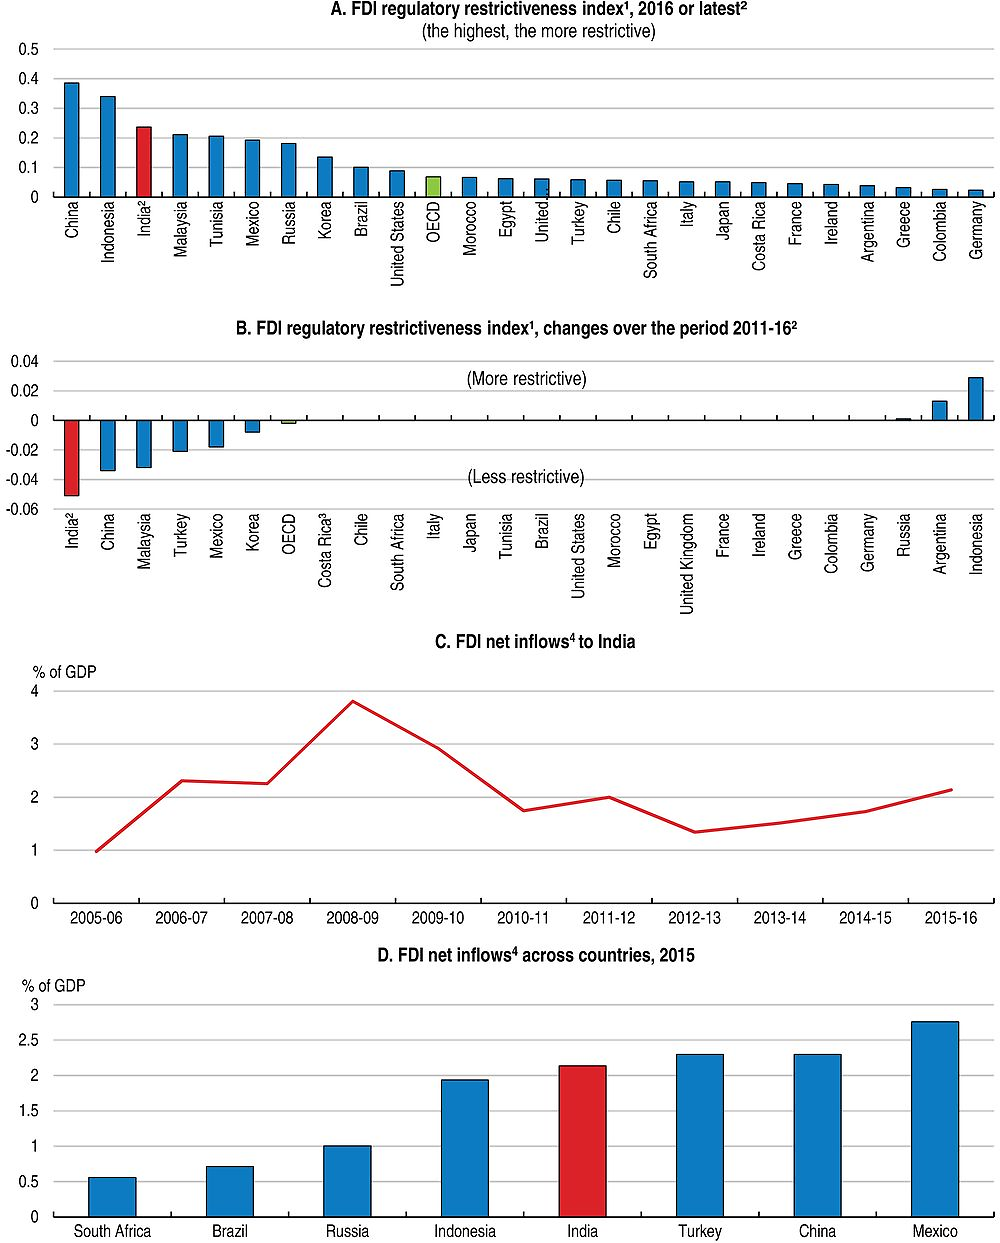
1. The FDI Regulatory Restrictiveness Index measures statutory restrictions on foreign direct investment across 22 economic sectors. It gauges the restrictiveness of a country’s FDI rules by looking at the four main types of restrictions on FDI: 1) Foreign equity limitations; 2) Discriminatory screening or approval mechanisms; 3) Restrictions on the employment of foreigners as key personnel and 4) Other operational restrictions. Restrictions are evaluated on a 0 (open) to 1 (closed) scale. The overall restrictiveness index is the average of sectorial scores.
2. The FDI Regulatory Restrictiveness Index reflects the situation at end 2016 for India and end 2015 for other countries.
3. Data for Costa Rica refer to the period 2012-15.
4. FDI net inflows are the value of inward direct investment made by non-residents net of repatriation of capital and repayment of loans.
Source: Reserve Bank of India; OECD FDI Regulatory Restrictiveness Index database; Brazilian Central Bank; and OECD FDI main aggregates database.
Promoting the ease of doing business and firm dynamism
Enabling firms, especially new entrants, to experiment with new technologies and business models is key to promoting productivity (OECD, 2015b). In 2015, insolvency procedures took 4.3 years in India, more than twice the time on average in China and South Africa, while the recovery rate of assets from bankrupt firms was significantly below many other emerging economies. In 2016, the government overhauled the multiple laws dealing with insolvency and replaced them with a Code that should facilitate time-bound closure of businesses. In the event of a default, the Code sets a time limit of 180 days (plus 90 days for exceptional cases) for resolution. The Code also creates a new institutional structure, with insolvency professionals and agencies, information utilities that will collate information about debtors and a bankruptcy board. Cross-country evidence suggests that some specialisation in expertise of judges and bankruptcy practitioners can lead to faster and cheaper procedures, and therefore higher recovery rates (OECD, 2013; McGowan and Andrews, 2016). The full implementation of the Code will likely require increasing judicial resources and improving the judicial machinery to reduce delays (Sengupta and Sharma, 2016; Regy et al., 2016).
As a major pillar of the Make in India initiative, the central government has taken many measures to improve the ease of starting and operating a business (Table 9) – including an online system for VAT registration and payment for various taxes, self-certification schemes, online submission of applications for environmental clearances and construction permits – and reduced registration fees. The Start-up India initiative launched in August 2015 has further simplified administrative processes and provided financial support and tax relief for newly-created enterprises. Simplifying regulations and administrative process also contributes to reducing corruption. Overall, India’s ranking in the World Economic Forum Global Competitiveness Index for 2016 improved 16 places to 39 while in the 2017 edition of the World Bank Doing Business, India’s ranking improved to 130, from 131, on a group of 190. However, India still lags behind many emerging economies in terms of ease of doing business. A report submitted in December 2015 by the Standing Committee on Commerce recommended further reforms, in particular introducing a one single window for construction permits, fastening the pace of digitising land records, implementing a stable, fair and predictable tax regime in the country and designing environment clearance in a way that the Ministry responds in a time bound manner (PRS, 2016).
Creating more and better jobs
India creates too few quality jobs to meet the aspiration of its growing workforce, leaving many people under-employed, poorly paid or outside the labour force. Despite strong economic growth, the employment rate has declined (Figure 17.A), the participation rate of women is low (OECD, 2014) and job creation in the organised sector has plummeted since 2010 (Figure 17.B). However, assessing labour market trends is made difficult by poor employment data, with information for total employment available only every five years (last NSSO round in FY 2011-12) and with a lag. Since 2008, the government carries out quarterly surveys on employment in the organised sector for eight industries; as of December 2016, the latest available data covered the last quarter of 2015. The Labour Bureau also conducts quarterly and annual employment/unemployment surveys since 2010 with data up to 2015. Ensuring that up-to-date data are available would provide key tools to improve policymaking.
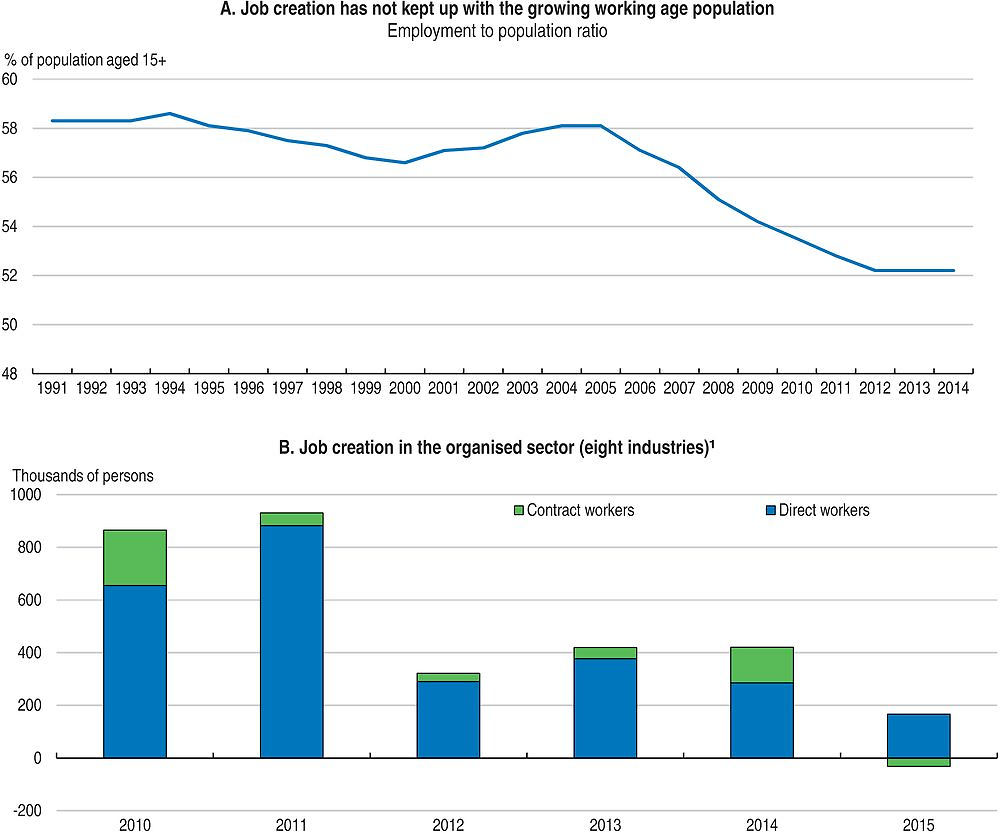
1. The organised sector consists of enterprises with more than 10 workers (more than 20 if not using electricity). Contract workers are not covered by social insurance systems. The industries surveyed are: textiles including apparels; leather; metals; automobiles; gems and jewellery; transport; IT or BPO; and handloom and powerloom.
Source: World Bank; and Labour Bureau of the Government of India.
Inequalities in wages and in social and labour law coverage are large. Household surveys (NSSO) reveals that only one third of all workers have a written job contract. The vast majority, particularly those in agriculture and the service sector, are not covered by core labour laws (Mehrotra et al., 2014). In manufacturing, the latest NSSO data suggest that in 2012 around 65% of jobs were in firms with less than 10 employees (the so-called “unorganised sector”), while most labour laws apply only to larger firms. In addition, larger firms tend to increasingly rely on temporary workers or workers contracted through an agency (so-called “contract” labour). The Annual Survey of Industries (ASI) point to an increase in the share of contract labour in the organised manufacturing sector from 15% in FY 1999-2000 to 26% in 2012-13, with a faster increase in states with more rigid labour laws (Government of India, 2016). A contract worker earns 29% less than a regular worker (ASI data). Likewise, in the education sector, contract teachers are paid a small fraction of the wage received by government regular teachers and are often paid with a delay (Béteille and Ramachandran, 2016).
Several factors contribute to the poor labour market performance. First: labour laws are complex and strict, especially for large industrial firms. Employment protection legislation (EPL) is particularly restrictive compared with both other EMEs and OECD countries, as firms with more than 100 employees are required to obtain prior government approval to dismiss one or more employee (Figure 18). The frequency of reinstatement orders in the case of unfair dismissal is high and long delays in resolving labour disputes (Bhattacharjea, 2009) add to uncertainty and indirect costs of labour. The minimum wage system is also one of the most complex in the world (Belser, 2013), as the imbrication of central government and state regulations results in a multitude of minimum wages. Second: the corporate income tax has created a bias against labour-intensive activities, although the cap on the capital depreciation tax allowance introduced in 2016 will help reduce this bias (Chapter 1). Third: social security contributions are capped and are mandatory below a given income threshold for firms with more than ten employees. They thus increase the cost of low-qualified jobs and discourage job creation. Overall, enterprises have reacted to labour and tax regulations by substituting capital for labour, staying small, or relying on contract labour.
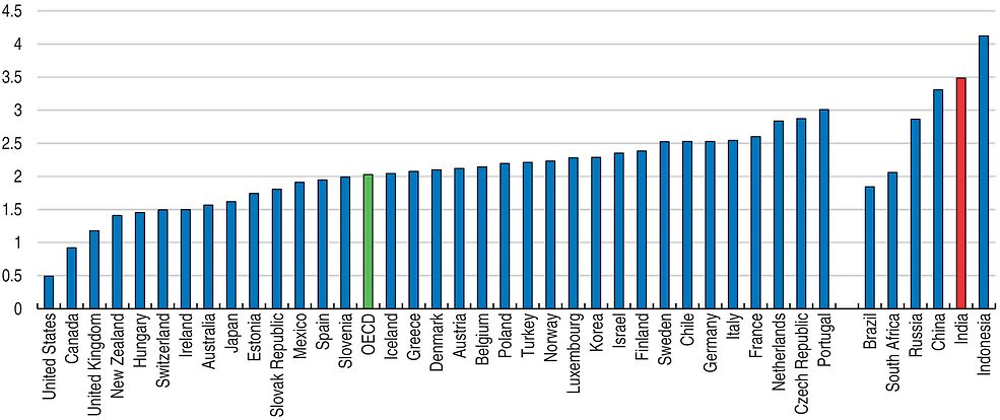
1. The OECD indicator of employment protection legislation (EPL) for regular employment measures the procedures and costs involved in dismissing individual regular employees. The indicator runs from 0 to 6, representing the least to most restrictive EPL. The last available data refer to 2012 for BRIICS countries and 2013 for OECD countries.
Source: OECD Employment Protection Database.
The central government has recently taken steps to make labour regulations friendlier to job creation. It has reduced administrative requirements for complying with existing labour laws and increased transparency in the day-to-day interactions between firms and the administration. In particular, it launched a unified online portal (Shram Suvidha) for firms to report compliance with 16 central government labour laws and allowed a single self-certification under this scheme as well as transparent labour inspection processes. Labour registrations have been simplified and can now be made on the same portal. On the legislative side, the Apprenticeship Act was amended in December 2014 to increase the number of industrial sectors which can employ apprentices (Table 10). The government is also envisaging rationalising 44 central government laws into four labour laws. To reduce the pay gap between formal and informal labour, the central government introduced in 2016 a minimum wage of INR 10 000 (USD 148) per month for all contract workers (the 1970 Contract Labour Act is restricted to some activities).
In June 2016, to boost job creation, the government approved a special package, including paying the 8.33% employers’ contribution to the pension system for new employees (restricted to those with a wage up to INR 15 000 per month), increasing overtime limits to 8 hours a week (in line with ILO norms), refunding the states levies and bringing in parity between the contractual and permanent workers in terms of wages and other compensation elements. For the labour-intensive garment industry, for women in particular, the government also pays the 3.67% contribution for the Employee Provident Fund. In addition, the government relaxed conditions for eligibility to tax concessions for the apparel sector – a sector where employment elasticity is high (Kantha, 2016) – so as to further promote job creation.
Promoting quality employment and reducing both labour informality and income inequality would require introducing a simpler and more flexible labour law which does not discriminate by size of enterprise, gender or job contract. The government proposed to regroup the multitude of labour laws into four Codes, to loosen employment protection legislation which requires firms to get government’s approval for firing even one employee and to remove restrictions on women working “on certain machines in motion” and between 7:00 PM and 6:00 AM. These proposals have met considerable resistance.
As labour is a shared responsibility between central government and the states, some states have taken the lead in reforming labour laws. Rajasthan, a relatively poor state, has been the most ambitious recently in this domain (Chapter 2). Maharashtra and Tamil Nadu have allowed women to work night shifts. To help inform the policy debate, best policy practices across states should be identified, which would underpin competitive federalism. Information on employment, stringency of labour laws and the impact of labour reform at the state level should be improved.
Improving education and skills
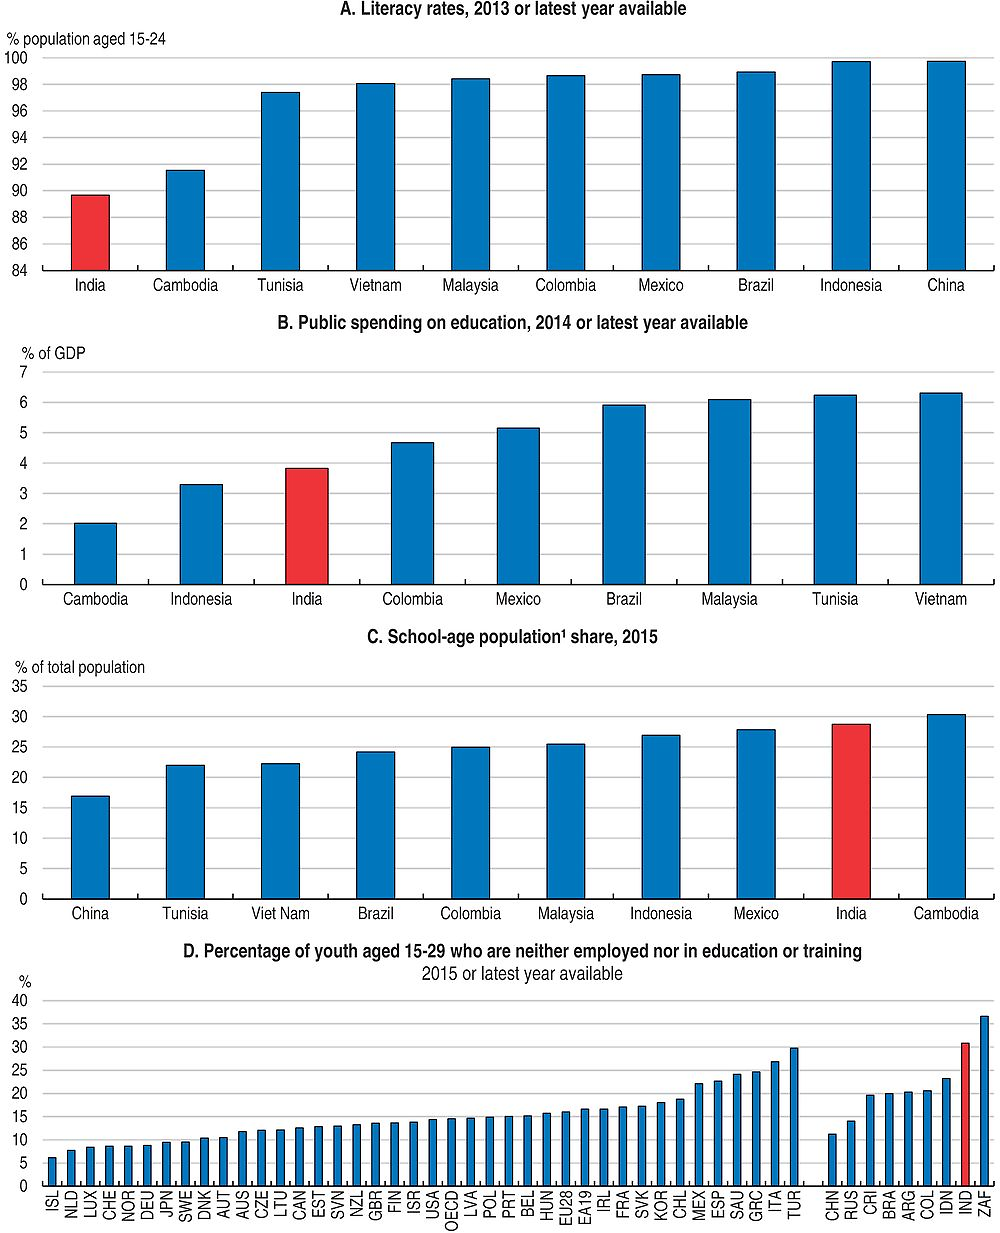
Improving the education and skill system is key to meeting the increasing needs for skilled workers which accompanies the shift away from agriculture. Efforts in this direction have been made since the early 2010s. In particular, India has succeeded in ensuring quasi-universal primary education after the Right to Education Law, which mandates free and compulsory elementary education to all children aged 6-14, came into force in 2010. Learning outcomes, however, are disappointing and have failed to improve. The 2014 Annual Status of Education Report (ASER, 2014) indicates that almost 50% of class 5 students in rural areas were not able to read basic sentences and more than 70% were unable to perform simple division. The literacy rate remains lower than in most other emerging economies (Figure 19.A). In addition, the attendance ratio drops sharply from primary to secondary education and inequality in access is large: less than 40% of the children from the poorest fifth of the population attend secondary schools, compared to 72% for the richest fifth of the urban population (71st round of NSSO’s survey). The percentage of youth not in employment, education or training (NEET) is also high (Figure 19.D).
1. Population aged 5-19.
Source: World Bank, World development indicators database; OECD Employment Outlook 2016; and United Nations Population Division.
Equipping people with the right skills will require reducing barriers to higher enrolment rates in education and training systems. Household financial constraints play an important role. As an illustration, Arif and Chaudry (2015) provide evidence that in Punjab external remittances tend to relax household financial constraints, promote school enrolment and reduce dropouts. Likewise, financial incentives programmes experimented in various states have encouraged investment in daughters’ education and health (Sinha and Yoong, 2009), suggesting that conditional cash transfers could boost enrolment and completion rates. The programme Pradhan Mantri Kaushal Vikas Yojana, launched in 2015, embodies a INR 8 000 financial reward for the youth taking up training courses from affiliated providers. The outcomes should be assessed and, if positive overall, the approach should be extended.
Meeting education needs will also require increasing resources spent on education and improving their effectiveness. New tertiary education institutions are being set up, including in the health care sector (Table 11). Still, at 3.8% of GDP, public spending on education is low, particularly so in view of the very high school-age population ratio (Figure 19.B and C). As an indication, the average pupil-teacher ratio in primary schools, at 32, is about twice the level in China and Indonesia. The quality of teachers also matters significantly (Azam and Gandhi Kingdon, 2015). Several studies suggest that contract workers – with short-term contracts and lower wages – put in greater effort and succeed in improving student performance better than civil service teachers with permanent tenure (Goyal and Pandey, 2013; Muralidharn and Sundararaman, 2011). While most teachers try to do a good job, a sizeable minority is disengaged. Duflo et al. (2012) suggest that linking teacher wages to attendance reduces teacher absenteeism and improves learning outcomes. Bolia and Jain (2016) reveal large disparities across states in transforming education inputs into cognitive skills, suggesting ample scope for improving efficiency if states would learn from each other and best practices be identified.
The 2015 National Skill Development and Entrepreneurship programme, which supersedes the 2009 Skill Policy, envisages training 500 million people by 2022. Employer surveys indicate skills shortages in ICT, financial services, tourism, retail and skill-intensive manufacturing. In 2015, 58% of employers reported recruitment difficulties because of talent shortages (Manpower, 2015). Large sections of the educated workforce have little or no job skills, making them largely unemployable (National Employability Report: Aspiring Minds, 2016). It is estimated that only 4.7% of the total workforce has undergone formal skill training, much less than in China or South Korea (Government of India, 2015b, Mehrotra et al., 2015 and Wheebox, 2016). To improve population skills, vocational training should be introduced earlier in the school curricula. The government objective of introducing vocational training classes linked to the local economy from class nine onwards in at least 25% of the schools, over the next five years is welcome but should be more ambitious, both on coverage and timing. Local industry participation in designing training programmes would also help to better match industry needs.
Better supporting the poor and vulnerable
India has taken millions of people out of poverty. However, access to core public services is incomplete and highly spatially concentrated. India’s population coverage for water provision, sanitation and electricity has improved but remains low by BRIICS country standards. Some states do better however, suggesting that there is scope for experimentation and the sharing of good practices across states. As an illustration, while almost 20% of the Indian population has no access to electricity, some states have succeeded in achieving near universal provision, including Gujarat, Karnataka and Maharashtra. Despite efforts aimed at improving public services in rural areas, such as the National Health Mission, deprivation in core public services is much higher in rural than urban areas, with a particularly marked rural/urban divide for electricity, sanitation and health.
Public resources invested on health care are low and inequitably distributed across and within states. India spends only 4% of GDP on health care – less than half of that in Brazil and South Africa – and out-of-pocket payments account for the bulk of that. The number of doctors and nurses is low (Figure 20) and the number of medical colleges tends to be lower in populous states with poor health (OECD, 2014). To reduce the rural/urban divide, community centres have been built in rural areas. However, there has been an alarming decline in the number of trained medical staff and specialists, with vacancies of up to 80% in village services (Lancet, 2015). Reforms recommended by a parliamentary committee to raise the number and quality of medical colleges have not been implemented (Sharma, 2016). Although the draft National Health Policy by the government tabled a commendable reform agenda and proposed increasing public spending on health care from 1% to 2.5% of GDP by 2020 (Government of India, 2014; Duggal, 2016), the budget for FY 2016-17 has not significantly increased resources for the health care sector.
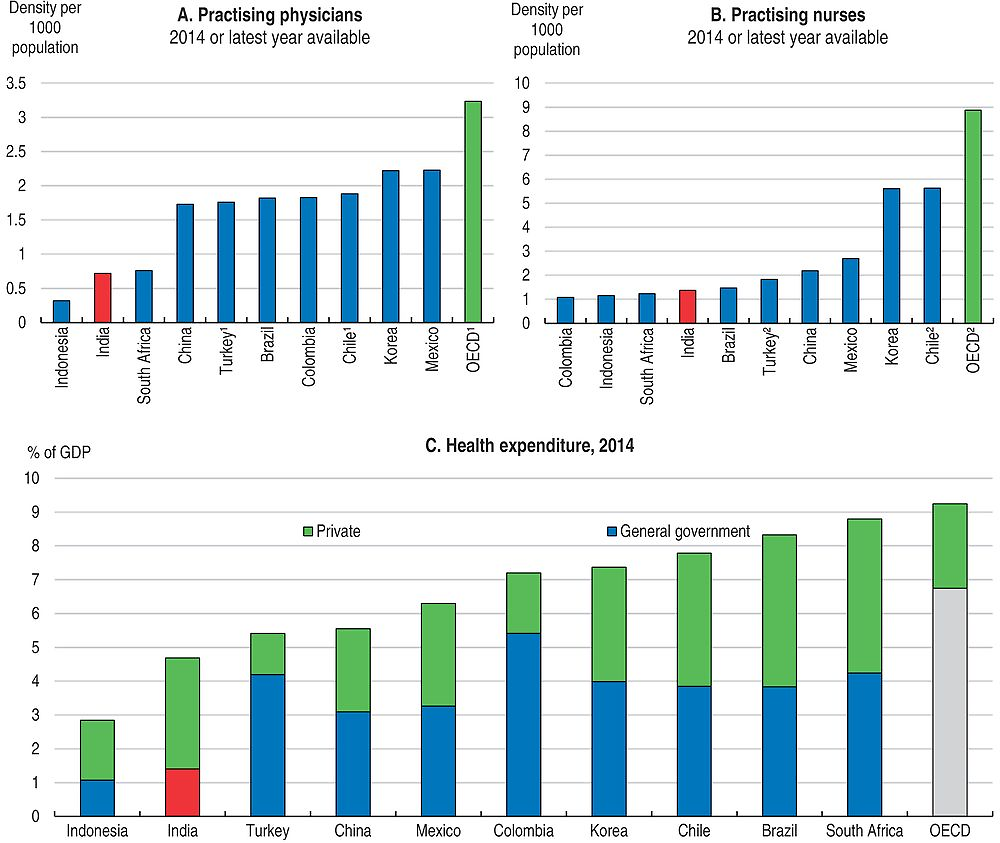
1. Data for Canada, France, Greece, Netherlands, Slovak Republic and Turkey include not only doctors providing direct care to patients, but also those working in the health sector as managers, educators, researchers, etc. Data for Chile refer to all doctors licensed to practice.
2. Data for Austria, France, Greece, Iceland, Ireland, Italy, Netherlands, Portugal, Slovak Republic, Turkey and United States include not only nurses providing direct care to patients, but also those working in the health sector as managers, educators, researchers, etc. Data for Chile refer to all nurses who are licensed to practice (less than one-third are professional nurses with a university degree). Austria reports only nurses employed in hospital.
Source: World Health Organisation; and OECD Health care resources database.
The on-going subsidy reform could serve as best practice for other countries
India has long relied on price subsidies for food, fertiliser, oil, kerosene, water, electricity, railways and many other products, to guarantee poor households’ access to essential products and protect them from price fluctuations. For kerosene, subsidisation also reduce incentives to use cheaper alternates, like biomass, for cooking and lighting, which have serious adverse impacts on the environment and health of those exposed, often the poorest. The fiscal cost, at 4.2% of GDP, is high (Government of India, 2015a). Subsidies also tend to benefit the rich most – electricity and water subsidies are particularly regressive since many poor households are not connected. Furthermore, subsidies have been misused, triggered corruption, and resulted in excess consumption for some products with adverse environmental costs, e.g. electricity and water.
To improve the effectiveness of welfare programmes, India is implementing an ambitious reform. The government has extended and accelerated the move from price subsidies to direct benefit transfers (DBT) in cash, supported by a personal identification number linked to each individual’s biometrics (Aadhaar) and bank accounts. The first Aadhaar number was issued in September 2010, and around 1.1 billion citizens and 86% of the population had a number as of December 2016. More than 285 million bank accounts were linked to an Aadhaar number. The government has also enabled mobile-based transactions to guarantee connectivity even in rural areas. While the DBT scheme covered mainly scholarship and pension programmes, the government has brought additional welfare payments under the ambit of the DBT since 2014, including cooking gas subsidies and the national rural employment guarantee scheme (NREGS). Several experiments have also been launched in various states to extend further the DBT coverage, including for the food subsidy. In addition, the government seized the opportunity of declining oil prices to eliminate diesel subsidies in 2014.
DBT accelerates payments, lowers transaction costs and leakages, and better targets welfare programmes. Recent changes in cooking gas subsidies provide an illustration. The government launched the DBT scheme for gas in the entire country in 2015. Since then, all gas cylinders are sold at the market price and the implicit subsidy is transferred directly to consumers’ bank accounts. This move allowed weeding out almost 140 million dubious beneficiaries, reducing the subsidy cost significantly. It has also helped ensure that the poor receive as much as the rich. A campaign asking the rich to voluntarily opt out from the implicit gas subsidy (“Give it up”) was launched in autumn 2015. Instead of the opt-out approach, the government could ask consumers to opt in for the subsidy by certifying that their household income is less than a set amount – studies have revealed that choice of default options can have a significant impact on consumer behaviour (Tripathi et al., 2015). A similar approach should also be used for other products, in particular fertilisers, water, and electricity. Ensuring that compensation paid to banks for implementing DBT is adequate is important to support the move.
Financial inclusion is progressing
Disparities in access to formal financial institutions have long been particularly severe in India. Gender, income, educational background and location have been key determinants (Figure 21). According to the 2011 Census survey, more than 40% of households (i.e. over 100 million households) had no bank account, and 67% in rural areas. A large number of the poor relied on expensive informal sources. Out of every 100 marginal farmers, more than 60 have contracted debt from money lenders and less than 13 from banks, with 85% of their outstanding loans from non-institutional sources (Chapter 2).
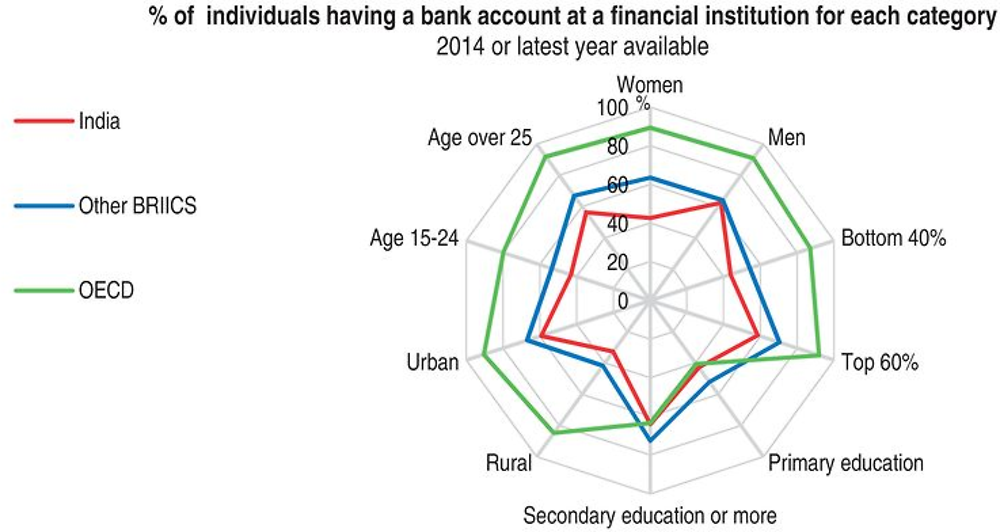
Source: World Bank, Global Findex Database.
Ambitious initiatives have been launched to enhance financial inclusion and empower the poor. In August 2014, the government launched the Pradhan Mantri Jan Dhan Yojana (PMJDY) which enables individuals to open bank savings account with no minimum balance requirements, a debit card, an overdraft facility of INR 5 000 per household, as well as an accident and life insurance. As of November 2016, around 255 million bank accounts were opened, with over 54% of them accompanied by an Aadhaar number and a balance of over INR 456 billion under the scheme. The move from price subsidies to direct benefit transfers is also promoting the use of bank accounts. India also combines financial education and financial inclusion campaigns to help people manage money more effectively. Financial literacy initiatives have been conducted through various channels, including schools, roadshows, pamphlets and films (Atkinson and Messy, 2013).
To ease funding problems faced by small businesses, the government launched the Pradhan Mantri Mudra Yojana in 2015. It grants loans of up to INR 1 million (USD 15 500), without any collateral, at reduced cost by providing refinancing at a relatively low interest rate. In 2015 the RBI also granted licences for ten small finance banks that offer loans to small businesses and farmers and accept deposits – 8 of the 10 entities are microfinance institutions, which so far in India cannot collect deposits. Small finance banks will further be given the possibility of graduating to universal banks after a few years. To improve access to financial services for the poor, the RBI granted new conditional licences for eleven “payment banks” in 2015 – these banks can collect deposits up to INR 100 000 (USD 1 550), provide debit cards and internet banking services but cannot give loans – although three applicants had opted out as of June 2016.
Despite efforts, various factors still constrain financial inclusion. India has long relied on banks to give access to financial services to the poor. Although branch expansion – one for every village with more than 2 000 inhabitants – has reduced rural poverty in rural areas (Burgess and Pande, 2005), the cost is high, calling for more cost-effective approaches. A committee set up by the RBI to prepare a 5-year financial inclusion plan, has argued in favour of low-cost technology approaches, in particular mobile phones and business correspondents, for last-mile delivery of bank services. The launch of the unified payment interface in 2016 will speed up the move to cashless and mobile phone transactions. It will also make it easier for small businesses to have a banking track record and thus increase their chances of getting a loan. To improve credit access to agriculture, the RBI committee urged to complete digitization of land records by the states, so as to allow land to be used as collateral. To prevent over-indebtedness, the RBI committee proposed linking all credit accounts to a unique biometric identifier, such as Aadhaar number, to identify multiple accounts. To promote further financial inclusion, India should consider allowing microfinance institutions to collect deposits and offer savings accounts, following Bangladesh with the Grameen bank.
Achieving strong and balanced regional development
Spatial inequalities are sizeable, with large differences in poverty rates, access to public services and output per capita both across states and between urban and rural areas. The share of the population living on less than USD 1.90 a day (at 2011 prices) has declined, thanks to strong growth. However, the income gap between the richer and poorer states has widened (Figure 22.B). Some low-income states (including Bihar and Rajasthan) have recently developed more rapidly than high-income ones, suggesting that good policies matter. Also, some states have succeeded bringing the poverty rate below 10% – Kerala and Sikkim stand out, with a low poverty rate (Figure 22.C) despite their relatively low GDP per capita.
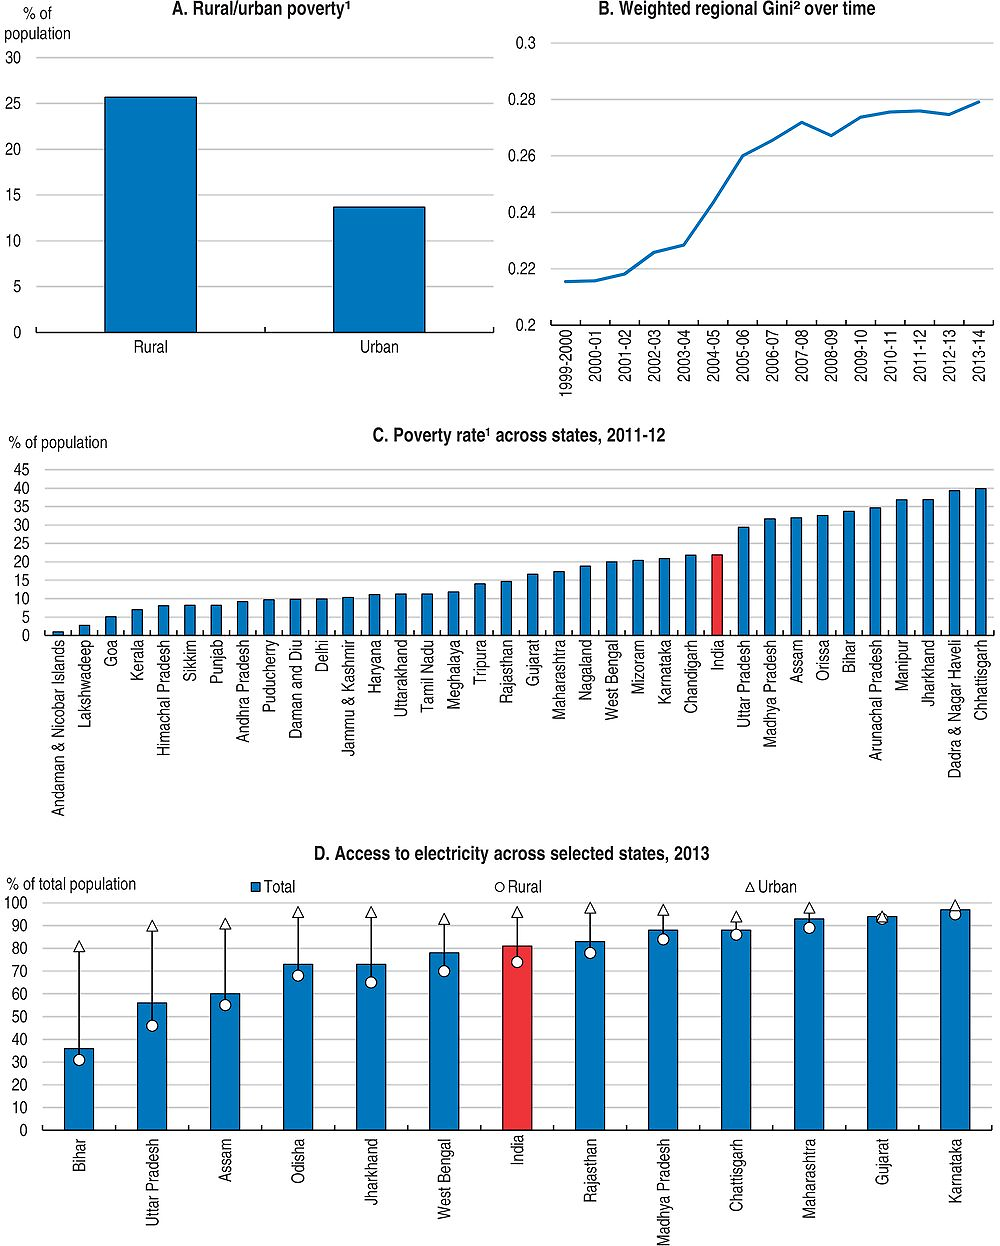
1. Poverty is computed by using Tendulkar methodology on the basis of a mixed reference period. The poverty line has been expressed in terms of monthly per capita consumption expenditure.
2. The regional Gini index is a measure of inequality in GDP per capita across regions (states in India). It takes values between 0 and 1 – zero when all regions have the same GDP per capita. Each region is given a weight corresponding to its population size.
Source: Reserve Bank of India; NSSO; and IEA World Energy Outlook 2015.
Rising GDP disparities are no fate; they depend on a country’s intergovernmental framework and can be tackled by policy (Blöchliger et al., 2016). States have significant spending responsibilities. Product market regulations, except those related to trade and FDI, as well as various labour regulations are largely set and implemented at the state level. The recent replacement of conditional grants by a larger tax share has given more autonomy to the states to adjust policies to local circumstances while efforts to publicise data on the ease of doing business at the state level have strengthened incentives to pass reforms. The newly created NITI-Aayog acting as a think-tank is helping to share best practices across states. All these initiatives should help India to get the most out of federalism. More could however be done to achieve a strong and balanced regional development.
Raising productivity in the agricultural sector to reduce rural poverty
Disparities in GDP per capita across states and between urban and rural areas largely reflects the activity mix, in particular the agriculture share in output. Agriculture still accounts for almost half of total employment but contributes just 18% of GDP. Many agricultural inputs have been heavily subsidised in India, including fertilisers, electricity, water and loans. In particular, fertiliser (urea) subsidies amounted to 0.5% of GDP in FY 2014-15, resulting in very high and imbalanced use of fertilisers, polluting soils and water resources, and in misuses (e.g. smuggling). Likewise, subsidised electricity for farmers have led to unrestrained exploitation of ground water, contributing to water stress – an important issue in India. Meanwhile, the average yield for cereals has remained low compared to peer countries (Figure 23) and the low agricultural productivity is contributing to a very high level of poverty in rural areas.
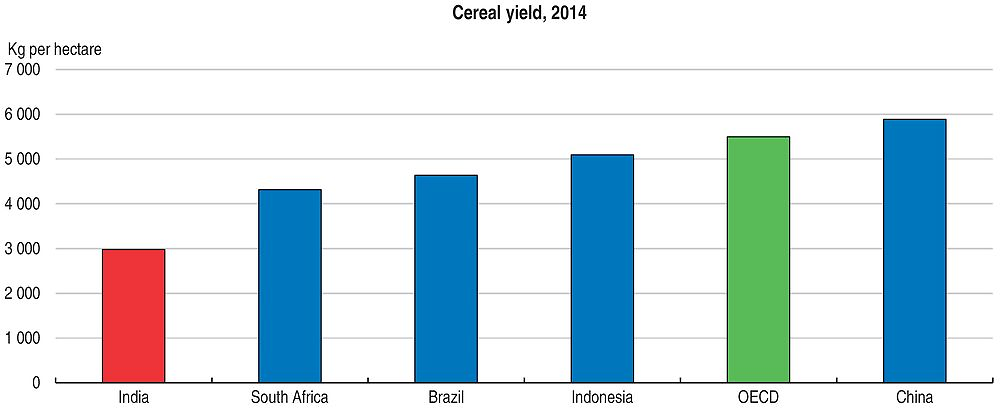
Source: World Bank World Development Indicators.
The average farm size is small, with more than two-thirds of Indian farmers operating on a less than one hectare land plot. The fragmentation of land holdings continues, due to inheritance practices, deterring mechanisation and productivity gains. To promote farm consolidation, the National Land Records Modernisation Programme, including the digitisation of land records, should proceed more rapidly, following the lead of some states, including Andhra Pradesh and Rajasthan (Gulati and Banerjee, 2015; RBI, 2015). To further promote mechanisation, some states – including Madhya Pradesh and Punjab – are supporting custom hiring centres which rent out machinery to small and marginal farmers. The impact of states’ experimentation to reduce land fragmentation and promote farm mechanisation should be assessed and made public so as to promote best practices.
Easing farmers’ access to agricultural markets and reducing the fragmentation of agricultural produce markets would also raise productivity and farmers’ income. Currently, the first sale of key agricultural commodities can only be conducted through state licensed agents – around 2 477 principal regulated markets based on geography have been identified (GoI, 2015a). In addition, various taxes and fees are levied on transactions, creating a large wedge between farmers’ payments and consumer prices. Some states (including Karnataka) have partly deregulated farmers’ access to market. The impact should be assessed and publicised to press for reform in other states. The central government also works with states to re-orient their respective Agriculture Produce Market Committee (APMC) Acts and to provide for establishment of private markets. State governments are encouraged to develop farmer markets in town areas to enable the farmers to sell their produce directly. Better storage and transport infrastructure would help to create a national market for agricultural products.
States have an important role to play to promote productivity in the manufacturing sector
Policy has a role to play in supporting the reallocation of resources from the agricultural to higher-productivity sectors. The 2014 OECD Economic Survey of India showed that the manufacturing sector contributed little to income and job creation as it suffered most from structural bottlenecks, including frequent power outages, below par transport infrastructure, complex administrative requirements, high taxation and stringent labour regulations.
Product market regulations, except those related to trade and FDI, are largely set and implemented at the state level. Empirical works by the OECD Secretariat suggest that stringent barriers to entrepreneurship have kept firms below their optimal size, weighing on productivity (Joumard et al., forthcoming B). Some states have front-run in reducing these barriers. If all states were to lower barriers to entrepreneurship to the level observed in the best performing ones, labour productivity in the organised manufacturing sector would increase by almost half. Reducing regulatory and administrative opacity is of particular importance.
Reform at the state level has been boosted by the new approach to federalism, stimulating local experiments and the identification of best practices. In 2014, the government launched an information system on state regulations and administrative practices, allowing the ranking of states in terms of the ease of doing business. A 98-point action plan for business reforms was agreed by state governments (KPMG, 2015). Progress in implementing reform is published, triggering competition across states. Efforts have been made to cut red tape, make it easier to comply with tax regulations (in particular online registration, filing and payment) and self-certification schemes for labour regulations have been implemented.
Getting the most out of urbanisation
A country’s productivity is to a large degree determined by its cities’ productivity, with productivity rising with city size (OECD, 2015a). Agglomeration economies reflect thicker labour markets, provision of specialised inputs and knowledge spillovers. With around 70% of India’s population still living in rural areas, potential productivity gains associated with urbanisation are high. However, in India, data from the World Bank Enterprise Survey reveal that productivity declines with city size, suggesting that congestion costs quickly exceed agglomeration benefits.
The urbanisation process has been dominated by urban sprawl more than by an increase in urban density, with new urban areas often lacking basic infrastructure and public services such as water provision and sanitation, water draining systems in case of floods, and public transport (World Bank, 2013). Poor connectivity, fragmented labour markets and a lack of co-ordination in land-use planning and infrastructure provision weigh on agglomeration benefits. The lack of effective public transport system results in long commuting times, increasing reliance on private motorised vehicles, and very high local air pollution (Figure 24, Box 6).
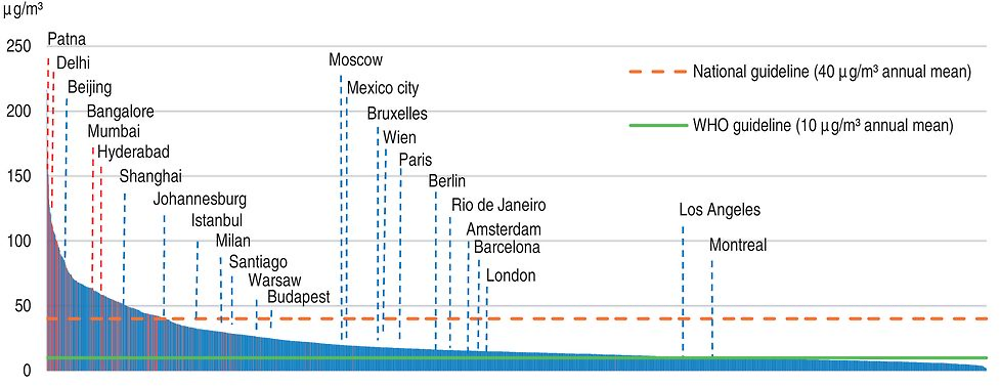
Note: Indian cities are marked in red. The other selected cities are marked in blue.
1. PM2.5 refers to particulate matter less than 2.5 micrometers in diameter; these fine particles are particularly damaging to health as they can penetrate deep into the lungs when inhaled.
Source: WHO, Ambient Air Pollution Database, May 2016.
India has very low per capita emissions of greenhouse gases and CO2 emissions per unit of GDP have declined over the past 25 years. However, total CO2 emissions are increasing rapidly as growth has edged up (Figure 25).
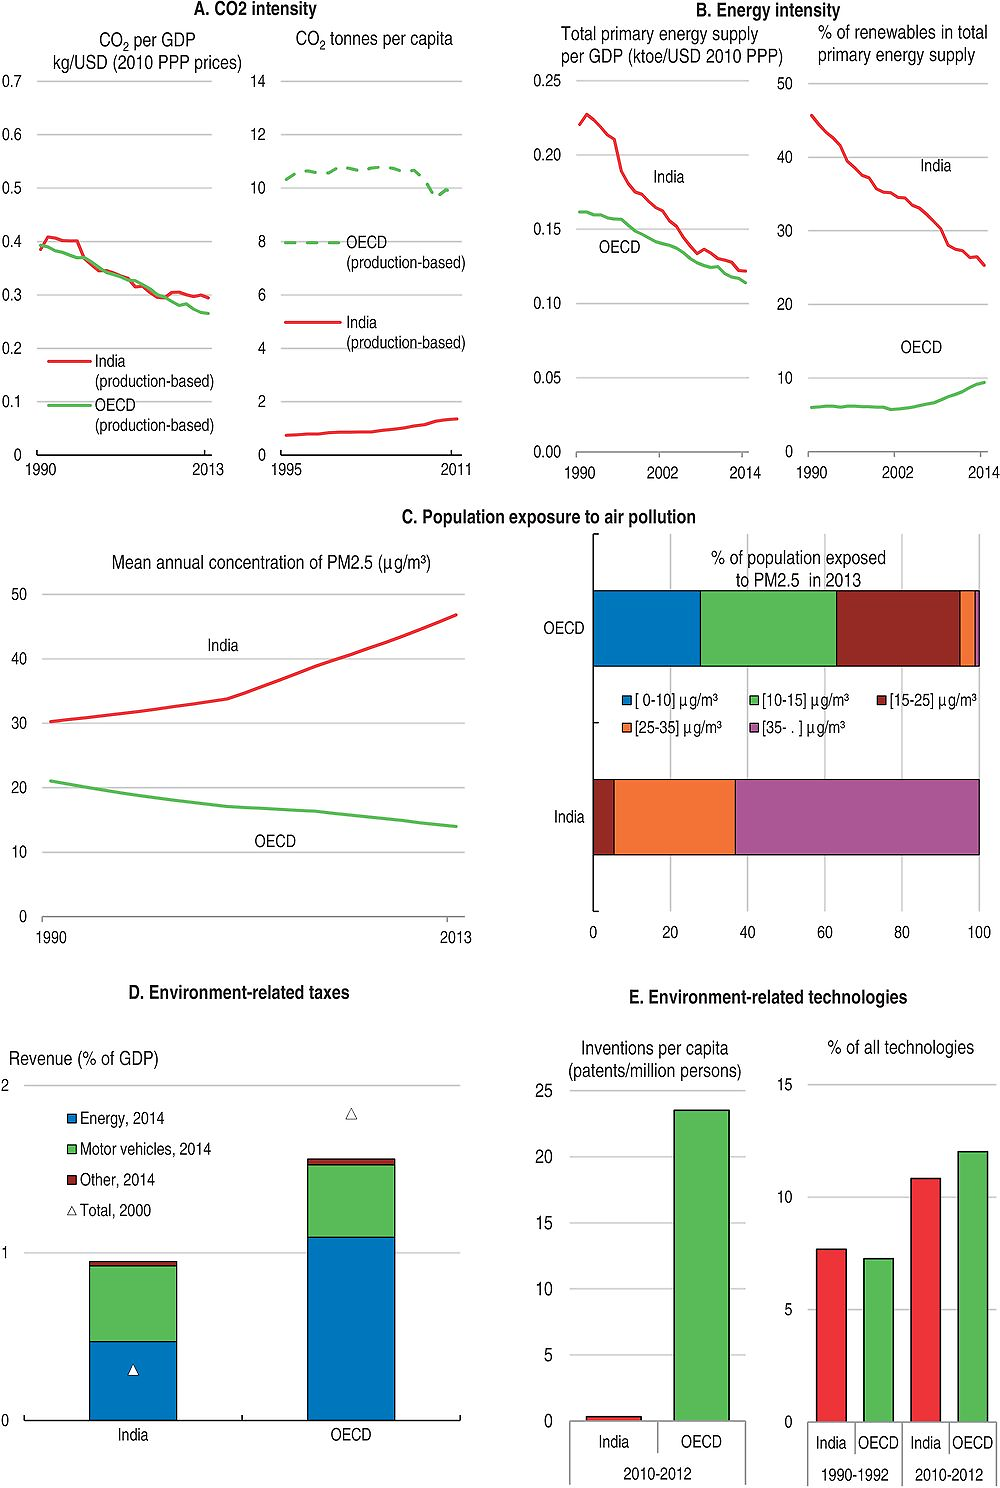
Source: OECD (2016), Green Growth Indicators database. For detailed metadata click here.
The share of renewables in the energy mix has been relatively high in the past, due to the widespread use of firewood and other biomass for cooking, still prevalent among 85% of rural households in 2011 (Government of India, 2016a), though much diminished in urban areas. Biomass still provides about one quarter of total primary energy supply (TPES), nuclear hydro and other renewables representing only about 3% of TPES.
Water is crucial for food supply as the green revolution in India was achieved partly due to massive increases in the irrigated area. This has led to depletion of groundwater in some areas, and competition with other water uses. The supply of piped water to urban households is growing fast but largely just keeping pace with urban population growth, while even primary water sewage treatment is rare so that many water courses are highly polluted for parts of the year.
Air quality is frequently very bad, associated with industrial and traffic pollution as in many countries but also, largely unknown in OECD countries, with use of biomass for household cooking in many areas, as well for heating in some, leading to high levels of indoor pollution. This is a major cause of premature mortality (Smith et al., 2014).
Standardised data on waste generation are not available, but in Uttar Pradesh, for example, “more than 25% of the municipal solid waste is not collected at all; 70% of the Indian cities lack adequate capacity to transport it and there are no sanitary landfills to dispose of the waste. The existing landfills are neither well equipped or well managed and are not lined properly to protect against contamination of soil and groundwater." (Uttar Pradesh, Directorate of Environment, 2016).
Revenue from environmental taxes, expressed as a share of GDP, is well below that in most OECD countries, but (unlike most OECD countries) it has been increasing. About half comes from taxes on motor vehicles.
Measured by patenting activity, India devotes a similar, increasing, share of its R&D effort to environmentally-oriented activities as the average OECD country. The very low overall patenting activity per capita is perhaps a misleading indicator of the national effort, due to India's large population, but it remains quite low even when adjusted for population.
It is essential that urban infrastructure is upgraded to get the most out of urbanisation and improve the quality of life in cities. A High Powered Expert Committee set up by the Ministry of Urban Development estimated that meeting urban infrastructure needs would require increasing spending from 0.7% of GDP in FY 2011-12 to 1.1% over the next 20 years (ICRIER, 2011). The Smart cities mission launched in 2015 aims at making cities more efficient and liveable. In many cities, priority should be given to public transport, housing and water sanitation.
To upgrade urban infrastructure, municipal governments’ responsibilities and revenue-raising powers should be clarified. For metropolitan areas with highly fragmented municipal bodies, an organisation with a clear focus on metropolitan issues to promote better co-ordination between land use and transport planning would help. Ensuring that mayors are directly elected and have a long enough term would improve political accountability. Local governments should also be given more and predictable financial resources. Enabling local governments to raise more revenue from real estate would help complement central government grants and private funding. This would require improving clarity in property ownership and giving local governments more autonomy in setting the tax base and rates and to enforce local taxes. Reliance on user charges, in particular parking fees and road pricing, should also be encouraged as they could raise more revenue while reducing private car usage and thus pollution.
Bibliography
Anand R., K. C. Cheng, S. Rehman, L. Zhang (2014), “Potential Growth in Emerging Asia”, IMF Working Paper No. 14/2. http://www.imf.org/external/pubs/cat/longres.aspx?sk=41198.0
Arif R. and A. Chaudry (2015), “The Effects of External Migration on Enrolments, Accumulated Schooling and Dropouts in Punjab”, Applied economics - Volume 47, Issue 16, 2015.
ASER (2014), Annual Status of Education Report, ASER Centre/Pratham http://img.asercentre.org/docs/Publications/ASER%20Reports/ASER%202014/National%20PPTs/aser2014indiaenglish.pdf
Aspiring Minds (2016), National Employability Report Engineers, Annual Report 2016. http://www.aspiringminds.com/sites/default/files/National%20Employability%20Report%20-%20Engineers%20Annual%20Report%202016.pdf
Atkinson, A. and F. Messy (2013), “Promoting Financial Inclusion through Financial Education: OECD/INFE Evidence, Policies and Practice”, OECD Working Papers on Finance, Insurance and Private Pensions, No. 34, OECD Publishing. https://doi.org/10.1787/5k3xz6m88smp-en
Azam M., G. Gandhi Kingdon (2015), “Assessing Teacher Quality in India” Journal of Development Economics - Volume 117, Pages 74-83 (November 2015)
Beetsma R.W.M.J. and X. Debrun (2016), “Fiscal Councils: Rationale and Effectiveness” IMF Working Paper 16/86, https://www.imf.org/external/pubs/ft/wp/2016/wp1686.pdf
Belser P. (2013), “Wages in Developing Countries”, in Perspectives on Labour Economics for Development, (Cazes and Verick ed.), ILO.
Béteille T. and V. Ramachandran (2016), “Contract Teachers in India”, Economic and Political Weekly, Vol. LI, No. 25.
Bhattacharjea A. (2009), “The Effects of Employment Protection Legislation on Indian Manufacturing”, CDDRL Working Papers , No 96, January. http://cddrl.stanford.edu/publications/the_effects_of_employment_protection_legislation_on_indian_manufacturing
Blöchliger, H., D. Bartolini and S. Stossberg (2016), “Does Fiscal Decentralisation Foster Regional Convergence?“, OECD Economic Policy Papers, No. 17, OECD Publishing, Paris.
Bolia, N. and K. Jain (2016), “How Efficient is Indian Education” 'Livemint' E-Paper, available at: http://www.livemint.com/Opinion/5De0NZEOAgwHV5zOYCtWNP/How-efficient-is-Indian-education.html
Brys, B., S.Perret, A.Thomas and P. O’Reilly (2016), “Tax Design for Inclusive Economic Growth”, OECD Taxation Working Papers, No. 26, OECD Publishing, Paris. DOI: https://doi.org/10.1787/5jlv74ggk0g7-en
Buiter, W.H. and U. R. Patel (2010), “Fiscal Rules in India: Are They Effective?” NBER Working Paper No. 15934.
Burgess, R. and R. Pande (2005), “Do Rural Banks Matter? Evidence from the Indian Social Banking Experiment”, American Economic Review, Vol. 95, No. 3.
Chinoy S., P. Kumar and P. Mishra (2016), “What is Responsible for India’s Sharp Disinflation?”, IMF Working Paper, WP 16/166.
Crisil (2015), “When India Ages, Whither Pension For All” Crisil research, January. https://www.crisil.com/private-sector-pension-coverage/PPT/private-sector-pension-coverage.pdf
Debrun, X., T. Kinda, T. Curristine, L. Eyraud, J. Harris, and J. Seiwald, (2013), “The Functions and Impact of Fiscal Councils”, IMF Policy Paper, July.
Debrun X. and T. Kinda (2014), “Strenghtening Post-Crisis Fiscal Credibility – Fiscal Council on the Rise. A new dataset”, IMF Working Paper 14/58, https://www.imf.org/external/pubs/ft/wp/2014/wp1458.pdf
Duflo E., R. Hanna, and S. P. Ryan (2012), “Incentives Work: Getting Teachers to Come to School”, American Economic Review - June 2012 – Vol. 102, No. 4.
Duggal R. (2016), “Is NITI Aayog Even Thinking about Health?” Economic and Political Weekly, May 14, Vol. LI, No.20.
Fall F., D. Bloch, J.-M. Fournier and P. Hoeller (2015), “Prudent Debt Targets And Fiscal Frameworks”, OECD Economic Policy Papers, No. 15, OECD Publishing, Paris.
Fall, F. and J. Fournier (2015), “Macroeconomic Uncertainties, Prudent Debt Targets and Fiscal Rules”, OECD Economics Department Working Papers, No. 1230, OECD Publishing, Paris. DOI: https://doi.org/10.1787/5jrxv0bf2vmx-en
Gandhi, R. (2015), “Asset Reconstruction and NPA Management in India”, Keynote address delivered by Shri R. Gandhi, RBI Deputy Governor at The Economic Times ReModel in India - Asset Reconstruction & NPA Management Summit, Mumbai on Sep 15, 2015.
Government of India (2014), National Health Policy 2015 – Draft.
Government of India (2015a), Economic Survey 2014-15.
Government of India (2015b), National Policy for Skill Development and Entrepreneurship, Ministry of Skill Development and Entrepreneurship, New Delhi http://www.skilldevelopment.gov.in/assets/images/Skill%20India/policy%20booklet-%20Final.pdf
Government of India (2015c), “Report on the Revenue Neutral Rate and Structure of Rates for the Goods and Services Tax (GST)”, December 2015, http://finmin.nic.in/the_ministry/dept_revenue/Report_Revenue_Neutral_Rate.pdf
Government of India (2016), Economic Survey 2015-16.
Government of India (2016a), India: First Biennial Update Report to the United Nations Framework Convention on Climate Change. http://unfccc.int/essential_background/library/items/3599.php?rec=j&priref=7828#beg
Goyal S. and P. Pandey (2013), “Contract Teachers in India”, Education Economics, Volume 21, Issue 5, pp. 464-484 . http://www.tandfonline.com/doi/pdf/10.1080/09645292.2010.511854
Gynedi, R. (2014), “India's Nonperforming Assets: A Lurking Crisis”, CSIS, April.
Gulati A. and P. Banerjee (2015), “Rationalising Fertiliser Subsidy in India: Key Issues and Policy Options”, ICRIER Working Paper No. 307, August. http://icrier.org/pdf/Working_Paper_307.pdf
Hagemann R. (2011), “How Can Fiscal Councils Strengthen Fiscal Performance?” OECD Journal: Economic Studies, Vol. 2011/1.
ICRIER (2011), Report on Indian Urban Infrastructure and Services, March 2011, http://icrier.org/pdf/FinalReport-hpec.pdf .
IMF (2015), India: 2015 – Article IV consultation, IMF Country Report No. 15/61, March 2015.
IMF (2016), India: Selected Issues. Corporate and Banking Sector Vulnerabilities in India, IMF Country Report No. 16/76, March.
International Energy Agency (2015), World Energy Outlook.
Johansson A., C. Heady, J. Arnold, B. Brys and L. Vartia (2008), “Taxation and Economic Growth”, OECD Economics Department Working Papers, No. 620, OECD Publishing, Paris. DOI: https://doi.org/10.1787/241216205486
Joumard I., P. Hoeller, J.-M. Fournier and H. Morgavi (forthcoming A), “Public Debt in India: Moving towards a Prudent Level”.
Joumard I., H. Bourrousse and H. Morgavi (forthcoming B), “The Impact of State-Level Regulations on Allocative Efficiency across Firms in the Indian Organised Manufacturing Sector”.
Joumard, I., M. Pisu and D. Bloch (2012), “Less Income Inequality and More Growth – Are They Compatible? Part 3. Income Redistribution via Taxes and Transfers across OECD Countries”, OECD Economics Department Working Papers, No. 926, OECD Publishing. https://doi.org/10.1787/5k9h296b1zjf-en
Kantha S. (2016), “Is the Structure of Indian Manufacturing Geared towards Job Creation?”, posted on December 5 2016, Ideas for India.
KPMG (2015), Assessment of State Implementation of Business Reforms, https://www.kpmg.com/IN/en/IssuesAndInsights/ArticlesPublications/Documents/State-Assessment-Report.pdf
Krishnan K.P., V. Panchapagesan and M. Venkataraman (2016), “Land Market Reform is an Important Enabler of Bankruptcy Reform” https://ajayshahblog.blogspot.fr/2016/01/land-market-reform-is-important-enabler.html
Kumar B. and H. Behera Kumar (2016), “India’s Potential Output Revisited”, Reserve Bank of India Working Paper Series No. 5.
Kumar Behera H., S. Pattanaik and R. Kavediya (2015), “Natural Interest Rate: Assessing the Stance of India’s Monetary Policy under Uncertainty” RBI Working paper 05/2015.
Lancet (2015), “India - Small Progress in Health Care, Decline in Rural Services”, Vol 386 August 29.
Manpower (2015), 2015 Talent Shortage Survey, Milwaukee.
McGowan, M. and D. Andrews (2016), “Insolvency Regimes And Productivity Growth: A Framework For Analysis”, OECD Economics Department Working Papers, No. 1309, OECD Publishing, Paris. DOI: https://doi.org/10.1787/5jlv2jqhxgq6-en
Mehrotra S., ed. (2015), India's Skills Challenge – Reforming Vocational Education and Training to Harness the Demographic Dividend, Oxford University Press.
Mehrotra S., S. Sinha, J.K. Parida and A. Gandhi, (2014), “Why a Jobs Turnaround Despite Slowing Growth?”, IAMR Occasional Paper No.1/2014.
Mohanty D., A.B. Chakraborty, A. Das and J. John (2011), “Inflation Threshold in India: an Empirical Investigation”, RBI Working Paper No. 18.
Muralidharn K. and V. Sundararaman (2011) “Teacher Performance Pay: Experimental Evidence from India”, The Journal of Political Economy, Vol. 119, No. 1, pp. 39-77, February. http://www.rand.org/content/dam/rand/www/external/labor/seminars/adp/pdfs/2011/muralidharan2.pdf
Narayan S. (2016), “Towards Equality in Healthcare”, Economic and Political Weekly, Vol. LI, No. 12, March 2016.
NCAER (2009), “Moving to Goods and Services Tax in India: Impact on India’s Growth and International Trade”, Prepared for the Thirteenth Finance Commission Government of India
OECD (2013), “What makes civil justice effective?”, OECD Economics Department Policy Notes, No. 18, June. https://www.oecd.org/eco/growth/Civil%20Justice%20Policy%20Note.pdf
OECD (2014), OECD Economic Surveys: India 2014, OECD Publishing, Paris. DOI: https://doi.org/10.1787/eco_surveys-ind-2014-en
OECD (2015a), The Metropolitan Century: Understanding Urbanisation and its Consequences, OECD Publishing, Paris. DOI: https://doi.org/10.1787/9789264228733-en
OECD (2015b), The Future of Productivity, OECD Publishing, Paris. DOI: https://doi.org/10.1787/9789264248533-en
OECD (2015c), Pensions at a Glance 2015: OECD and G20 indicators, OECD Publishing, Paris. DOI: https://doi.org/10.1787/pension_glance-2015-en
OECD (2015d), Inequality and Inclusive Growth: Policy Tools to Achieve Balanced Growth in G20 Economies, https://www.oecd.org/g20/topics/framework-strong-sustainable-balanced-growth/Inequality-and-Inclusive-Growth-Policy-Tools-to-Achieve-Balanced-Growth-in-g20-Economies.pdf
Panagariya, A. and M. Mukim (2013), “A Comprehensive Analysis of Poverty in India”, World Bank Policy Research Working Paper.
PRS (2016), Standing Committee Report Summary, Ease of Doing Business, http://www.prsindia.org/administrator/uploads/general/1451884713_SCR%20Summary-%20Ease%20of%20Doing%20Business.pdf
Rajan R. (2016), “Financial Reforms - Past and Present”, C.D. Deshmukh Lecture at NCAER, New Delhi, January 29. https://rbidocs.rbi.org.in/rdocs/Speeches/PDFs/01SP25F52095C0BF43F59D7374F5C4880B5F.PDF
Rajan, R. (2016), “Issues in Banking Today”, Speech delivered at CII’s first Banking Summit, Mumbai, February 11.
Rastogi, S. (2015), “Recalibrating Fiscal Deficit”, Economic & Political Weekly, Vol N° 38, 19th September.
Regy P., S. Roy and R. Sane (2016) Understanding Judicial Delays in India: Evidence from Debt Recovery Tribunals, Ajay Shah blog, 18 May. https://ajayshahblog.blogspot.fr/2016/05/understanding-judicial-delays-in-india.html
Reserve Bank of India (2015a), Financial Stability Report, Issue No. 12, December.
Reserve Bank of India (2015b), Financial Stability Report, Issue No. 11, June.
Reserve Bank of India (2016a), Financial Stability Report, Issue No 13, June.
Reserve Bank of India (2016b), State Finances – A Study of Budgets of 2015-16.
Reserve Bank of India (2016c), Annual Report for the year 2015-16.
Reserve Bank of India (2016d), Financial Stability Report, Issue No. 14, December.
Sane (2015), "Concerns about Atal Pension Yojana”, Ajay Shah's Blog, 5th May.
Sengupta R. and A. Sharma (2016), “Corporate Insolvency Resolution in India, Lessons from a Cross-country comparison”, Economic and Political Weekly, Vol LI, No. 15.
Sharma D.C. (2016), “Medical Education and Regulation in the Spotlight in India”, The Lancet, Vol. 387, 9th April.
Sinha, N. and J. K. Yoong (2009), “Long-Term Financial Incentives and Investment in Daughters – Evidence from Conditional Cash Transfers in North India”, RAND Labor and Population working paper series, WR-667, February. https://www.rand.org/content/dam/rand/pubs/working_papers/2009/RAND_WR667.pdf
Smith K.R., N. Bruce, K. Balakrishnan, H. Adair-Rohani, J. Balmes, Z. Chafe, M. Dherani, H. Dean Hosgood, S. Mehta, D. Pope, E. Rehfuess, and others in the HAP CRA Risk Expert Group (2014), “Millions Dead: How Do We Know and What Does It Mean? Methods Used in the Comparative Risk Assessment of Household Air Pollution”, Annual Review of Public Health, 2014, pp 185-206. http://www.annualreviews.org/doi/pdf/10.1146/annurev-publhealth-032013-182356
Thomas, A., I. Joumard, T. Hanappi and M. Harding (forthcoming) “Taxation and Investment in India”, OECD Economics Department Working Papers.
Tripathi A., A.D Sagar, and K.R Smith (2015), “Promoting Clean and Affordable Cooking – Smarter Subsidies for LPG”, Economic and Political Weekly, Vol. L No. 48, 28th November.
Uttar Pradesh, Directorate of Environment (2016), “ENVIS Centre: Uttar Pradesh Status of Environment and Related Issues: Municipal Solid Wastes” http://upenvis.nic.in/Database/Municipal_Solid_Wastes_826.aspx , accessed 12th September 2016.
Wheebox (2016), India Skills Report, 2016 https://wheebox.com/logo/ISR-2016-small.pdf
World Bank (2013), Urbanisation beyond Municipal Boundaries, http://elibrary.worldbank.org/doi/abs/10.1596/978-0-8213-9840-1
World Economic Forum (2016), The Global Competitiveness Report 2016-17.