Assessment and recommendations
Over the past half century Indonesia has made remarkable progress across a broad range of economic and social dimensions. In general, health, education and other social outcomes have never been better, and higher standards of living are being enjoyed by more and more Indonesians. Over the past two decades democracy has taken hold, and bold strides in decentralisation have brought government closer to the people. As a member of the G20, Indonesia is actively engaged in world affairs, and economic integration with regional ASEAN (Association of Southeast Asian Nations) partners is moving ahead. Indonesia has strong growth potential: its population is young, the domestic market is large, it has a rich endowment of natural resources, public debt is low, and its political system is broad-based and stable.
The challenges for the years ahead are to diversify the economy by enhancing the nation’s human resources, thereby allowing skill- and labour-intensive sectors of the economy to flourish, and to ensure that living standards and well-being rise for all Indonesians. The key messages of this Survey are:
-
Indonesia’s policy is moving in the right direction to meet the challenges the country faces. Monetary and fiscal frameworks are strong. The government is advancing policy reforms to reduce impediments to doing business, improve the regulation of investment, shift budget resources away from subsidies to social security, health and infrastructure, and rationalise foreign investment rules.
-
The “big-bang” decentralisation that accompanied democratisation has proven to be very popular and has brought government closer to the people. To take full advantage of this initiative, however, the capacity of many sub-national governments needs to be strengthened: a task that will take some time.
-
Public spending and taxation are low, even compared with countries at similar levels of development. Increasing revenues is a priority, but there remains substantial scope to improve the efficiency and effectiveness of public spending at all levels of government.
Recent macroeconomic outcomes and short-term prospects
Low commodity prices and persistently weak external demand reduced GDP growth in Indonesia through 2015 (Table 1 and Figure 1). The fragile rupiah – which has depreciated by over one third against the US dollar over the past five years – and above-target inflation constrained the degree to which monetary policy could support activity. As exports weakened the current account deteriorated, further pressuring the rupiah (Figure 2). The authorities have taken measures to better manage foreign exchange to try to shore up the currency, including allowing more options for hedging.
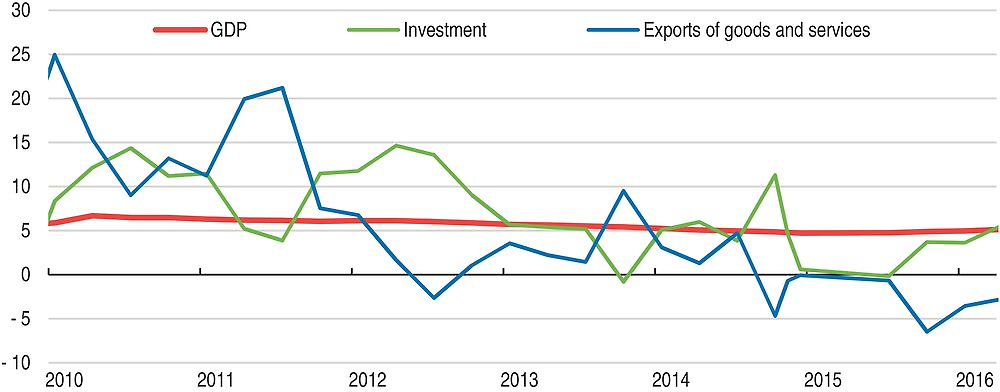
Source: OECD Economic Outlook database.
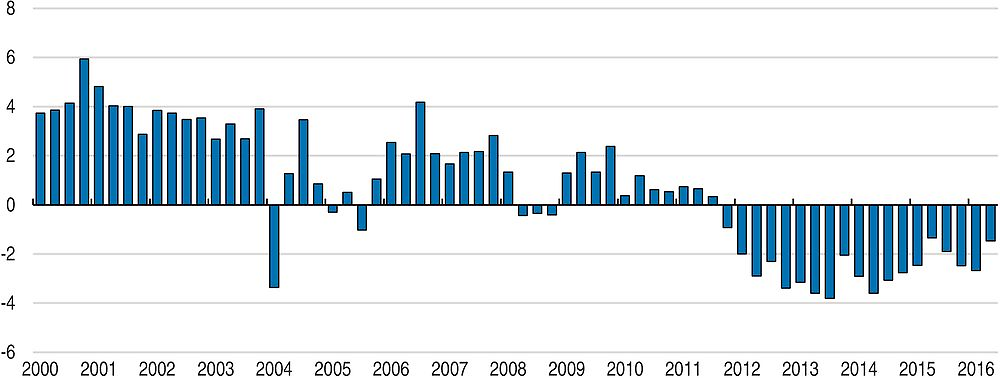
Source: OECD Economic Outlook database.
The end of the commodities super cycle in early 2011 and weaker global growth (including in Indonesia’s biggest export markets: Japan, China, the United States, India and Korea) have reduced fossil fuel, metal and agricultural export volumes and prices. Six of Indonesia’s top eight exports, accounting for 45% of goods exports, fall into these categories: palm oil, coal, natural gas, crude oil, rubber and copper (Figure 3). The impact of the fall in commodity prices has been partly offset by the falling rupiah, in line with other so-called commodity currencies such as the Malaysian ringgit (which has depreciated by around one fifth over the past five years), the Australian dollar (about one third) and the South African rand (more than one half) (Figure 4, Panel A). At the same time high rates of inflation has meant much smaller gains in competitiveness, limiting the boost to exports (Panel B).
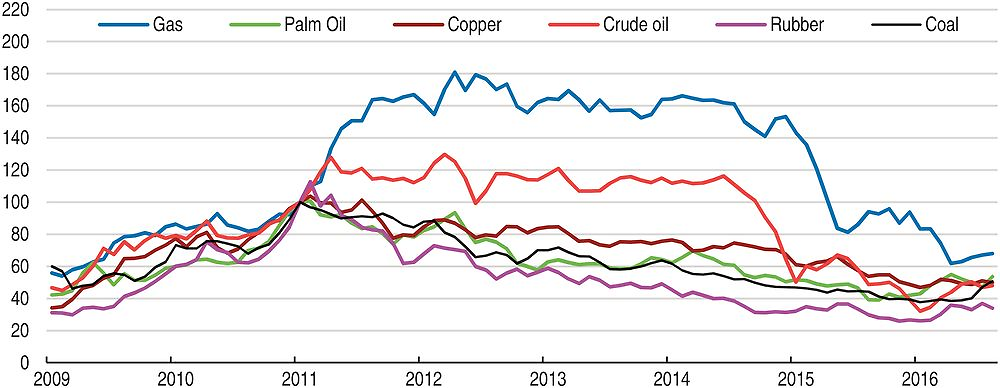
Source: IMF Commodity Price database.
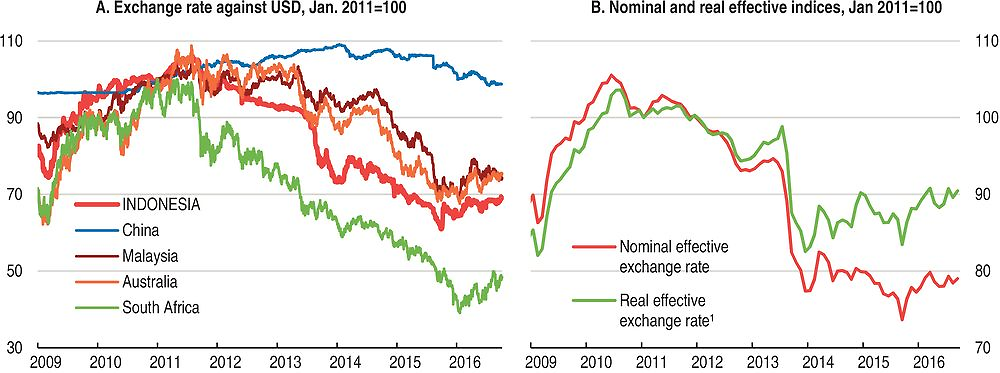
1. Effective exchange rate deflated by the CPI.
Source: Thomson Reuters; OECD Economic Outlook database.
While core inflation has been stable over the past few years, headline inflation exceeded Bank Indonesia’s (BI) target range for much of 2015 (4±1%) – driven by large increases in food and administered prices (subsidised fuels, electricity, transport fares) – before dipping back into it this year. However, inflation for administered-price items has fallen dramatically, as the government has passed through lower energy prices to consumers by cutting transport fares and electricity prices. On the other hand, retail fuel prices have not fallen to the same extent as world crude prices, as subsidies were removed. By January 2016 inflation had fallen back within the target range (Figure 5), and the rupiah staged a rebound against the dollar (Figure 4).
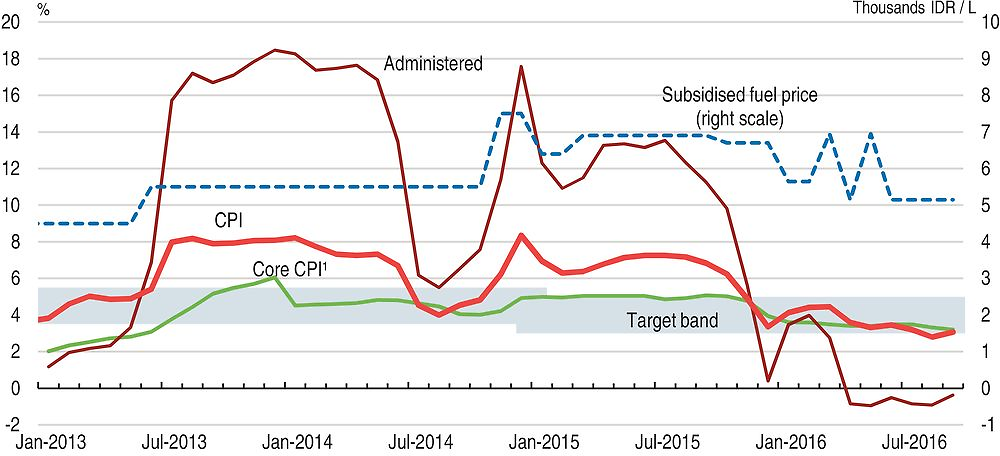
1. The core measure of inflation excludes volatile foods and administered prices.
Source: Bank Indonesia.
On the back of the inflation moderation, the stabilisation of the exchange rate and a return to a more sustainable external balance, BI has cut interest rates five times since January 2016, each time by 25 basis points, taking the (new) official rate down to 5.0% (Figure 6, Panel A). In addition, BI also reduced the rupiah-denominated primary reserve requirement by 100 points. Adjustments were also made to the macro-prudential framework to encourage lending. In August 2016 the Bank changed from targeting the 12-month rate to the 7-day reverse repo rate to improve the monetary policy transmission mechanism. Neverthess, real interest rates in Indonesia remain high (Panel B).
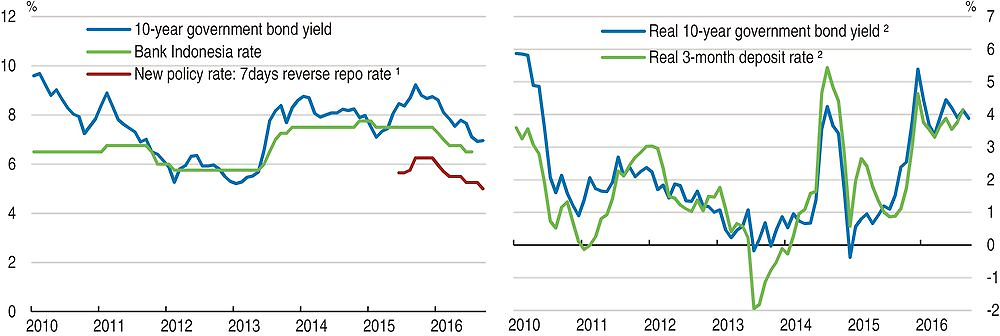
1. As of 19 August 2016 Bank Indonesia switched to a new policy rate known as the BI 7-Day Reverse Repurchase (repo) Rate.
2. Deflated with year-on-year CPI inflation rate.
Source: Thomson Reuters; OECD Economic Outlook database; Bank Indonesia.
GDP growth is expected to continue to pick up over the course of 2016 and into 2017 (Table 2). Despite persistently weak external conditions, confidence is returning, with government investment in infrastructure gathering pace, inflation moderating and a stable rupiah. Motor vehicle sales are trending upwards, credit growth is picking up, and the Purchasing Managers Index is recovering, suggesting stronger consumption and a rebound in business investment.
As for most of the world, the risks are largely on the downside, the most significant of which are international. If external conditions worsen significantly and the current account deficit widens, the exchange rate may come under renewed pressure from capital outflows, and the monetary authorities would have to delay, or even reverse, interest rate cuts. Domestically, if revenues continue to weaken, the government would have to make further expenditure cuts to avoid hitting the legal 3%-of-GDP deficit ceiling. If the shift from public to private participation in infrastructure investment does not happen as planned, activity will weaken, and confidence will suffer. Some extreme but unquantifiable potential shocks are described in Table 3.
The financial sector is healthy
Despite the slowdown in economic activity, the financial sector remains in good shape and is one of the most profitable globally. Banks’ non-performing loan ratio (NPLs) stood at 3.2% in July 2016, a slight increase over the previous three months. The deterioration in NPLs has been larger for banks that are more exposed to corporate borrowing and is increasingly reflected in their share prices. Going forward, the sector will be challenged, with sub-par economic growth, low commodity prices, pressure from the government to lower lending rates and the depreciated rupiah all weighing on asset quality and profitability. Nevertheless, sound capital levels and adequate liquidity will provide buffers against downside risks, and lower interest rates provide extra protection. The new Financial System Crisis Prevention and Resolution law clarifies the mechanisms for bank resolution (including bail-in provisions) and aligns the functions of the various supervisory agencies.
Corporate debt, at around 32% of GDP, remains low (IMF, 2015), although it has doubled over the past five years, and around two-thirds of it is denominated in foreign currency. Significantly more favourable lending conditions abroad and shallow domestic financial markets, particularly the thin corporate bond market, have discouraged domestic borrowing and driven firms to borrow actively in global bond and syndicated loan markets. In October 2016, out of a total of USD 170 billion of private foreign debt, less than one third (27.6%) had remaining maturities less than one year. However, a 2014 BI survey of 159 of the largest private borrowers that constitute over 80% of total private debt, only 35% undertook hedging transactions. The survey also revealed that 52% of companies that did not engage in hedging activity were purely domestically oriented and therefore did not benefit from a natural hedge. As a result of foreign-currency exposure, over the past two years there have been payment defaults in the telecommunications and mining sectors. In 2014 regulations were imposed on nonbank corporations to enhance risk management of foreign debt by mitigating liquidity mismatch, overleverage risk and currency risk through hedging. BI reports that since Q2 2015 Indonesian corporations as a whole have hedged their open position in foreign currency for up to three months more than required by these regulations. The authorities must continue monitoring the situation carefully.
The fiscal framework is strong
Indonesia’s fiscal position is in good shape, supported by legal caps on the fiscal deficit and public debt at 3% and 60% of GDP, respectively. The deficit has come closer to the limit for the last four years, reflecting to some extent the authorities’ desire to revive declining output growth (Figure 7); the OECD projects that the fiscal deficit will stay near 3% in the next two years due to both revenue constraints and ambitious spending programmes. However, public debt is low (about 27% of GDP in 2015), which is also a consequence of the relatively small size of the Indonesian government (Chapter 2). Nevertheless, even with limited indebtedness, debt service costs are a relatively high share of government revenues (Figure 8, Panel A). Moreover, the implicit interest rate paid on the stock of Indonesia’s public debt is also high (Panel B), reflecting exchange rate uncertainty and sovereign risk.
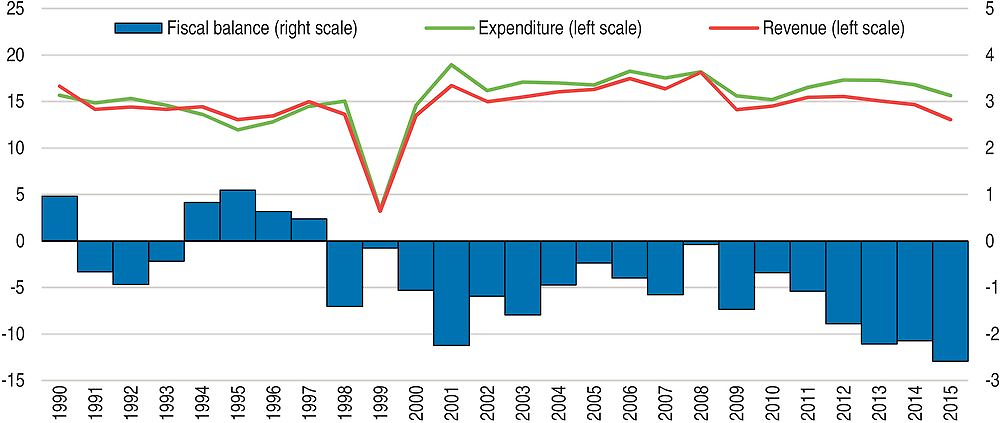
Source: CEIC database.
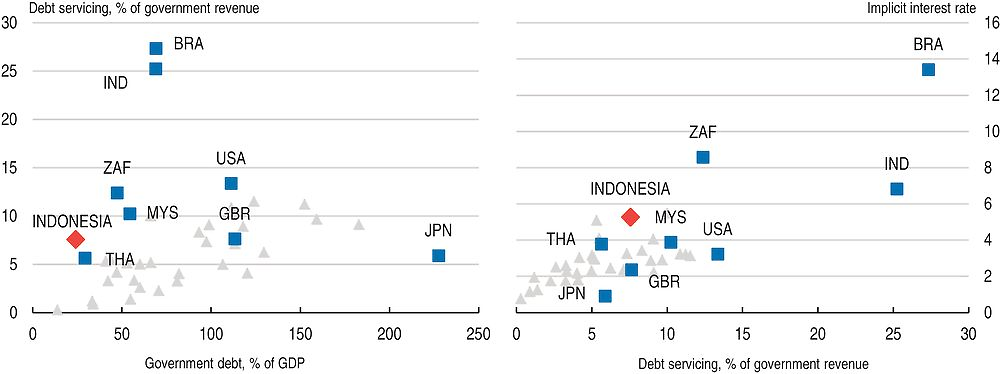
Note: Fiscal year 2014/2015 for India. 2015 for Brazil.
Source: OECD Economic Outlook database; World Bank World Development Indicators database; IMF Government Financial Statistics database; Reserve Bank of India; South African Ministry of Finance; CEIC.
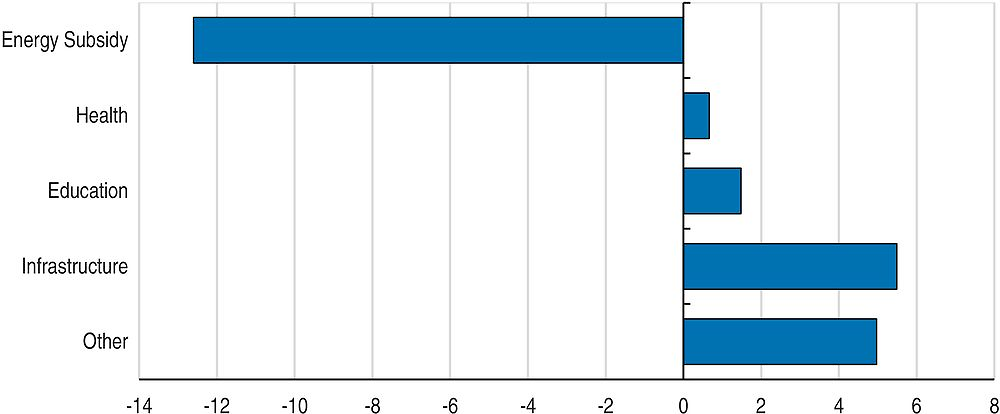
Public spending has undergone a major overhaul since the 2014 election. In particular, fuel subsidies have been mostly scrapped: they comprised nearly 14% of total expenditures in 2014 but dropped to about 3% in 2015. However, remaining energy subsidies (including for electricity), representing about 7% of public spending, should also be phased out completely. A welcome reform related to electricity began to limit government subsidies as of mid-2016 to only 25 million households in need, about half as many as in 2015. The implementation of this reform is targeted for completion by the end of 2016.
Consistent with OECD (2015a) recommendations, much of the fiscal space created from lower energy subsidies has been used for social spending and higher infrastructure spending (Figure 9). The authorities are also using direct capital injections into public enterprises to boost infrastructure investment. While this seems an easy way to expedite prioritised projects, it is critical to follow sound corporate governance principles (OECD, 2015d), particularly given that such projects potentially represent large contingent fiscal liabilities.
Source: CEIC database.
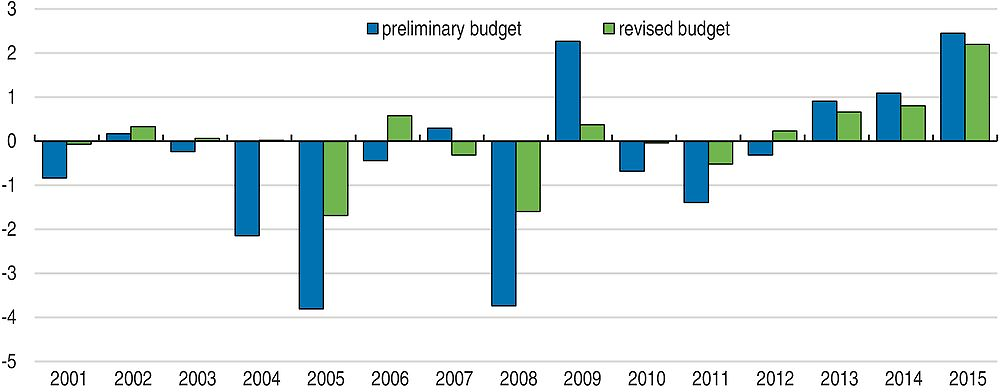
Over the last three years revenues have been over-estimated in both preliminary and revised budgets (Figure 10), partly due to lower oil prices. Lower-than-projected GDP growth also raised the deficit. The mid-term revisions, which in the past have diminished gaps that emerge in the preliminary budget, have, in the last three iterations, reduced the errors only marginally. For 2016, the preliminary budget projected revenues over 20% higher than the 2015 realisation, and the mid-year revision assumed revenues only about 2% lower than initially expected. Based on first-semester collections, which were down about 5% year-on-year, the government cut expenditure by less than 1% as part of the official budget revision in June. It subsequently decided to further revise down spending in August, with an additional reduction of 6.5%.
Source: CEIC database.
Budgets need to adopt more realistic projections so as to significantly reduce foreseeable shortfalls. Adjusting expenditures and financing late in the year should be avoided. Otherwise, Indonesia is at risk of harming its fiscal credibility, unexpectedly postponing projects involving third parties (which may entail heavy compensation) and borrowing at unfavourable interest rates. Indeed, approaching the end of 2015, the government dipped into its reserve fund (unspent revenues accumulated from previous years) and also issued IDR 25 trillion (almost USD 2 billion) in debt with yields exceeding market levels. Annual budgeting should be more closely linked to an explicit medium-term fiscal plan, and consideration should be given to establishing an independent fiscal authority to ensure unbiased projections.
Revenues need to increase
As discussed in the previous Survey, tax revenue is low in Indonesia, at only 10.7% of GDP in 2015 – down from 11.4% in 2012. In order for the government to play a greater role in the provision of public services – including by strengthening the social safety net, improving the skills of the citizenry and enhancing public infrastructure – it needs to raise more revenue. Greater non-tax revenues are available from, for example, marine sources and, if public enterprise efficiency can be boosted, from dividends. As to taxes, Indonesia should review its corporate income tax (CIT) system in general, and the CIT holidays for specific sectors and investment projects in particular (OECD, 2012a). The government should also consider expanding immovable property taxes (IMF, 2016). Also, as discussed in previous Surveys, the value-added tax (VAT) could raise significantly more revenue if the framework were simplified, including reducing exemptions (OECD, 2012a). As discussed in Chapter 1, sub-national governments rely heavily on central government transfers to fund their mandated activities. They should be given the legal wherewithal to fully exploit their revenue potential, provided that they can improve their fiscal management and budgeting through greater technical assistance from central government. This would both lighten the fiscal burden on the central government, while also increasing autonomy and accountability at the local level.
Tax evasion is high and voluntary compliance low (OECD, 2015b). Only 27 million taxpayers were registered in 2014, out of a population of 260 million, and only 900 000 of those paid what they owed. Past efforts have resulted in improvements: there were only 10 million taxpayers in 2008. The authorities should continue strengthening tax administration and improving tax collection and enforcement. Digitalisation, cross-checking sources of information for tax audits and allocating greater resources to the Directorate General of Taxes should all be stepped up. The ongoing expansion of electronic invoicing for the VAT is a positive development, but easier access to personal financial data by authorities would also be useful. The 2013 measure to allow SMEs (with turnover below IDR 4.8 billion or USD 360 000) a special low turnover tax rate of 1% in order to formalise has been quite successful. The current tax amnesty programme (see below), makes provision for SMEs to regularise their tax arrangements, which should also help draw them into the formal sector. Making personal social security contributions and disbursements through the income tax system would also encourage participation in the tax system more generally.
The government is undertaking a tax amnesty to bolster incentives for wealthy taxpayers to repatriate overseas assets. Concessional tax rates are applied, including lower rates for repatriated assets. The government expects immediate benefits of repatriation in addition to tax revenues, including underpinning the external balance, supporting government bond issuance (accredited banks will invest repatriated funds in government bonds, including specific infrastructure bonds) and boosting liquidity and private investment in a period of relatively slow GDP growth. Expectations of tax revenues from the amnesty vary enormously. The first phase expired in September 2016 and there are to be two subsequent phases with higher penalties applying. As at end-September, over 400 000 Indonesians had declared assets to the value of IDR 3 500 trillion (USD 280 billion). To date, the programme has generated IDR 90 trillion in revenue, 50% of the government target of IDR 165 trillion. Indonesia previously implemented amnesties in 1984 and 2008. Experiences of repeated tax amnesties in OECD countries have been characterised by only temporarily increased tax revenues and encouragement of future evasion. That said, with the OECD’s Automatic Exchange of Information (AEOI) regime due to come into force in the next two years, the timing of the amnesty is good, as it provides taxpayers with an opportunity to regularise past non-compliance prior to the entry into force of AEOI standard (OECD, 2015e). However, authorities must communicate clearly that this offer will not be repeated and that henceforth the AEOI will be used to locate undeclared assets and that full penalties will apply.
Equality and inclusiveness
As noted in the previous Survey, over recent decades Indonesia has made impressive inroads into poverty, aided by strong per capita income growth and targeted poverty-reduction programmes. It has been largely successful in achieving its Millennium Development Goal (MDG) targets of reducing poverty, increasing access to primary education and reducing the prevalence of certain diseases. However, income inequality is high and rising, and outcomes for remote indigenous populations continue to lag. The current mix of social programmes, including cash transfers conditioned on school attendance and a subsidised rice programme, are not well targeted, although greater use of the single registry of vulnerable households should help to address this. Investment in social infrastructure is also lagging. While PISA outcomes are in line with Indonesia’s current stage of development, the education system still suffers from serious quality and access problems.
Gender equality in Indonesia has improved significantly over the last two decades. Female life expectancy, at 73, is now higher than the global average of 71. Innovative microcredit schemes are assisting more women in becoming entrepreneurs. Female participation in education has also improved greatly at all levels. Nonetheless, there are areas for improvement. Labour market participation by women, at around 51%, is relatively low, and maternal mortality remains high.
The regional aspect of equality and inclusiveness is important in a large and diverse country like Indonesia, most especially since decentralisation has put more and more responsibilities for the delivery of social services into the hands of sub-national governments (see below). The successful achievement of Indonesia’s Sustainable Development Goals (SDGs) will need to involve all levels of government.
Advancing industrialisation by getting the fundamentals right
Indonesia has a long history of policies designed to bring about structural change to diversify the economy, mainly so as to lessen the reliance on commodities and promote local value added by shifting activity towards manufacturing, and promoting exports and import substitution. At the same time policies have sought to bolster the agricultural sector by increasing productivity and protecting it from competition. This has often been implemented in the name of food security (see below). However, factors such as endemic corruption, skills shortages, excessive bureaucratic regulation, and poor infrastructure have held back structural transformation.
The previous Survey discussed in detail the policies required to promote inclusive and sustainable structural change, including the critical importance of putting the fundamental framework conditions in place. Being more open to foreign trade and investment would allow greater engagement in global value chains (GVCs), thereby creating high-skill, well-paid employment and facilitating technology transfer.
The ASEAN Economic Community and other international economic agreements
On 31 December 2015 the ASEAN Economic Community (AEC) came into effect. The AEC aims for economic integration among the 10 Southeast Asian member countries, including the launch of a single market, the tariff-free flow of goods, services and investment, and lower restrictions on the flow of capital. The agreement has a strong focus on promoting small and medium-sized enterprises (SMEs), which will boost inclusive growth, and skilled labour in eight occupational areas will be free to move between countries. While it is estimated that there are almost no explicit tariffs on goods and services traded among the ASEAN-6 (Brunei, Indonesia, Malaysia, Philippines, Singapore and Thailand), much progress is required on lowering non-tariff barriers operating across the AEC countries (Ernst & Young, 2015).
In October 2015, President Widodo announced his intention to push for Indonesia to sign up to the Trans-Pacific Partnership (TPP), an agreement among 12 Pacific Rim countries (Australia, Brunei, Canada, Chile, Japan, Malaysia, Mexico, New Zealand, Peru, Singapore, United States and Viet Nam), which together constitute around 40% of global GDP and 800 million consumers. The TPP’s goals are to “promote economic growth; support the creation and retention of jobs; enhance innovation, productivity and competitiveness; raise living standards; reduce poverty; and promote transparency, good governance, and enhanced labour and environmental protections.” The TPP includes strong support for SMEs, a recent focus of Indonesian reforms. SMEs stand to gain the most by cutting through shipping and other bureaucratic “red tape.” For example, it provides for more efficient and transparent customs procedures, advance rulings on how products will be treated to prevent surprises at the border, expedited shipping, and reduced paperwork. This is especially important for SMEs, which typically do not have the resources that larger companies have to navigate through complicated and restrictive trade bureaucracy.
Indonesia already has free trade agreements (FTAs) with seven of the 12 TPP countries, but not with either the United States or Canada. With regional competitors like Malaysia and Viet Nam having signed up, Indonesia may miss out on market access for its exports and as a consequence may not be as attractive to foreign investors (Cheong, 2013). Signing up to the TPP will require considerable political will, especially in overcoming resistance to the TPP investment chapter (which includes an investor-state dispute settlement mechanism) and restrictions on the role of state-owned enterprises (SOEs), which are important in Indonesia.
The European Union is the second largest investor in the Indonesian economy and fourth largest trading partner, representing almost 10% of its total external trade. The Indonesia-European Union comprehensive economic partnership agreement (IE-CEPA) has faced significant delays, but renewed political will means that it is now expected to be concluded by 2019. Indonesia and the European Union have signed but not yet ratified the Forest Law Enforcement Governance and Trade (FLEGT), which will help Indonesia obtain a license to export legally sourced timber and other forest products to Europe. In March 2016, Australia and Indonesia restarted negotiations of the Indonesia-Australia Comprehensive Economic Partnership Agreement (IA-CEPA), which covers trade, investment and economic cooperation.
Indonesia’s broader engagement in international trade, more intensive participation in GVCs and fuller exploitation of its comparative advantages, including in service exports, are also being held back by regulatory impediments (Figure 11). Indeed, its reliance on imports of certain basic services, such as international freight transport and logistics, could be lessened if domestic competition were stimulated in these sectors. The successful implementation of the reform packages recently announced by the government will help in this regard (see below).
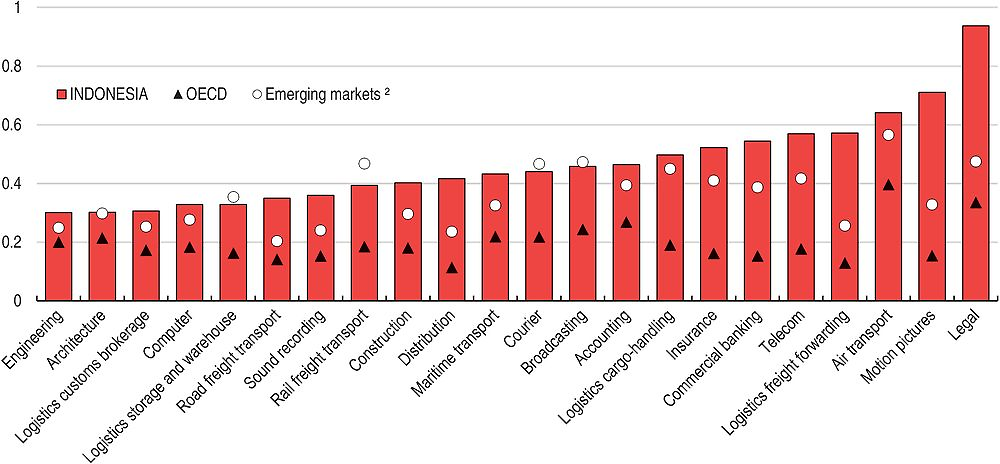
← 1. The Services Trade Restrictiveness Index (STRI) components take values between zero and one, one being the most restrictive. The STRI database records measures on a most-favoured-nation basis; preferential trade agreements are not taken into account. The database has been verified and peer-reviewed by OECD members.
2. Emerging markets are an average of Brazil, China, Colombia, India, Indonesia, Russia and South Africa.
Source: OECD Services Trade Restrictiveness Index database.
Competitiveness and the business climate
One of the keys to economic development through structural change is the promotion of a competitive, innovative and dynamic private business sector. The challenges facing Indonesia are illustrated by global competitiveness rankings (Figure 12): labour market efficiency, primary education outcomes, technological readiness, and infrastructure. The government is making progress in some of these domains, like the provision of infrastructure, while in others, such as labour market regulation, a lot remains to be done. The sub-national aspect is also important, not least in a decentralised country like Indonesia, where much of the regulatory oversight of corporate activity has been devolved to sub-national jurisdictions (Chapter 1).
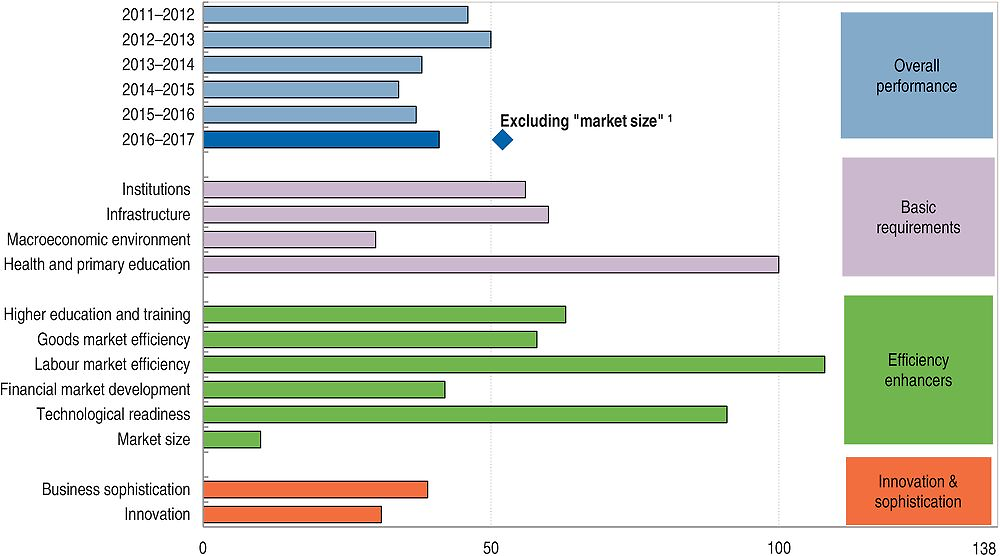
1. Recalculated ranking for Indonesia when excluding “market size” subcomponent.
Source: World Economic Forum, Global Competitiveness Report 2016-2017.
The government has put heavy emphasis on improving the business climate. The series of reform packages released beginning in September 2015 bear witness to the government’s determination to improve conditions for businesses – both domestic and foreign – particularly with regard to promoting investment (Table 4). However, some proposed changes still require further implementing regulations. The government has also acknowledged that a significant part of the problem resides at the sub-national level – and, indeed, in July 2016 3 000 sub-national government regulations that were inconsistent with national legislation were scrapped. The President has set a target to elevate Indonesia to at least 40th place among 189 economies in the World Bank’s Doing Business report.
Some progress has been made. In the Doing Business rankings Indonesia moved from 120th to 109th between 2015 and 2016. However, the bulk of this improvement came from changes to corporate tax rules, a subcategory in which Indonesia still ranks just 148th (Figure 13, Panel A). For example, the number of tax payments a firm is required to make in a year fell from 64 in 2015 to 54 in 2016, but Indonesia still ranks 180th in this subcategory. This contrasts with six tax payments per year in Singapore, 13 in Malaysia, and 22 in Thailand. In its 12th reform package the government stated its intention to reduce tax payments per year to just 10.
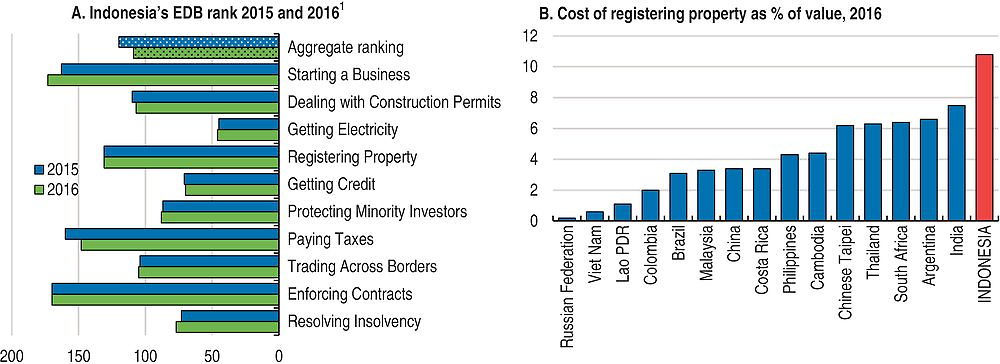
1. Rankings of the subcomponents of Indonesia’s Ease of Doing Business (EDB) index.
Source: World Bank, Doing Business.
The cost to a business of registering a property, at over 10% of the value of the property, is well above that of comparator countries (Figure 12, Panel B). Likewise, despite efforts to set up one-stop shops in all regencies/cities (the second tier of sub-national government), starting a business is still relatively arduous, with the time to register a business still long (ranking 173th; Table 5) at around 47 days on average and a very high minimum paid-in capital requirement. Reforms in the April 2016 reform package aim to cut the time and cost of business registration and reduce the cost and number of procedures required to register a property.
In many of these regulatory areas regional governments have principle administrative responsibility. If Indonesia is to make significant progress in improving the business climate, sub-national governments need to streamline and harmonise bureaucracy. As noted in Chapter 1, there is enormous regional variation in these regulations, with some matching international best practice and others that should be encouraged to emulate the leaders. To this end, the central government should offer greater incentives for sub-national governments to put in place policies that promote business development. For example, it could offer a greater share of corporate or payroll tax revenues or enforce greater regulatory harmonisation.
Further progress could be made putting in place policies that: i) reduce transaction taxes and the tax on the acquisition of land and buildings by imposing a ceiling or replacing them with fixed fees; ii) improve coordination among government agencies, so that businesses are not obliged to notify each agency of having completed administrative tasks in another; iii) step up monitoring of the implementation of national regulations across the country; iv) speed up procedures at the land registry office; and (v) make the business registry electronic. Most OECD countries have electronic business registries, and a significant number offer online registration (World Bank, 2016).
Infrastructure
A lack of infrastructure, especially in transportation, logistics and water treatment is hampering Indonesia’s economic, business and social development. The World Economic Forum Global Competitiveness Report (2016-17) ranked Indonesia 60th out of 138 economies with regard to its infrastructure. Poor infrastructure inhibits Indonesia’s international trade, competitiveness and foreign investment. Internal trade is also suffering. According to data published by the Indonesian Chamber of Commerce and Industry (KADIN), a typical Indonesian company devotes around 17% of its total expenditure to logistics, in contrast with around 10% in other economies in the region. Despite Indonesia’s archipelagic geography, sea transport remains poorly developed (Figure 14). Weak transport infrastructure contributes to large disparities in prices across the country. For example, President Widodo himself recently noted that gasoline sold for around IDR 7 000 per litre in Jakarta, but as much as IDR 60 000 per litre in Wamena, Papua and that a sack of cement priced at IDR 60 000 in Jakarta could cost as much as IDR 2.5 million in the Papua highlands.
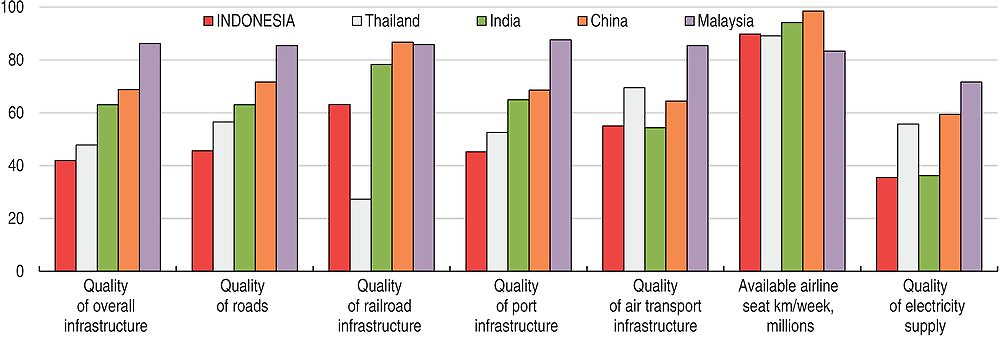
Source: World Economic Forum, Global Competitiveness Report 2016-17.
The quality and supply of electricity is also variable, with some areas plagued by blackouts. The state-owned electricity company, Perusahaan Listrik Negara (PLN), is a monopoly and is heavily dependent on government subsidies to bridge the gap between the cost of production and the administratively fixed selling price. It has had few financial resources for large-scale investments, and demand has therefore outstripped supply. The government plans to boost generation capacity by around 35 GW by 2020, while also almost eliminating the use of expensive fuel oil and increasing the use of coal and renewables, for which a variety of local community-based initiatives are underway (Figure 15). Coal-fired power plants will make the most significant contribution to the planned increase in supply. However, the expansion of coal-fired generation due to its relative abundance and low cost may undermine key environmental policy objectives (see below).
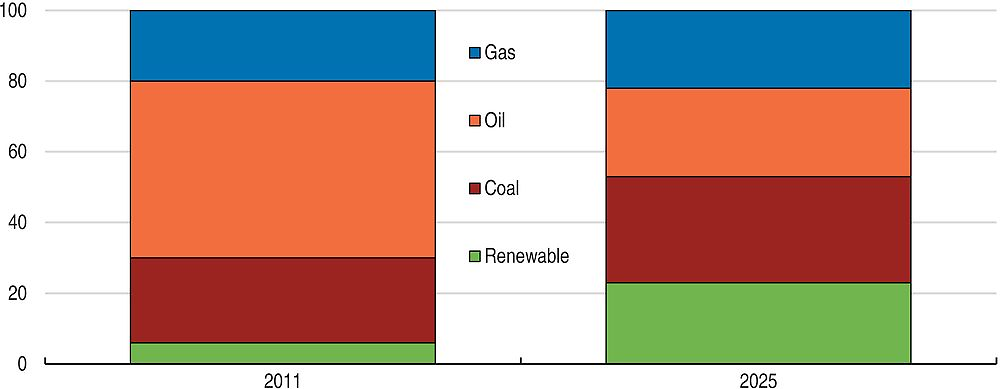
← 1. Indonesian authorities do not consider biomass as a renewable energy. This explains the difference with Figure 24 (Panel B).
Source: Ministry of Energy and Mineral Resources.
As discussed in the previous Survey, land disputes have stalled infrastructure projects for years or caused them to be cancelled altogether. But there have recently been steps to improve the land acquisition process. In 2012 a new Land Acquisition Law was promulgated to speed it up. However, infrastructure provision failed to improve owing to a lack of coordination and conflicting interests between central and local governments. In 2015, the President issued a decree to amend the 2012 law, allowing private actors to finance land procurement, thus opening up previously closed off financing channels. Also in 2015, a land bank was established, jointly managed by the finance, public works and transportation ministries, which facilitates government purchases of land required for infrastructure development.
No matter the sector it is crucial to ensure that infrastructure maintenance be scheduled and adequately financed, as this is often the cheapest means to ensure its quality and availability. For instance, as described in Chapter 1, in many provinces, more than half of all roads are classified as in disrepair. Furthermore, at least for new infrastructure, user charging is called for, not only to help in the financing of provision, but also to efficiently gauge when expanding capacity is appropriate. In addition, besides an effective project selection process, including conformity with overall national priorities, the authorities need to ensure efficient implementation. Finally, despite longstanding government efforts to promote public-private partnerships (PPPs) to leverage up the impact of public spending, they have failed to take off in Indonesia. Projects are by nature risky and complex (requiring in-depth knowledge on the part of the government negotiators), and the returns are spread out over a long horizon. While minimum revenue guarantees can help get private firms involved, the government should take care not to assume all project risks itself. The OECD principles for the Public Governance of Public-Private Partnerships offer guidelines for the management of PPPs (OECD, 2012d).
Foreign direct investment and the Negative Investment List
Indonesia’s large domestic market, growth prospects, natural resource endowment and abundance of low-cost labour makes it a potentially attractive foreign direct investment (FDI) destination (Hornberger, 2011). Despite difficult international conditions, FDI inflows have picked up substantially over the past few years but remain lower than in some other countries (Figure 16).
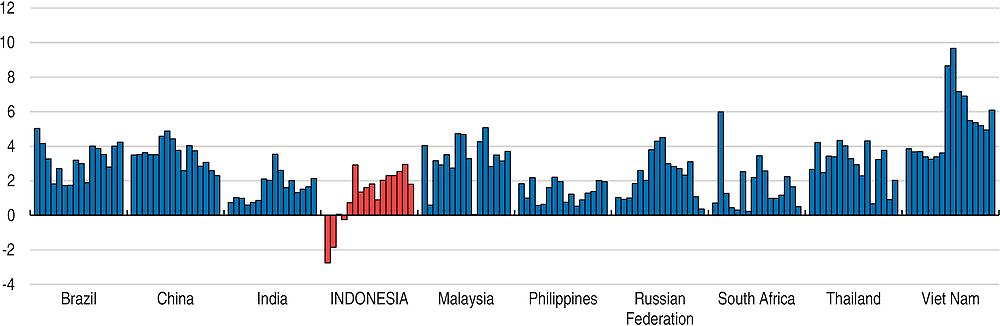
Source: International Monetary Fund, International Financial Statistics and Balance of Payments databases; World Bank, International Debt Statistics; OECD estimates.
The poor business environment is the key factor holding back FDI. Excessive and overlapping regulation, including across the different levels of government, have made establishing and conducting business difficult for both foreign and Indonesian entrepreneurs. Long-standing explicit limitations or outright bans on foreign participation in certain sectors have obviously limited activity. Seen from a broad perspective, Indonesia has significantly liberalised restrictions on inward investment over time, albeit at a slower pace more recently (OECD, 2010). Yet, there remains significant variation in terms of statutory restrictions on FDI in comparison with regional peers and other OECD countries (Figure 17). According to the OECD FDI Regulatory Restrictiveness Index, manufacturing has been widely liberalised, but many primary and service sectors remain partly off-limits to foreign investors, holding back potential economy-wide productivity gains.
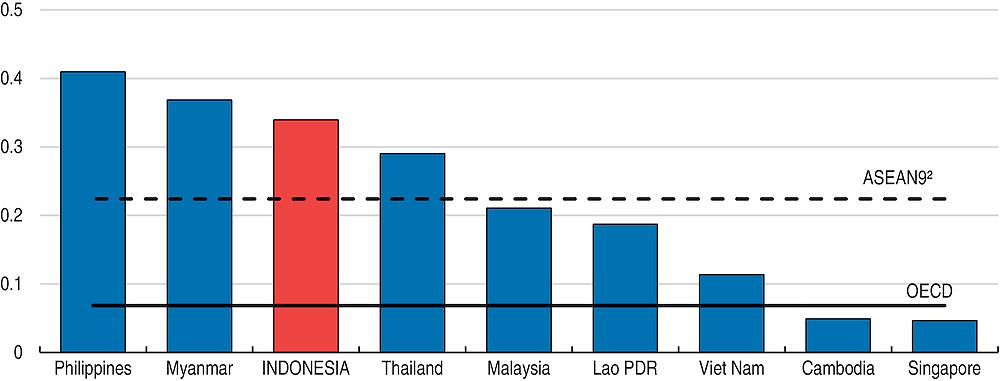
← 1. The OECD FDI Regulatory Restrictiveness Index covers only statutory measures discriminating against foreign investors (e.g. foreign equity limits, screening & approval procedures, restrictions on key foreign personnel, and other operational measures). Other important aspects of an investment climate (e.g. the implementation of regulations and state monopolies) are not considered. Data reflect regulatory restrictions as of December 2015. Data for Cambodia, Lao PDR, Singapore, Thailand and Viet Nam are preliminary.
2. ASEAN 9 is Cambodia, Indonesia, Lao PDR, Malaysia, Myanmar, Philippines, Singapore, Thailand and Viet Nam.
Source: OECD FDI Regulatory Restrictiveness Index database.
Recently, things have been moving in the right direction with a May 2016 revision to the Negative Investment List that removed 35 sectors which are now fully open to foreign ownership, bringing Indonesia’s FDI regime closer to international and regional levels of openness. Importantly, it also signals a more positive attitude towards foreign investment, notably with the lifting or easing of foreign equity restrictions in key sectors. For example, foreigners are now allowed to fully own geothermal power plants of more than 10 megawatts through PPPs and to hold 49% of smaller power plants. Foreigners will also be allowed to fully own e-commerce businesses, but the cap on foreign investment in the retail sector remains. This comes at a critical moment as the previous negative list, issued in 2014, had adopted a more heterogeneous stance towards foreign investment by the government. However, despite some liberalisation, the 2014 list reversed some of the opening trend that had been observed in previous periods and notably made foreign investment in some key sectors, such as mining, more restrictive. In turn, these divestment rules have discouraged foreign investment in large, long-term, capital-intensive projects (Annex A.2), while seemingly arbitrary government decisions at the regional level (such as the case of Churchill Mining in East Kalimantan) have also discouraged foreign investors. Unfortunately, in the May 2016 revision, 20 additional sectors were added to the list, notably including formal education and certain activities in the construction industry. A much better approach would be to abolish the Negative Investment List except for sectors deemed essential to national security.
Corruption and governance
Corruption also remains a real barrier to foreign investment, especially as other governments are cracking down on bribery in overseas jurisdictions, as per the OECD Anti-Bribery Convention. While Indonesia has made headway in tackling corruption in recent years, it remains the most significant barrier to doing business in Indonesia according to the Global Competiveness Report 2016-17 (Figure 18). Furthermore, according to Transparency International’s Corruption Perception Survey, Indonesia ranked 88th out of 168 countries in 2015, improving only slightly from 2014. Statistics Indonesia compiles a survey-based corruption index, which shows that perceptions of corruption have increased in recent years, but experience of corruption has fallen somewhat.
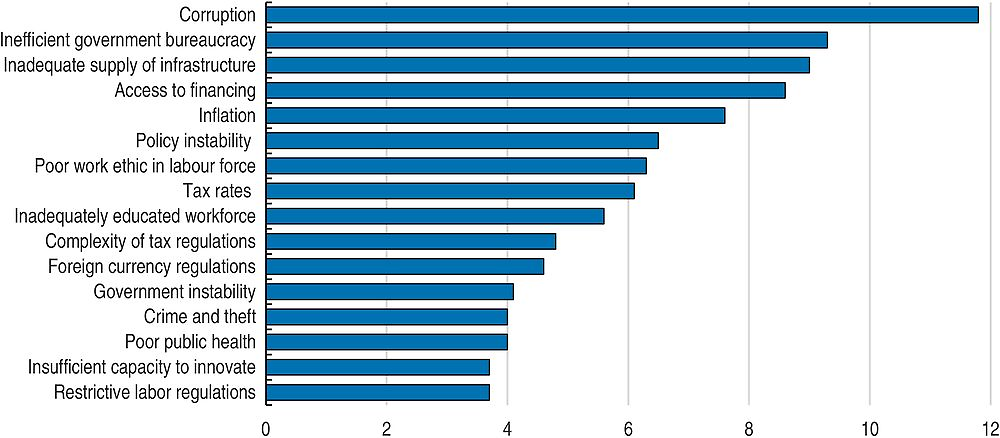
← 1. Surveyed firms were asked to select the five most problematic factors for doing business in their country and to rank them between 1 (most problematic) and 5. The score corresponds to the responses weighted according to their rankings.
Source: World Economic Forum, Global Competitiveness Report 2016-17.
As noted in the previous Survey, the work of the Corruption Eradication Commission (KPK) has had a great deal of success in combating corruption and raising awareness of its scale and pernicious nature. The KPK is limited to only investigating corruption implicating public officials and cases involving greater than IDR 1 billion (USD 76 000). The KPK remit should be extended to include the private sector, and it should be given the resources needed to do so. In recent years the integrity of the KPK has come under attack. For instance, in 2015, the institution was paralysed after its deputy chairman and two commissioners were arrested. In addition to increasing its resources, the government needs to vigorously defend the KPK. In particular, moves to scrap the KPK’s surveillance powers should be strongly opposed, and the government should veto the proposal to give a parliamentary body the power to terminate KPK investigations.
As described in Chapter 1of this Survey, corruption is a major issue in the regions, where understanding of what is involved is often poor. The issue has become more urgent as sub-national jurisdictions have proliferated and administrative responsibilities have been devolved. Given often weak legal and administrative capacity at the sub-national level, greater top-down monitoring has been found to be the most effective means of reducing corruption in Indonesia’s regions (Olken, 2007). Taking further steps towards eradicating corruption would also help to improve tax collection, not just at the sub-national levels but also nationally. Indeed, perceptions of a high level of bribery have been found to contribute to lower tax compliance (Rosid et al., 2016). Survey data also suggest that taxpayer underreporting is more sensitive to variation in high-level corruption than to petty official misconduct.
In the medium term, however, the solution to corruption will require improving the administrative capacity of sub-national governments. The KPK should focus greater attention on corruption in the regions, including through workshops and training to assist sub-national governments to identify and address corruption. Public governance is a major issue in Indonesia, with inefficient bureaucracy ranking as second in the Global Competitiveness Report survey of impediments to doing business (Figure 17). While on many measures Indonesia has recorded notable improvements (Figure 19), in numerous aspects there is still a long way to go. The OECD’s Open Government Review of Indonesia (OECD, 2016a) makes a number of recommendations aimed at improving governance by means of greater transparency and inclusiveness, including measures to address the complexities of Indonesia’s decentralised governmental structure. Likewise, the OECD Review of Regulatory Reform for Indonesia (OECD, 2012c) identifies policies to promote institutional development and improve regulatory management. This includes better coordination of regulatory management practices and establishing clearer policy frameworks and institutional responsiveness, including at the sub-national level.
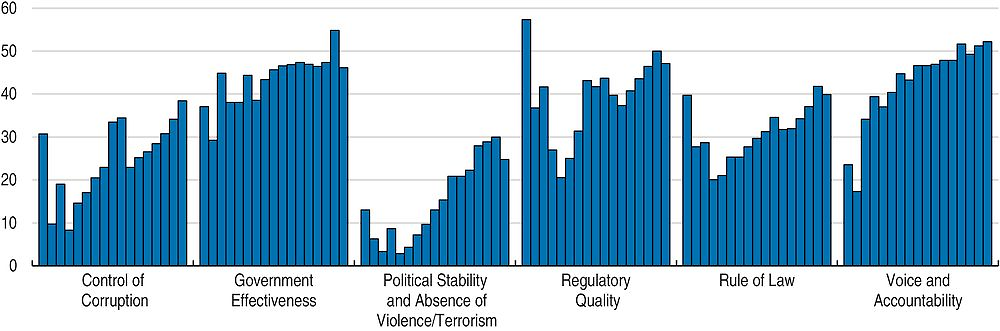
Source: World Bank Worldwide Governance Indicators (WGI).
The capacity of sub-national governments to deliver high-quality public services is often lacking, and so are the frameworks that monitor the proper and efficient use of public resources. This has not been helped by the decision when setting up the decentralised structures to by-pass the provincial governments, which had previously borne most of the regional administrative and services delivery responsibilities and therefore had the greatest technical capacity. Smaller jurisdictional units suffer from a lack of economies of scale. Moreover, jurisdictions often remain ill-defined or overlap, and local legislation and regulations are frequently at odds with national policies. The continuing subdivision of political and administrative units, which has been termed “blossoming”, is exacerbating the situation. Between 1999 and 2015 the number of provinces increased by over 30%, the number of regencies/cities by 55%, districts by 77% and villages by 20% (see Chapter 1).
The labour market and informality
One of the factors holding back the competitiveness of the Indonesian economy is an inefficient labour market, as discussed in the previous Survey. Recent reforms to the minimum-wage-setting framework are welcome. Minimum wage increases will henceforth be limited to real GDP growth plus the rate of inflation, whereas previously they had been set by regional governments largely without regard to local labour market conditions (Chapter 1). Using this formula, GDP growth in Q2 2015 of 4.7% and September 2015 inflation at 6.8% resulted in a minimum wage increase of 11.5% across all provinces in 2016, well below the rises accorded in previous years.
However, one problem with this arrangement is that GDP may grow for reasons other than average productivity growth, for instance due to demographics or increases in the participation rate: there is no justification for wage increases for these reasons. In any case introducing a sub-minimum wage for youth would be useful.
The restrictiveness of hiring and dismissal rules in Indonesia far outstrips those of almost every other country in the world (Figure 20, Panel A). For instance, to dismiss a worker with one year’s seniority, the mandated redundancy payment is 58 weeks of pay (Panel B). Putting in place a comprehensive unemployment insurance scheme, as was done in Chile in 2002 and in Korea in 2005, would obviate the need for these large severance payments (Holzmann et al., 2011). More broadly, besides high minimum wages, labour restrictions protect insiders and encourage enterprises to operate informally. Indeed, some 60% of the nation’s labour force works in the informal sector and thus suffer from minimal employment security, volatile incomes, very limited workplace health and safety regulation and an absence of pensions. Provisions have recently been made to extend social security systems to the informal sector, but uptake has been limited.
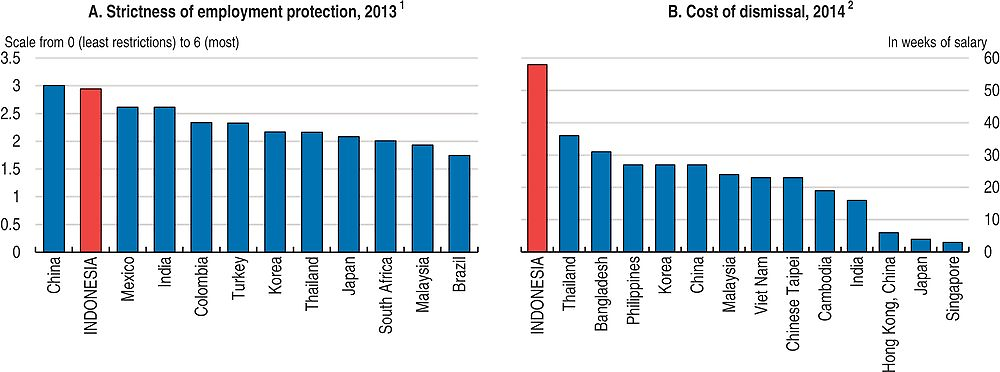
1. The indicator of employment protection legislation (EPL) measures the procedures and costs involved in dismissing individuals or groups of workers and the procedures involved in hiring workers on fixed-term contracts.
2. The cost of dismissing a worker after one year of employment, in weeks of salary.
Source: World Economic Forum; OECD Employment Protection Database.
Improving worker skills
Access to compulsory education in Indonesia has improved greatly over recent years (MOEC, 2013), and, as noted in the previous Survey, the academic performance of 15 year-olds is in line with Indonesia’s level of development. However, less than a third of adults aged between 25 and 60 have an upper secondary education (OECD and ADB, 2015). Likewise, the skills of workers, as measured by the 2015 OECD Survey of Adult Skills (conducted only in Jakarta) (OECD, 2016b), are weak, with low levels of proficiency in literacy and numeracy. The dispersion of proficiency scores across adults is also wider than in most other participating countries. The widest skill gaps across professional profiles are for English and computer skills followed by thinking and behavioural skills (di Gropello et al., 2011).
Skills mismatch is also a problem in Indonesia, with firms reporting difficulties finding skilled workers despite high unemployment among those with a tertiary education. In 2010, about 55% of tertiary graduates were “over-qualified” in their employment, the highest mismatch in South-East Asia (World Bank, 2010). Improving the skills of the workforce, particularly by improving the quality of schooling and access to adult education, is essential. Only around 5% of all firms in Indonesia offer formal training to their workers, considerably lower than in many other comparable countries (OECD, 2015a). Moreover, the dual nature of the labour market makes it unlikely that training will be offered to a large swath of the labour force working in the informal sector.
Promoting regional development
In large part for political reasons the “big bang” decentralisations in 2001 and 2005 in Indonesia devolved substantial funds and authority to local governments, including responsibility for the administration and delivery of many public services and also the regulation of business and natural resources. The rationale for government decentralisation is better accountability and service delivery through increased responsiveness to local needs (Faguet, 2014), often called “subsidiarity”. Moreover, decentralisation can improve performance by promoting competition between regions in the efficient provision of services and attracting businesses – regions can draw lessons from each other and benefit from best practices (OECD, 2013). That said, care should be taken to avoid situations where inter-regional competition spurred by decentralisation leads to a race to the bottom in areas like fees and charges, and subsidies aimed at attracting business investment.
However, regional autonomy has not delivered the improvements that had been hoped for (Resosudarmo et al., 2014; Buehler, 2010; Moeliono et al., 2009; World Bank, 2009). The heterogeneity in economic and social outcomes remains large (Figure 21). This is despite a steady increase in transfers from central to sub-national governments, which now make up about half of the central government budget (net of subsidies and interest payments; about 6% of GDP).
Source: Statistics Indonesia.
Indonesia has set up special economic zones (SEZs) with a view to promoting investment in the regions. There are currently nine SEZs, and the government intends to set up 17 more by 2019. Free trade zones (FTZs) have been another strategy for promoting regional economic development. Only one FTZ was ever set up in Indonesia: the Batam, Bintan and Karimun Free Trade Zone (BBK FTZ), located on the Riau Islands close to Singapore. To date these zones have failed to attract significant investment or generate significant employment, due to their isolated locations, a shortage of infrastructure and lack of jurisdictional clarity. The government should experiment with different incentives in SEZs, including more flexible labour regulation, to extend proven good practices to the whole economy.
Better targeting fiscal transfers and improving regional revenue raising
Sub-national governments in Indonesia have very limited revenue-raising capacity, and the majority of their funding comes from central government transfers. In 2015 89% of all government revenue was collected by the central administration, while it handled only 47% of expenditure. Transfers from the central government are allocated directly to three sub-national levels of government: namely the provinces, the regencies/cities and villages. Districts are funded and administered by the regencies/cities. In broad terms there are three categories of transfers: i) equalisation funds; ii) deconcentration funds (to finance central government offices or agencies in the regions that deliver services directly); and iii) village funds. Equalisation funds are the largest and have been broken down into a number of subcategories including a General Allocation Fund (DAU) and a Special Allocation Fund (DAK). The DAU is by far the largest source of revenue for regional governments, with half earmarked for public-sector wages and salaries and the remainder unconstrained. The DAK is small by comparison, accounting for only 5% of regency/city revenues and 1% of province revenues, and is earmarked.
However, the central government’s commitment to fund regional public-sector employment has led to mushrooming public-service jobs. Public employee compensation represents about 28% of total public expenditures. This share is especially high at sub-national levels and higher than on average in the OECD (23%), where the size of government is generally much greater. In addition, some regions have up to four times as many public employees per capita as others (Figure 22). A side-effect of this large public service has been a large share of regional capital spending on government office space (Lewis and Oosterman, 2011).
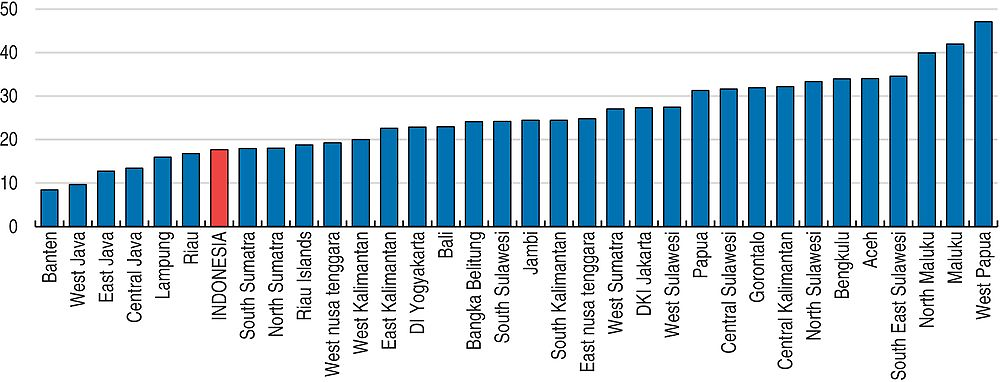
Source: CEIC database.
In the longer term, regional governments should be given block grants according to some fiscal equalisation formula that reflects sub-national needs and national priorities. However, due to the lack of capacity, many regional governments in Indonesia struggle to spend all of their annual budget allocations. Deposits held by local governments increased from IDR 90 trillion (USD 6.8 billion) in December 2015 to IDR 220 trillion in April 2016 – an increase of 140%. This frustrates constituents, including local businesses, and is hampering the central government both in its attempts to pursue national priorities such as improving infrastructure and also to provide fiscal stimulus during the current economic slowdown. In the short term, sub-national fiscal performance could be improved by tying grants more closely to specific programmes, particularly in areas of national priority, such as infrastructure investment. One way of doing so would be to make more use of the DAK, in which funds are allocated for particular purposes. The DAK has recently increased significantly to accommodate regional aspirations in order to accelerate the development and provision of infrastructure facilities. Furthermore, in order to become well targeted, the government is continuing to try to improve the DAK’s allocation and disbursement mechanism. At the same time, greater efforts are needed to improve the technical capacity of regional governments so that they are in a better position to formulate spending priorities, raise revenues and administer budgets. The programme of secondments of officials from the central government to sub-national governments to facilitate skills transfer should be expanded. The government should also promote and broaden the scope of the system of national public-service training schools.
Boosting regional infrastructure investment
The government has rightly emphasised infrastructure as a major impediment to Indonesia’s economic development. However, infrastructure investment also needs to be encouraged at the sub-national level, given that half of all public spending is now at that level. A number of reforms could help in this regard. First, the central/sub-national budget process – including revenue estimation – could be improved to reduce uncertainties and interruptions that are inhibiting complex multi-year infrastructure projects. Second, greater efforts should be made to align sub-national projects with national strategies. Third, fiscal incentives should be sharpened so that sub-national governments ensure adequate upkeep of existing infrastructure, such as road maintenance. For example, national co-financing of sub-national road investment could be made conditional on such maintenance. Finally, land acquisition laws should be made more flexible to encompass regional diversity in land ownership traditions.
Improving public spending
Despite impressive improvements over the last 50 years, including in achieving the Millennium Development Goals (MDGs), Indonesia still lags behind many other middle-income countries in terms of development indicators, including health (mortality rates and stunting), poverty, and educational outcomes. Better use of public money would significantly boost the effectiveness of government policies and provide the fiscal space to further develop currently underfunded spending areas: for example, public health-care budgets represented only about 1% of GDP in 2015, although the government increased the budget allocation for health to 5% of total public expenditure in 2016 in a context of constrained public revenues.
Prioritising public governance by adopting best practices, especially at sub-national levels
Broad spending targets (for example, 20% for education and 5% for health) currently shape government priorities but are inefficient because there are no constraints on how to use the funds (Blöndal et al., 2009). Closer correspondence between annual expenditure and clear medium-term objectives, together with performance-based budgeting, could significantly improve efficiency. This should be accompanied by systematic evaluation of existing and envisaged programmes and administration. Improvements are planned for the 2017 budget but will only apply to the central government.
As discussed above, governance challenges are major barriers to the efficient delivery of public services, especially at the sub-national level. There is an extreme diversity in performance across levels of governments and across regions (see KPK, 2014 for examples in the mining sector). This raises the importance of ramping up capacity building, notably through training. The efforts should be targeted towards regions in need, including those with low official ratings and difficulties in spending their budget allocations or reporting statistics. Digitalisation should also be exploited, as it hastens the circulation of information, reduces errors and improves transparency. Additionally, eradicating corruption would help considerably (see above). In particular, broadening the use of electronic procurement would limit bribery and also have positive effects on the quality and right-sizing of government projects.
Enhancing education, social assistance and health
Education is an essential part of Indonesia’s budget with a global spending target share of 20%, but outcomes have suffered from a lack of performance-related objectives. The education system should learn from the review of the teacher certification programme, which has generated an improvement in attained degrees for new teachers, but has above all increased the wage bill, with limited increases in teaching quality (Chang et al., 2014). The focus should gradually shift towards secondary education, because it is less well funded by international standards, especially for the poorest. Indeed, enrolment rates for those in the lowest income quintile are much improved for pupils under 15 but still drop significantly after that (World Bank, 2013).
Public outlays for social assistance (less than 1% of GDP) are particularly low, even compared with other middle-income countries (1.4% for India; 2.1% for China; 2.8% for Brazil; and 3.1% for South Africa), while poverty remains relatively prevalent. This justifies the expansion of conditional cash grant schemes, including replacing existing unconditional programmes, which tend to be fragmented and are not well-targeted. The development of a national poverty database (see below) is welcome and should be pursued through a comprehensive identification number system.
The goal of universal health coverage by 2019 involves a major fiscal commitment. Indeed, the extra amount required could be as much as an additional 2% of GDP by 2020 (Guerard et al., 2011), without considering expected increases in line with economic development (higher demand and supply, and lower out-of-pocket disbursements) and catching-up in health outcomes. Particular needs are to address shortages of hospital beds, especially in Java, and physicians. Chapter 2 of this Survey examines in more detail how to improve the efficiency of Indonesia’s public spending, especially with regards to health, education and infrastructure.
Confronting the perniciousness of childhood stunting
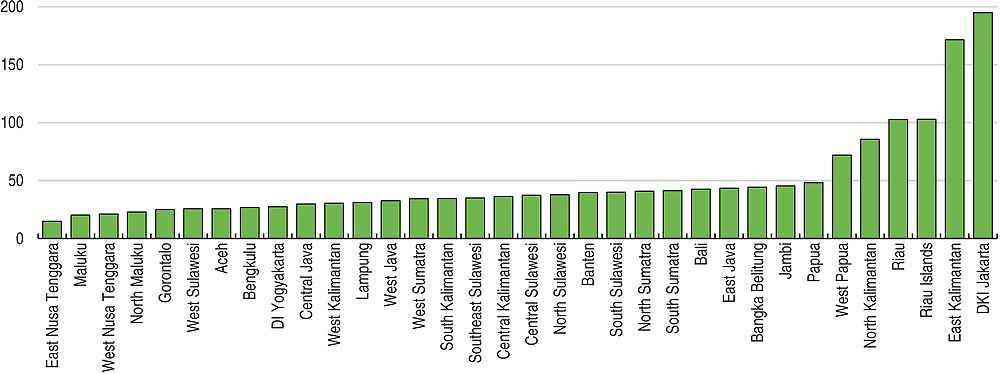
One specific health issue that urgently deserves more targeted resources is stunting (children having a low height for their age), which is associated with frequent and early exposure to undernourishment and/or illness. In Indonesia in 2013, 36% of all children under the age of five (8.4 million) were stunted. This is one of the highest rates in the world and puts Indonesia on par with countries with much lower GDP per capita, such as Bangladesh, Nepal and Sierra Leone (Figure 23). In 15 of Indonesia’s 34 provinces the prevalence of stunting is above 40%, peaking at 48% in East Nusa Tenggara. Furthermore, 20% of Indonesian children under five (totalling 4.4 million) are underweight. The incidence of stunting has actually increased marginally in recent years, which may be related to the decentralisation of health-care services and the lack of resources and capacity at the sub-national level.
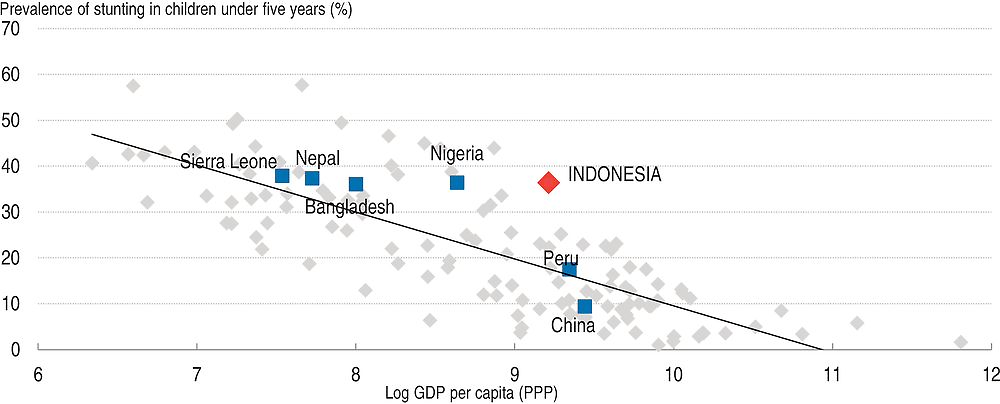
Source: International Food Policy Research Institute Global Hunger Index database; World Bank World Development Indicators database.
The effects of stunting are devastating for a child’s future, as they are life-long and largely irreversible. They include delayed motor development, impaired cognitive function, lower IQ and poor school performance (Hoddinott et al., 2011; Grantham-McGregor et al., 2007). Moreover, stunted children do worse in school, earn less in adult life and are more susceptible to non-communicable diseases and obesity in adulthood (Bhutta et al., 2013; Hoddinott et al., 2011; Martorell et al., 2010). Given that young people are one of any nation’s most precious resources, especially in Indonesia where there is an ongoing demographic bonus, the prevalence of stunting and its associated effects on cognitive capacity is a national tragedy, not only in terms of economic development but also for the young victims.
Hoddinott et al. (2013) examine the economic rationale for investments that reduce stunting by constructing estimates of benefit–cost ratios for a set of nutritional interventions in a sample of 17 countries. Their estimated benefit-cost ratios average 18 across all sample countries but are the highest in Indonesia at 48. This suggests that anti-stunting programmes compare favourably with other investments competing for public funds.
Policies are in place to tackle early-childhood undernourishment and illness. For instance, in September 2012, the government launched the “First 1 000 Days of Life Movement”, which aims to accelerate nutrition improvement by promoting breastfeeding (only around 40% of infants under six months are exclusively breastfed) and distributing vitamins and nutrition supplements for pregnant and breastfeeding women and children and medicines to prevent and treat malaria in pregnant women and children. However, slow progress clearly suggests that more needs to be done. Indeed, high levels of food insecurity and relatively high prices for basic staples may well contribute to the prevalence of undernourishment (see below).
Ensuring food resilience
Food resilience is meant to ensure food availability, especially to the poor, at reasonable prices (Dawe and Timmer, 2012). This is not the same as self-sufficiency, which in Indonesia may be very hard to achieve due to the lack of well-suited land (Dawe, 2013). Indeed, pursuit of self-sufficiency may hinder resilience, as import restrictions to try to achieve self-sufficiency increase food costs, leaving people more exposed to local food-supply shocks, and hinder the agricultural sector’s competitiveness and productivity (OECD, 2012b). Food resilience has improved in recent years, with only 15% of districts considered vulnerable in 2015, down from 22% a decade ago (FSC et al., 2015). The MDG target to halve hunger and extreme poverty between 1990 and 2015 was largely achieved.
Food policy in Indonesia encompasses a number of programmes and represents about 7% of total public spending. The authorities’ focus has been mainly on price stability and national self-sufficiency in core products. Rice is key, as it makes up 50% of dietary energy supply. Rice prices in Indonesia over the last eight years have both been more volatile and higher than Thai export prices (Figure 24). Indeed, Indonesia has the highest wholesale rice price in emerging Asia, which is a particular burden on low-income households. OECD (2015c) concluded that global price hikes are not as important as domestic disaster scenarios as regards food resilience in Indonesia.
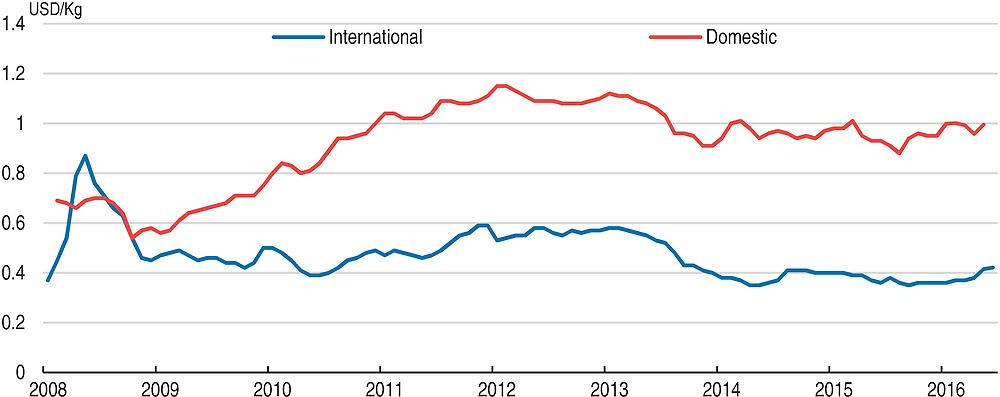
← 1. Domestic refers to Indonesia national average retail price. International corresponds to the Thai export price (25% broken).
Source: FAO, Food Price Monitoring and Analysis Tool.
Intervention in the food market is in large part managed by National Logistics Agency (BULOG), a state-owned enterprise that manages stocks to moderate price fluctuations by buying rice directly from farmers and controlling imports. However, the ratio of rice stocks to domestic demand has been declining due to insufficient production and imports: in 2016 it was only 2.6% versus 4.7% in 2014, by far the lowest amongst ASEAN economies and also below what is considered the optimum level of 20% (AFSIS, 2015).
Relief to low-income households is provided by RASKIN, a government programme (about 1% of total spending in 2015) providing the poorest 15 million households with 15 kg of subsidised rice per month. However, as highlighted in the previous Survey (OECD, 2015a), only a third of this support goes to intended beneficiaries, who often end up paying more than the intended subsidised price and receive only a portion of their quota (Banerjee et al., 2015). Progress is being made in addressing this situation with the implementation of a national poverty database (PPLS14) covering 40% of the lowest income households. To be effective, the database needs to be regularly updated (OECD, 2015a).
The government should replace RASKIN with a targeted voucher system to allow diversification of food consumption. BULOG’s monopoly on the distribution of rice should also be removed to let other potential actors (domestic and foreign traders) compete, thereby obtaining likely efficiency gains. In addition, food supply should be further liberalised by removing most import barriers. Regional agricultural cooperation in Asia would also allow a better management of supply, while at the same time reducing import restrictions and providing some risk-sharing against crop failure. That said, a previous attempt at such cooperation (the ASEAN Emergency Rice Reserve) was ineffective due to very low national reserve requirements. The revised agreement (ASEAN Plus Three Emergency Rice Reserve), launched in early 2013, is more ambitious, with large commitments from China, Japan and Korea, but is untested. In Indonesia, BULOG’s role should be refocused as the manager of emergency food reserves (OECD, 2015c).
Another facet of food policy is a set of fertiliser subsidies, totalling about 3% of public spending in 2015, that are intended for small farmers. Around a third of these subsidies was misallocated in 2015 and largely benefited the largest farms (Reuters, 2016). Moreover, there is strong evidence that fertiliser subsidies ultimately discourage farm output (Armas et al., 2012). OECD (2015c) argues that the subsidies are ineffective in strengthening food resilience and have only a weak impact on food prices. The government should instead provide insurance against bad harvests as the best means to maintain farmers’ revenue and investment. There has been recent progress on this front. Fertiliser subsidies should be phased out, and outlays should be reoriented. In particular, the government should refocus its efforts to boost output on improving agriculture-related infrastructure.
Deforestation and other environmental challenges
Indonesia is rich in a wide variety of natural resources, which were generating as much as half of export revenue and a quarter of GDP before the recent downturn in commodity prices. However, exploiting them may produce important externalities. For example, dealing with climate change means that a large share of Indonesia’s fossil fuel (especially coal) reserves may need to remain in the ground – at least until low-polluting technology becomes available. Indonesia’s emissions of greenhouse gases per unit of output are relatively low by OECD standards (Figure 25, Panel A) but will need to fall substantially to meet its target of emissions 29% below business-as-usual projections in 2030 (41% with international support).
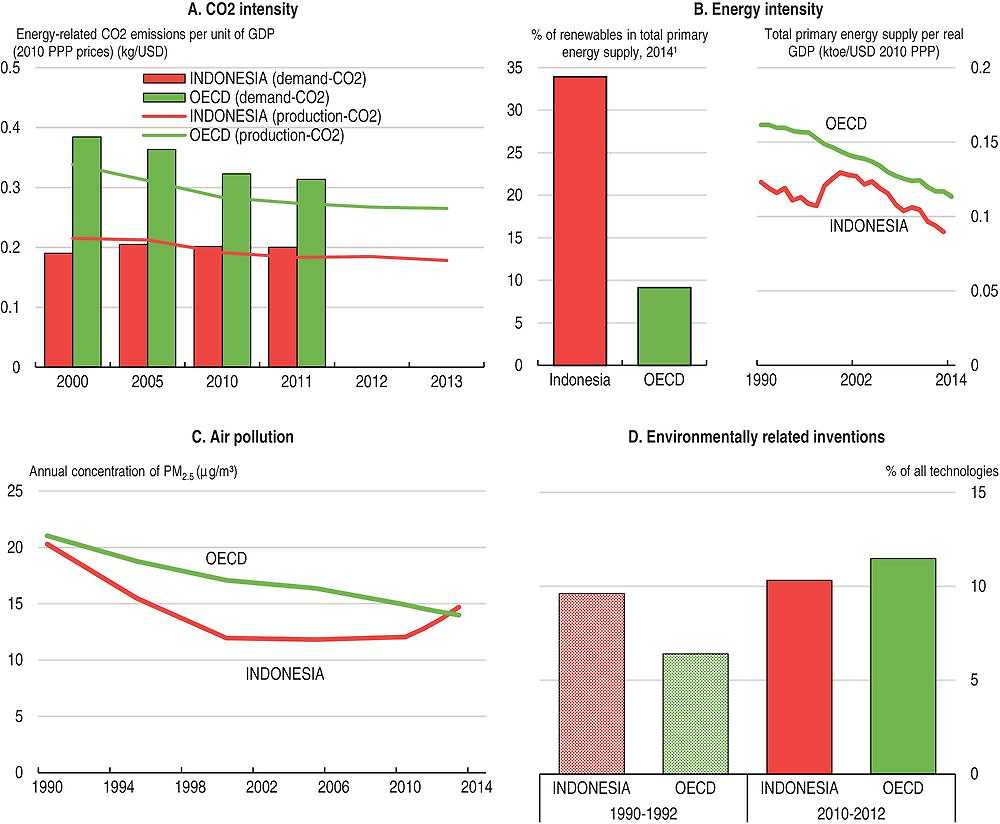
1. OECD considers biomass as a renewable energy. This explains the difference with Figure 15.
Source: OECD Green Growth Indicators.
Air pollution
Forest fires may be responsible for the most acute individual episodes of air pollution, affecting both Indonesia and neighbouring countries. Coal-fired power generation, neighbouring countries’ activities, rapid urbanisation and concomitant increasing road traffic and congestion are also important causes of deteriorating air quality (Figure 25, Panel C).
Between June and October 2015, large fires flared up in natural forests and peatlands, threatening unparalleled reserves of biodiversity. That year, about 2 million hectares of land burned, costing Indonesia USD 16.1 billion (World Bank, 2015). The smoke from a similar event in 1998 resulted in an estimated 11 000 deaths (Marlier et al., 2013) and affected 75 million people in six countries (Stolle and Tomich, 1999). Reductions in fire-related emissions account for a significant part of the 29% cut in greenhouse gas (GHG) emissions by 2030 promised by the Indonesia government in the context of COP21. The government estimates that deforestation and fires account for 63% of the country’s GHG emissions (Indonesian Government, 2015). Fires are a cheap and frequently utilised tool for clearing land for cash crops, notably palm oil and plantation timber. Unclear land tenure is also a contributing factor, as initially burned areas were often appropriated illegally. Burning to clear land is prohibited, but enforcement has proven difficult due to diffuse responsibilities across different level of governments, weak capacity at the sub-national levels and low fines.
Palm oil in particular generates significant fiscal earnings and stimulates economic growth in rural areas, but its expansion often occurs at the expense of natural forests, endangered animal and plant species, and the quality of life of local and indigenous communities. While a 2011 Presidential moratorium (renewed in 2015) was declared on new plantation licenses, it does not limit activities or expansion by existing license holders and appears insufficient to curb GHG emissions from forest fires (Busch et al., 2015). Those failures should spur the authorities to tackle the issue by toughening legislation and its enforcement, and by increasing penalties. Spatial mapping should also be pursued to help stop illegal exploitation. Incentives to increase productivity rather than acreage (notably through the use of higher-quality seeds, better processing and transportation, and the grouping of smallholders into cooperatives) should be promoted, along with the use of environmental certification. Indeed, the labour productivity of the palm oil industry is about 40% higher in Malaysia (Sigit, 2015).
Fisheries
Indonesia is at the centre of one of the world’s major fishing areas; its catch is the second largest in the world, after China’s, and is growing rapidly (Figure 26, Panels A and B). While traditional informal management systems operate in some areas, most of the fisheries in the region are fully or over-exploited. Destructive fishing techniques are damaging the environment, especially coral reefs, which are already at risk from global warming. Government support for the industry through fuel subsidies and infrastructure is significant. Though the main growth in Indonesian fishing is in pisciculture, the capacity of the traditional fishing industry is still growing, raising sustainability risks.
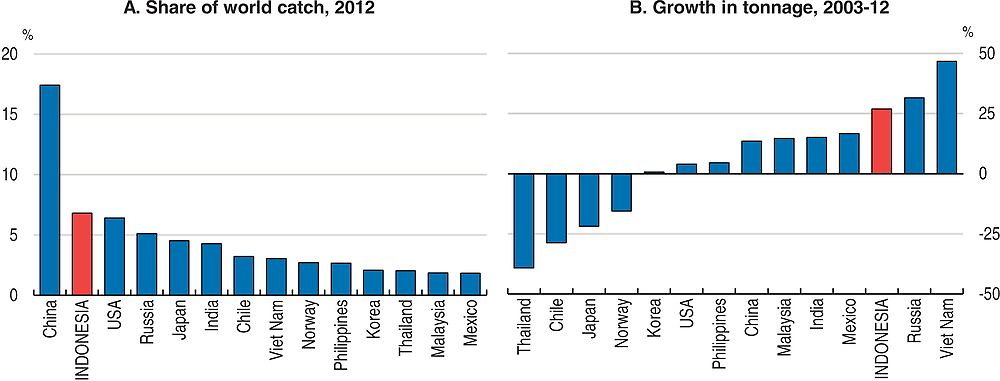
Source: FAO (2014), “The State of World Fisheries and Agriculture”, United Nations Food and Agriculture Organisation.
Renewables and energy
Indonesia’s geothermal potential stands at nearly 30 gigawatts (GW) – about 40% of world capacity – of which only 5% is currently being used (Nasruddin et al., 2016). Similarly, only 4% of Indonesia’s estimated 75GW of hydroelectricity potential is currently exploited. The government intends to tap those resources and increase the use of renewables to 23% of primary energy by 2025 from about 6% in 2011 (Figure 14). However, coal is projected to become the largest contributor to the energy mix (rising from 24% to 30%). This runs counter to efforts to fight climate change, since coal-fired generation produces approximately twice the GHG emissions as gas. Moreover, there is significant scope to improve the energy efficiency of Indonesia’s coal-fired power plants (OECD, 2015a).
As discussed above, the supply of and access to electricity remains an issue in Indonesia, particularly in remote regions. The government plans to increase generating capacity by 35GW by 2019. To that end, further liberalisation of the foreign direct investment regime is required. The 45% limit on foreign ownership in power plants generating less than 10 MW should be removed as it particularly affects those using renewables (including energy from wind, photovoltaic and biomass) and those in remote regions.
Indonesia also supports biodiesel to decrease carbon emissions and reduce imports. In 2016 a mandatory blend of biodiesel with motor fuel was set at 20% (up from 15% in 2015): to that end about 8% of crude palm oil production is to be used for this purpose in 2016. To compensate for higher costs, the government has introduced a varying subsidy on biodiesel, currently at IDR 5 000 per litre, which is funded from a USD 50 per barrel levy on crude palm oil exports. However, biofuels are cost-inefficient, have a limited effect on GHG emissions and energy security, and push up world crop prices (OECD, 2008), though second-generation processing technologies seem to be better.
Bibliography
AFSIS (2015), ASEAN Agricultural Commodity Outlook, ASEAN Food Security Information System, No. 15, December.
Armas, E., C.G. Osorio, B. Moreno-Dodson and D. Abriningrum (2012), “Agriculture Public Spending and Growth in Indonesia”, Policy Research Working Paper, No. 5977, World Bank, February.
Banerjee, A., R. Hanna, J. Kyle, B. Olken and S. Sumarto (2015), “Contracting-out the Last-mile of Service Delivery: Subsidized Food Distribution in Indonesia”, NBER Working Paper, No. 21837.
Bank Indonesia (2015), Financial Stability Report, No. 25, September.
Bhutta Z., J. Das, A. Rizvi, M. Gaffey, N. Walker, and S. Horton (2013) “Evidence-based interventions for improvement of maternal and child nutrition: what can be done and at what cost?”, The Lancet, Vol. 382, pp. 452–77.
Blöndal, J., I. Hawkesworth and H. Choi (2009), “Budgeting in Indonesia”, OECD Journal on Budgeting, Vol. 9/2, OECD Publishing, https://doi.org/10.1787/16812336.
Buehler, M. (2010), “Decentralisation and Local Democracy in Indonesia: The Marginalisation of the Public Sphere,” in Problems of Democratisation in Indonesia: Elections, Institutions and Society. Institute of Southeast Asian Studies, Singapore, pp. 267-85.
Busch, J., K. Ferretti-Gallon, J. Engelmann, M. Wright, K. Austin, F. Stolle, S. Turubanova, P. Potapov, B. Margono, M. Hansen and A. Baccini (2015), “Reductions in emissions from deforestation from Indonesia’s moratorium on new oil palm, timber, and logging concessions”, Proceedings of the National Academy of Sciences of the United States of America, PNAS, Vol. 112, No. 5.
Chang, M. C., S. Shaeffer, S. Al-Samarrai, A. Ragatz, J. de Ree and R. Stevenson (2014), Teacher Reform in Indonesia: the Role of Politics and Evidence in Policy Making, World Bank, Washington, DC.
Cheong, I. (2013), “Negotiations for the Trans-Pacific Partnership Agreement: Evaluation and Implications for East Asian Regionalism”, Asian Development Bank Institute (ADBI) Working Paper Series, No. 428, July.
Dawe, D. (2013), “Geographic determinants of rice self-sufficiency in Southeast Asia”, ESA Working Paper, Food and Agriculture Organisation, No. 13-03, June.
Dawe, D. and C. Timmer (2012), “Why stable food prices are a good thing: Lessons from stabilizing rice prices in Asia”, Global Food Security, Vol. 1.
Di Gropello, E., A. Kruse and P. Tandon (2011), Skills for the Labor Market in Indonesia: Trends in Demand, Gaps, and Supply, World Bank, Washington, D.C., http://datatopics.worldbank.org/hnp/files/edstats/IDNpub11.pdf.
Ernst & Young (2015), “The ASEAN Economic Community: can the reality match the vision?”, http://jakarta.diplo.de/contentblob/4589178/Daten/5756737/downloadaecstudie.pdf
Economist (2016), “Making Crime Pay – Indonesia contemplates a handsome pay-off for tax dodgers”, 9 April. www.economist.com/news/finance-and-economics/21696503-government-contemplates-handsome-pay-tax-dodgers-indonesia-weighs.
Rosid, A., C. Evans and B. Tran-Nam (2016), “Do perceptions of corruption influence personal income taxpayer reporting behaviour? Evidence from Indonesia”, paper presented at 12th International Conference on Tax Administration, 31 March-1 April, Sydney, Australia.
Faguet, J. (2014), “Decentralization and Governance,” World Development, Vol. 53(C), pp. 2-13.
FAO (2014), The State of World Fisheries and Agriculture, United Nations Food and Agriculture Organisation.
FSC, MoA and World Food Programme (2015), Food Security and Vulnerability Atlas of Indonesia, Food Security Council (Dewan Ketahanan Pangan), Ministry of Agriculture (Kementerian Pertanian) and the World Food Programme.
Grantham-McGregor, S., Y. Cheung, S. Cueto, P. Glewwe, L. Richter, B. Strupp and the International Child Development Steering Group (2007), “Developmental potential in the first 5 years for children in developing countries”, The Lancet, Vol. 369, Issue 9555, pp. 60-70.
Guerard, Y., M. Wiener, C. Rokx, G. Schieber, P. Harimurti, E. Pambudi and A. Tandon (2011), “Actuarial Costing of Universal Health Insurance Coverage in Indonesia – Options and Preliminary Results”, Health, Nutrition and Population (HNP) Discussion Paper, World Bank, April.
Hornberger, K., J. Battat, and P. Kusek (2011), “Attractive FDI : How Much Does Investment Climate Matter?”, Viewpoint: Public Policy for the Private Sector, World Bank, August.
Hoddinott, J., J. Maluccio, R. Behrman, P. Martorell, A. Melgar and M. Quisumbing (2011), “The consequences of early childhood growth failure over the life course”, Discussion Paper. No. 1073, International Food Policy Research Institute, Washington, DC.
Hoddinott, J., H. Alderman, J. Behrman, L. Haddad, and S. Horton (2013) “The economic rationale for investing in stunting reduction”, Maternal & Child Nutrition, Vol. 9, Issue Supplement S2, pp. 69-82, September.
Holzmann, R., Y. Pouget, M. Vodopivec, and M. Weber (2011), “Severance Pay Programs around the World: History, Rationale, Status, and Reforms”, IZA Discussion Paper, No. 5731, May.
Indonesian Government (2015), “Intended Nationally Determined Contribution – Indonesia”, Framework Convention on Climate Change, United Nations, www4.unfccc.int/submissions/INDC/Published/Documents/Indonesia/1/INDC_REPUBLIC/OF/INDONESIA.pdf.
IMF (2016), “Indonesia: 2015 Article IV”, Country Report, No. 16/81, Washington, DC.
Lewis, B. and A. Oosterman (2011), “Subnational government capital spending in Indonesia: Level, structure, and financing,” Public Administration and Development, Vol. 31, pp. 149-58.
Marlier, M., R. DeFries, A. Voulgarakis, P. Kinney, J. Randerson, D. Shindell, Y. Chen and G. Faluvegi (2013), “El Niño and Health Risks from Landscape Fire Emissions in Southeast Asia”, Nature Climate Change, No. 3.
Martorell, R. (1996), “The Role of Nutrition in Economic Development”, Nutrition Reviews, Vol. 54/4, April, pp. 66-71.
Martorell R., P. Melgar, J. Maluccio, A. Stein, and J. Rivera (2010), “The nutrition intervention improved adult human capital and economic productivity”, Journal of Nutrition, Vol. 140, pp. 411-14.
McKinsey (2014), “Ten ideas to reshape Indonesia’s energy sector”, Global Energy & Materials, September.
MOEC (Ministry of Education and Culture) (2013), The Management of National Education in 2011/2012 at a Glance, MOEC, Jakarta.
Moeliono, M., E. Wollenberg and G. Limberg (2009), “The decentralization of forest governance: politics, economics and the fight for control of forests in Indonesian Borneo”, Earthscan, London.
Nasruddin, M. Idrus Alhamid, Y. Daud, A. Surachman, A. Sugiyono, H.Aditya, and T. Mahlia (2016), “Potential of Geothermal Energy for Electricity Generation in Indonesia: A Review”, Renewable and Sustainable Energy Reviews, Vol. 53, January.
OECD (2008), Biofuel Support Policies: An Economic Assessment, OECD Publishing, https://doi.org/10.1787/9789264050112-en.
OECD (2010), OECD Investment Policy Review: Indonesia 2010, OECD Publishing, https://doi.org/10.1787/9789264087019-en.
OECD (2012a), OECD Economic Surveys: Indonesia, OECD Publishing, https://doi.org/10.1787/eco_surveys-idn-2012-en.
OECD (2012b), Review of Agricultural Policies: Indonesia, OECD Publishing, https://doi.org/10.1787/1990004x.
OECD (2012c), OECD Reviews of Regulatory Reform: Indonesia 2012, OECD Publishing, https://doi.org/10.1787/9789264173637-en.
OECD (2012d), Recommendation of the Council on Principles for Public Governance of Public-Private Partnerships, OECD Publishing, www.oecd.org/governance/oecd-recommendation-public-privatepartnerships.htm.
OECD (2013), Fiscal Federalism 2014 Making Decentralisation Work, OECD Publishing, www.oecd.org/ctp/federalism/fiscal-federalism-making-decentralisation-work.htm
OECD (2015a), OECD Economic Surveys: Indonesia, OECD Publishing, https://doi.org/10.1787/eco_surveys-idn-2015-en.
OECD (2015b), Revenue Statistics in Asian Countries – Trends in Indonesia, Malaysia and the Philippines, OECD Publishing, https://doi.org/10.1787/9789264234277-en.
OECD (2015c), Managing Food Insecurity Risk: Analytical Framework and Application to Indonesia, OECD Publishing, https://doi.org/10.1787/9789264233874-en.
OECD (2015d), OECD Guidelines on Corporate Governance of State-Owned Enterprises, OECD Publishing, https://doi.org/10.1787/9789264244160-en.
OECD (2015e), Update on Voluntary Disclosure Programmes: A Pathway to Tax Compliance, OECD Publishing, www.oecd.org/ctp/exchange-of-tax-information/update-on-voluntary-disclosure-programmes-a-pathwaypto-tax-compliance.htm.
OECD (2016a), OECD Open Government Review: Indonesia 2016, OECD Publishing, www.oecd.org/gov/open-government-in-southeast-asia.htm.
OECD (2016b), Skills Matter: Further Results from the Survey of Adult Skills, OECD Publishing, https://doi.org/10.1787/9789264258051-en.
OECD and ADB (2015), Education in Indonesia: Rising to the Challenge, OECD Publishing, https://doi.org/10.1787/9789264230750-en.
Olken, B. (2007), “Monitoring Corruption: Evidence from a Field Experiment in Indonesia”, Journal of Political Economy, Vol. 115, No. 2, April, pp. 200-49.
Resosudarmo, I., N. Oka, S. Mardiah and N. Utomo (2014), “Governing Fragile Ecologies: A Perspective on Forest and Land-based Development in the Regions”, in H. Hill (ed.), Regional Dynamics in a Decentralised Indonesia, Institute of Southeast Asian Studies, Singapore, pp. 260-84.
Reuters (2016), “Subsidy sham: Fertilizers reach Indonesia plantations, not small farmers”, 14 February www.reuters.com/article/us-indonesia-fertilizers-idUSKCN0VN127.
Sigit, R. (2015), “Can improved oil palm productivity and Indonesia’s forestry moratorium go hand in hand?”, Mongabay, 27 May.
Stolle, F. and T. Tomich (1999), “The 1997-98 fire event in Indonesia”, Nature & Resources, Vol. 35, No. 3, July-September.
Webb, K., N. Horton and D. Katz (2005), “Parental IQ and cognitive development of malnourished Indonesian children”, European Journal of Clinical Nutrition, Vol. 59, pp. 618-20.
World Bank (2009), World Development Report 2009: Shaping Economic Geography, World Bank, Washington, DC.
World Bank (2010), Education, Training and Labor Market Outcomes for Youth in Indonesia, Report No. 54170-ID, World Bank, Jakarta.
World Bank (2015), “Reforming and Uncertainty”, Indonesia Economic Quarterly, December.
World Bank (2016), “Doing Business 2016: Measuring Regulatory Quality and Efficiency”, World Bank Group, www.doingbusiness.org.