Chapter 2. How to boost export performance
This chapter analyses the structure of Greek exports and presents policy recommendations to boost export performance. Despite recent improvements, export performance deteriorated in the last decade particularly in the service sector. The decline in unit labour costs since the beginning of the crisis has restored cost competitiveness, but the response of exports has been sluggish due to severe liquidity constraints of exporters, lack of investment in export industries and in part because prices did not adjust as fast. Greece is dominated by SMEs and specialised in low-technology goods which makes it difficult to be well integrated into global value chains. Structural problems in product markets, barriers to exporting, access to finance and administrative burden affect competitiveness and impede export performance. Boosting investment in infrastructure and logistics, further liberalising the network industries, improving investment in human and knowledge-based capital to allow upgrading in the GVCs will be essential to enhance export performance.
Greek exports have increased from 19% of GDP in 2009 to 32% in 2014 but are still low for such a small economy. Export performance, measured as the share of exports in goods and services to export markets, deteriorated significantly in the last decade, particularly in the service sector and much more than in the Euro area on average. Shipping, which accounts for 20% of Greek exports, has underperformed significantly reflecting the slump in world trade. In agriculture, hunting, forestry and fishing and in other non-metallic mineral products the share of Greek exports is growing in line with world trade. In the major export sectors, fuels and processed food, Greek world market shares did not increase. In contrast, exports in Portugal and -albeit to a lesser extent- in Spain have rebound strongly since the beginning of the crisis in 2008 (Figure 2.1).
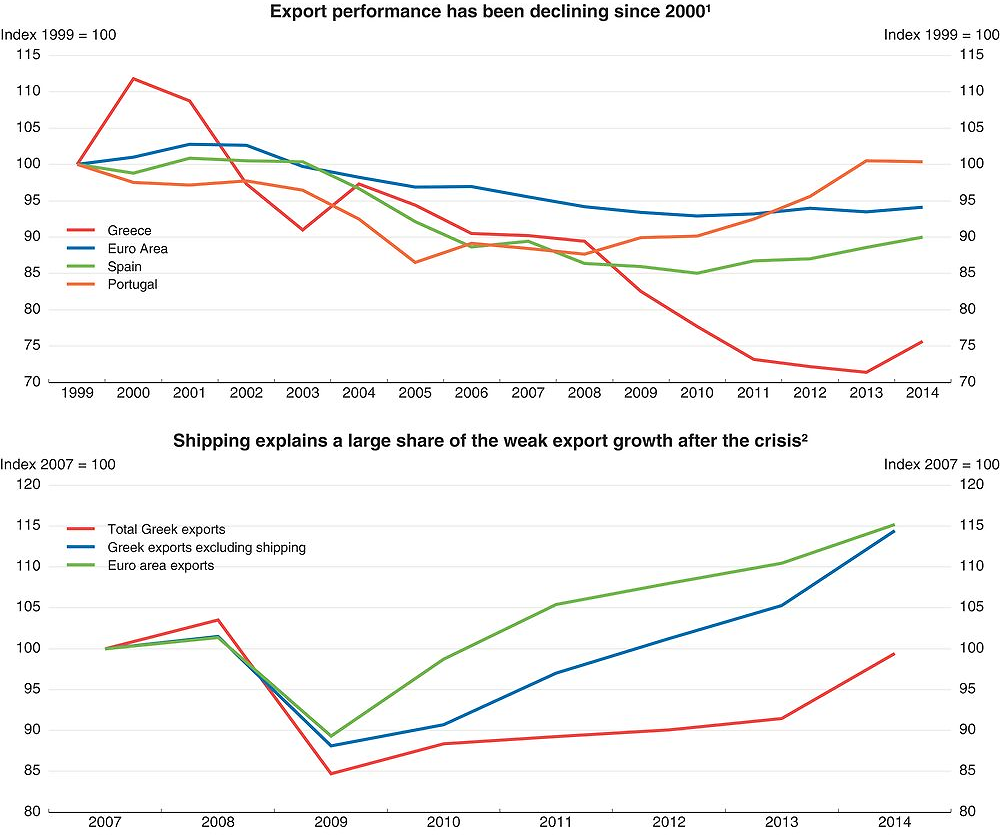
← 1. Export performance is calculated as the ratio of exports of goods and services to export market.
2. Real exports of goods and services. Nominal exports on shipping come from the Bank of Greece and have been deflated by the price of goods and services.
Source: OECD Economic Outlook 98 database.
Export underperformance in Greece is estimated to account for a third of the decline in GDP between 2007 and 2012 (Arkolakis et al, 2015). Structural problems in product markets, barriers to exporting, access to finance and skills have outweighed the impact of large declines in wages on competitiveness. Developing exports further, at a time when the domestic economy is expected to remain weak, can play a key role in reviving growth in Greece. This chapter analyses the structure of Greek exports and the main reasons for the weak performance and makes recommendations on how to make exports a new engine of growth.
The nature and performance of Greek exports
Greece is a relatively closed economy considering its size
Greece had a persistent trade deficit and low exports and imports in relation to GDP for decades before the crisis, including after joining the European Union in 1981 (Figure 2.2). Greece has not been able to take full advantage of the benefits arising from its entry in the EU. The competitiveness of Greek products in terms of both prices and quality was not boosted by the reduction in trade barriers upon EU entry. The structure of Greek trade did not converge towards the average structure of the EU15 countries. Imports, by contrast, rose through the boom period, driven by high domestic demand growth (Papazoglou, 2009). This also reflects the pull of resources to the non-tradables sector following the large rise in the public sector, which inflated wages and reduced export competitiveness. The role of structural rigidities and barriers to trade and competition are also important (see below). The trade deficit has declined since 2009 but its reduction in real terms comes mainly from the collapse in aggregate demand and thus imports, rather than an increase in exports. This fact points to continued structural problems in boosting exports after the crisis, despite considerable reform and improvements in cost and price competitiveness.
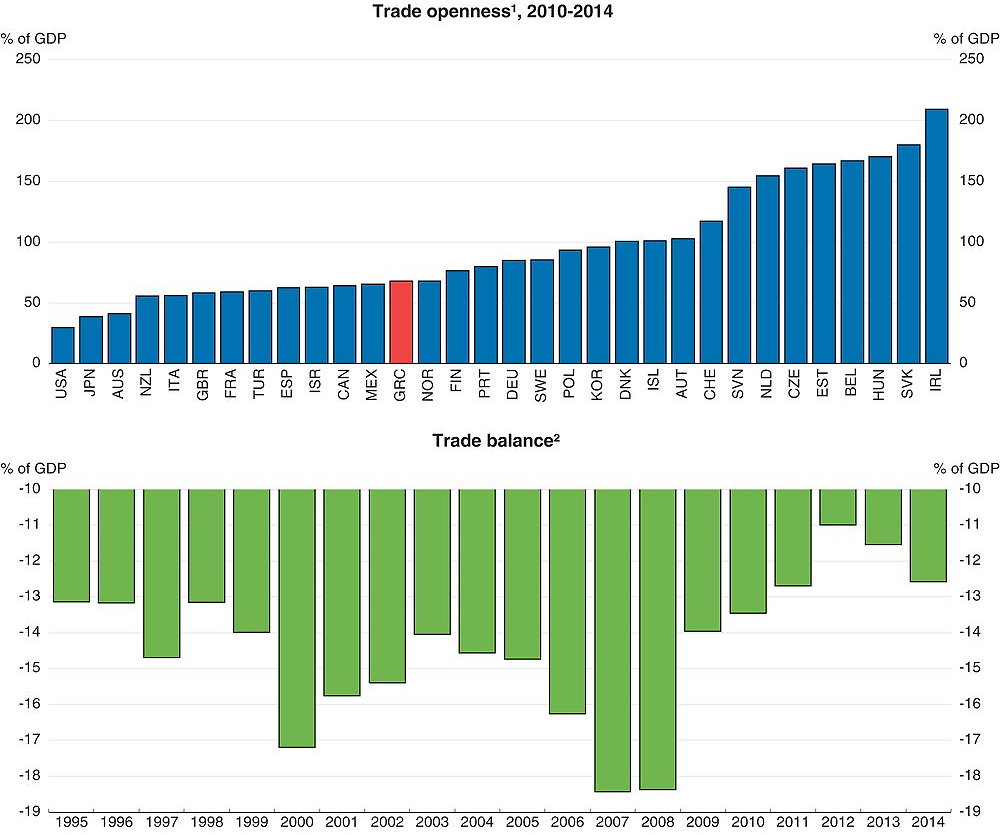
1. Measured as the ratio of (exports + imports) to GDP, in current prices, in percentage.
2. Measured as the ratio of (exports-imports) to GDP, in current prices, in percentage.
Source: OECD National accounts database.
Greece has also suffered from the slowdown of global trade and weak demand in its main export markets in the aftermath of the global financial crisis. After having grown largely above GDP during several decades, the rate of global trade growth slowed in comparison to GDP in the early 2000s. Since the beginning of the crisis, trade and GDP growth have been weak. This slowdown is explained by cyclical and structural factors. In the last 4 years, a depressed demand in the Euro zone (intra-EU trade accounts for about one-third of global trade) and in China reduced trade growth (OECD, 2015d).
Greek exports are dominated by oil (which is imported as crude, refined and then exported), shipping and tourism. The main goods exported are mineral fuels, food and live animals and manufactured goods (Figure 2.3). Mineral fuels, lubricants and related goods are now the biggest share of goods’ exports, in nominal terms. In services, tourism and transport are the most important exports (43%). Greece’s main partners for both goods and services are the Euro Area and the other countries in the European Union (Figure 2.4). More specifically, in tourism, Germany, the United Kingdom and Russia represent 36% of Greek exports while the European Union as a whole represents 62%.
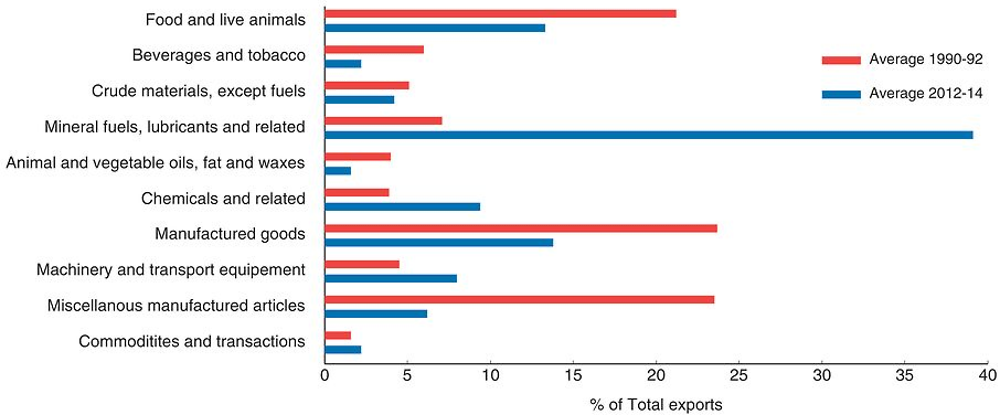
Source: ITCS database.
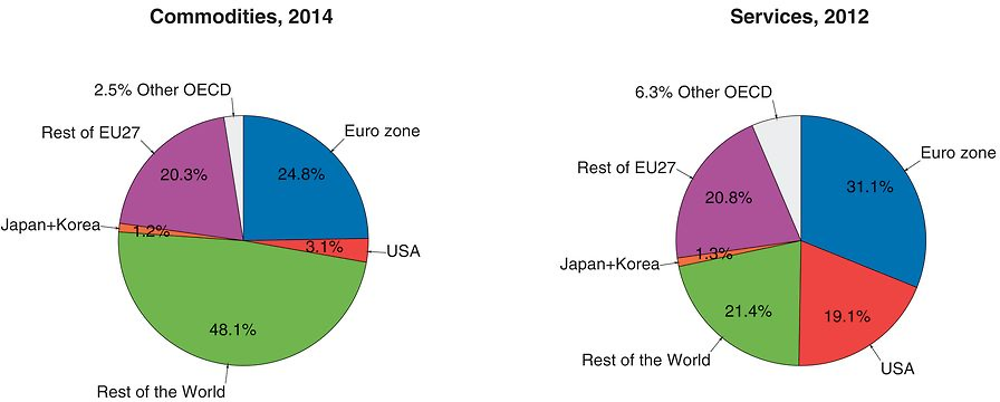
Source: ITCS database.
Specialisation in low-technology goods limits participation in global value chains
The pattern of specialisation plays an important role in constraining Greek export performance (Athanasoglou et al, 2010). Greek exports are concentrated in low-technology products which face strong competition from countries with lower labour costs, such as Bulgaria, China and Turkey. High and medium-high technology products, which have higher world market growth rates, are only around 20% of total exports compared to more than 70% in some OECD countries (Figure 2.5). More worrying, since 2007, almost all the increase in exports came from medium-low technology industries. Exports of the other industries have stagnated.
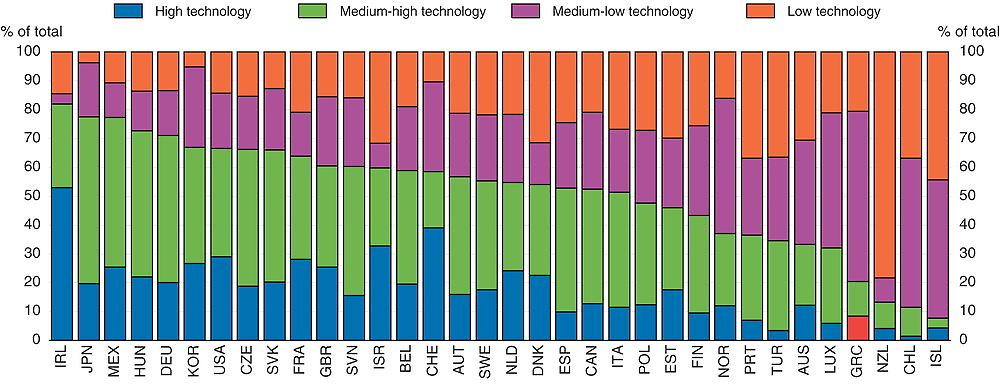
Note: Countries are ranked by the share of high and medium-high technology in total exports.
Source: STAN bilateral trade of goods by industry and end-use.
The weak specialisation of Greek exports and dominance of low-tech goods partly explains the low integration in global value chains (GVCs). Global value chains allow firms and economies to specialise in the part of the production process they are best at, using intermediate goods and services from elsewhere without having to develop a whole industry. Being well integrated into a value chain enhances competitiveness by providing access to cheaper, more differentiated and better quality inputs (OECD, 2013b). Trade-facilitating measures, such as fast and efficient port and custom procedures, are important for the smooth operation of value chains.
Greece’s domestic value added content of its exports was 75% in 2011, close to the OECD average and 8 percentage points lower than in 1995, reflecting Greece’s increasing integration in GVCs. The relatively high domestic value added in Greece’s exports reflects in part its specialisation in services exports. Transportation, together with telecommunications accounted for a substantial proportion of value added exports in 2011. The number of jobs embodied in foreign final demand is still low compared to other OECD countries; they represent 25% of total jobs for Greece and around 40% on average for OECD countries (Figure 2.6). Moreover, services embodied in manufacturing exports are low reflecting a lack of diversification. Globally, Greece has not integrated well into European and global value chains (Figure 2.7). The participation of Greece in GVCs is low in comparison to its size and location but consistent with its rather small openness. Traditionally, small open economies such as Luxembourg, the Czech Republic or the Slovak Republic source more inputs from abroad than large countries, such as the United States or Japan, which tend to have more domestic value chains(De Backer and Miroudot, 2013).
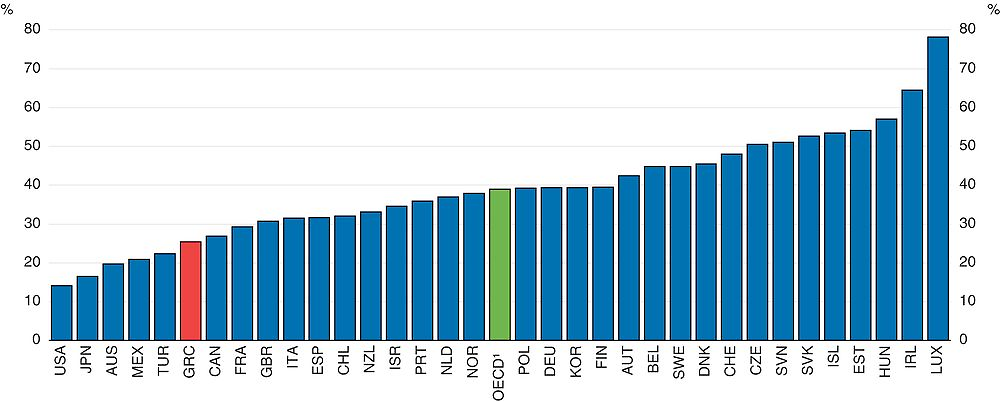
1. OECD is a simple average of OECD countries.
Source: OECD (2015), Science, Technology and Industry Scoreboard.
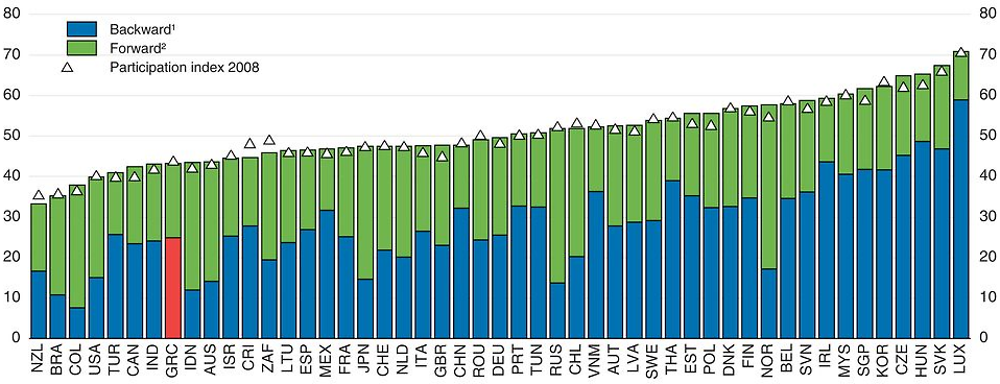
1. The indicator measures the value of imported inputs in the overall exports of a country (the remainder being the domestic content of exports). This indicator provides an indication of the contribution of foreign industries to the exports of a countries by looking at the foreign value added embodied in the gross exports.
2. The indicator provides the share of exported goods and services used as imported inputs to produce other countries’ exports. This indicator gives an indication of the contribution of domestically produced intermediates to exports in third countries.
Source: OECD International Trade database.
According to the Bank of Greece, weak trade integration is consistent with the low FDI flows into Greece; the small size of Greek enterprises; the small size of the manufacturing sector and lack of efficient infrastructure. Multinational enterprises (MNEs) are the main actors involved in GVCs (OECD, 2013b), due to their international trade and investment links. It is often difficult for small firms, which are predominant in Greece, to enter international markets and value chains due to insufficient scale to support; the costs of adequate R&D; the training of personnel and the fulfilment of strict requirements in terms of product standards and quality (OECD, 2013b). Upgrading a small firm’s position in the value chain requires the adoption of a wider and more complex set of tasks. Small firms can also participate indirectly in GVCs as providers of bigger exporting firms (G20 report).
Greek exporting firms are small with varying productivity affecting export capability
The dominance of small firms in production generally reduces export capability, especially when a non-negligible share of firms operates in the informal economy. Companies remain small as incentives to grow are weak due to product market restrictions and deficient bankruptcy procedures (Bravo-Biosca et al, 2013). In Greece, as in the OECD on average, the highest share of exports is from large (250 employees and more) enterprises. Nonetheless, the share of Greek SMEs (defined as firms with 0-50 employees) in exports is higher than the OECD average (OECD, 2014a, Figure 2.8). SMEs represent 99% of firms in Greece and employ 80% of the labour force. While the degree of export orientation in Greek firms has marginally increased between 2008 and 2013 (from 8% in 2008 to 9% of turnover in 2013), the average level of exports by SMEs has declined over the same period.
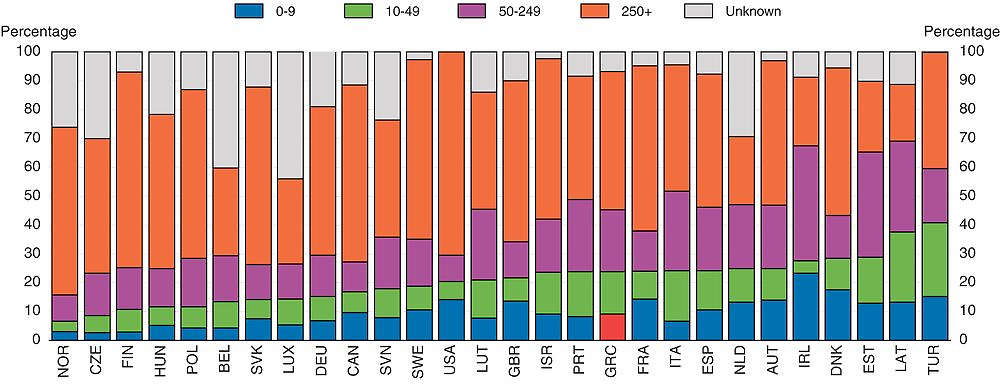
Note: Countries have been ranked by the share of 0-50 employees.
Source: OECD (2014a), Entrepreneurship at a Glance.
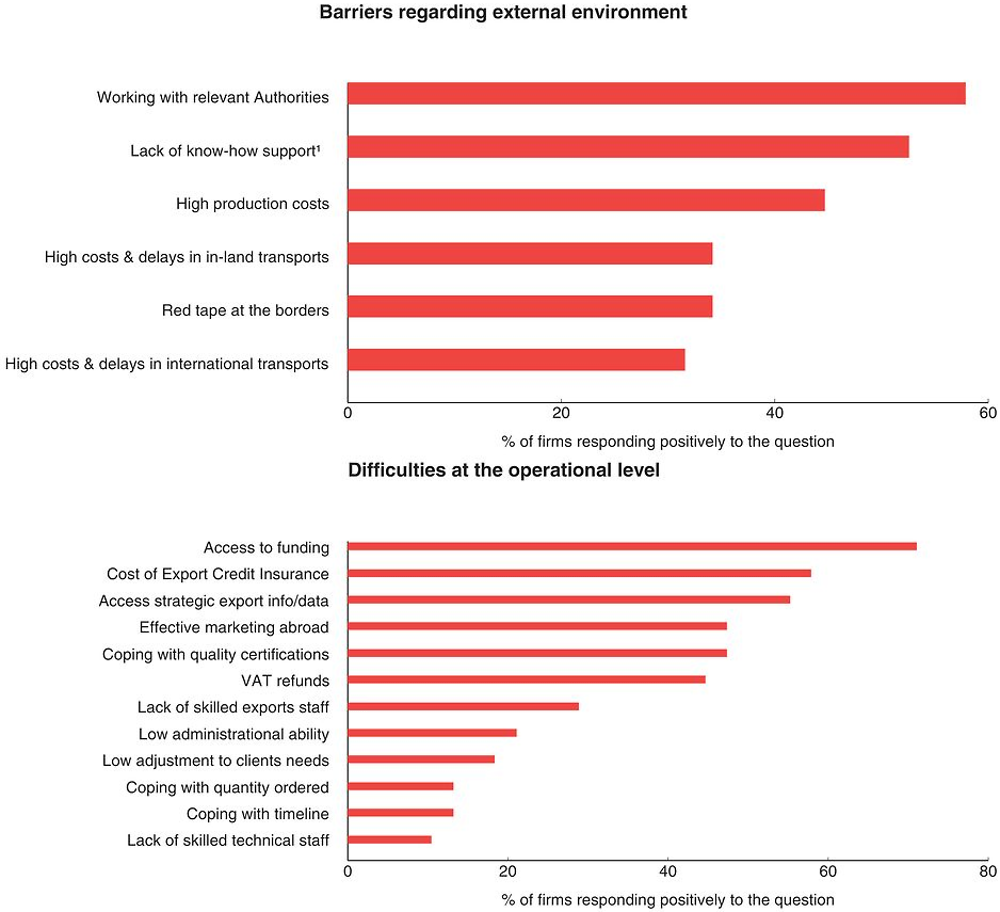
Survey results show that larger SMEs were more resilient during the crisis, they turned more to growth strategies and face limited liquidity problems. But smaller SMEs struggle to survive and 56 % continue to face severe liquidity problems (NBG, 2014). Manufacturing SMEs have the greatest export intensity. Almost 16% of SMEs are potential exporters, i.e. they do not currently export, but intend to export if certain obstacles were removed. The main obstacles are i) institutional inflexibilities such as excessive bureaucracy and inefficiencies in customs procedures, albeit the latter has been reduced notably by the introduction of electronic procedures ; ii) poor access to special financing for exports (such as trade credit); and iii) shortcomings in distribution networks and transport infrastructure (NBG, 2014; Panhellenic Exporters Association, 2015; Figure 2.9).
1. Chambers of Commerce, Commercial Attaches etc.
Source: Panhellenic Exporters Association.
Small size also affects productivity and thereby competitiveness. A number of recent studies have shown that smaller firms tend to be less productive (OECD, 2014). Within a given sector, only firms with high productivity tend to engage in exporting. This is due to fixed costs associated with the penetration of foreign markets. Only the most productive firms manage to recover those costs if they become exporters (Melitz, 2003; Melitz and Ottaviano, 2008). In practice, such fixed costs could be related to the need to collect information about export markets, establishing commercial contacts, hiring multilingual staff or adapting products to be sold abroad (Arnold, 2015).
The literature also shows that young firms often experience fast post-entry growth, become more productive and some of them become successful exporters (Criscuolo et al, 2014, Altomonte et al, 2012). Young firms typically experience the “up-or-out” dynamics where some successful entrants enjoy fast post-entry growth while others leave the market after a short time (Haltiwanger et al., 2013; Anyadike-Danes et al. 2013).
While it is important to lower entry and exit barriers, post-entry growth is even more critical for SME growth. Policies that create a business environment where firms can easily enter (and exit) the market and young high-performing firms can thrive and grow should be assessed with particular care. Such policies include both “sticks” (i.e. regulations which only affect firms above a certain size) and “carrots” (i.e. support mechanisms for which only smaller firms are eligible). In this context, resources will not be “trapped” in small and inefficient firms, serving as a drag on productivity growth and innovation (Criscuolo et al., 2014). Further liberalising product markets and better bankruptcy procedures will help in this respect.
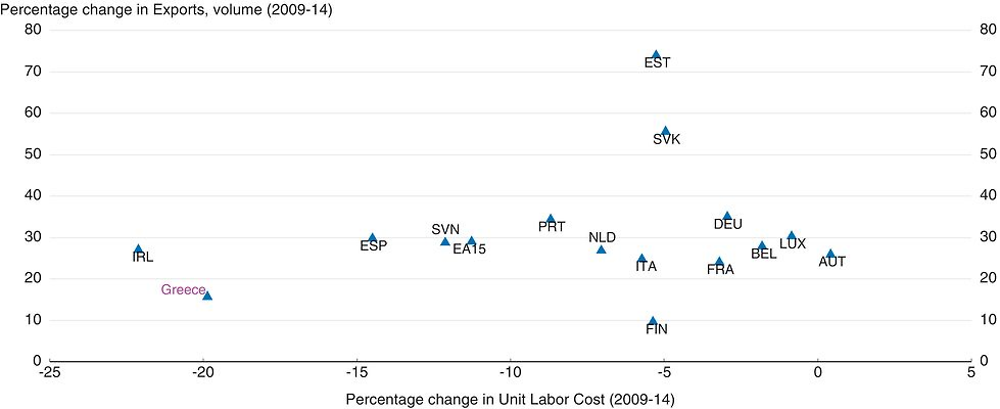
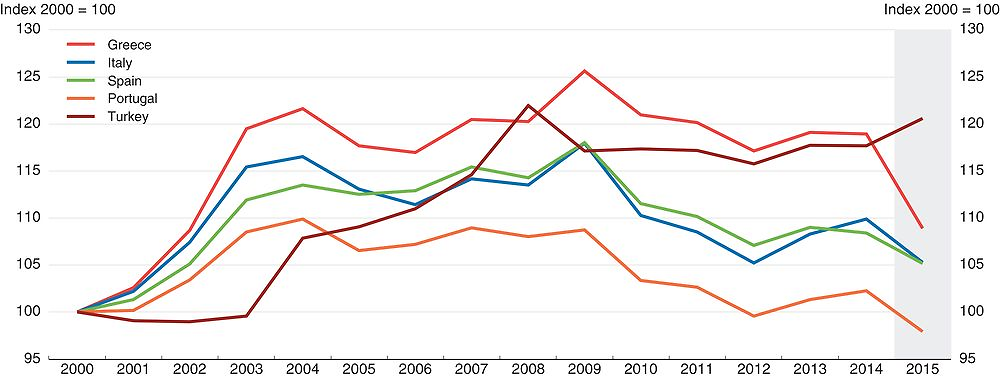
The decline in unit labour costs since the beginning of the crisis has restored cost competitiveness, but the response of exports has been sluggish due to severe liquidity constraints of exporters, lack of investment in export industries and in part because prices did not adjust as fast. With the exchange rate fixed, price adjustments to restore competitiveness need to take place within an internal devaluation. Ireland, Portugal and Spain, with a smaller drop in wages, achieved better export performance as their prices adjusted faster (Figure 2.10). Price competitiveness improved by 5% in Greece between 2009 and 2014 and by 6% and 8% in Portugal and Spain respectively (Figure 2.11). Non-cost competitiveness is also weak in Greece, as Greek goods exports are concentrated in low-technology products.
Source: OECD National accounts database.
← 1. Measured as the relative export prices. A decline represents an improvement in competitiveness.
Source: Updated OECD Economic Outlook 98 database.
The slow internal devaluation, or weak price adjustment, reflects several structural factors. First, most of Greece’s exports of goods are in capital-intensive sectors and thus less sensitive to wage adjustments (agriculture, oil). Moreover, the two main exports of services (tourism and shipping) are not sensitive to wage decreases. According to (Arkolakis et al 2015), tourism is seasonal and lowering costs might not increase sales significantly in peak periods and is insufficient to increase them in off-peak periods. Regarding shipping, the costs faced are mostly sourced outside the country. Second, structural barriers and administrative burdens hamper export activity.
Policies to enhance export performance
In this section, the different types of structural barriers to exporting are discussed in more detail, as well as the relevant policy recommendations to overcome them. This includes export formalities, the business climate, regulatory barriers in product and factor markets that can restrain competition. In addition, factors such as infrastructure, access to finance or the legal system play a role. While recent reforms have mainly reduced labour market restrictions, reducing the large remaining barriers in product markets is particularly important for boosting exports.
Improving the business environment and competition
Many barriers still affect exports despite reforms in recent years (Figure 2.12). For instance, the cost and time involved in export procedures at the pre-customs and customs stages in Greece remain high. The border compliance formalities take on average 24 hours compared to 15 hours in the OECD and the cost is almost twice that of the OECD average (World Bank, 2015). The barriers to entrepreneurship as measured by the OECD PMR indicator also reveal that Greece is more restrictive than many OECD countries. This is particularly the case for the complexity of regulatory procedures and the administrative burdens –especially for issuing licenses and permits for operating a business- on start-ups that are higher than the OECD average. Remaining administrative burdens to business operation and weak competition hinder productivity and investment. The implementation of a ‘national single window’ for exports, as foreseen by the National Trade Facilitation Strategy (NTFS) for Greece, would act as a one-stop shop, specifically for export procedures (Hellenic Republic, 2012). The NTFS encompasses a broad range of reforms aiming to simplify export procedures, and its full implementation is expected to significantly alleviate the high cost and long time periods involved in exports.
Moreover Enterprise Greece, the recently created export and investment promotion agency, deploys annually an Action Plan for exports promotion and is responsible for promotional activities, branding, organisation of conferences, and development of domestic and international networking. Export promotion can help solve information problems for local producers regarding tastes of foreign consumers, quality standards and regulations in other markets and business opportunities abroad that are hard to acquire for small firms (Lederman et al, 2010). In the case of Greece, more could be done to promote exports and help SMEs reach international markets. The new export promotion action plan aims at addressing several of the above mentioned issues.
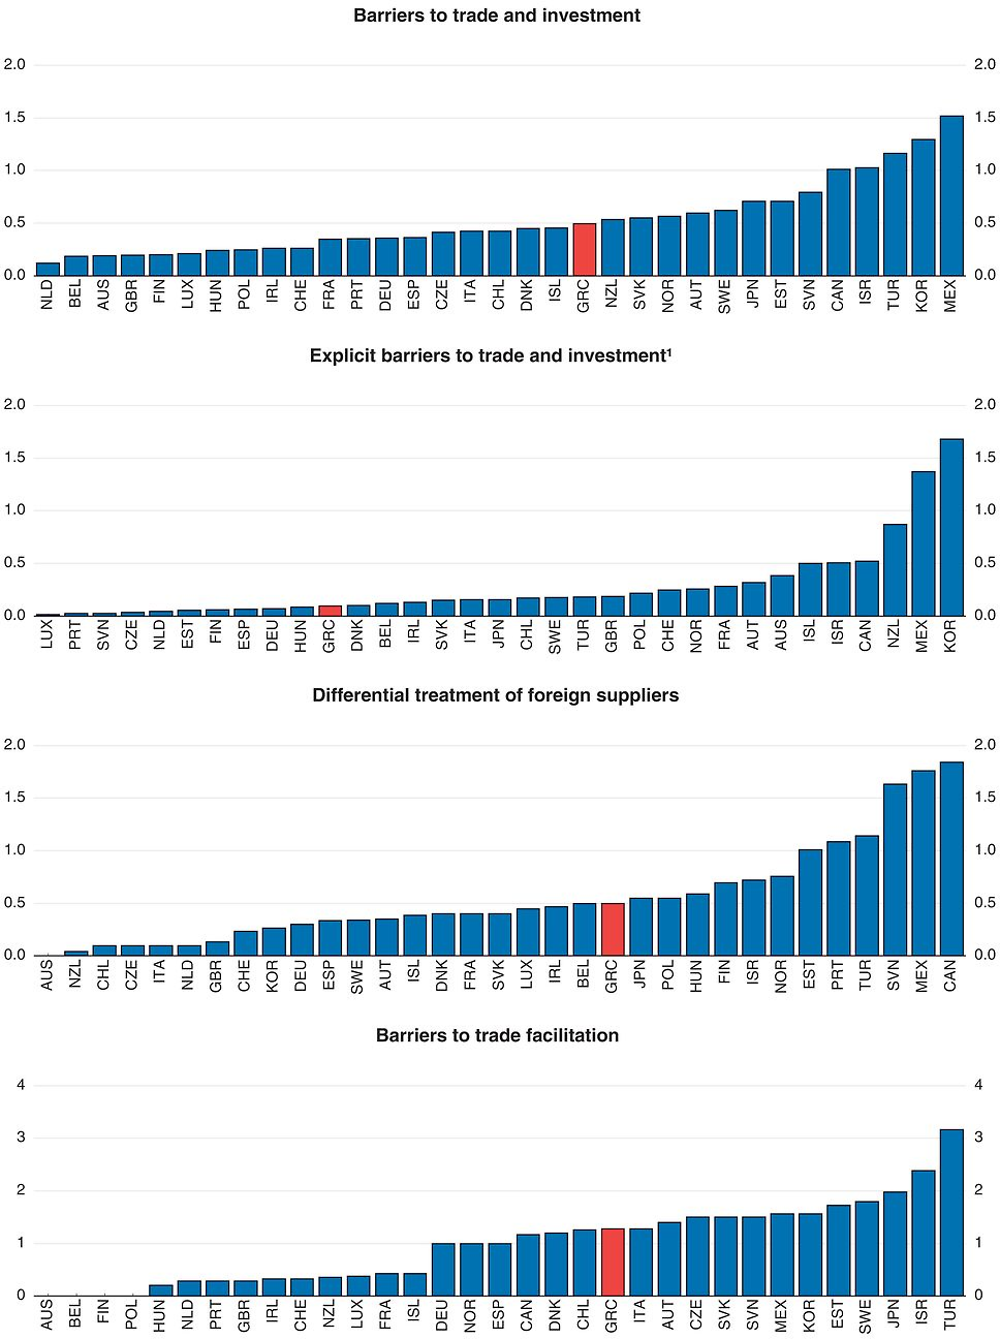
1. Explicit barriers to trade and investment refer to barriers to FDI and tariff barriers.
Source: OECD (2015), Product Market Regulation database.
More product market reforms would enhance competitiveness
Many markets in goods and services continue to face low levels of competition and high rents, which reduces export competitiveness. While Greece has made many reforms in recent years, its PMR indicator remains above the OECD average. Competitiveness is also influenced by the weak implementation of many reforms initiated over recent years aimed at liberalising or deregulating product markets (in goods and services, see Chapter 1). As many services are inputs to export products, inefficiencies in input markets also reduce competitiveness.
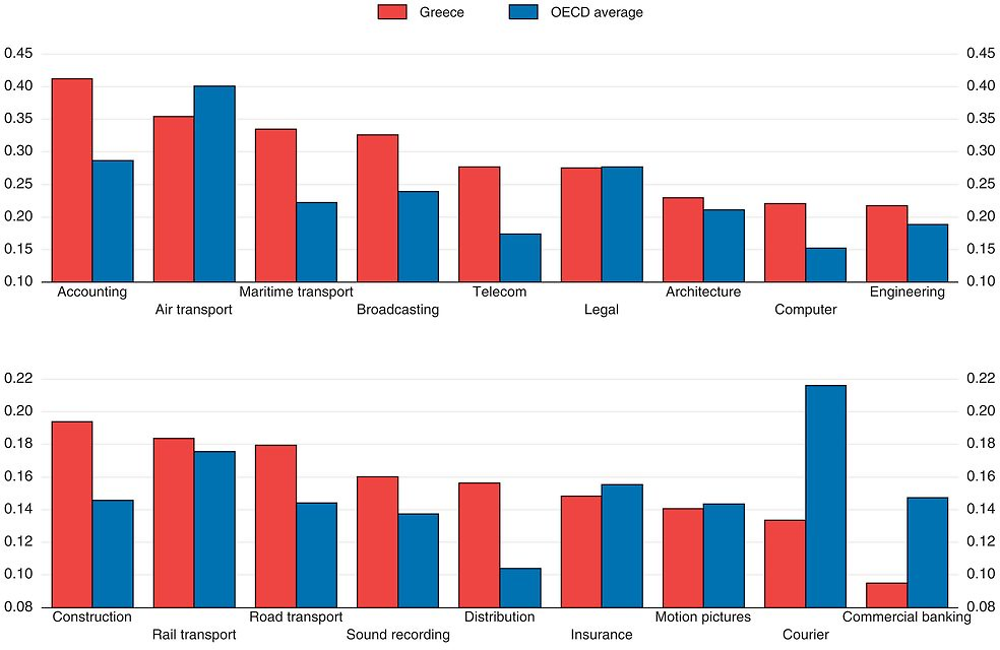
Apart from the PMR scores, regulatory burdens in product markets affecting exports can be measured by the OECD Services Trade Restrictiveness Index (STRI), which measures regulations that inhibit cross-border trade in services. For each sector, it covers five policy areas: restrictions on foreign entry, restrictions to the movement of people, other discriminatory measures, barriers to competition and regulatory transparency. In Greece, banking, courier services and motion pictures are the three sectors with the lowest STRI scores (meaning the most open sectors), while accounting services, air transport, broadcasting and maritime services have the highest barriers (Figure 2.13).
← 1. The STRI index takes the value from 0 to 1, where 0 is completely open and 1 is completely closed.
Source: OECD (2015), Trade database.
The barriers are complex. In accounting services, EU nationality is required to obtain a license to practice and there are restrictions on owning shares in auditing firms. Greece also restricts the ability of accountants to freely set their fees or to advertise their services. In maritime transport services, the relatively high score is largely explained by a limitation on foreign equity participation, at less than 50%. Furthermore, cabotage is not permitted for non-EU registered vessels. In the case of air transport, the score of Greece is below the sample average, which is the highest among the 18 sectors included. In application of the European Union (EU) regulation on air services, the air transport investment regime restricts foreign equity participation to less than 50% in relation to both domestic and international traffic. Several barriers to competition are also in place. Airport take-off and landing slots are allocated based on historical rights and the commercial exchange of slots is not allowed. Air carrier alliances, particularly code-sharing arrangements, are exempt from competition rules.
The reforms in some sectors (IT, construction, legal, accounting, architecture, engineering and telecommunications) between 2014 and 2015 have reduced their STRI. In IT, construction and telecommunication services, foreign equity limits on publicly-controlled firms were eased. As regards professional services, the changes in Greece’s STRI scores reflect sector-specific reforms in relation to barriers to competition. In particular, restrictions on fee-setting have largely been removed across the four professions. Greece scores well regarding the regulatory transparency and the other discriminatory measures. This can be explained by additional reforms undertaken by Greece as part of structural adjustment programmes implemented with the international institutions (enacted before the first vintage of the indicators was completed). They included efforts to foster transparency and improve the overall investment environment, and the elimination of discrimination in public procurement markets (Nordas and Rouzet, 2015).
Further reforms could have large benefits.
Several studies have shown the potentially positive impact of a further reduction of barriers to goods and services. An OECD study shows that more restrictive countries import and export less services (Nordås and Rouzet, 2015). Restrictions on certain sectors have a greater impact on services trade than others. For instance, the largest impact of restrictions on services trade is for commercial banking and insurance. A significant impact is also found in air and maritime transport services, accounting, legal services and computer services. These services also enter the GVC at different levels, influencing integration. Trade restrictions in computer services, distribution services, telecoms, transport services, courier services, commercial banking and insurance services have a negative effect on trade in manufactured goods (Nordås and Rouzet, 2015).
Easing regulation in goods and services markets can raise exports. For instance, if the low performing EU countries implemented reforms to raise their PMR indicator score to the average of the top half of the best EU performers, trade intensity, measured as the trade to GDP ratio, within the EU would increase by 10%. The heterogeneity of regulations across EU countries is also a barrier to trade (Fournier, 2015a). Evidence also shows that within EU countries, in which drastic reductions on barriers to trade have been applied within the Single Market, stringent regulation in product markets reduces exports (Fournier, 2015a).
Heterogeneity in PMR also affects FDI as differences in regulations entail costs that affect firms’ decisions to invest abroad (for instance, divergence of antitrust exemptions, barriers in service provision, network sector barriers and command and control regulation). The simplification of procedures also helps raise more FDI. A broad reform package that would remove the differences in regulations between countries by one-fifth would increase FDI by around 15% (Fournier, 2015b). These studies confirm the findings of the enterprise surveys discussed above, in that reducing barriers to doing business would make Greece more attractive to FDI, which at 2% of GDP is below the OECD average of 3%.
In Greece, reforms of policies affecting trade could have large gains (Box 2.1). Improving product market regulations and institutions to EU average levels are estimated to boost trade by 6% and 8% respectively. While these studies are subject to various caveats, they nevertheless point to substantial potential gains from reforms.
Potential effects of policy changes on total exports of Greece can be large. Johansson and Olaberría (2014) present a methodology to assess the impact of policy changes on trade by adapting a model by Eaton and Kortum (2002), which combines a gravity equation with Heckscher-Ohlin relative endowments forces in determining trade, with policies and institutions. Gravity is a combination of variables that impose a cost on trade including market size, common border, common language, distance and the presences of a regional trade agreement. Factor endowments at the country-level include capital per worker, energy and stock of human capital. Finally, the policy and institutional variables include financial development, institutional quality, labour and product market regulations at the country level.
Applying the findings of Johansson and Olaberría (2014) to the Greek economy:
-
Increasing human capital (as measured by average years of schooling) from the current level (10.3 years) to the average of the European Union (10.6 years), could raise total Greek exports by 3% (Figure 2.14).
-
Increasing capital per worker from the current level (180 000 constant USD) to the average of the European Union (285 000 constant USD) could raise total Greek exports by more than 5%.
-
Reducing product market regulation (PMR) from the current level (1.74) to the average of the European Union (1.42), could raise total Greek exports by around 6%.
-
Finally, improving the quality of institutions (as measured by the index of Rule of Law the Worldwide Governance Indicators [WGI, 2015]) from the current level (67) to the average of the European Union (91), could raise total Greek exports by more than 8%.
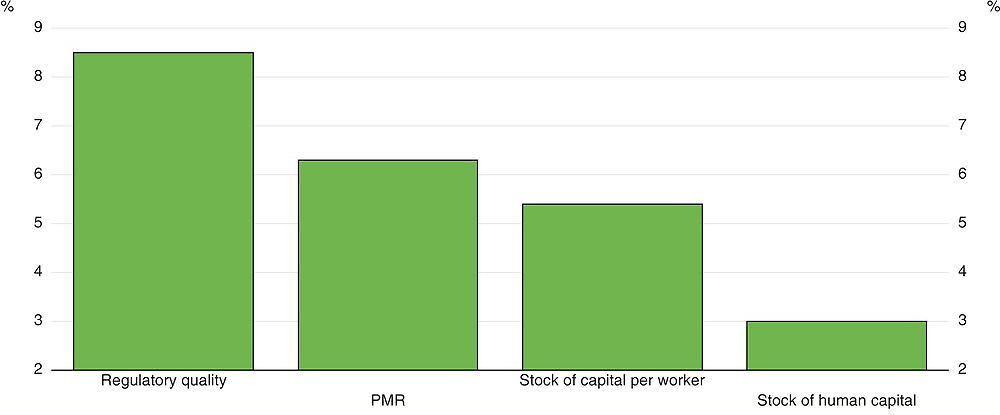
Note: The effect on aggregate exports is measured as follows: ΔExpGreece = βΔPolicyGreece where ΔExp is the change in total exports, ΔPolicy is the change in policy in Greece, and β is the coefficient for the respective policy as reported by Johansson and Olaberria (2014).
Source: OECD calculations.
Gains from reforms can be particularly large in the relatively highly protected services exports. Greece’s services trade is dominated by maritime transport. The shipping industry controls the world’s largest merchant fleet and accounts for over 40% of total exports of services. The second most important export category is travel, which is also reliant on efficient transport infrastructure and services. In maritime services, Greece scores higher (more restrictive) than the average of the 40 countries included in the STRI database. Measures fostering competition in the freight transport sector would lower costs and improve efficiency in shipping times, thereby enhancing its international competitiveness. A robust estimation of the link between STRIs and trade in maritime transport services, suggests that the performance of the shipping sector could be further boosted by easing entry requirements into maritime services. A reduction in the STRI of 7 basis points by removing the foreign equity limits for non-EU nationals would (everything else equal) raise maritime exports by over 8% over time (Nordas and Rouzet, 2015).
Time for exports and imports are also important for competitiveness. Time for shipping goods is a function of infrastructure and geography, but also of regulation of ports, airports, customs procedures, and transport and logistics services. Time for exports and imports is positively correlated with the STRI for maritime transport, road transport and logistics services (Nordas and Rouzet, 2015). The higher the restrictions on these key services for seamless flows of goods across borders and within supply chains, the longer it takes to ship goods. On average, a ten basis points reduction in the STRI index for maritime transport is associated with 6% less time for exports. Reforms in time for export procedures would reduce the STRI index in maritime transport by 10 basis points via liberalizing cabotage and eliminating discriminatory port charges. This would -everything else equal- lower the time for exports by about 1 day. According to Hummels and Schaur (2013) one day in transit incurs a cost equivalent to between 0.6 and 2.1% ad valorem tariff, depending on the product. As Greece’s exports are concentrated on price sensitive consumer goods, a tariff equivalent of this magnitude is a significant impediment to competitiveness.
Services liberalisation would also boost high-technology goods exports. Services, particularly those related to R&D, product design and development are crucial inputs into the high-technology manufacturing sector. A one basis point lower STRI index could raise high-technology goods share in exports by more than 15 percentage points. With an STRI index of 0.218 for engineering, Greece is close to the 40 country average. Reducing the index by 10 basis points, for instance by making it easier for foreign engineers to have their qualifications recognised and obtaining a license for temporary work in the country, would increase the high-technology share of manufacturing by 1.5 percentage points, everything else equal (Nordas and Rouzet, 2015).
The second round effects of liberalisation amplify the gains
Increased competition from the deregulation of services often improves the efficiency of services providers. Services such as R&D, engineering, design, financial services, transport services, insurance services, communication services, marketing and distribution services, are an essential part of any supply chain. Some services are embodied in the goods, some are bundled with the goods in the final market and some change the location or ownership of the goods. Therefore, it seems reasonable that restrictions in the services sector spill over to the manufacturing sector.
Many studies have shown an indirect effect of services liberalisation on firms’ productivity in other sectors (Arnold et al, 2011a and 2011b; Fernandes and Paunov, 2012; Bas and Causa, 2013). Increased competition in upstream services can raise the performance of firms in downstream manufacturing industries through different channels: lower production costs, access to higher-quality services, positive foreign spillovers and access to new services (Bas, 2013). In particular, the liberalisation of transport and telecommunication is expected to reduce trade costs faced by exporting firms (Bas, 2013). Evidence shows that deregulation in the upstream services sector can increase both the probability to export and the export sales (Bas, 2013, Correa-Lopez, 2014). At the same time, firm characteristics such as age or size matter for the connection between regulation and exports.
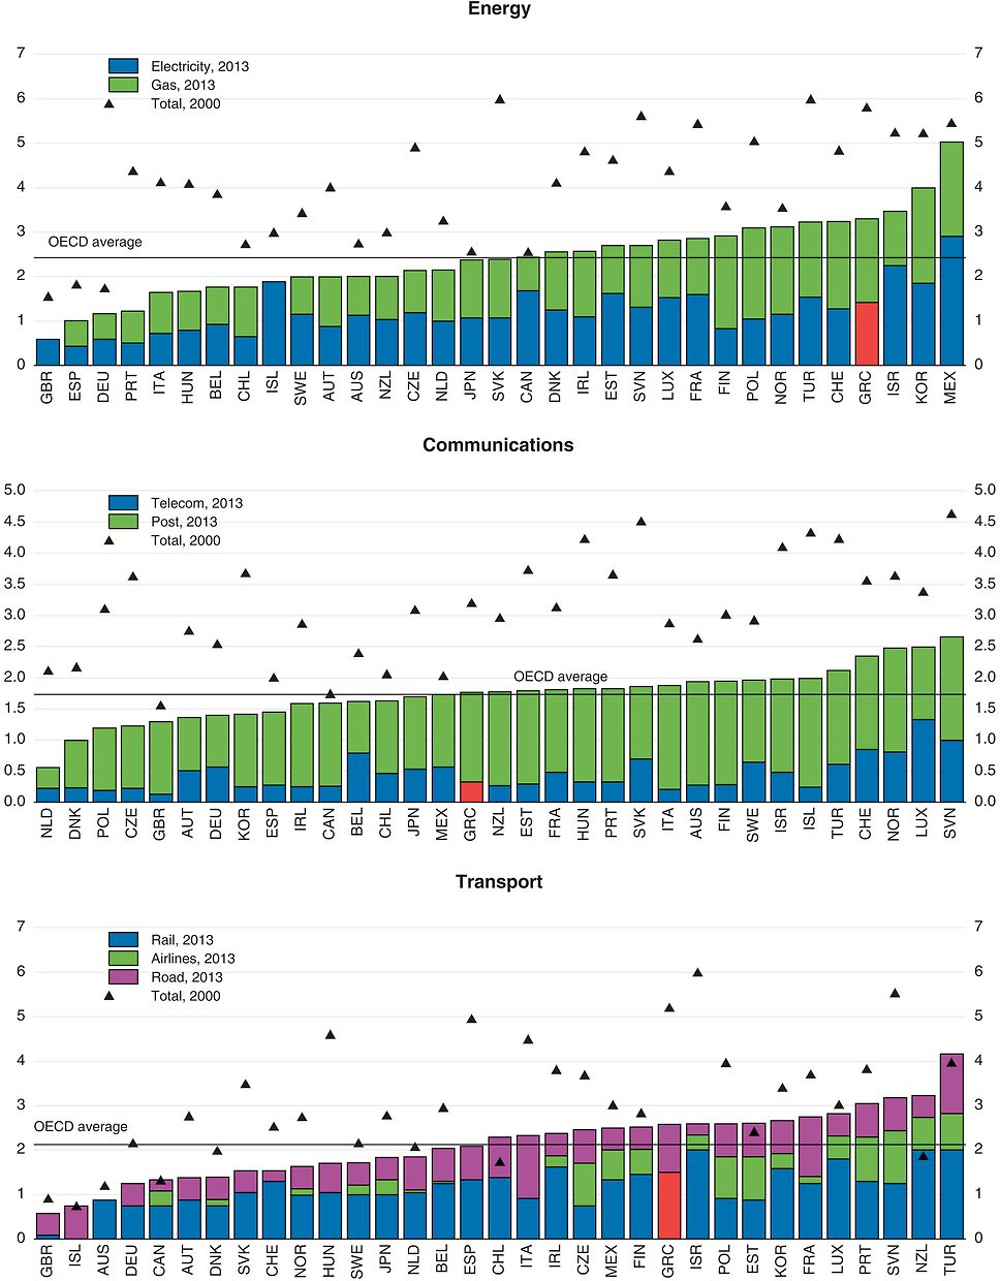
Following Bas (2013), an empirical analysis was undertaken on around 3 400 Greek firms relating their export performance to the evolution of an indicator of regulation in network sectors (Daude and De la Maisonneuve, 2016). This indicator weights the level of regulation for each sector (energy, transport and communications) by the manufacturing industry’s reliance of each input, and controls for different firms characteristics (age, ownership, size, etc.). The results show that liberalisation in network sectors so far (Figure 2.15) has raised Greek export performance since 2000, and additional liberalisation would further enhance exports (Box 2.2).
Source: OECD (2015), Product Market Regulation database.
Using data from the ORBIS database for around 3 400 firms over 10 years, an econometric model where the export sales are explained, among other determinants, by an indicator of regulation in network industries is estimated. The latter has been constructed by weighting the level of regulation for each sector (energy, transport and communications) – ETCR – by the manufacturing industry’s reliance of each input (Daude and De la Maisonneuve, 2016). The indicator of regulation comes from the OECD index of regulation in each sector. The results presented here are robust to the choice of other dependent variables such as probability of exporting or export shares (see Daude and De la Maisonneuve, 2016).
The results of a pooled OLS regression indicate a negative and statistically significant impact of restrictive ETCR regulations on export turnover. The estimate is also significant from an economic viewpoint. An increase in the stringency of ETCR regulations by one point – which is slightly above the standard deviation among OECD countries in the sample period (0.84) – leads to a decline in exports by more than 11%.* Similarly, this estimate implies that if Greece were to move its ETCR restrictiveness index (2.55 in 2013) to the best performer in the OECD – the United Kingdom with a value of 0.79 in 2013 – export turnover would increase by almost one fourth. The results are similar -with a slightly larger impact of ETCR on exports- when including sector dummies to control for sectorial characteristics. Therefore, the results are robust to controlling for sectorial characteristics, which might be correlated with the ETCR variable – as this variable varies across sectors and time. The pooled OLS regressions might render a biased estimate of the ETCR effect, because of omitted firm-level variables that affect exports and are correlated with ETCR restrictions. Therefore, it is important to test the robustness of results. Columns 2, 3 and 4 in Table 2.1 provide some robustness checks by including firm time dummies which would account for unobserved common factors across firms, for example those related to the business cycle -as well as firm level fixed effects and sector fixed effects- which control for part of these potential biases. Overall, the estimates in Columns 2-4 show a significantly larger impact of ETCR restrictions on exports than the pooled OLS estimates. For example, the estimates in Column 3 imply that a one-point reduction in ETCR restrictions would increase exports by 35%. Column 5 shows that these results are robust in controlling for foreign ownership of the firm, the participation of foreign capital being associated with higher exports.
← * The semi-elasticity of ETCR on exports is given by exp(-0.120) - 1 = -0.11308.
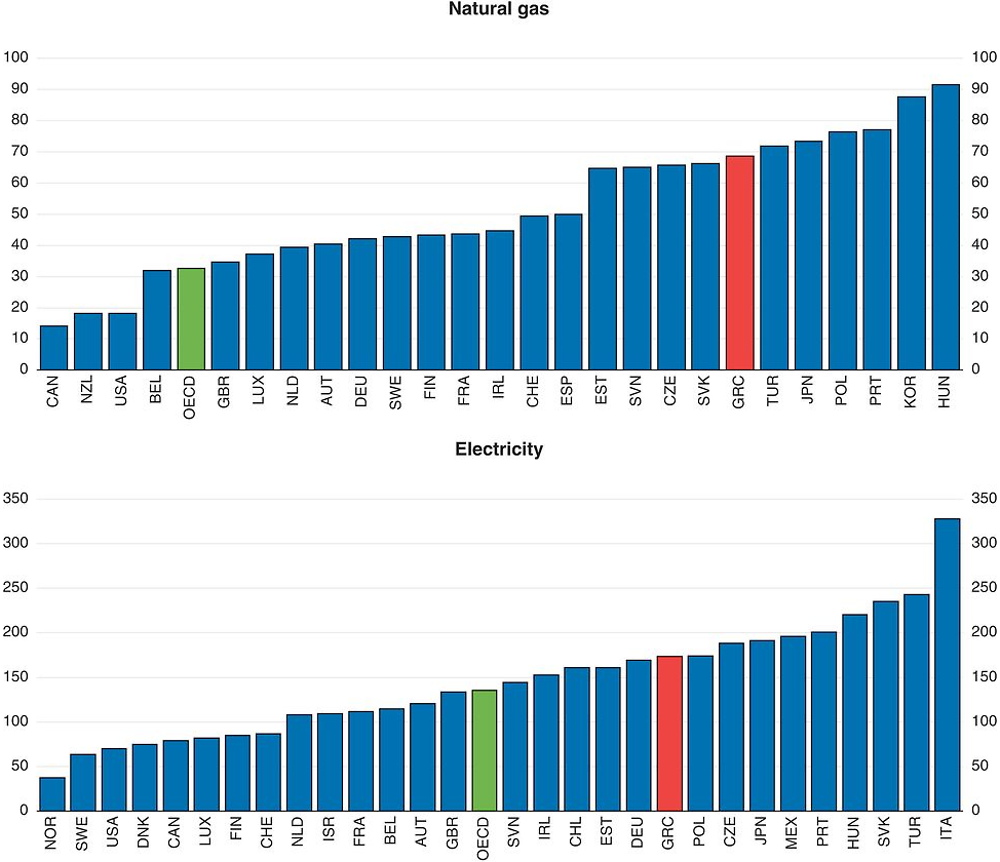
Some competition has been introduced in electricity. In December 2015, the Authorities agreed with the institutions on a plan that will separate the electricity transmission system operator (ADMIE) from the incumbent Public Power Corporation (PPC). At the end of the process, the Hellenic Republic will hold 51% of ADMIE, with a strategic investor (another TSO) holding 20%, and 29% on the stock market. This will create more separation of the system transmission operator from the main supplier. However, there is still significant market concentration in the wholesale and retail market on behalf of PPC and cross-subsidisation among different categories of customers reduces competition and raises prices (Figure 2.16). High energy prices may contribute to the limited success of internal devaluation in boosting exports (Pelagidis, 2014). Strengthening the operational and financial independence of the electricity regulator is essential. In the gas market, recent reforms -currently being implemented– have increased the consumers rights to choose suppliers. By increasing competition, the privatisation of the Piraeus and Thessaloniki ports and of the regional airports should also lower costs and raise efficiency.
Source: IEA (2015) database.
A greater use of renewables in energy production could also raise competition in the energy sector. Electricity generation is becoming less carbon intensive in Greece. The share of renewable energy sources used in electricity generation steadily increased from 5% in 1990 to 23% in 2013. The National Renewable Energy Action Plan (NREAP), elaborated in 2010 in line with the EU Renewable Energy Directive, outlines the policies and measures to achieve Greece’s 2020 targets for renewable energy. It sets out targets of 18% to 20% of gross final energy consumption from renewable energy sources, 40% of electricity production from renewable energy sources, 20% for heating and cooling, and 10% for transport (EEA, 2014a).
More investment in infrastructure and logistics would boost exports
Greece faces many challenges regarding infrastructure. Total public and private investment in infrastructure is below the median in OECD countries (Figure 2.17, top Panel). It has decreased significantly over the past two decades from 2.1% in 1995 to 0.7% of GDP in 2013. Moreover, the quality of transport infrastructure could be improved (Figure 2.17, bottom panel). The gap is particularly important for railroad and, albeit to a lesser extent, road infrastructure. Reforms have been put in place to enhance the weak transportation sector, but the results have been mixed so far. They are promising in the maritime (both cruise and freight) sector, with the successful partial privatisation of the Piraeus port. However, there is still considerable scope for developing port activities as a gateway to the land transportation network, not just for Greece but for the entire region (OECD, 2013a) (see below).
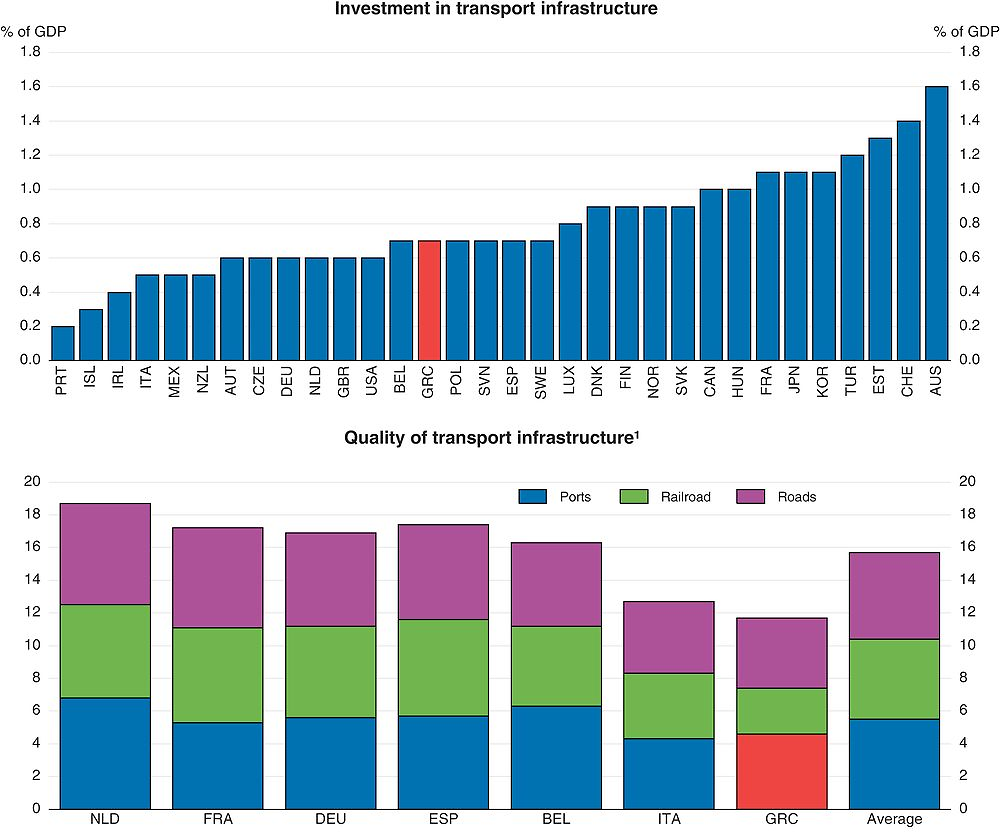
1. Each type of infrastructure is ranked between 1 and 7 according to executive opinion survey. [1 = extremely underdeveloped – among the worst in the world; 7 = extensive and efficient – among the best in the world].
Source: World Economic Forum, “The Global Competitiveness Report 2015-16”.
The entire logistics system of the country is important for the export activity. According to the World Bank Logistics Performance Index, Greece lags behind the OECD average in every aspect covered by the indicator (Figure 2.18), and its performance has decreased since 2007.
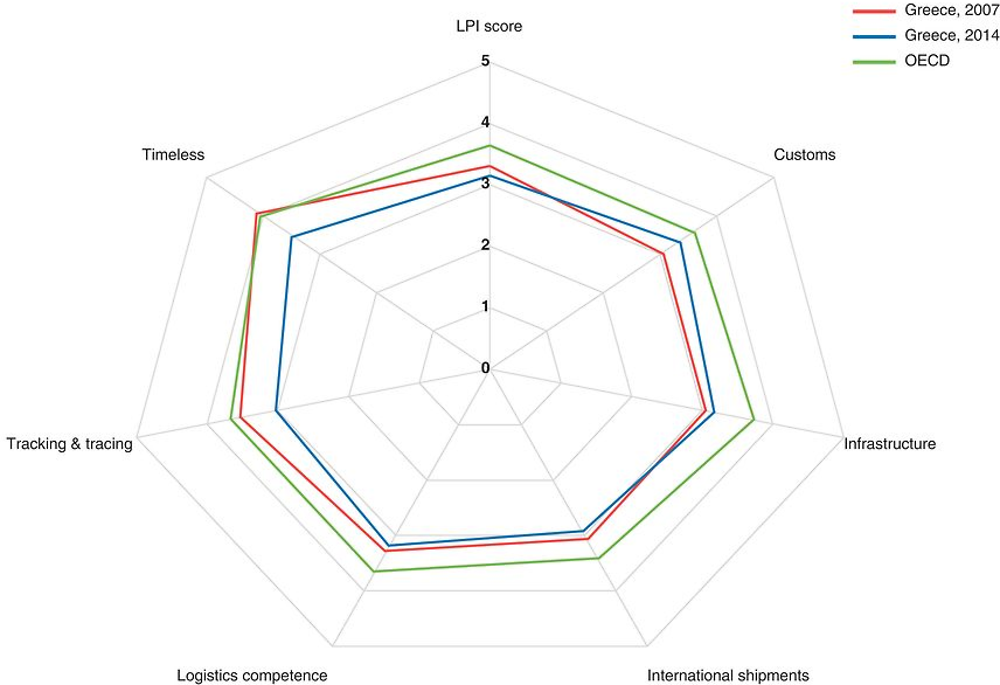
Source: World bank database.
Despite limited fiscal space, weak credit and remaining structural rigidities, boosting investment in logistics is needed. One way forward would be to make better use of public land through concessions or privatisations to facilitate investment in logistics and infrastructure. The multiplier effect of these types of investments is estimated to be large (IOBE, 2012). They would help the tourism sector and facilitate export activity more generally. Further liberalising the network industries would also increase the quantity and quality of infrastructure investment (see below). Moreover, structural funds should be better exploited to boost investment in education, research and innovation, and information and communication technology to enhance skills and human capital.
Public-private partnerships (PPP) would increase investment and operational efficiency if they brought private-sector expertise and capital to bear. PPP should not be used as a way to relax budget constraints. It is important that risk in these projects is correctly assessed and appropriately allocated between the public and private sectors. The implementation of the Juncker Plan, which aims at providing an enabling regulatory environment for investment, would help in this regard.
Better skills would raise competitiveness
The ability of firms to move up the value chain into better products and higher profit margins depends largely on the skills of the labour force. While the number of people with at least upper-secondary education in Greece is roughly equivalent to the OECD average, those with tertiary education is lower. Moreover, according to the latest PISA assessment, the average performance of 15 year-old students is one of the lowest among OECD countries despite improvements since 2003. Raising the quality of education requires improving the quality of teachers by linking teaching evaluation to effective professional development, making schools more autonomous and accountable and introducing a performance evaluation system for universities (OECD, 2013d).
The development of skills during active life is also crucial. As a result of the ongoing evolution of technology and the continuing shift from manufacturing to services, job requirements are evolving rapidly. This means that workers increasingly need to acquire new skills and upgrade existing ones, for which access to lifelong training is crucial. This would help workers adapt to new tasks and technology and will boost productivity.
Lack of financing is a major constraint
Empirical evidence suggests that access to financing helps export performance (Bardakas, 2014), and ability to reallocate resources from non-tradables to tradables. Exporting firms are more dependent on external financing compared to non-exporting firms, given the perceived riskiness of exporting activities and the practical difficulties of dealing with payments (Muûls, 2008). Firms active in industries with access to less expensive credit tend to export more (Manova, 2013). Credit constraints prevent firms from getting involved in exporting, as financing conditions affect firms’ decision to enter the export markets (Berman et al, 2010).
Credit has fallen since the start of the crisis, both to total business and SMEs. According to the ECB SAFE survey, in April-September 2015, 30% of Greek SMEs declared access to finance as their main problem (ECB, 2015). The situation is probably worse following the capital controls since June 2015. The survey also indicates that SMEs faced stronger quantitative supply restrictions in Greece than in other euro area countries. The percentage of rejected applications for bank loans, though declining in the last four rounds of the survey at 16% in April-September 2015, still remained well above the euro area average (9%).
The credit crunch in Greece reflects domestic financial system weaknesses and the risk premium from high country risk. SMEs also face higher credit costs than larger domestic companies. It is therefore not surprising that access to finance is regarded as the most important problem of Greek SMEs (ECB, 2015). Before the crisis, constrained bank lending supply had a disproportionately large effect on small Greek firms given their heavy reliance on bank lending -70% of their total financing compared to 49% in the euro area on average between 2003-08 (ECB, 2013). Heavy reliance on bank lending is consistent with the dominance of micro-enterprises in the total SME population of the country, with small local firms lacking awareness of alternative financing instruments, or skills that can allow them to tap the capital markets or other sources of financing (Nassr and Wehinger, 2015).
Trade finance and support programmes
Greek commercial banks offer a number of specific trade finance products, such as letters of credit, suppliers’ guarantees, discount financing and documentary credits. Export-oriented SMEs also benefit from a number of official programmes both at local and international levels (Nassr et al, 2016). In addition, various lending facilities, guarantee programmes and other public support programmes are offered by the Greek government to local SMEs in cooperation with the European Investment Bank Group and the European Commission. However, the take up of these schemes has been low. This reflects partly the lack of awareness of some of the micro-enterprises about the availability of such schemes and their inability to go through the process and meet the requirements of such funding (Nassr et al, 2016).
The creation of a development bank to help SME funding is currently under discussion. It could improve access to credit for SMEs by systematically organising all the funding opportunities available from both national and international sources, as recently done in France. The Institution for Growth (IfG) which was created in December 2013 is already part of the financing tools available. The IfG SME Debt-Sub-Fund was established in May 2014 with EUR 200 million coming from the Hellenic Republic and the German KfW to provide liquidity for SMEs (EC, 2014). The recent experience of Portugal and Ireland, who have also created national development banks, could also be a helpful reference to create a good institutional framework. A successful operation of the development bank requires a clear assessment of potential synergies and overlaps with other institutions, adopting a strong corporate governance framework and avoiding competition with the activities of commercial banks.
An under-developed equity financing environment
The share of SME financing provided through equity markets in Greece is currently very small, particularly when it comes to risk financing. Venture capital investment has also been historically underdeveloped in Greece and could be driven by risk aversion of venture capitalists given the prevailing macroeconomic situation and, most importantly, the uncertain economic and political environment (Figure 2.19). Total venture capital investment for 2014 was just USD 260 000, by far the lowest in the OECD (OECD, 2015b). A number of public support programmes, such as the JEREMIE initiative of public-private co-financing funds, try to catalyse private investor participation in venture capital financing and should be pursued (OECD, 2015c). The creation of a venture capital system with important direct links to university research and innovation could be a way to boost entrepreneurship and promote the creation of high value added products and innovative SMEs.
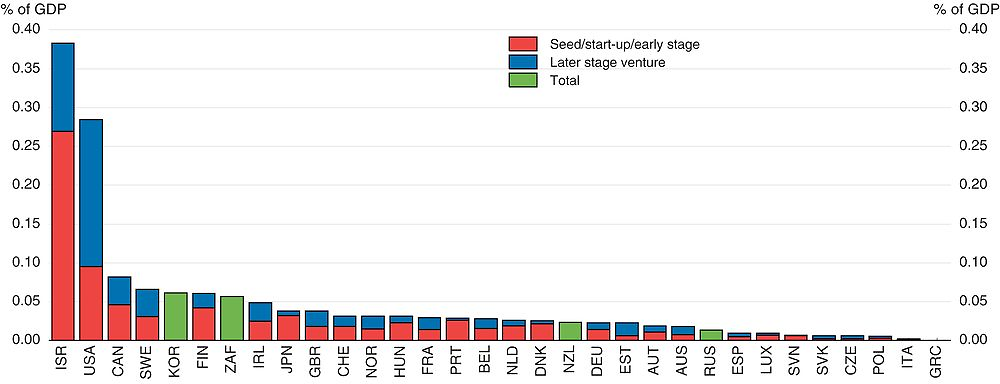
Source: OECD (2015b), Entrepreneurship at a Glance.
Securitisation and capital market financing
Simple, transparent and standardised securitisation of SME loans (and other liabilities such as leasing) can be seen as a market-based shortcut to indirectly foster SME financing, ‘unclogging’ the bank lending channel by transferring SME credit risk partially from originators to investors and achieving capital relief. Despite an increase in total securitisation issuance in the past years, only a small minority of transactions was actually placed with investors, with the majority of deals being retained for repo funding with the ECB throughout the period when such collateral was eligible for central bank repo refinancing (Nassr et al., 2016). Capital market financing conditions remain particularly difficult for Greek SMEs. The loss of trust that came as a consequence of the uncertain macroeconomic and political environment has contributed to the inability of Greek companies to tap capital markets (Bank of Greece, 2015). Interestingly, the only corporates to have successfully issued corporate bonds in the capital markets since 2012 have been export-oriented companies or companies with important share of export activity (Titan, Fage, OTE, Hellenic Petroleum and Frigoglass).
SMEs should be encouraged to use more market-based finance. Raising their awareness of other available financing options and equipping them with the skills required for tapping public markets can enhance their participation in these markets (Nassr et al, 2016). The creation of a system around those markets and instruments can support small-sized transactions and accompany SMEs at the issuance/listing and in the aftermarket. Capital market financing is promoted currently in Europe under the umbrella of the Capital Markets Union. In Europe and in Greece, the support of public sector on SME securitisation is through credit enhancement (guarantees) provided by the EIF (EIB Group). In any case, Capital market financing should be seen as complementary to, rather than a substitute for, banking lending.
Other policies affecting competitiveness and exports
Improving the tax system
The lack of efficiency of the tax system is also a constraint for firms. A quarter of SMEs declare that increased tax obligations a key problem (NBG, 2014), and that corporate income tax is too high. At 29%, the rate is actually above the average of OECD countries. It affects cost competitiveness of firms and the pre-tax return expected to engage in exports. It can also impact the productivity of firms in many ways. Higher corporate taxes may reduce incentives for productivity-enhancing innovations by reducing their post-tax returns. They may also reduce the investment in physical capital by increasing its cost, which in turn will affect total factor productivity (TFP). High corporate taxes can also have a negative impact on competition, for example by reducing incentives for risk-taking or for productivity-enhancing investment (Arnold et al, 2011c).
The tax wedge on labour (including personal income tax and social security contributions) is also higher that the OECD average. Despite the current difficult fiscal situation which limits the possibility of cutting taxes, there is nonetheless some room of manoeuvre to make the tax system more supportive of exports by improving tax administration and fighting tax evasion.
Many firms also complain that the delay to get VAT refunds is very high. Reducing this delay will be achieved by a better tax administration. Currently, the Greek tax administration fails to produce efficient services to businesses. Its performance can be improved by reinforcing the transparency and independence of the tax administration while developing compliance assessment and risk management.
Reforming the judicial system
Judicial procedures in Greece are complex and take a long time. The August 2015 MoU with the creditors includes some proposals to modernise and enhance the efficiency of the judicial system and some actions, such as the adoption of the new Civil Code, have already been taken (Chapter 1). The three-year strategic plan should encompass key actions aimed at enhancing judicial efficiency, speeding up judicial proceedings and addressing shortcomings in the functioning of courts such as, but not limited to, collecting information on the situation of the courts, computerisation, developing alternative means for dispute resolution, such as mediation, rationalizing the cost of litigation and improving in court functioning and court management. Increasing the efficiency of the judiciary is a key element to improve the business environment as it reduces uncertainties and transaction costs.
Boosting innovation
Innovation is one important requirement for SMEs successful participation in global value chains (OECD, 2008). Upgrading a small firm’s position in the value chain is typically linked to the take-up of a wider and more complex set of tasks. Investment in Knowledge Based Capital (KBC) is important to allow firms to increase their productivity. Moreover, investment in ICT is essential to allow SMEs to reach more easily foreign markets via, for instance, e-commerce.
The low integration in value chains and share of high tech products in exports can reflect weak innovation. Greece ranks very low regarding patent and trademark applications. This can in turn be influenced by low spending on R&D. At 0.8% of GDP R&D expenditure is well below the 2.5% average of OECD countries (Korea and Israel spend more than 4%, see Figure 2.20). The larger part of R&D expenditure (around 37%) occurs in universities whose links with industry are weak in Greece. This is one of the highest shares among OECD countries.
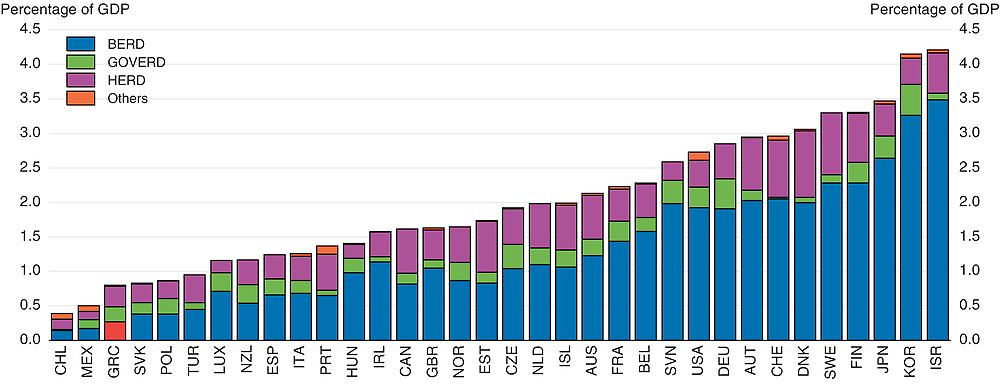
Source: OECD (2015), Science and technology database.
Innovation, through the creation of new or significantly improved products (goods or services), process or methods, is a key determinant of economic growth (OECD, 2010). In the context of GVCs, innovation translates into upgrading and the efforts of companies to increase the value they create and capture in GVC activities (Gereffi, 1999). Upgrading allows firms and countries to move to industries and activities that create more value added.
The recent literature has emphasised the growing role of KBC as a source of productivity gains, and the contribution of efficient resource allocation to this process (Andrews and de Serres, 2012). Innovation and more broadly investment in KBC are essential to enable product differentiation which will lead to gains in market shares. KBC comprises three main categories: computerised information, innovative property and economic competencies. In many areas Greece could improve its investment in human and knowledge-based capital (Figure 2.21). According to PISA 2012, Greek performance in science, reading and mathematics proficiency at age 15 is also one of the lowest in OECD countries despite some improvement in mathematics and reading.
Source: OECD (2015) Science, Technology and Industry Scoreboard.
Policies to support the upgrading process are largely similar to policies to enhance productivity (OECD, 2013b). The returns to investing in KBC are partly shaped by structural policies, which influence the ability of economies to reallocate scarce resources to firms that invest in KBC. Well-functioning product, labour and venture capital markets and bankruptcy laws that do not overly penalise failure can raise the expected returns to investing in KBC by improving the efficiency of resource allocation competencies (Andrews and Criscuolo, 2013). The Government should strengthen product market competition to enhance firm’s productivity and foster a dynamic business sector that allows new, innovative firms to emerge, experiment and grow.
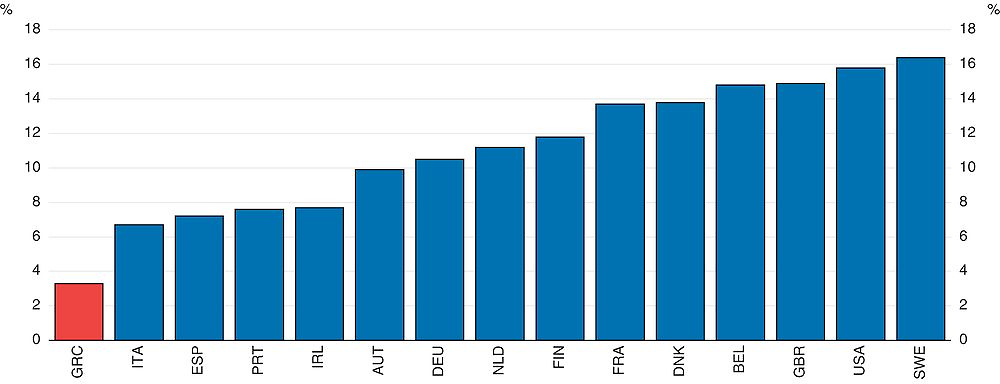
It is important to encourage the use of the new opportunities offered by information and communications technology, including the Internet, to overcome some of the barriers highlighted above, including by directly engaging with foreign markets through electronic commerce. Greece’s investment in ICT is one of the lowest in OECD (OECD, 2013c) and is a drag on firms’ productivity and ability to export. Regarding e-commerce, Greece lags behind with only around 10% of firms engaged in sales via e-commerce compared to 21% in OECD countries (Figure 2.22). Moreover, among the few having engaged in e-commerce, only around 40% have engaged into international trade.
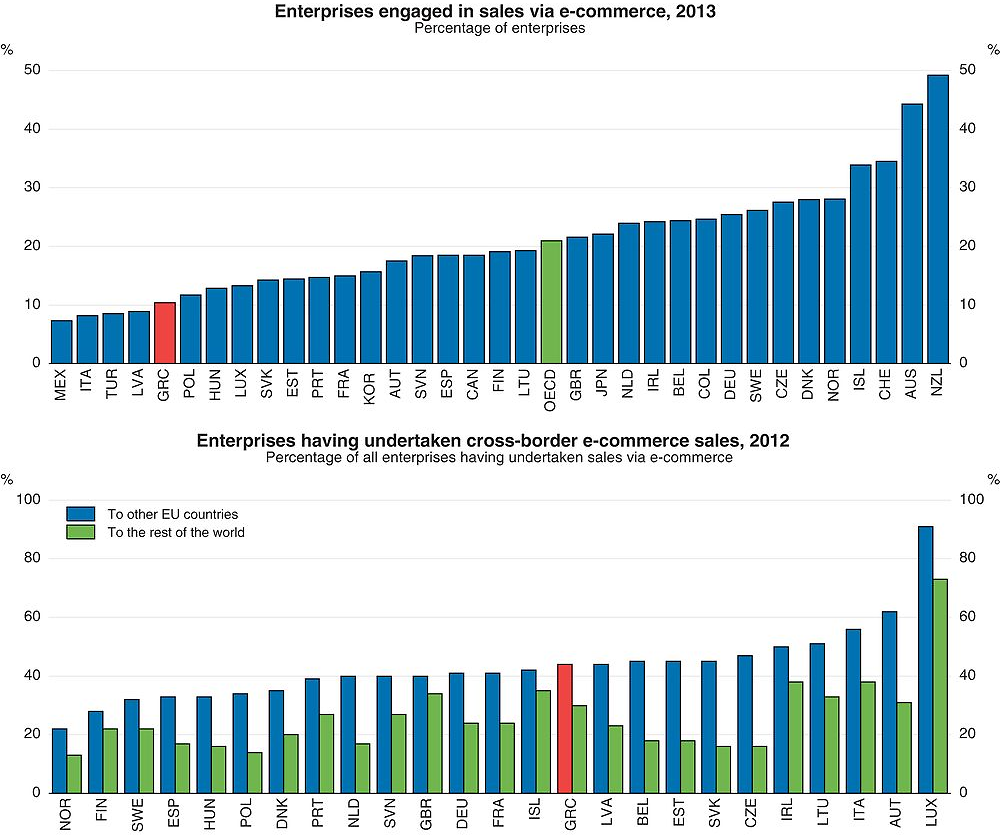
Source: OECD, based on Eurostat, ICT database, Information Society Statistics database, June and July 2015.
The Internet dramatically reduces the cost of finding buyers, both globally and domestically and ICT services enable SMEs to outsource some costly activities, reducing their costs and barriers to trade (G20 report). New ICT tools can facilitate cross border e-commerce and participation in global markets for smaller and new entrants. Enhancing access to ICT networks and enabling SMEs to engage in e-commerce can be an effective way for small firms to go global and even grow across borders where they can become competitors in niche markets. Investing in broadband infrastructure would help the development of e-commerce.
Some sectors and products’ comparative advantages could be better exploited
Tourism as a source of growth
Tourism has always been a major source of growth in Greece and is one of the few sectors which have not suffered too much from the crisis. The total contribution of travel and tourism to GDP was 16% in 2011. In 2012, the tourism sector accounted for 18% of employment, and 14% of investment (OECD, 2014b) (Figure 2.23). The balance of income from tourism, at 4.4% of GDP, is the highest in OECD countries. Greece owns one of the highest capacity of bed places/inhabitants and the occupancy rate is also high (OECD, 2014b). Tourism has always been important for the Greek authorities (Box 2.3). In 2016 a New Investment Incentives Law is planned to be introduced, which will rely on small and medium sized projects combining high quality and value added tourism products. Meanwhile the National Strategic Reference Framework 2014-20 supports tourism SMEs to upgrade the quality of their services.
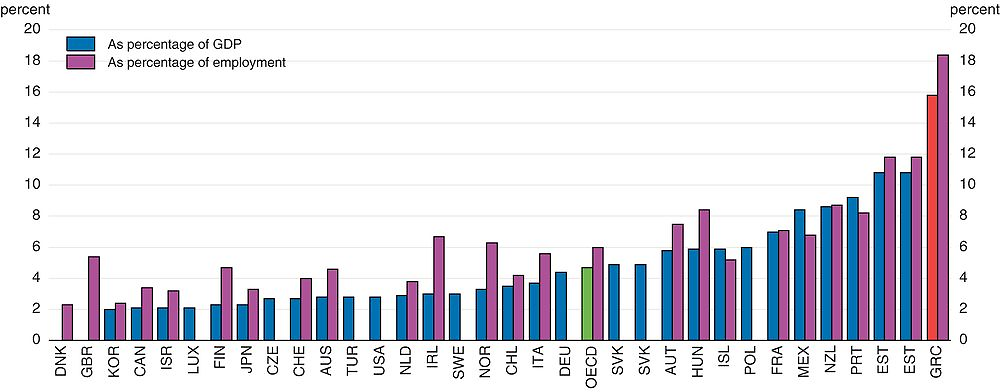
Source: OECD (2014), Tourism trends and policies.
The arrival of tourists is little affected by prices, but depends more on non-price structural factors such as the infrastructure that supports travel activity in Greece (Gazopoulou, 2012). Moreover, due to the seasonal nature of the sector, it may be difficult to raise capacity during high season. Greece should ease the restrictions on cabotage and eliminate discriminatory port charges to facilitate tourism activities.
Tourism organisation and governance
Acknowledging the importance of tourism in the economy, the Greek government, in June 2012, separated tourism from culture to form an independent entity with extended responsibilities. In 2015, it became part of the Ministry of Economy, Development and Tourism. The Ministry is responsible for overall Greek tourism policy as well as the regulation, planning and programming of tourism development. Its regional offices are also responsible for licensing and auditing tourism businesses, e.g. accommodation providers, travel agencies, etc.
The Ministry supervises the Greek National Tourism Organisation (GNTO) and the Hellenic Chamber of Hotels. The GNTO is responsible for promotion and advertising campaigns, aimed at developing both domestic and inbound tourism. The Hellenic Chamber of Hotels (a public law entity consisting of all hotels and camp sites operating in Greece) is the state’s institutional consultant as far as tourism and hospitality are concerned.
Tourism policies
The National Tourism Strategy aims at:
-
Upgrading tourism products and services.
-
Upgrading tourism infrastructure.
-
Extending the tourism season.
-
Enhancing attractive investment environment.
-
Promoting new tourism products and undiscovered destinations.
In 2012, a range of legislative initiatives were adopted, including the recognition of thermal springs and the licensing of thalassotherapy (seawater therapy) and therapeutic centres, the establishment of the GNTO’s Special Service for Promoting and Licensing Tourism Enterprises, a “one-stop-shop” for tourism enterprises, the simplification of the licensing procedure for tourism enterprises, the introduction of a new form of integrated tourism enterprise, the Complex Tourism Accommodation, which includes four-star or five-star hotels, special tourism infrastructure (e.g. conference centres, golf courses, spas) and tourist residences (villas), the liberalisation of the tourist guide profession and the simplification of procedures and the abolishment of limitations on the operations of travel agencies and car rental agencies.
Better exploiting the shipping industry
The comparative advantage in maritime transport could be further exploited by developing a transit centre for the Balkans and beyond. This requires making port services and transport infrastructure more efficient. With the important increase in world trade over the past 20 years due to, in particular, the penetration of Asian products, the global container traffic in Greece has been multiplied by seven between 1990 and 2011 (National Bank of Greece, 2013). In Europe, Mediterranean ports have gained market shares while Northern ports have lost them.
The privatisation of part of the port in Athens has substantially raised traffic. In 2009, the concession of Pier II of the Piraeus container terminal was given to the Chinese enterprise Cosco. Container traffic in Piraeus (90% of the Greek container market) more than tripled between 2010 and 2012, while traffic in other Mediterranean ports increased by only 20% during the same period. In 2011 Greek ports received around 4% of Mediterranean container traffic, an increase from the 1.5-2 % in 2008-10. The level of capacity, infrastructure and equipment in the port of Piraeus is higher than in ports of similar size in Europe. The Thessaloniki port (the second port by size) is less well equipped. The value added from the projected increase in container handling in Greek ports is estimated to rise by 2.5% of GDP in 2018 with an expected creation of 125 000 jobs (NBG, 2013). The planned development of a “dry” port in Piraeus will further benefit the shipping activity. New investments are needed in Piraeus to benefit fully from its untapped potential.
The development of port activity not only depends on new investments in ports but also on a better quality of road and rail infrastructure. For example, the Piraeus port is not connected directly to the rail network. This could be done through using EU structural funds. Moreover the full privatisation of the Piraeus port, as agreed in the August 2015 MoU, is needed to increase its competitiveness and allow it to gain further market share.
Firms in the agricultural sector are small and not well integrated in GVCs
In the agricultural sector, Greece has considerable scope to develop brand products and export more processed products. For instance, Greece is the third largest producer of olive oil (11% of the world production) after Spain (40%) and Italy (14%), but only 27% of Greek production reaches the stage of labelled/branding, compared with 50% in Spain and 80% in Italy. The remainder, and 70% of exports, is sold in bulk (NBG, 2015). Greek olive oil is of good quality, but Greece does not take full advantage of it.
The main problems are: olive oil producer costs are rather high mainly because of the small size of farms and the low productivity of workers; the mills are small and lack the optimal technology for efficiency and the small size of bottling and labelling companies makes it difficult to have a successful promotion of products (NBG, 2015). Greece could strengthen the competitiveness of its olive oil industry by reinforcing the vertical integration of production. In particular, larger farms (or more efficient cooperatives) could operate at lower cost and mount marketing and export strategies. Moreover, better organization along the value chain (including the stages of processing, branding and distribution) could lead to the distribution of branded products of standardised high quality (NBG, 2015).
Olive oil is not the only agricultural product that Greece could develop. Greece is already exporting many products in Europe and is increasing its market share in the United States. The main exported products are vegetables, fruits, olive oil, dairy products, fresh seafood, canned fruits, olives, raisins, wine, and tomato products (Enterprise Greece). The growing demand of healthy foods should be exploited.
Key recommendations
-
Ease regulations in network industries and strengthen the capacity and independence of regulatory agencies.
-
Fully operationalise the ‘national single window’ for exports, as foreseen by the National Trade Facilitation Strategy.
Further recommendations
-
Boost investment by front loading the use of European structural funds, and exploit better available public land through concessions to develop investment in logistics.
-
Ease the remaining barriers to trade and investment that prevent Greece to expand its exporting activities, such as limitation on foreign equity participation in maritime services or airport regulations.
-
Fully implement the new export promotion action plan to promote exports and help SMEs reach international markets.
-
Further reduce regulatory procedures and administrative burdens on startups to enhance productivity and investment.
-
Liberalize cabotage and eliminate discriminatory port charges to reduce time for export.
-
Reduce restrictions to competition in sectors such as manufacturing to increase export competitiveness.
-
Improve the investment in human and knowledge-based capital to allow upgrading in the GVCs, in particular in SMEs.
-
Enhance access to ICT networks and enable SMEs to engage in e-commerce to allow small firms to participate in global trade.
-
Promote a venture capital system with important direct links to university research and innovation to boost entrepreneurship.
Bibliography
Altomonte C., T. Aquilante and G. Ottaviano (2012), “The triggers of competitiveness: The EFIGE crosscountry report,” Blueprints, Bruegel, No. 738, October.
Andrews, D. and A. de Serres (2012), “Intangible Assets, Resource Allocation and Growth: A Framework for Analysis”, OECD Economics Department Working Papers, No. 989, OECD Publishing, Paris.
Andrews, D. and C. Criscuolo (2013), “Knowledge-Based Capital, Innovation and Resource Allocation”, OECD Economics Department Working Papers, No. 1046, OECD Publishing, Paris.
Anyadike-Danes M., C. M. Bjuggren, S. Gottschalk, W. Hölzl, D. Johansson, M. Maliranta and A. Grinde Myrann (2014), “Accounting for Job Growth: Disentangling Size and Age Effects in an International Cohort Comparison”, IFN Working Paper, No. 1019, Research Institute of Industrial Economics (IFN), Stockholm.
Arkolakis C., Doxiadis A. and Galenianos M. (2015), “The challenge of trade adjustment in Greece”, in “Crisis in the Eurozone periphery: Policy options for Greece”, MIT Press.
Arnold, J. (2015), “Boosting export performance in Portugal”, OECD Economics Department Working Papers, No. 1257, OECD Publishing, Paris.
Arnold, J., Javorcik, B., Lipscomb, M., and Mattoo, A. (2011a). “Services reform and manufacturing performance: Evidence from india”. CEPR Discussion Paper 8011.
Arnold, J., Javorcik, B., and Mattoo, A. (2011b), The productivity effects of services liberalisation: Evidence from czech republic. Journal of International Economics, 85(1).
Arnold, J., B. Brys, C. Heady, A. Johansson, C. Schwellnus and L. Vartia (2011c), “Tax Policy for Economic Recovery and Growth”. The Economic Journal, 121: F59-F80.
Athanasoglou, P., Backinezos, C. and E.A. Georgiou (2010), “Export Performance, Competitiveness, and Commodity Composition”, Bank of Greece Working Paper, No. 114.
Bank of Greece (2009), Governor’s Report for the Year 2008, Athens.
Bardakas I (2014), “Financing exports of goods: a constraint on Greek economic growth”, Bank of Greece Working Paper, No. 178.
Bas M. (2013), “Does services liberalization affect manufacturing firms’ export performance? Evidence from India”, Document de travail No 17, CEPII, June.
Bas, M. and Causa, O. (2013). “Trade and product market policies in upstream sectors and productivity in downstream sectors: firm-level evidence from China”, Journal of Comparative Economics, Volume 41, Issue 3, August 2013, Pages 843-862.
Bravo-Biosca, A., C. Criscuolo and C. Menon (2013), “What Drives the Dynamics of Business Growth?”,OECD Science, Technology and Industry Policy Papers, No. 1, OECD Publishing, Paris.
Berman, N. and J. Héricourt (2010), “Financial Factors and the Margins of Trade: Evidence from Cross-Country Firm-Level Data”, Journal of Development Economics 93, 93.2 (2010): 206-217.
Correa-Lopez M. and Domenech R., (2014), “Does anti-competitive service sector regulation harm exporters? Evidence from manufacturing firms in Spain”, BBVA Working Paper, No 14/13.
Criscuolo, C, P N Gal, and C Menon (2014), “The dynamics of employment growth: new evidence from 18 countries”, OECD Science, Technology and Industry Policy Papers, OECD Publishing, Paris.
Daude C. and C. de la Maisonneuve (2016), “Network Service Deregulation and Manufacturing Exports in Greece”, OECD Economics Department Working Paper, forthcoming.
De Backer, K. and S. Miroudot (2013), “Mapping Global Value Chains”, OECD Trade Policy Papers, No. 159, OECD Publishing.
Eaton, J. and S. Kortum (2002), “Technology, geography and trade”, Econometrica, Vol. 70, No. 5.
EC (2014), Task force for Greece, Seventh activity report.
ECB (2013), “Corporate finance and economic activity in the euro area”, Occasional Paper Series 151. ECB (2015), “Survey on the access to finance of enterprises in the euro area”, October 2014 to March.
Fernandes, A. and Paunov, C. (2012). Foreign direct investment in services and manufacturing productivity: Evidence for chile. Journal of Development Economics, 97:305-321.
Fournier, J. et al. (2015a), “Implicit Regulatory Barriers in the EU Single Market: New Empirical Evidence from Gravity Models”, OECD Economics Department Working Papers, No. 1181, OECD Publishing, Paris.
Fournier, J. (2015b), “The negative effect of regulatory divergence on foreign direct investment”, OECD Economics Department Working Papers, OECD Publishing, Pairs (forthcoming).
Gazopoulou H. (2012), “A note of the effectiveness of price policy on tourist arrivals to Greece”, Bank of Greece Working Paper, No. 144.
Gereffi, G. (1999), “International Trade and Industrial Upgrading in the Apparel Commodity Chain”, Journal of International Economics, 48: 37 – 70
Haltiwanger, J., R.S. Jarmin and J. Miranda (2013), “Who Creates Jobs? Small Versus Large Versus Young”, Review of Economics and Statistics, 95(2), pp. 347-361.
Hummels, D. L., and G. Schaur (2013). “Time as a Trade Barrier”. American Economic Review, 103(7): 2935-59.
IOBE (2012), “The Macroeconomic Effects from the Utilisation of Private Property Owned by the Greek State”
Johansson, Å. and E. Olaberría (2014), “Long-term Patterns of Specialisation and Trade”, OECD Economics Department Working Papers, No. 1136, OECD Publishing, Paris.
Heckscher, E.F. and B, Ohlin (1991), “Heckscher-Ohlin Trade Theory”, Cambridge, MA, MIT Press.
Lederman, D., M. Olarreaga and L. Payton (2010), “Export promotion agencies: Do they work?”, Journal of Development Economics 91, pp. 257-265.
Manova, K. (2013), Credit Constraints, Heterogeneous Firms, and International Trade, Review of Economic Studies, 80, 711-744.
Melitz, M. (2003), “The Impact of Trade on Intra-Industry Reallocations and Aggregate Industry Productivity”, Econometrica 71 (6), pp. 1695-1726.
Melitz, M. and G. Ottaviano (2008), “Market Size, Trade, and Productivity,” Review of Economic Studies, Oxford University Press, Vol. 75(1), pp. 295-316.
Muûls, M. (2012), Exporters, Importers and Credit Constraints, Center for Economic Performance Discussion Paper, No. 1169.
National Bank of Greece (2013), “Container Ports: An Engine of Growth”, Sectoral Report
National Bank of Greece (2014), “Survey of Greek SMEs, Special Issue: Exports”
National Bank of Greece (2015), “Olive oil: Establishing the Greek Brand”, Sectoral Report
Nassr, I.K. and G. Wehinger (2015), “Unlocking SME finance through market-based debt: Securitisation, private placements and bonds”, OECD Journal: Financial Market Trends Vol. 2014/2, https://doi.org/10.1787/fmt-2014-5js3bg1g53ln.
Nassr I.K, V. Robano and G.Wehinger (2016), “Unleashing the Export Potential of Greek SMEs to Jump-Start Economic Recovery and Spearhead Growth”, OECD DAF Working Papers, forthcoming.
Nordås, H. K. and D. Rouzet (2015), “The Impact of Services Trade Restrictiveness on Trade Flows: First Estimates”, OECD Trade Policy Papers, No. 178, OECD Publishing, Paris.
OECD (2008), Enhancing the Role of SMEs in Global Value Chains, OECD Publishing, Paris.
OECD (2010), The OECD Innovation Strategy: Getting a Head Start on Tomorrow, OECD Publishing, Paris.
OECD (2013a), OECD Economic Surveys: Greece 2013, OECD Publishing, Paris.
OECD (2013b), Interconnected Economies: Benefiting from Global Value Chains, OECD Publishing.
OECD (2013c), OECD Science, Technology and Industry Scoreboard 2013, OECD Publishing, Paris.
OECD (2013d), Economic Policy Reforms 2013: Going for Growth, OECD Publishing, Paris.
OECD (2014a), Entrepreneurship at a Glance 2014, OECD Publishing, Paris.
OECD (2014b), OECD Tourism Trends and Policies 2014, OECD Publishing, Paris.
OECD (2015), Economic Policy Reforms 2015: Going for Growth, OECD Publishing.
OECD (2015b), Entrepreneurship at a Glance 2015, OECD Publishing, Paris.
OECD (2015c), Financing SMEs and Entrepreneurs 2015, an OECD Scoreboard, OECD Publishing, Paris.
OECD (2015d), OECD Economic Outlook, Volume 2015 Issue 2, OECD Publishing, Paris.
Panhellenic Exporters Association (2015), “Greek Exports: Prospects and Challenges”, mimeo.
Papazoglou, C. (2009), “Is Greece’s Performance Really Low?”, Economic Policy, Bank of Greece, May.
Pelagidis T. (2014), “Why Internal Devaluation is Not Leading to Export-Led Growth in Greece”, Brookings.
World Bank (2015). Doing Business 2016: Measuring Regulatory Quality and Efficiency. Washington, DC: World Bank.