Chapter 1. Boosting productivity
Boosting productivity growth is necessary to raise living standards and well-being for all. Aggregate productivity has fallen, mainly driven by manufacturing, although service industries have also tended to underperform. Reviving productivity requires improving framework conditions further so labour and capital can more easily move to the most dynamic sectors and firms, making the tax system more growth-friendly, and supporting innovation, basic research and young firms’ financing.
Since the onset of the global financial and economic crisis, Finland’s productivity has declined both in absolute terms and relative to the leading OECD economies. The fall in productivity primarily reflects a strong manufacturing and especially information and communication technologies (ICT) cycle. These sectors had driven exceptionally high growth before the downturn, but have since collapsed. The slowdown in other sectors is more in line with global productivity developments and hence can be, at least partly, related to the weakness of the global economy and the associated slowdown in the diffusion of innovations (Box 1.1).
Reviving productivity growth is crucial to restore Finland’s competitiveness, to push up output when the contribution of labour input is shrinking due to population ageing, and to raise standards of living and well-being further. While productivity trends are strongly influenced by global factors, domestic policies also play a role. Structural reforms, including those announced by the government, can boost productivity by increasing competition, improving the business environment, facilitating the reallocation of resources towards growth sectors and enhancing incentives for work and entrepreneurship. Promoting investment in R&D, which has contracted sharply over recent years, raising the efficiency of the innovation system and supporting young firms’ growth and internationalisation is also key to Finland’s future productivity performance and competitiveness.
A country’s productivity performance can broadly be split into three elements: productivity developments at the global productivity frontier, the distance of the best-performing local firms to that frontier, and the position of other companies relative to national leaders (OECD, 2015a). While developments at the global frontier are largely determined by technological progress, policies have a strong role to play in helping local firms reach the frontier and in facilitating the diffusion of innovations across the economy.
Future productivity growth at the global productivity frontier is very uncertain and the recent economic downturn has revived the old debate on whether the world is heading for secular stagnation or renewed expansion. Gordon (2012) argues that the wave of innovation associated with information technology and the Internet, which boosted US productivity between 1995 and 2004, has largely run its course. Combined with headwinds from ageing, slowing progress in education, rising inequality, global competition, environmental challenges and high consumer and government debt, slower innovation could lower real consumption per capita annual growth for 99% of the population to below 0.5% for decades. Although the analysis is US-specific, it is relevant for any country close to the efficiency frontier, where growth is mainly driven by innovation. However, Gordon’s pessimistic view is disputed. Byrne et al. (2013) show that semiconductor technology has continued to progress rapidly in recent years. They see a “reasonable prospect” that this could lift back US non-farm business sector labour productivity growth to its long-term average of 2.25%.
Recent OECD research also creates ground for optimism. Firms at the global productivity frontier, identified as the 100 globally most productive firms, have continued to expand rapidly after 2004, when aggregate productivity in advanced economies began to slow. The widening gap between frontier firms and others suggests that innovation is still strong, both in manufacturing and services, but that diffusion has weakened. The key factors driving diffusion are openness and factor mobility, knowledge-based capital, the ability of firms to upscale and competition.
Finland is a very open economy with strong human and knowledge-based capital and is therefore well placed to benefit from knowledge diffusion. A number of Finnish firms are close to the global productivity frontier. Continued investment and enhanced efficiency in innovation can push more Finnish firms towards the global efficiency frontier, and hence allow them to benefit from comparative advantages in global value chains. There may also be ways to make the country more attractive to foreign investors and workers, which could also lift the local productivity frontier.
The greatest challenge in Finland, as in other advanced economies, seems to be the diffusion of innovations from the frontier to other firms. Creative destruction played a strong role in Finland’s productivity performance since the mid-1980s, although it lost intensity in the early 2000s (Maliranta et al., 2010). The Finnish economy is now undergoing deep structural change, which will be supported by reforms aimed at facilitating the reallocation of resources and boosting entrepreneurship. This should translate into higher productivity over time. However, new firms tend to have low productivity initially. Aggregate productivity rises only once successful entrants achieve a high level of productivity and unsuccessful ones exit the market (Hyttinen and Maliranta, 2013). Policies need to create an environment which supports this market selection process.
This chapter is organised as follows. The first section compares Finland’s productivity performance to the leading OECD countries. The second shows how sectorial developments have shaped aggregate productivity evolutions. The third examines the deterioration in competitiveness. The fourth outlines structural reforms with potential to raise productivity. The final section looks at innovation and entrepreneurship policies.
Finland is losing ground vis-à-vis leading OECD countries
Convergence to the leading OECD economies’ income level has stalled
Finland’s GDP per capita gap to the leading OECD economies has widened again after shrinking by about 15 percentage points between the early 1990s and 2008 on the back of strong productivity growth. A continued deterioration in the terms of trade, partly due to falling electronic products prices, has acted as a drag on income (Figure 1.1, PanelA). The level of Finnish GDP per capita is above the OECD and EU average, but lower than in all other Nordic countries (Figure 1.1, Panel B). The GDP per capita gap essentially results from lower productivity (Figure 1.1, Panel C). Labour utilisation is close to the upper half of the OECD countries’ average (Figure 1.1, Panel D).
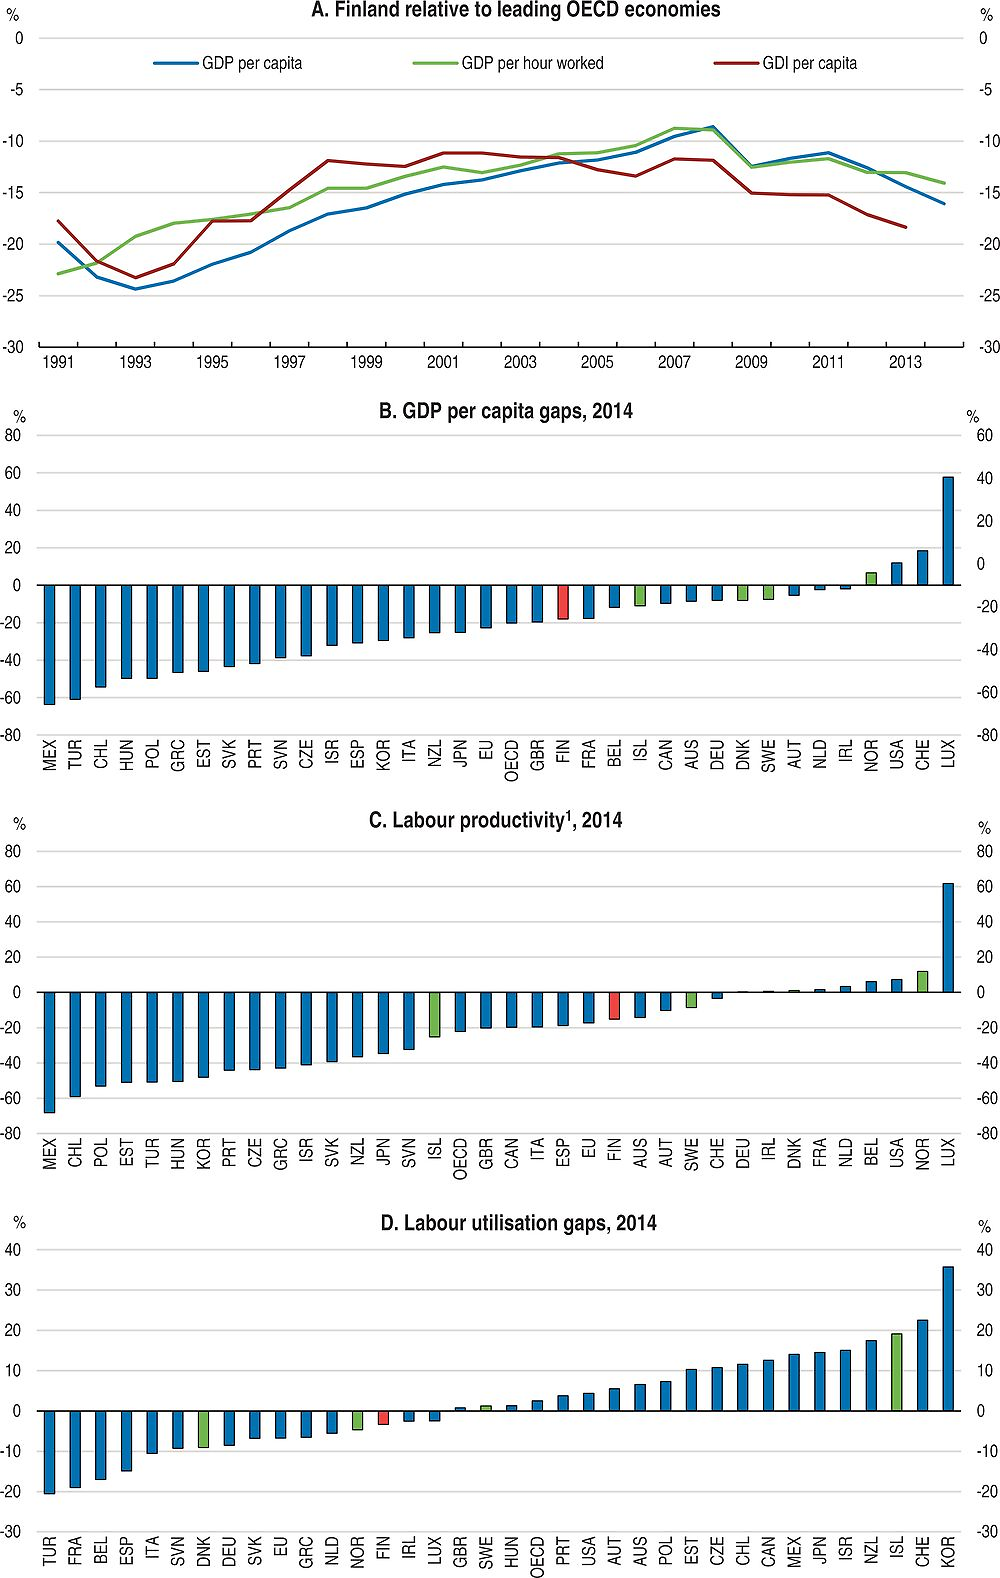
Note: Percentage gaps with respect to the simple average of the best performing 17 OECD countries.
1. Real output per hour worked.
Source: OECD, National Accounts and Productivity databases.
Productivity growth has fallen
The pre-crisis expansion was primarily driven by growth in total factor productivity (TFP), which encompasses technological innovations, new business models and more efficient allocation of resources (Figure 1.2, Panel A). To a large extent, Finland’s growth performance during that period reflects the rapid spread of ICT, reflected in strong ICT investment, particularly in communication equipment where Finland outpaced all other OECD countries, and strong TFP gains allowed by digitalisation (Spezia, 2012). Increases in labour input and non-ICT capital deepening also made sizeable contributions to GDP growth in the decade preceding the global financial and economic crisis. After 2007, TFP collapsed. At the same time, demand for labour and investment were hit by low demand for goods and services, contributing further to output weakness. The turnaround in TFP performance has been among the most spectacular in the OECD. From 1997 to 2007, TFP growth in Finland came second only to Korea among countries for which reliable data are available. However, Finland’s drop in TFP growth from 2007 to 2013 was the largest in the sample, some of which may be explained by labour hoarding. Although TFP fell in many countries, it continued to increase in Japan, Korea, the United States and a few others, albeit at a slower pace than before the crisis (Figure 1.2, Panel B).
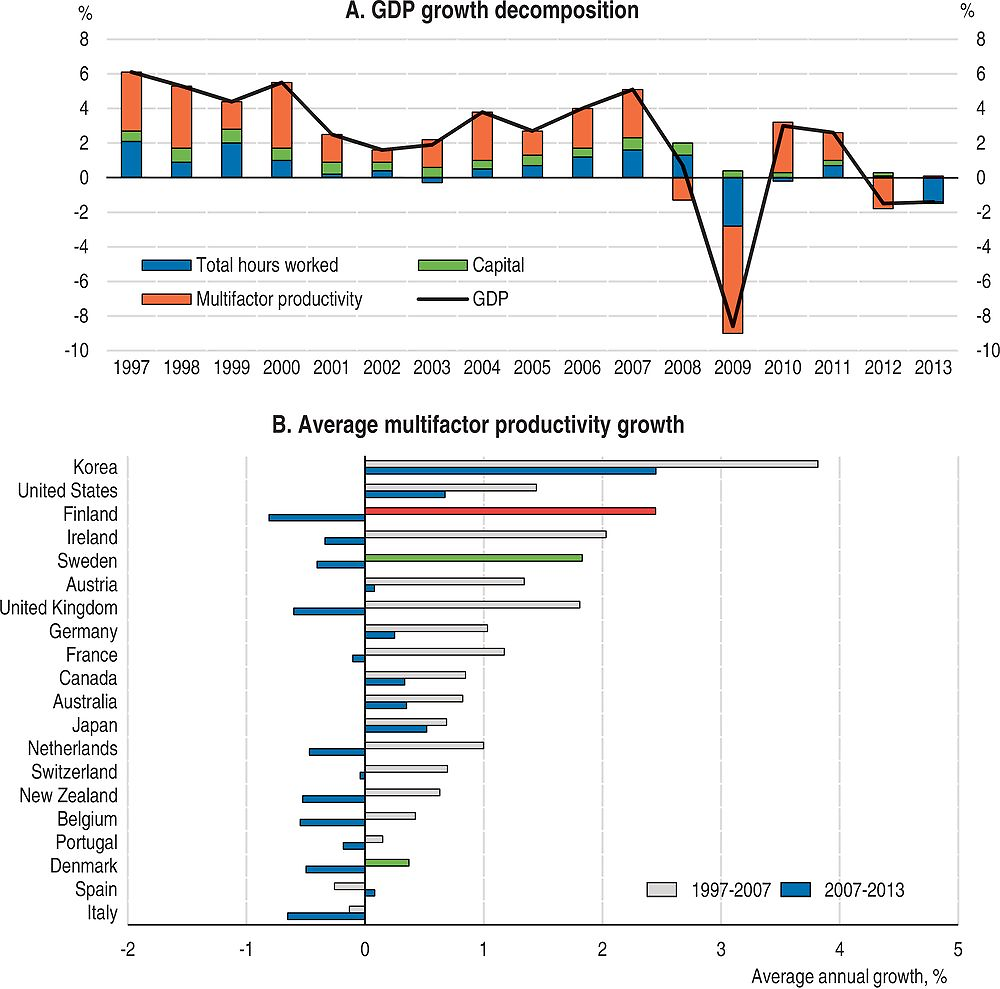
Source: OECD Productivity database.
Productivity growth has varied widely across sectors
Finland outpaced most countries in terms of output per hour worked between 1997 and 2007 (Figure 1.3, Panel A). Manufacturing productivity growth was outstanding before 2007, but subsequently declined and failed to rebound, contrary to what occurred in Sweden (Figure 1.3, Panel B). Business services productivity growth has been sluggish, as in Denmark and Germany, contrasting with the strong performance of Norway, Sweden and the United Kingdom (Figure 1.3, panel C). This suggests that there is room for raising business services productivity in Finland, which is all the more important as services and manufacturing are increasingly intertwined (Ministry of Employment and the Economy, 2015). Productivity in public services has declined in Finland, while it has increased in Germany and remained broadly flat in other peer countries (Figure 1.3, panel D). Public sector productivity estimates should be taken with great caution, as measuring non-market output and adjusting for quality improvements is challenging (Jääskeläinen and Lönnqvist, 2011). Nevertheless, there seems to be scope for efficiency improvements in public services provision, notably in health and social services. The successful implementation of the social welfare and health care reform, which is to enter into force on 1 January 2019, would enhance efficiency. The government expects the associated annual savings to amount to e3 billion (about 1.5% of GDP). Furthermore, better coordination of health care should also improve health and well-being outcomes.
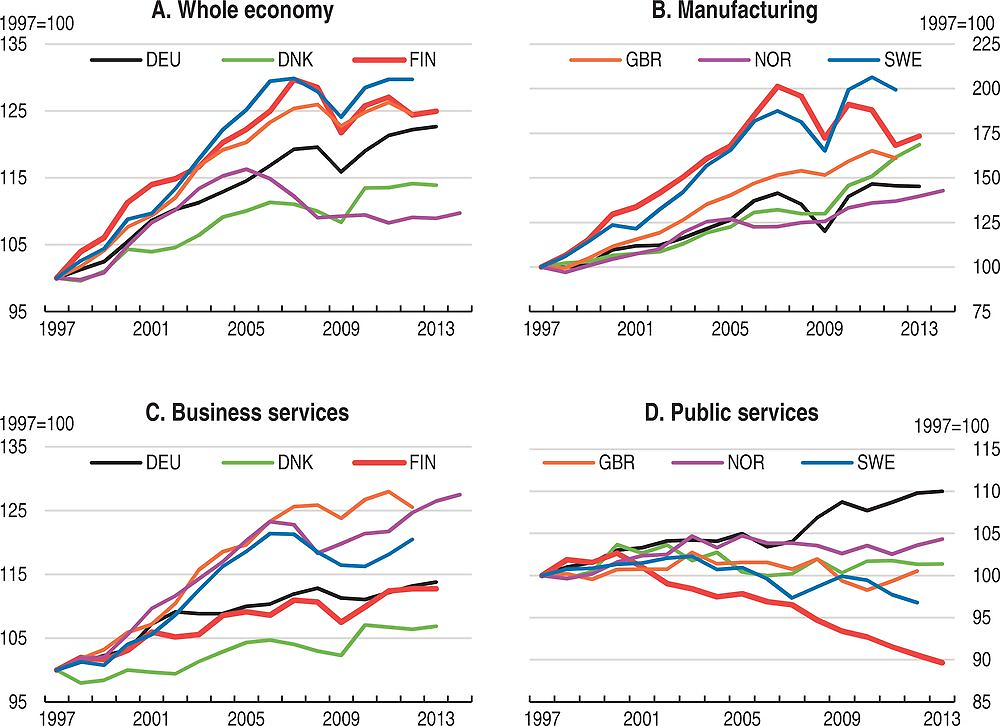
Source: OECD, National Accounts database.
The manufacturing sector has been the key driver of productivity developments, even though it represents less than a fifth of total hours worked. It contributed two-thirds of overall productivity growth between 1997 and 2007 and an even higher share of the decline since then. The contribution of manufacturing of computers and other electronic equipment to productivity swings has been particularly large, even though that sector represents less than 2% of labour input (Table 1.1). A closer look at the time profile shows that this sector accounts for most of the labour productivity drop since 2011 (Figure 1.4). This largely reflects the difficulties of Nokia, which ended up exiting the mobile phone business, after missing the “smartphone revolution”. Other manufacturing sectors, including wood and paper production, contributed to overall productivity growth during the upswing, but stalled after 2007. Reallocation of labour between sectors has contributed only modestly to productivity growth during the upswing and its impact turned negative after 2007, as high-productivity industries contracted.
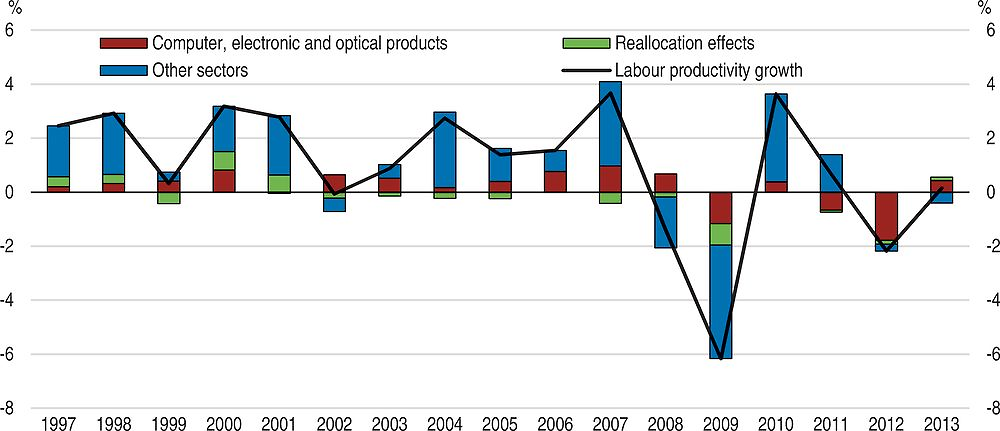
Source: OECD, National Accounts database.
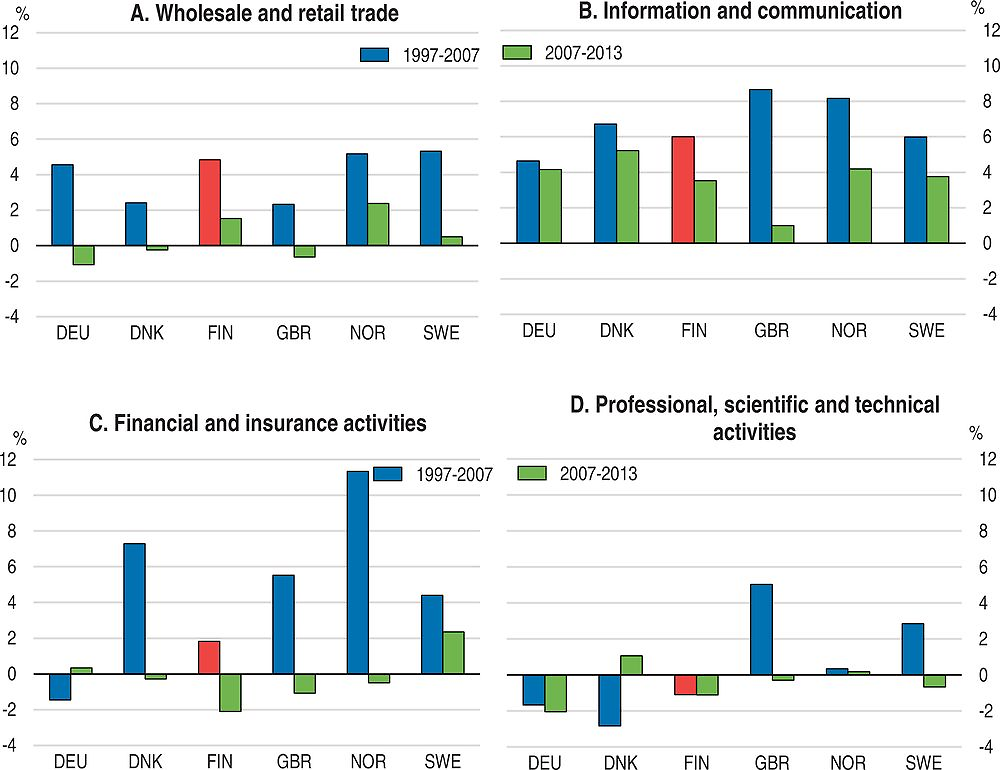
Productivity in the business services sector has advanced only slowly in the past 15 years. Business services accounted only for about a fourth of productivity growth between 1997 and 2007, even though they represent about 40% of labour input. Productivity growth varies widely across service sectors (Figure 1.5). Information and communication services achieved strong productivity growth between 1997 and 2007, even though progress in this area was even faster in Denmark, Norway and the United Kingdom. As in most peer countries, productivity growth in information and communication services has remained healthy after the crisis. Productivity has also increased in wholesale and retail trade, albeit at a slower pace than in Norway and Sweden. The slowdown after 2007 has been milder than in Sweden, reflecting efforts to adapt to tough market conditions, as the purchasing power of consumers stagnated or contracted. Productivity in financial and insurance services has been weak compared to most peer countries. However, measurement issues and the regional dimension of the biggest market players make it difficult to interpret this result, which may even be considered implausible (Maliranta et al., 2010). The most disappointing performance has been in professional, scientific and technical services, which contrasts with strong advances in Sweden and the United Kingdom.
Source: OECD, National Accounts database.
In line with sluggish productivity growth, the price of services is high in Finland. Since 2007, domestic service prices have increased by over 10% more than in the euro area (Bank of Finland, 2015). High service prices eat into the purchasing power of households, but also reduce the cost-competitiveness of exports by raising input prices.
Finland’s competitiveness has weakened
Recent weakness results from multiple causes and hence no single policy will be enough to revive the Finnish economy. The erosion of cost competitiveness since 2007 contributes to the weakness of exports, but non-cost factors are at least equally important. Both the outstanding productivity performance before 2007 and the subsequent fall were largely driven by the ICT sector. While a repeat of the performance of the early 2000s is unlikely, digitalisation still offers potential to enhance productivity (Ministry of Employment and the Economy, 2015). Other sectors, notably in services, have been lagging behind and offer opportunities to catch up. For this potential to materialise, innovation and entrepreneurship are needed. This calls for structural reforms to facilitate the allocation of resources towards the most dynamic sectors of the economy and for policies encouraging the diffusion of knowledge (OECD, 2015a). R&D investment needs to remain high and broad-based to foster innovation and its ability to translate into economic benefits and competitive advantages needs to be enhanced. Entrepreneurship is key to the diffusion of innovations. Beyond streamlining regulations, entrepreneurship and young firms’ development can be encouraged through direct funding, enhanced co-operation between universities and companies, support for internationalisation and high-quality infrastructure. Sustaining a high level of educational achievements and skills is also essential (see Chapter 2).
The sharp slowdown in productivity after the global financial and economic crisis has not been immediately matched by slower wage growth. Agreements between social partners reached just before the crisis led to fairly high wage increases in the early years of the downturn (Figure 1.6, Pane A). As a result, unit labour costs increased more than for Finland’s main trading partners (Figure 1.6, Panel B). Compared to 2007, cost-competitiveness has declined relative to Sweden, Germany and the euro area average. Recent wage agreements will lead to slow wage growth over the coming years. However, as wage growth is subdued in most of Finland’s trading partners, regaining cost-competitiveness will take time.
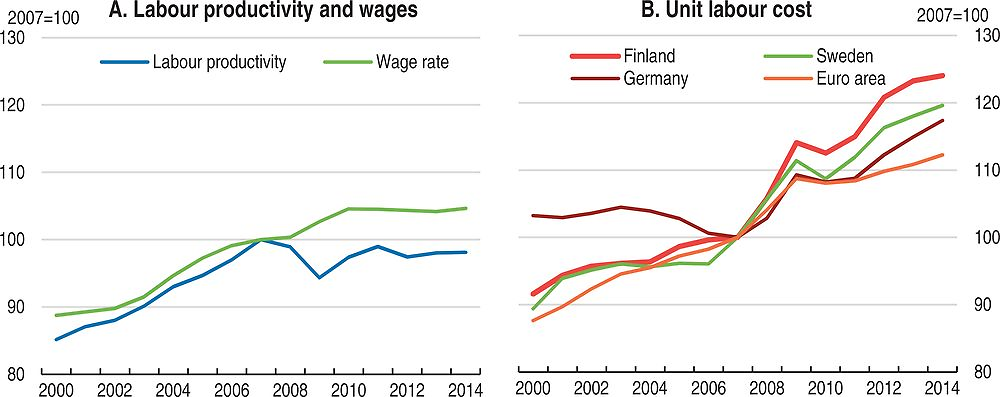
Source: OECD, Productivity and Economic Outlook 97 databases.
Beyond the deterioration in cost competitiveness, Finland has been hit by the sharp contraction in exports, mainly due to three factors: the loss of market share of Nokia mobile phones as the competition marketed more attractive smartphones; the fall in the demand for paper linked to the development of digital media; and more recently the slowdown of the Russian economy, with a further impact of EU sanctions on some sectors, notably agricultural and dairy products. While exports to Russia are likely to continue to decline for some time, the outlook is more positive for the paper and electronic industries, where the adjustment in output seems to have run its course and positive developments are emerging. Nokia’s earlier performance, which saw the company contribute 3 to 4% of Finnish GDP and around 20% of exports in the early to mid-2000s, was exceptional and is unlikely to be repeated. Nevertheless, after several years of deep restructuring, Nokia is again contributing to Finnish output growth. The paper industry is also renewing itself, focussing on markets where Finland has a comparative advantage over emerging economies because of the type of wood fibres it produces, and pursuing environmentally-friendly strategies, including the development of bio-energy as by-products. Shipbuilding was also badly hit and required government support during the crisis, but is now reviving, as Finland builds on its expertise in constructing giant cruise ships and proposes cleaner ships propelled by liquefied natural gas.
These green shoots have not been sufficient so far to make up for export losses since 2007. The volume of exports is still nearly 20% below its peak in the second quarter of 2008. Moreover, terms of trade have been on a declining trend until the recent drops in energy prices. As a result, the current account balance moved from a surplus of nearly 4% of GDP in 2007 to a deficit close to 2% in 2011 (Figure 1.7, Panel A). The deficit has been broadly stable since then, as weak consumption and exports are reflected in declining imports. Output growth in a small open economy like Finland is largely dependent on export performance. Despite a strong contribution from the chemical industry and promising developments in niche markets, like computer games, the contraction in electronics and forest products exports has only very partly been compensated by other industries. To some extent, this could be expected, as electronics and forest products accounted for a disproportionate share of exports before the crisis. However, Finland is probably not making the most of its potential, especially regarding services and SMEs. Finnish service exports have stagnated since 2009, in contrast with other Nordics, Germany and the United Kingdom. Norway and Sweden have performed particularly strongly (Figure 1.7, Panel B). Large surpluses on services, along with foreign income flows, have allowed Sweden to retain large current account surpluses despite goods surpluses falling like in Finland (OECD, 2015b).
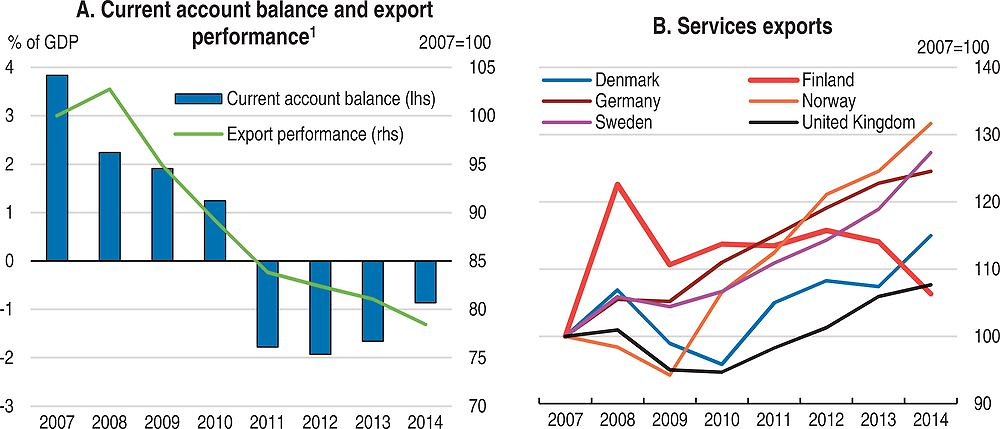
1. Ratio of exports to export markets (trade-weighted average of trading partners’ imports). A decrease indicates a loss in export market shares.
Source: OECD, National Accounts and Economic Outlook databases.
Structural reforms to facilitate the restructuring of the economy
Finland enjoys a business-friendly environment, which should help the reallocation of resources towards productive uses and encourage investments. The country ranks eighth on the World Economic Forum (WEF) Global Competitiveness Index 2015-16 and ninth on the World Bank 2015 Ease of Doing Business indicator. Finland is only twentieth in the Institute for Management Development ranking, reflecting the greater weight of cost-competitiveness in this assessment. According to the WEF ranking, Finland’s main strengths are in education, innovation and technological readiness, financial market development and institutions. The most problematic factors for doing business are high tax rates and restrictive labour regulations. OECD product market regulation (PMR) and service trade restrictiveness indices, while close to the OECD average, point to some areas for improvement compared to the best performing countries. The government’s structural reform programme could unleash the growth potential of Finland, if successfully implemented.
Removing obstacles to productivity
Effective regulations are essential to ensure the proper functioning of markets and address externalities, in particular relating to the environment, safety, consumer protection and fair competition. However, excessively burdensome regulations are detrimental to growth, as they lower productivity, distort the allocation of resources and weaken incentives for work and entrepreneurship. Finland’s product market regulations (PMR) are overall less restrictive than the OECD average and only the Netherlands and the United Kingdom have significantly leaner regulations (Koske et al., 2015). The 2011 Competition Act brought regulation in line with recommendations from the European Commission. It reinforced merger control and enhanced damage compensation as well as “whistle-blowing” instruments. It also expanded the investigation powers of the Finnish Competition Authority, whose resources have been increased. Competition is, however, limited by low population density in large parts of the country. Finnish regulations remain excessively cumbersome in some areas, notably retail trade, network industries, construction and land-use planning. Streamlining regulations is a key objective of the new government (Prime Minister’s Office, 2015).
As in other Nordic countries, public ownership of companies is high, but public companies generally operate on a commercial basis and state involvement in business operations is limited. The complexity of regulatory procedures, administrative burdens on start-ups and regulatory protection of incumbents are in line with OECD and Nordic averages, but markedly higher than in countries with the lightest regulations. In the service sector, start-ups face sizeable administrative barriers. In retail trade and network industries, regulatory protection of incumbents is strong. Barriers to trade and investment, however, are very low in most sectors (Figure 1.8).
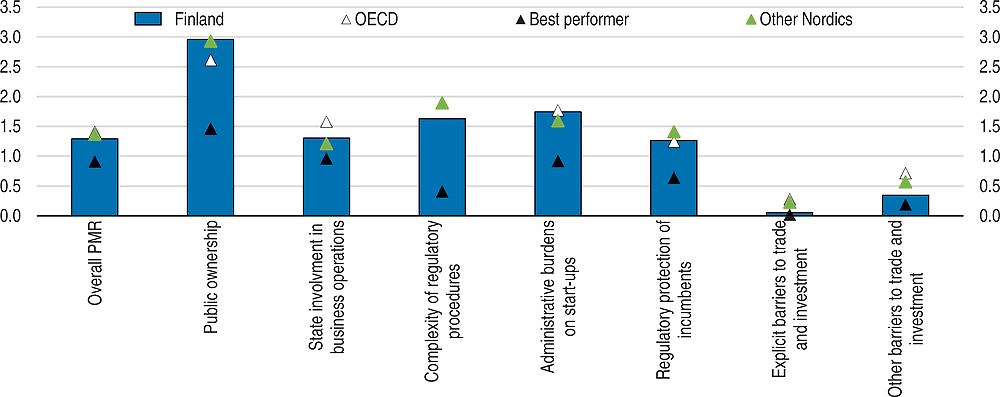
← 1. Index, scale of 0-6 from least to most restrictive.
Source: OECD, Product Market Regulation database.
Regulations are fairly stringent both in absolute and relative terms in the gas, post, rail and retail sectors (Figure 1.9, Panel A). In the gas sector, barriers to entry and vertical integration are high, there is no liberalised wholesale market and consumers have no choice of supplier. The electricity market is very competitive, leading to low prices, which are among the advantages attracting foreign companies to create big data centres in Finland. Postal services are dominated by a government-owned group, which has a universal service obligation, but private firms are allowed to compete in some segments of the market. State-ownership is also high in rail, where there is competition for freight but not for passengers yet, although the government is considering opening up. Entry in the freight market remains challenging, given the dominant position of the incumbent in the organisation of the railway system (Mäkitalo, 2011). Road accounts for 75% of total freight transport and market entry is relatively tightly regulated. Cabotage – transport inside a country by a foreign haulier – accounts for a much lower share of the market than in Denmark and Sweden (European Commission, 2013). Finland is one of the few remaining EU countries with a public majority stake in the national carrier, which may lower competition on some routes. Professional services are lightly regulated by OECD and European standards, and even compared to other Nordic countries.
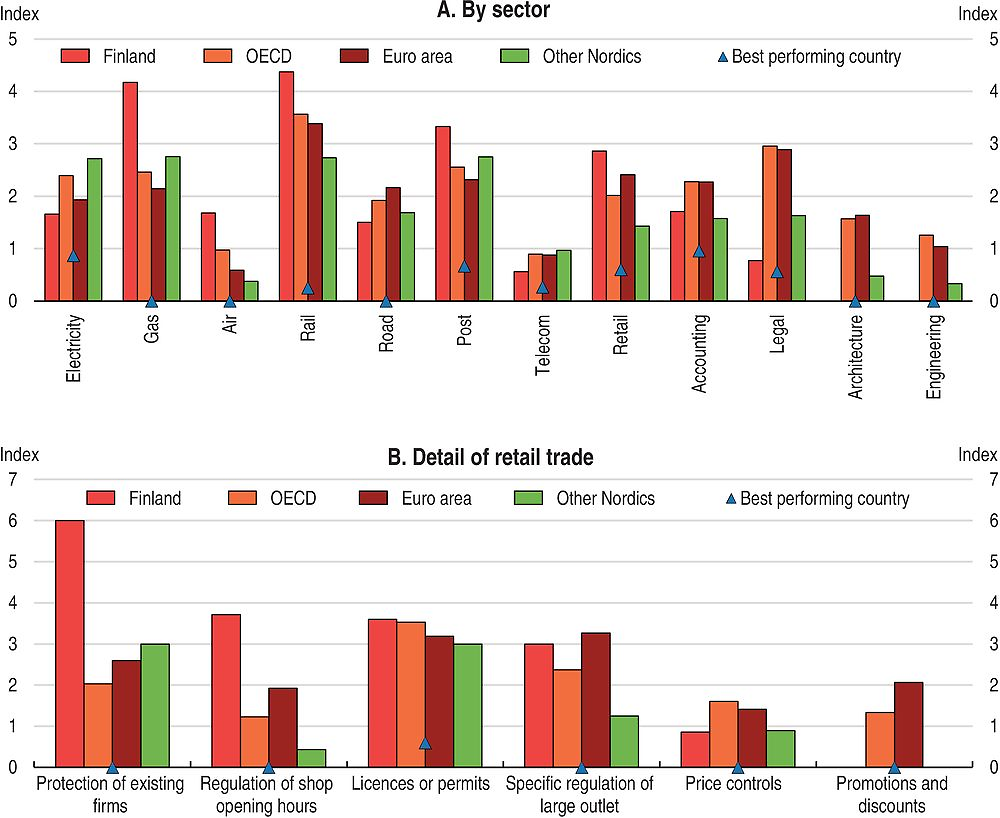
← 1. No bar corresponds to a value of zero.
Source: OECD, Product Market Regulation database.
An important area where stringent regulations hold back competition and productivity is retail trade, which is dominated by two groups. In particular, land-use planning regulations restrict the establishment of large-scale outlets. Although restrictions on developments on the fringes of cities may to some extent be justified by environmental concerns, the current legislation seems overly restrictive (OECD Economic Survey of Finland 2012). While a proposal to amend the land use and building act was submitted to parliament in late 2014, the Competition Authority estimated that it failed to effectively take into account competition objectives (European Commission, 2015a). According to the 2013 OECD PMR indicators, Finnish retail trade regulations are more stringent than the OECD, EU and Nordic averages on most dimensions, with only price and discount restrictions being low (Figure 1.9, Panel B). A few measures have been taken to increase retail competition. Shops’ opening hours were further liberalised in December 2015.
The government also aims at promoting competition in the construction industry. Indeed, competition may be hampered by concentration and market power of developers and construction firms, as well as by regulatory constraints. Furthermore, the construction product industry – e.g. concrete, paints – is more concentrated than the building industry. Prices lack transparency, as complex discount systems prevail. The market is dominated by a few firms and market entry is unattractive to foreign players because of the small size of the country and specific national standards (André and García, 2012).
Finland’s Service Trade Restrictiveness Index (STRI) scores are above the OECD average and those of other Nordic countries in several sectors (Figure 1.10). The comparison with the OECD’s best performers on these indicators suggests that there is room for lowering barriers further in a number of sectors, including transport and construction, which is consistent with the PMR indicators.
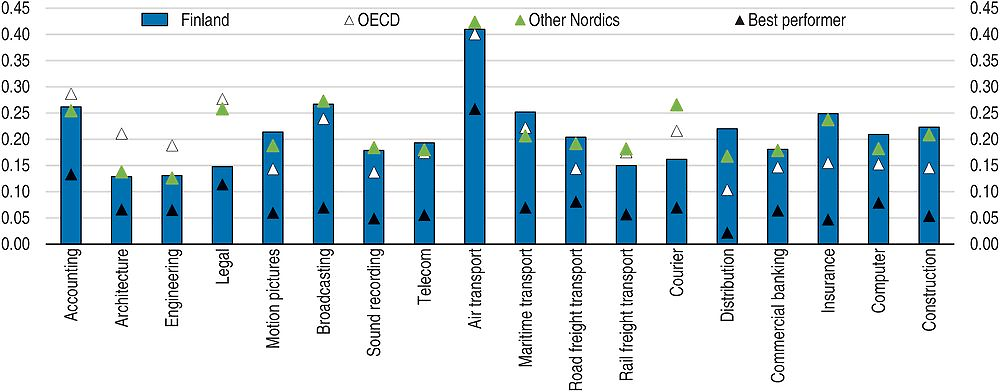
← 1. STRI indices take values from 0 to 1, where 0 is completely open and 1 completely closed.
Source: OECD, Service Trade Restrictiveness Index Regulatory database.
Making the tax structure more growth-friendly
The level of taxation in Finland is among the highest in the OECD High tax rates may be seen as harmful to doing business, as pointed out by more than a fifth of respondents in the World Economic Forum Global Competitiveness Survey 2015-16, but they also pay for highly developed public services and infrastructure. Some taxes create more distortions and hence affect growth more than others (Arnold et al., 2011). Hence a revenue-neutral modification of the tax structure can yield benefits in terms of growth. The distributional impact of such a modification also needs to be taken into account, as redistribution is a fundamental objective of the tax system.
Finland has already been moving in the direction of a more growth-friendly tax system in recent years. The corporate income tax rate was lowered from 26 to 20% in three steps between 2011 and 2014, with the aim of maintaining an attractive business environment. Corporate income taxes have been found to be most harmful for growth in OECD countries (Arnold et al., 2011). However, a “race to the bottom” in corporate taxation also raises concerns related to equity and reduced revenue. Although cuts in the corporate income tax rate were accompanied by base broadening and an increase in dividend taxation, associated revenues were much lower than the loss resulting from the rate cut (Economic Policy Council, 2015). International co-operation in this area is warranted and the OECD’s base erosion and profit shifting (BEPS) project is important in that respect. The share of indirect taxes in total taxation has increased, with hikes in both VAT and excise duties, including taxes on products that are harmful to the environment and health. Recurrent taxes on personal immovable property have increased, but remain relatively low.
Despite the recent reforms, the tax structure can be improved further. Reduced VAT rates on some categories of products increase the burden of compliance and reduce government revenue substantially. The VAT revenue ratio, which relates VAT revenues to the potential tax base, is around 55%, only slightly above the OECD average and well below that of Estonia or Switzerland (OECD, 2014a). Furthermore, the potential equity effects of reduced VAT rates could be achieved at a lower cost through measures targeted at low-income households. There are also many tax expenditures, which create complexity in the tax system, are often poorly targeted and risk being used to circumvent government spending limits. Hence there is a case for reducing tax expenditures. Also, taxation on labour remains high by OECD standards, which weakens work incentives for individuals and incentives to hire workers for employers (see Chapter 2). The government has announced a reduction in labour taxation, notably through an increase in the earned income deduction focusing on low and medium incomes, and coordination of tax and social security measures to remove inactivity traps. Excise duties and recurrent taxes on personal immovable property, which are less detrimental to growth, will increase. The deduction of mortgage interest rate payments from taxable personal income will be reduced further. Some reforms to taxation of entrepreneurship, ownership and investment are also planned (Prime Minister’s Office, 2015). This includes easing the inheritance tax, which would however entail revenue losses and increase inequality (Economic Policy Council, 2015).
Innovation and entrepreneurship are key to boosting productivity and competitiveness
Finland is an innovative country
According to the Innovation Union Scoreboard, which provides a multi-dimension comparative assessment of EU countries’ research and innovation performances, Finland is among the innovation leaders, along with Denmark, Germany and Sweden, even though its performance has declined somewhat since 2012 (European Commission, 2015b). Its main strengths relative to EU peers are in patent applications, international scientific co-publications and licence and patent revenues from abroad. Relative weaknesses are found in the number of non-EU doctoral students, non-R&D innovation expenditures and exports of medium and high-tech products and knowledge-intensive services. Knowledge-based capital – which includes software and databases, R&D and other intellectual property products and brand equity – firm-specific human capital, and organisational capital accounted for more than 40% of total business investment in Finland in 2013 (OECD, 2015c). In particular, both business and government R&D expenditures are among the highest in the OECD as a share of GDP, even though they have been reduced in recent years (Figure 1.11).
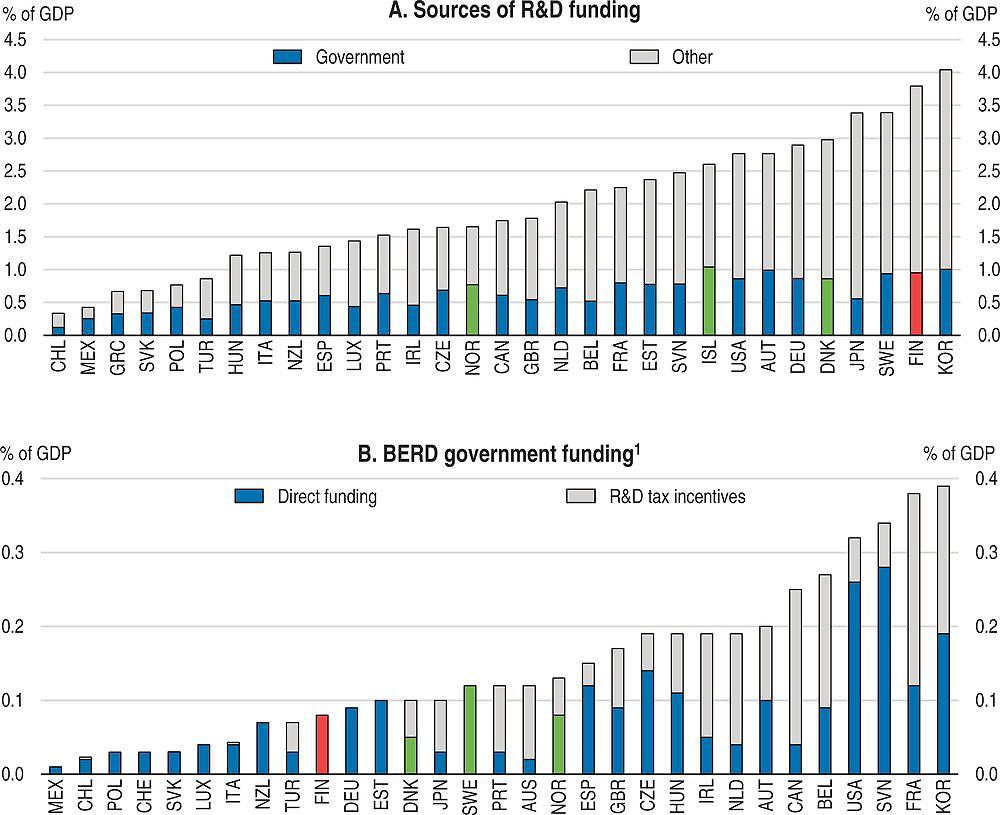
1. BERD refers to Business Enterprise Research and Development.
Source: OECD, Main Science and Technology Indicators database.
Business and government R&D spending is contracting
R&D expenditure has declined markedly in real terms since 2011, which contrasts with a pick-up in Germany, Sweden and the OECD as a whole (Figure 1.12, Panel A). This is a cause for concern in a knowledge-based economy. To a large extent, the contraction in R&D reflects the difficulties of the ICT sector, where R&D is highly concentrated. In Finland, as in Sweden, the computer, electronic and optical products sector has the largest sectoral share in business R&D, but while it accounted for less than a fourth of total R&D spending in 2007 in Sweden, it accounted for more than half in Finland. As a further comparison, the sector with the highest share in R&D in Germany (motor vehicles) accounts for about one third of business R&D. The low level of R&D and patents in non-ICT sectors is one of the main weaknesses of the Finnish innovation system, and is reflected in the inability of other industries to compensate the decline in ICT output.
Direct government R&D funding has declined by about 14% in real terms between 2010 and 2014 (Figure 1.12, Panel B). Further cuts are planned over the current parliamentary term. The overall budget for tertiary education will be cut by about 4% and the budget of the Finnish funding agency for technology and innovation (Tekes), which already shrank by about a quarter in real terms since 2010, will be reduced further by about a third (Prime Minister’s Office, 2015). Even though substantial efficiency gains could be realised by reorganising higher education and part of Tekes financing could be replaced by private funding, R&D outcomes are likely to be affected by the spending cuts, which may undermine Finland’s growth potential.
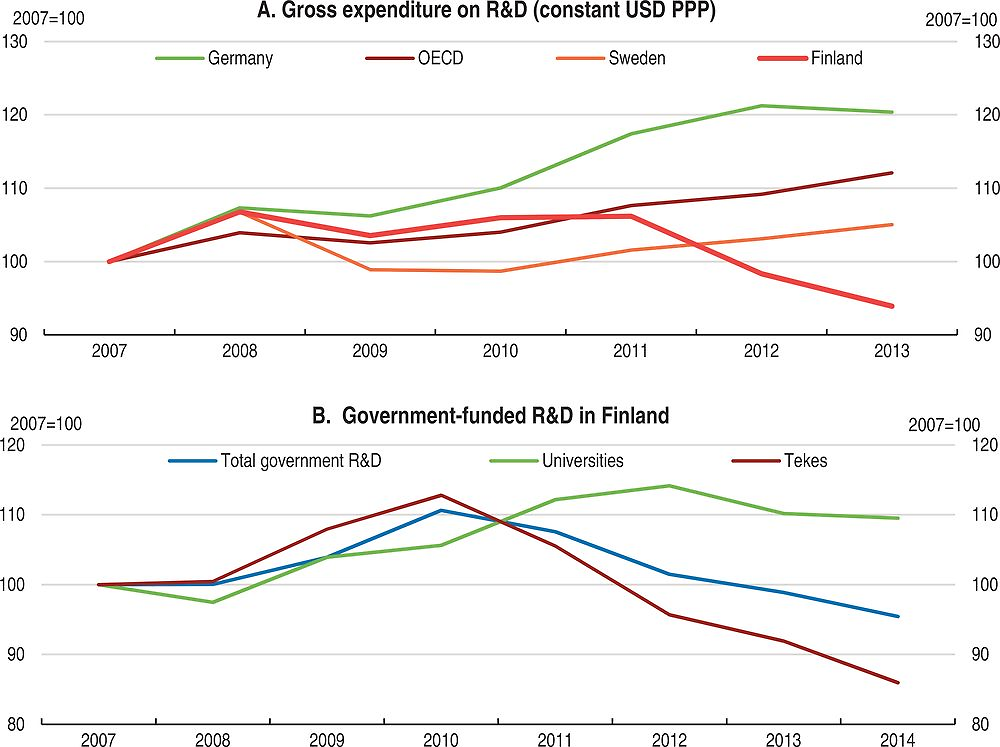
Source: OECD, Main Science and Technology Indicators database and Statistics Finland.
Young firms’ contribution to output and employment needs to increase
Economic renewal occurs both through the restructuring of old firms and through the emergence and growth of new companies. In OECD countries, young firms provide the main contribution to employment growth (Criscuolo et al., 2014). In Finland, start-up rates are among the lowest in the OECD, both before and during the downturn (Figure 1.13, Panel A). The share of young companies among small businesses is among the lowest in the OECD (Panel B). Furthermore, young firms’ growth has been fairly slow on average. Growing is a challenge for small firms in most OECD countries. Nevertheless, the contribution of young firms to job creation and employment growth in Finland from 2001 to 2011 has been among the lowest in the OECD (Figure 1.13, Panel C).
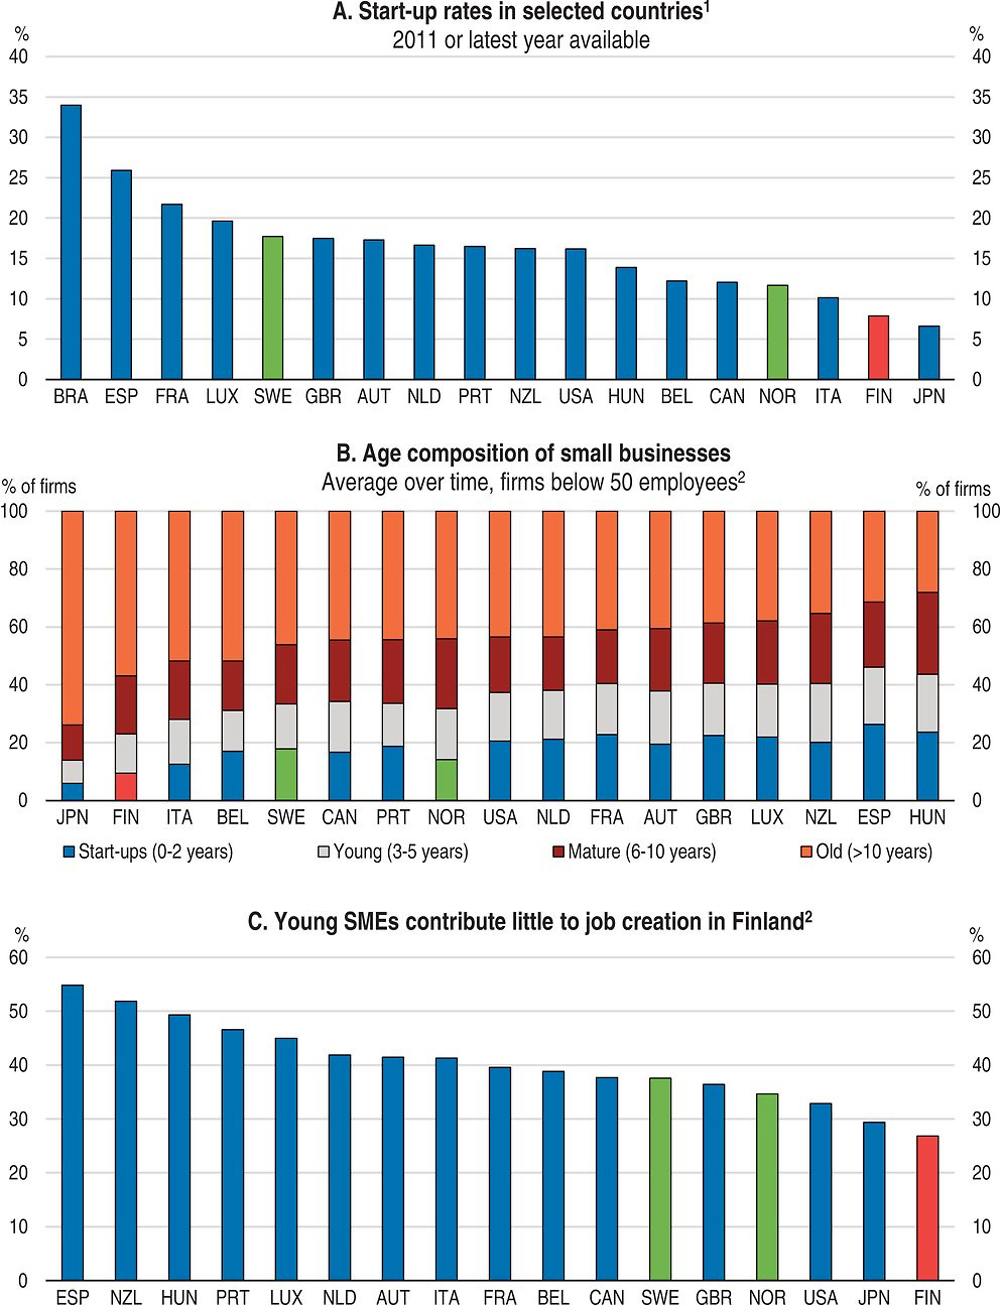
1. Fraction of start-ups among all firms.
2. 2001-11.
Source: Criscuolo, Gal and Menon (2014).
The relative weakness of entrepreneurship in Finland is puzzling in a country which has a strong history of innovation, relatively business-friendly regulations, low barriers to entry in most markets and strong government support for start-ups. While more than a third of Finnish adults believe they have the skills and knowledge needed to start a business and more than 40% perceive opportunities, only 9% intend to become entrepreneurs in the next three years (Global Entrepreneurship Monitor, 2014). Although the risk of failure is a concern for more than a third of respondents, this is close to the international average. Furthermore, the cost of bankruptcy legislation for entrepreneurs is among the lowest in the OECD (OECD, 2015a). The current weakness of the economy may deter would-be entrepreneurs. However, business creation was low even before the downturn.
Streamlining product market regulations and lowering service trade barriers, as outlined above, could enhance conditions for entrepreneurship. Loosening employment protection legislation (EPL) would encourage young firms to hire. As young firms face more uncertain prospects than established ones, they tend to be reluctant to hire if dismissing workers is difficult and costly. High-risk innovative sectors tend to be small in countries with high EPL (Bartelsman et al., 2011). In addition to its impact on entrepreneurship and risk taking, EPL’s wider effect on employment justifies loosening it (see Chapter 2).
Although streamlining regulations will facilitate entrepreneurship, more support will be needed to close the gap with the most dynamic OECD countries. In particular, internationalisation of SMEs should be encouraged further, the public sector needs to continue to support R&D and innovation, to encourage innovative solutions for funding new firms and to maintain high-quality infrastructure.
Public support to innovation is crucial
Finland’s government provides broad-based support for innovation, through education and basic research as well as through help for business innovators, including funding, counselling, network building and international promotion. Public support for innovation is necessary, as externalities generated by spill-overs from innovation investment raise the social rate of return above the private rate of return, leading to socially sub-optimal investment in the absence of government intervention (Westmore, 2013). Government support played a key role in the development of the ICT industry over the past decades. In other sectors, results appear mixed, although evaluating innovation policies is fraught with difficulties and requires a long time perspective. Nevertheless, encouraging innovation is essential to restore Finland’s competitiveness.
As shown above, government R&D spending is on a declining trend. Hence, enhancing efficiency, making good strategic choices, converting more research into business and societal outcomes, and attracting further private financing will be essential to foster innovation and revive economic growth. Higher education is currently fragmented, with many relatively inefficient small research units. Consolidation is necessary to create larger centres of excellence, with a higher profile which would favour integration in international research networks and help recruit high-level foreign researchers, whose net inflow is lower than in most other Nordics (OECD, 2013b). Collaboration on innovation of both large firms and SMEs with higher education or research institutions is among the strongest in the OECD (OECD, 2015c). This can contribute to diffusing knowledge, promoting innovation and fostering entrepreneurship and should be encouraged further. The percentage of higher-education R&D financed by industry is higher than in other Nordic countries, but substantially lower than in Germany, Korea and Switzerland (Figure 1.14). Co-operation with the business sector could be encouraged, for example, through the funding criteria for higher-education institutions or through R&D vouchers (Research and Innovation Policy Council, 2014).
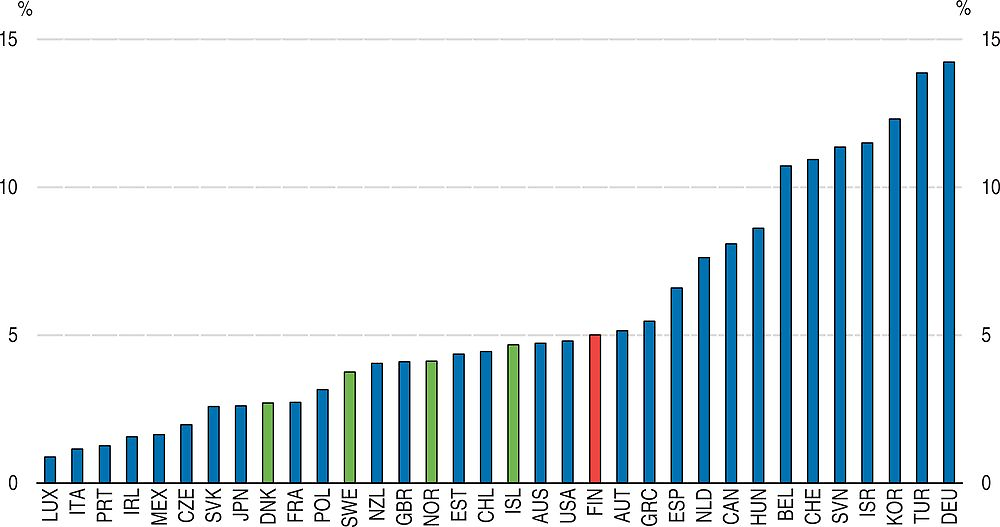
Source: OECD, Main Science and Technology Indicators database.
Innovation policy should focus on the areas generating the strongest externalities, in particular education and basic R&D. It needs to build on the strengths of the innovation system and the Finnish economy and society. The innovation policy framework has evolved over the years from an essentially technological orientation to a broader approach to innovation, encompassing service and organisational innovations and focussing on overarching objectives such as improving competitiveness, well-being and the quality of the environment (Hyytinen et al., 2012). The Research and Innovation Council, chaired by the Prime Minister, plays a key role, as it sets strategic objectives and ensures coordination between the institutions involved in science and technology policy. It is also engaging in the evaluation of policies. Support for business innovation is provided through direct funding, whereas most OECD countries use a mix of direct funding and R&D tax incentives. Both types of support have been found to have a positive effect on innovation in OECD countries (Westmore, 2013). The design of support schemes is most important for their effectiveness and efficiency. Potential pitfalls include high deadweight costs, distorting resource allocation and competition, and “picking winners”.
Tekes is the main provider of government loans and grants for innovation, although a number of other agencies are active in this area. Although international comparisons are difficult because the mandates of innovation agencies vary across countries, Tekes has resources more in line with those of the Austrian and Dutch innovation agencies than with that of its Swedish counterpart Vinnova in absolute terms. The agency is widely credited for fostering innovation through funding, network building and counselling of companies. It has participated in the financing of over half of commonly known innovations in Finland between 2000 and 2013. Young companies funded by Tekes have on average grown faster and created more jobs than others. Spill-over effects, notably through the diffusion of knowledge and enhanced co-operation between universities, big companies and SMEs, are also important (Tekes, 2015). Furthermore, there is evidence that Tekes programmes have contributed to improving well-being and the environment (Valovirta et al., 2014).
While these achievements do not seem to have come with significant negative side effects, the evidence on the efficiency of public funding for innovation is mixed. An evaluation of Tekes commissioned by the Ministry of Employment and the Economy to international evaluating teams concluded that interventions did not lead to an inefficient allocation of resources or distortions of competition (Van der Veen et al., 2012). Some studies suggest that public subsidies tend to delay the exit of non-performing firms from the market, which would hamper the reallocation of resources and productivity growth (Koski et al., 2013; Koski and Pajarinen, 2015). But others find that subsidies have no significant effect on the closure of firms (Ebersberger, 2011). Administrative costs are moderate (Van der Veen et al., 2012). It is more difficult to assess whether specific innovations would have occurred without support from Tekes, although many participants report that projects would not have taken place without Tekes funding (Tekes, 2015). Some public support programmes seem to have crowded in private funding for R&D (Einiö, 2009). However, there is also evidence that large firms are more likely to apply for support than smaller ones and that many companies tend to benefit from public support programmes for extended periods (Koski and Tuuli, 2010). Karhunen (2015) finds no significant effect of R&D subsidies on the labour productivity of Finnish SMEs over the five-year period after a subsidy is granted. This may suggest some inefficiencies and deadweight costs.
Given the cuts planned in Tekes’ budget, the ability to find alternative sources of funding will be critical for Finnish innovation, even though a government one-off package of e1.6 billion to fund key projects in 2016-18 will contribute to encourage innovation, in particular through investments in clean technologies, digitalisation and health. Digitalisation is transforming large parts of the economy and is an area where Finland has comparative advantages (Figure 1.15). Finland also scores high on eco-innovation (Katre Eljas-Taal et al., 2013). Cleantech solutions are widely applied, even though growth failed to meet expectations over recent years, partly because of the general weakness of the economy. For example, Finnish firms are world leaders in renewable fuels and liquefied natural gas propelled ships. The renewal of the pulp and paper industry also involves green innovations. Finland has experienced some success in health technologies. Beyond business opportunities, innovations in this field are important to foster well-being in an ageing society.
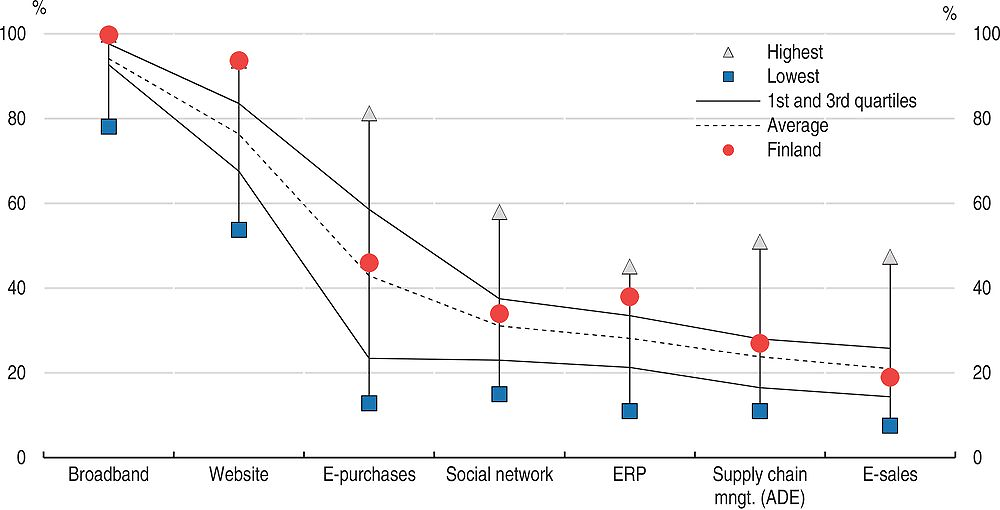
Note: ERP refers to the use of Enterprise Resource Planning software in business processes. ADE refers to the use of automated data exchange applications.
Source: OECD (2014), Measuring the Digital Economy: A New Perspective.
Public procurement can also be used to encourage innovation. Fostering demand for innovative products is an important dimension of innovation policy, as uncertainty about demand may deter firms from developing some innovations and investors from funding them. Public procurement amounts to nearly a fifth of GDP (OECD, 2015d). Hence, using just a fraction of it to promote innovation can make a difference. The government has set an objective of 5% of innovative public procurement (Prime Minister’s Office, 2015). Finland has been encouraging environmental sustainability in public procurement since 2009 (Ministry of the Environment, 2009). In addition, many municipalities have engaged in innovative procurement, especially in construction, social and health care services and energy and water supply, in some cases supported by funding from Tekes’ Smart procurement programme. Nevertheless, there may be room for more innovative procurement. This is particularly the case in sectors where public procurement represents a substantial share of the market, like health care, education, transport or construction. Getting value for money requires a competitive tendering process and fostering innovation calls for a focus on the functionalities of procured items rather than on technical specifications. Importantly, effective procurement requires expertise on the part of the purchaser and evaluating the outcomes of innovative procurement is often complex. In Finland, local authorities are responsible for a large share of public procurement and may have difficulties in building up the required expertise. This difficulty may be overcome through exchange of information across government authorities, standardisation of procurement procedures or centralisation of procurement (OECD, 2014b).
New solutions for funding innovation and young firms should be encouraged
Although credit standards for SMEs have been tightened somewhat, access to finance has remained relatively easy compared to most other European countries since the 2008 financial crisis (OECD, 2015e). Furthermore, innovative firms can benefit from substantial public funding. However, as the latter is being scaled back, other funding sources will need to be found. The government has committed to raising additional capital for business financing, based on market needs. New forms of SME and entrepreneurship finance are emerging globally, including asset-based lending, alternative forms of debt, crowdfunding and hybrid instruments. Such instruments are often better suited than traditional bank lending to innovative and fast-growing companies and could contribute to financing innovation in Finland. The conditions for the expansion of alternative financial instruments, in particular in terms of regulatory framework, should be explored, paying attention to striking a balance between financial stability, investor protection and the opening of new financing channels for SMEs (OECD, 2015f).
Key recommendations
-
Streamline regulations in retail trade, transport and construction.
-
Reduce taxes on labour to improve work incentives, and raise recurrent taxes on personal immovable property and indirect taxes.
-
Reduce the number of products subject to reduced VAT rates.
-
Use funding criteria for higher-education institutions or R&D vouchers, to reinforce co-operation between companies, particularly start-ups, and universities.
Other recommendations
-
Ensure that the financial regulatory framework supports the development of new forms of financing for innovative and fast-growing companies, while guaranteeing financial stability and investor protection.
-
Design public procurement in a way that also encourages innovation.
Bibliography
André, C. and C. García (2012), “Housing Price and Investment Dynamics in Finland”, OECD Economics Department Working Papers, No. 962, OECD Publishing, Paris, https://doi.org/10.1787/5k98rwldjr44-en.
Arnold, J., B. Brys, C. Heady, Å. Johansson, C. Schwellnus and L. Vartia (2011), “Tax Policy for Economic Recovery and Growth”, Economic Journal, Vol. 121, No. 550.
Bank of Finland (2015), Bank of Finland Bulletin 3/2015, Helsinki.
Bartelsman, E.J., P.A. Gautier and J. de Wind (2011), “Employment Protection, Technology Choice, and Worker Allocation”, De Nederlandsche Bank Working Paper, No. 295, Amsterdam.
Criscuolo, C., P. N. Gal and C. Menon (2014), “The Dynamics of Employment Growth: New Evidence from 18 Countries”, OECD Science, Technology and Industry Policy Papers, No. 14, OECD Publishing, Paris, https://doi.org/10.1787/5jz417hj6hg6-en.
Ebersberger, B. (2011), “Public Funding for Innovation and the Exit of Firms”, Journal of Evolutionary Economics, 21: 519-543.
Economic Policy Council (2015), Economic Policy Council Report 2014, Helsinki.
Einiö, E. (2009), “The Effect of Government Subsidies on Private R&D: Evidence from Geographic Variation in Support Program Funding”, Helsinki Center of Economic Research, Discussion Paper No. 263, Helsinki.
Eljas-Taal, K., J. Stasiukaitytė and E. Rootalu (2013), “Eco-innovation in Finland”, EIO Country Profile 2013, Eco-Innovation Observatory, Brussels.
European Commission (2013), “Market Functioning in Network Industries, Electronic Communications, Energy and Transport”, European Economy Occasional Papers, No. 129, Brussels.
European Commission (2015a), “Macroeconomic imbalances, Country Report, Finland 2015”, Occasional Papers No. 225, Brussels.
European Commission (2015b), Innovation Union Scoreboard 2015, Brussels.
Global Entrepreneurship Monitor (2014), Country profiles: Finland, Global Entrepreneurship Research Association, London Business School, London.
Hyytinen, K., S. Kivisaari, O. Lehtoranta, M. Toivanen, T. Loikkanen, T. Lyytinen, J. Oksanen, N. Rilla and R. van der Have (2012), “Funder, Activator, Networker, Investor… Exploring Roles of Tekes in Fuelling Finnish Innovation”, Tekes Review, 289/2012.
Hyytinen, A. and M. Maliranta (2013), “Firm Lifecycles and Evolution of Industry Productivity”, Research Policy, 42, 1080-98.
Jääskeläinen, A. and A. Lönnqvist (2011), “Public Service Productivity: How to Capture Outputs?”, International Journal of Public Sector Management, Vol. 24, Issue 4.
Karhunen, H. (2015), Economic Studies on Higher Education and Productivity, University of Jyväskylä.
Koske, I., I. Wanner, R. Bitetti and O. Barbiero (2015), “The 2013 Update of the OECD’s Database on Product Market Regulation: Policy Insights for OECD and Non-OECD Countries”, OECD Economics Department Working Papers, No. 1200, OECD Publishing, Paris, https://doi.org/10.1787/5js3f5d3n2vl-en.
Koski, H., M. Maliranta, N. Määttänen and M. Pajarinen (2013), “Toimialojen tuottavuuden kasvu, sen yritystason mekanismit ja yritystuet” (“Productivity Growth of Industries, its Firm Level Mechanisms and Business Subsidies”, Publications of the Ministry of Employment and the Economy, Competitivity, No. 14/2013, Helsinki (in Finnish).
Koski, H. and M. Pajarinen (2015), “Subsidies, the Shadow of Death and Labor Productivity”, Journal of Industry, Competition and Trade, Vol. 15, Issue 2.
Koski, H. and J. Tuuli (2010), “Business Subsidies in Finland: The Dynamics of Application and Acceptance Stages”, ETLA, The Research Institute of the Finnish Economy, Discussion papers, No. 1225, Helsinki.
Kröger, T. (2011), “Retuning the Nordic Welfare Municipality – Central Regulation of Social Care Under Change in Finland”, International Journal of Sociology and Social Policy, Vol. 31, No. 3/4.
Mäkitalo, M. (2011), “Why Do Open Rail Freight Markets Fail to Attract Competition? Analysis on Finnish Transport Policy”, European Journal of Transport and Infrastructure Research, Vol. 11, Issue 1.
Maliranta, M., P. Rouvinen and P. Ylä-Anttila (2010), “Finland’s Path to the Global Productivity Frontier Through Creative Destruction”, International Productivity Monitor, 20(10), 68-84.
Ministry of Employment and the Economy (2015), Service Economy Revolution and Digitalisation, Finland’s Growth Potential, Publications of the Ministry of Employment and the Economy, Innovation, No. 41/2015, Helsinki.
Ministry of the Environment (2009), Sustainable Public Procurement, Public Sector Becomes a Pioneer in Sustainable Procurement, Helsinki.
OECD (2013b), “Researchers on the move”, in OECD Science, Technology and Industry Scoreboard 2013: Innovation for Growth, www.oecd.org/sti/researchers-on-the-move-the-impact-of-brain-circulation.pdf
OECD (2014a), Consumption Tax Trends 2014, OECD Publishing, Paris, https://doi.org/10.1787/ctt-2014-en.
OECD (2014b), “Intelligent Demand: Policy Rationale, Design and Potential Benefits”, OECD Science, Technology and Industry Policy Papers, No. 13, OECD Publishing, Paris, https://doi.org/10.1787/5jz8p4rk3944-en.
OECD (2015a), The Future of Productivity, OECD Publishing, Paris, https://doi.org/10.1787/9789264248533-en.
OECD (2015b), OECD Economic Surveys: Sweden 2015, OECD Publishing, Paris, https://doi.org/10.1787/eco_surveys-swe-2015-en.
OECD (2015c), OECD Science, Technology and Industry Scoreboard 2015, OECD Publishing, Paris, https://doi.org/10.1787/sti_scoreboard-2015-en.
OECD (2015d), Government at a Glance 2015, OECD Publishing, Paris, https://doi.org/10.1787/gov_glance-2015-en.
OECD (2015e), Financing SMEs and Entrepreneurs 2015: An OECD Scoreboard, OECD Publishing, Paris, https://doi.org/10.1787/fin_sme_ent-2015-en.
OECD (2015f), New Approaches to SME and Entrepreneurship Finance: Broadening the Range of Instruments, OECD Publishing, Paris, https://doi.org/10.1787/9789264240957-en.
OECD (2015g), OECD broadband statistics update, 23 July 2015. http://www.oecd.org/sti/broadband/broadband-statistics-update.htm
Prime Minister’s Office (2014), “Team Finland: Strategy Update 2015”, Prime Minister’s Office Publications, No. 7/2014, Helsinki.
Prime Minister’s Office (2015), Finland, a Land of Solutions, Strategic Programme of Prime Minister Juha Sipilä’s Government, Government Publications 12/2015, Helsinki.
Spiezia, V. (2012), “ICT Investments and Productivity: Measuring the Contribution of ICTS to Growth”, OECD Journal: Economic Studies, Vol. 2012/1. https://doi.org/10.1787/eco_studies-v2012-1-en.
Tekes (2015), “The impact of Tekes and innovation activities 2015”, The Finnish Funding Agency for Innovation, Helsinki.
Valkonen, T. and V. Vihriälä (eds.) (2014), The Nordic Model – Challenged But Capable of Reform, Nordic Council of Ministers, Copenhagen.
Valovirta, V., J. Lehenkari, O. Lehtoranta, T. Loikkanen, A. Suominen, H. Bodewes, B. Mostert, S. Zegel and G. van der Veen (2014), “The Impact of Tekes Activities on Wellbeing and Environment, A study by Technopolis B.V., VTT and Statistics Finland”, Tekes Review, No. 308/2014.
Van der Veen, G., E. Arnold, P. Boekholt, J. Deuten, A. Horvath, P. Stern and J. Stroyan (2012), Evaluation of Tekes, Final Report, Publications of the Ministry of Employment and the Economy, No. 22/2012, Helsinki.
Westmore, B. (2013), “R&D, Patenting and Growth: The Role of Public Policy”, OECD Economics Department Working Papers, No. 1047, OECD Publishing, Paris, https://doi.org/10.1787/5k46h2rfb4f3-en.