Assessment and recommendations1
Challenges facing Europe
Europe has made important progress in harnessing and reinforcing its policies and institutions to recover from a double-dip recession and improve crisis management. Very supportive monetary policy has helped growth to pick up gradually over the past three years (Figure 1, Panel A), and contributed to reduce tensions in sovereign debt markets (Figure 1, Panel B). The effect of fiscal policy on demand has turned broadly neutral. Important building blocks of banking union, on both supervision and resolution fronts, have come into operation, improving the resilience of the European financial system. Confidence in the European project has recovered from its lows in 2013, although it is still well below what it was before the crisis (Figure 2).
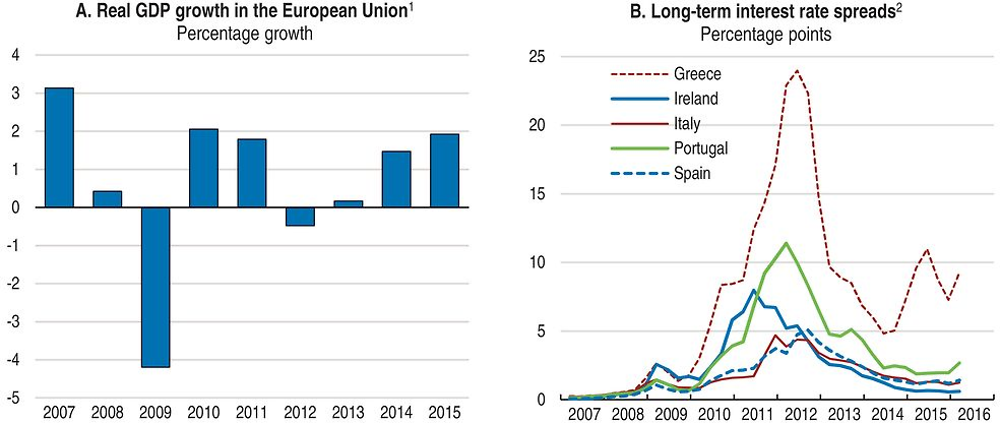
1. European Union member countries that are also members of the OECD (21 countries).
2. Ten-year government bond spreads relative to the German rate.
Source: OECD (2016), OECD Economic Outlook: Statistics and Projections and Main Economic Indicators (databases).
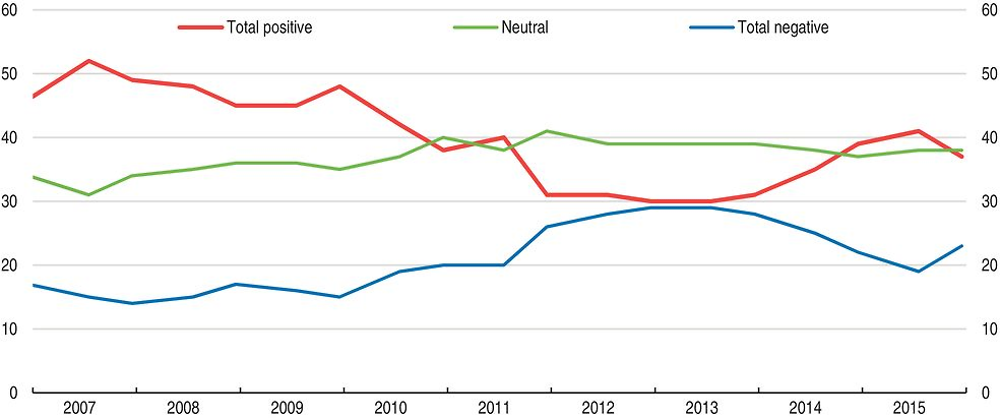
← 1. “In general, does the EU conjure up for you a very positive, fairly positive, neutral, fairly negative or very negative image?”
Source: European Commission, “Public Opinion in the European Union”, Standard Eurobarometer, various editions.
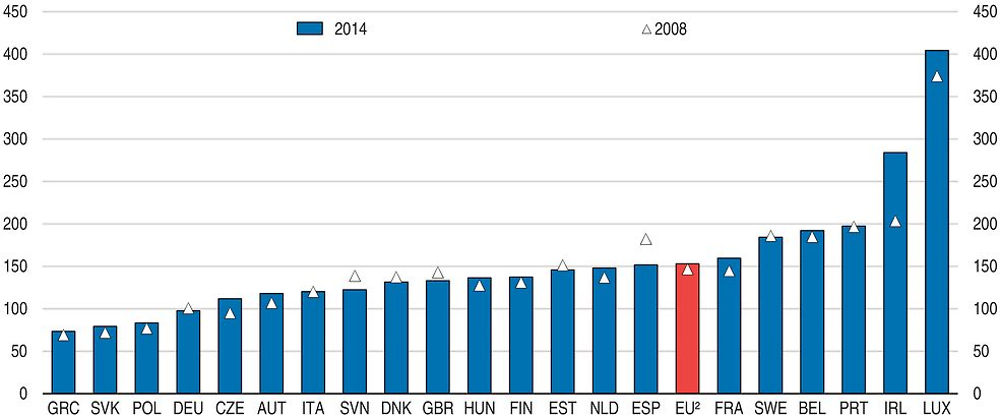
However, many legacies of the crisis are still unresolved, and major new problems have emerged. Unemployment is still high in many countries, and there is a wide dispersion across the euro area (Figure 3). Unlike in the United States, investment is still far below 2007 levels, especially in those countries hit hardest by the crisis (Figure 4), mainly due to weak demand but also to high non-performing loans and, in many countries, high corporate indebtedness, which hamper credit (OECD, 2015a). Political tensions have flared up recently due to large inflows of refugees, and have put some strains on border-free travel within the Schengen zone. The reintroduction of border controls in some Schengen zone countries is a setback for European integration.
1. European Union 28 countries.
2. Unweighted average.
Source: Eurostat (2016), “Employment and unemployment (LFS)”, Eurostat Database.
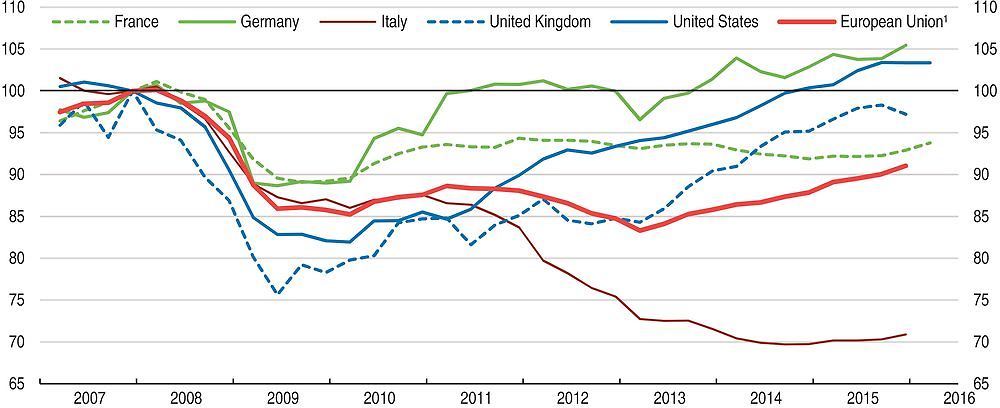
1. European Union member countries that are also members of the OECD (21 countries).
Source: OECD (2016), OECD Economic Outlook: Statistics and Projections (database).
These challenges weigh on economic performance and, more broadly, on the quality of life of European citizens. Well-being in the European Union often displays large disparities across countries (Figure 5). These tend to be most acute in income, labour market outcomes and subjective well-being, all of which were deeply affected by the crisis. Furthermore, some countries often find themselves among the best or the worst performers in most dimensions of well-being (Figure 5). Improving well-being requires stronger and more even growth and job creation across the euro area, but also reforms in specific policy areas, such as education and health, where the composition and efficiency of public spending plays a crucial role.
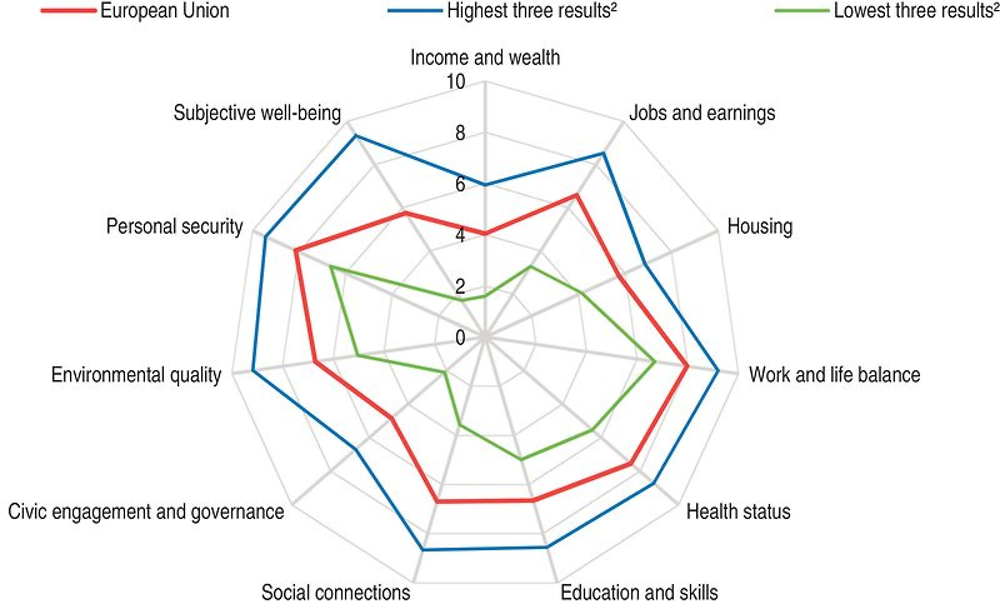
← 1. European Union member countries that are also members of the OECD (21 countries). Each well-being dimension is measured by one to three indicators from the OECD Better Life indicator set. Normalised indicators are averaged with equal weights. Indicators are normalised to range between 10 (best) and 0 according to the following formula: ([indicator value – worst value]/[best value – worst value]) x 10.
2. Calculated as a simple average of the highest and lowest performers of the European Union cross-country distribution.
Source: OECD Better Life Index, www.oecdbetterlifeindex.org.
Building a better future calls for stronger collective action on several fronts. Despite recent progress, banking union remains incomplete, which hampers monetary policy transmission and capital market integration, and the resulting mutual dependence of national governments and national banks poses vulnerabilities during a crisis. Joint action is also needed to protect external borders and share the financial burden of the refugee inflow. Public investment remains depressed, due to strong and lopsided fiscal consolidations in the recent past, which have fallen heavily on capital spending, and insufficient consideration of cross-country spillovers. Business investment is further hampered by the high levels of corporate debt overhang, by remaining weaknesses in some national banking systems and by scant progress in goods and services markets integration after the crisis, not least through the persistence of high regulatory heterogeneity.
In this context, the 2016 OECD Economic Survey of the euro area mainly focusses on fiscal and financial challenges, and the 2016 OECD Economic Survey of the European Union on structural reform priorities to complete the Single Market. The main messages of this Survey are:
-
To deal with the problems they face, the member governments need to harness EU institutions to develop and implement collective and cooperative solutions.
-
The European Union economy is gradually recovering, but investment remains weak and the wide disparity in economic performance and well-being is still a major concern.
-
The refugee crisis poses an immediate challenge that must be dealt with collectively, based on burden sharing.
-
Completing the Single Market is the best way forward to raise the well-being of Europeans in the years ahead.
Fostering recovery and rebalancing
Growth has gathered pace since mid-2014, supported by monetary expansion and exchange rate depreciation in some countries (Figure 6). The sharp fall in global oil prices has raised household incomes and the fiscal policy is no longer weighing on domestic demand. Exports have grown robustly for several quarters, reflecting the euro depreciation and stronger activity in major markets, such as the United States. More recently, a stronger euro and the slowdown in emerging markets has weighed on export growth in the European Union, while sterling depreciation probably helped support net exports in the United Kingdom. Business investment has disappointed, largely due to weak growth expectations and possibly, in some countries, credit constraints.
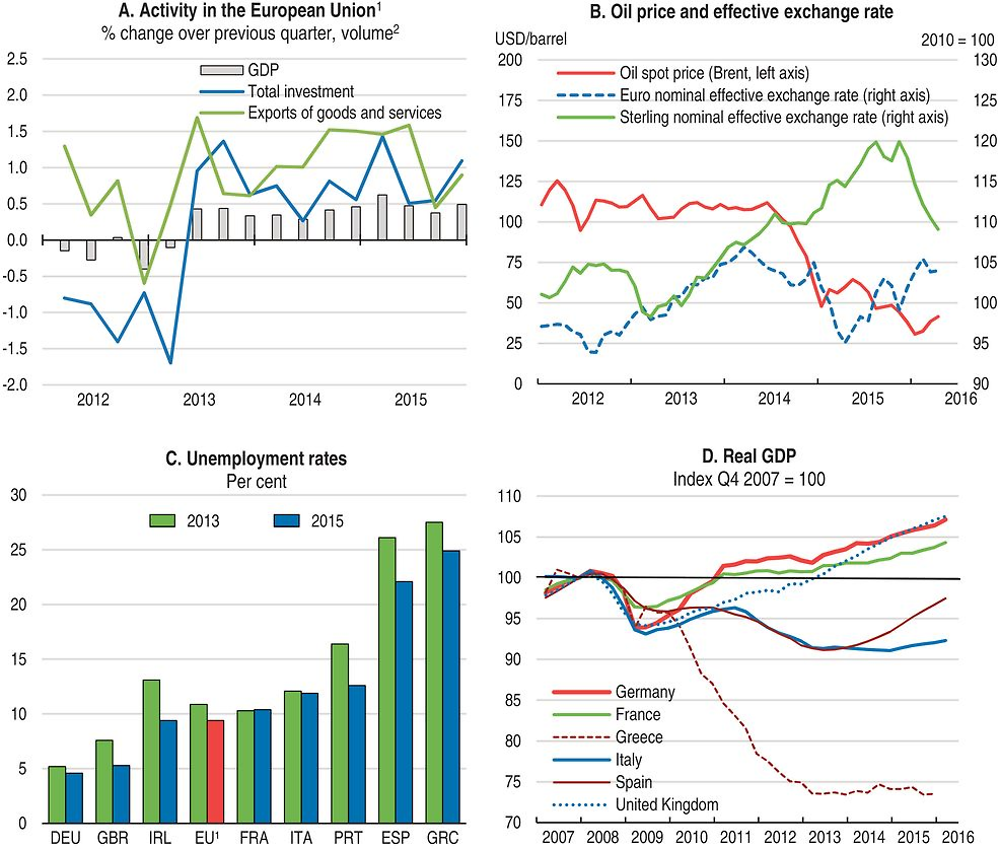
1. European Union member countries that are also members of the OECD (21 countries).
2. Economic Outlook No. 99.
Source: OECD (2016), OECD Economic Outlook: Statistics and Projections and Main Economic Indicators (databases); and Eurostat (2016), “Employment and unemployment (LFS)”, Eurostat Database.
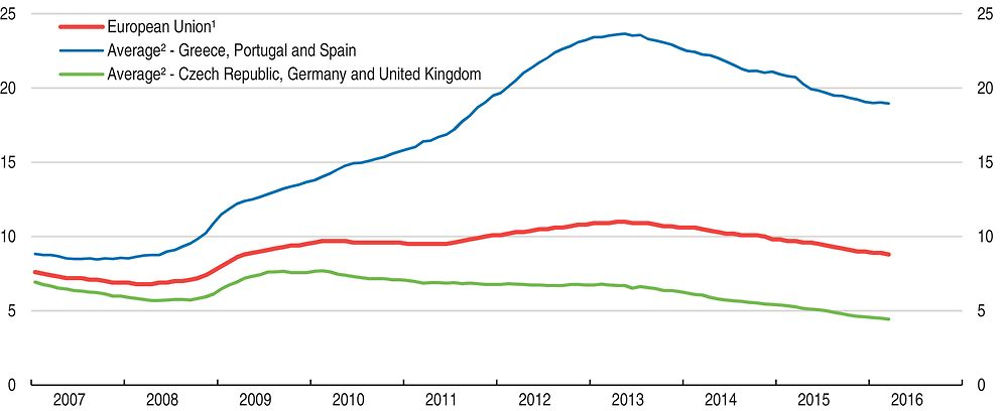
Economic performance has been uneven from country to country. The sovereign debt crisis and the associated large fiscal and macroeconomic adjustment efforts by the countries hit hardest (e.g. Greece, Ireland, Italy, Portugal and Spain) led to very divergent output and unemployment developments across the European Union. This divergence has been modestly reversed over the past two years, with some of those countries recording above-average growth. Despite narrowing interest rate differentials and significant reductions in lending rates, credit and investment in most of those countries has remained hampered by high non-performing loans and corporate debt (Figure 7), and incomplete capital market integration. Non-euro area EU countries, like the United Kingdom and Sweden, on the other hand, have enjoyed a more accommodative monetary policy and more benign financial environment, owing mostly to the significant progress made in cleaning up banks’ balance sheets.
← 1. Debt is calculated as the sum of the following liability categories, whenever available/applicable: special drawing rights; currency and deposits; debt securities; loans; insurance, pension, and standardised guarantees; and other accounts payable.
2. Unweighted average of data for European Union member countries that are also members of the OECD (21 countries).
Source: OECD (2016), “Financial Dashboard”, OECD National Accounts Statistics (database).
External positions are rebalancing, but the process has been asymmetric and incomplete. Germany and the Netherlands have further increased their already significant surpluses. The countries hit hardest by global financial and euro-area crises have all eliminated significant current account deficits, although, in spite of structural improvement, this also reflects still weak domestic demand and, therefore, imports (Figure 8). The same countries also improved cost competitiveness (Figure 9), in the context of substantial output losses. Apart from Greece and Italy, export performance has improved as well. However, a number of these countries continue to display poor net international investment positions, and improving them will require sustained GDP growth and current account surpluses in the medium and long run. Stronger wage and internal demand growth in surplus countries will ease further rebalancing and make it more symmetric, not least by reversing the persistent decline in their relative unit labour costs (Figure 9).
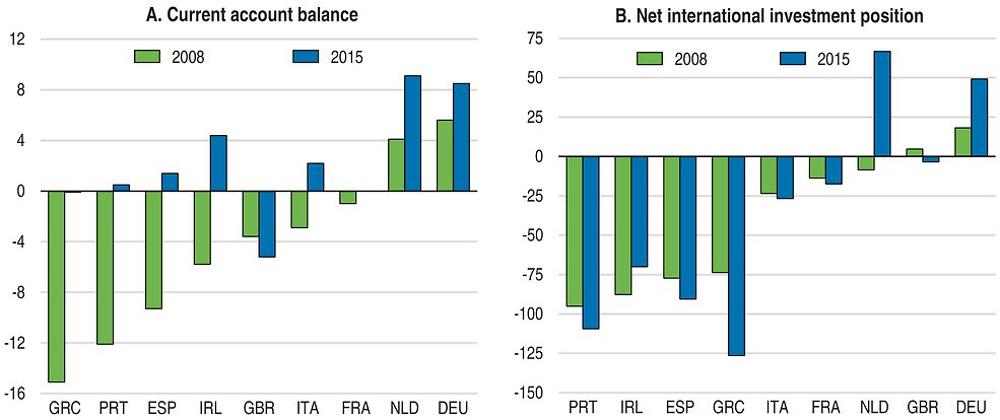
Source: Eurostat (2016), “Balance of payments statistics and international investment positions (BPM6)”, Eurostat Database.
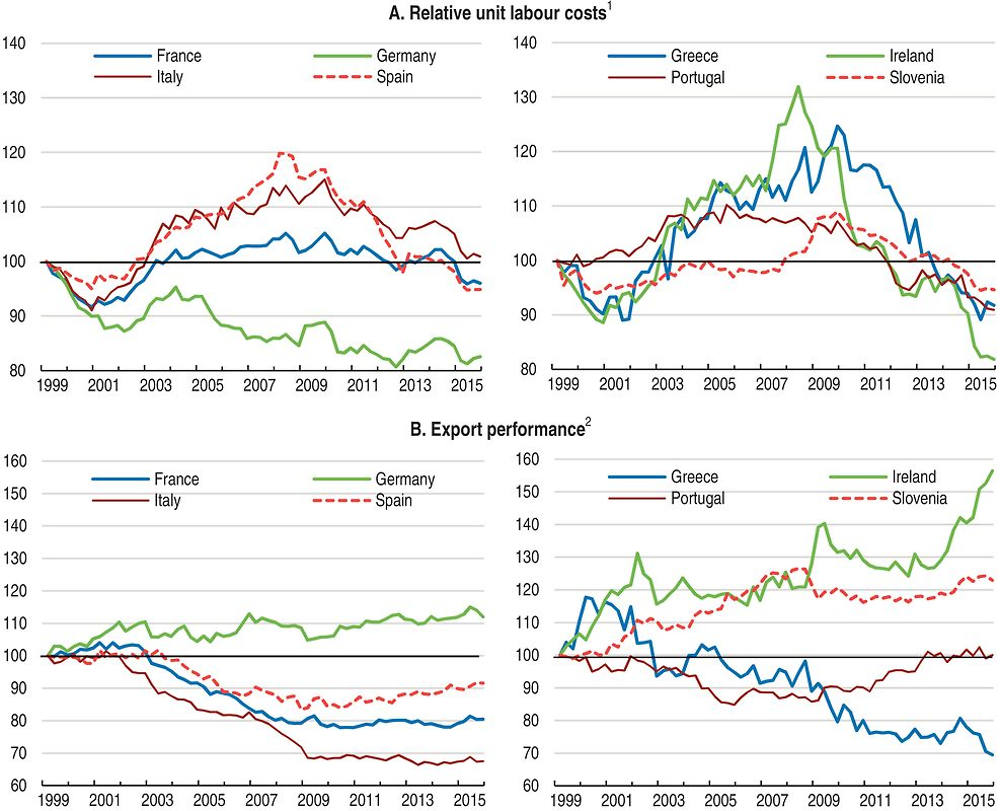
1. Real harmonised competitiveness indicator for unit labour costs in total economy.
2. Ratio between export volumes and export markets for total goods and services.
Source: OECD (2016), OECD Economic Outlook: Statistics and Projections (database) and ECB (2016), Statistical Data Warehouse, European Central Bank.
Labour market developments have also varied markedly across countries. As EU-wide unemployment started to increase in 2008, so did its dispersion across euro area countries, which has only fallen slightly recently (Figure 3). Moreover, especially in the countries hit hardest by the crisis, estimates of structural unemployment have risen (Ollivaud and Turner, 2014) and the labour force has fallen as workers have become discouraged and, in some countries, have emigrated in search of better job opportunities (OECD, 2015b). Conversely, Germany has benefited from lower unemployment and an increased labour force. Unsurprisingly, poverty has tended to increase more in those countries with large hikes in joblessness (Figure 10). Furthermore, recent consolidation efforts in the countries most affected by the crisis have often included deep cuts to unemployment benefits (Gonçalves and Pina, 2016), which have likely worsened distributional impacts.
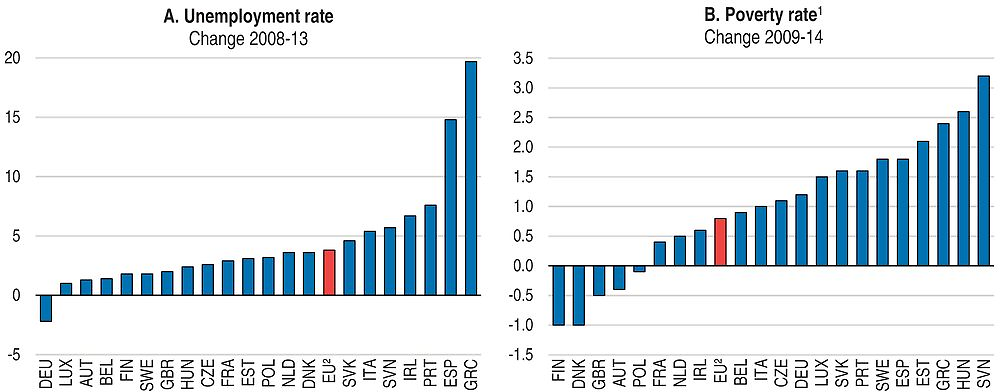
1. The poverty rate is the share of persons with disposable income (equivalised for family size) below 60% of national median disposable income.
2. European Union 28 countries excluding Croatia.
Source: Eurostat (2016), “Income distribution and monetary poverty” and “Unemployment and employment (LFS)”, Eurostat Database.
Gross domestic product (GDP) growth in the European Union is projected to accelerate modestly to close to 2%, despite a slowdown in several emerging markets (Table 1). Activity will continue to be supported by sustained monetary stimulus, a broadly neutral fiscal stance and lower oil prices. However, high private indebtedness will remain a drag on consumption and investment in many countries, and falling demand from emerging economies will weigh on exports. Unemployment will decline only gradually, and the stark differences across countries will persist. Inflation should edge up to about 1% by 2017 as the effects of cheaper energy wane and cyclical slack gradually decreases.
A stronger-than-projected slowdown in China and other emerging market economies would weaken demand in the euro area through several channels. Impacts through trade linkages alone would likely be small (about 0.1% of GDP per percentage point fall in Chinese domestic demand), as even the whole of Asia accounts for less than 15% of EU goods exports. However, repercussions on EU’s GDP could increase by a factor of three if the demand slowdown in China led to adjustments in global financial markets, such as higher risk premia (OECD, 2015c). While tail risks of financial stress have receded, the outcome of the upcoming referendum in the United Kingdom could have important implications for economic performance in both the United Kingdom and the rest of Europe (Kierzenkowski et al., 2016). The refugee crisis is already straining the Schengen agreement and might even affect the free flow of goods and, especially, labour in Europe. This would to some extent undo the benefits of the single market and shake confidence in the European Union more generally. There is considerable uncertainty regarding the inflation projection, and a more long-lasting period of low inflation, or even falling prices, cannot be ruled out. This could make debt burdens more difficult to manage.
On the other hand, more rapid progress in fiscal and structural reforms would boost growth relative to the projection. Of particular importance are collective fiscal action to boost investment and growth, the banking union and further progress on the single market. A resolution of the refugee crisis would bolster confidence in the EU institutional framework and thereby improve growth prospects. Recent and potential future policy moves by the European Central Bank (ECB) may prove more effective in raising inflation towards its target than assumed. Similarly, cheap oil may have a stronger-than-expected impact on demand.
The refugee crisis
The recent surge of asylum seekers is still small relative to aggregate EU population (Figure 11), although asylum seekers are only a part of the total inflow. However, most asylum seekers that arrived in 2015 applied for protection in only a few member states – mainly Germany, Austria, Sweden and Hungary – where they often represent a sizeable share of the population (close to 2% in Sweden and Hungary). Fiscal measures related to the surge of refugees, including spending to meet their initial needs and to integrate them in the labour market, foreseen for 2016 are estimated to be about 0.1-0.2% of EU GDP, but up to 0.9% of GDP in Sweden (OECD, 2015c). The long-term impact of the current surge of asylum seekers on growth is uncertain. The newcomers will raise the number of people that could work, but how many actually get jobs, how soon they get jobs and their productivity once in a job will depend on how fast and well integrated they are into society and the labour market.
← 1. Resident population at 1 January.
2. 2014 only for Austria, 2012-14 for Finland and 2013-14 for Hungary.
3. European Union 28 countries.
Source: Eurostat (2016), “Asylum and managed migration” and “Demography and migration”, Eurostat Database.
A coordinated and comprehensive policy response by EU institutions and member states will be essential to handling these asylum seekers and legal migrants and those that might arrive in the years ahead. Their successful integration requires comprehensive, tailored measures that take into account their countries of origin, educational background and family situation (OECD, 2015c; OECD 2015d). Such programmes, addressing lack of transferrable skills and low language proficiency, as well as making use of active labour market policies and wage subsidies, have often been effective in raising the employment of immigrants and facilitating integration (IMF, 2016a). It is important to avoid creating high concentrations of immigrants and to settle them where there are job opportunities (OECD, 2016a).
Integration of refugees also requires an approach to make best use of their skills that combines taking stock of their qualifications, supplementary education and upskilling, especially concerning the host-country language, and finally activation (OECD, 2015d). Immigrants with higher-education degrees tend to struggle on the host country labour market more than their native peers (Figure 12), partly due to the difficulties with having their credentials recognised (OECD/European Union, 2015). Low-educated immigrants in the EU as a whole enjoy similar employment rates to those of the natives, but the outcomes vary a lot across individual member states. For children, early training in the host-country language, rapidly after arrival, including for children below primary school age, is key for a successful transition into the education system. Recent data from the Programme for international student assessment (PISA) show the importance of schools having sufficient resources to help immigrant students learn the language of the host country and overcome the trauma of displacement (OECD, 2015e).
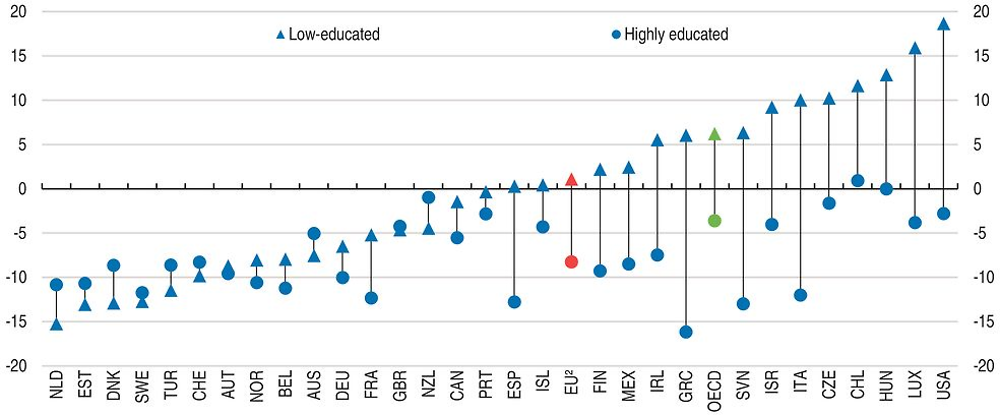
← 1. Population aged 15-64 not in education. Canadian data include people still in education. Australian data include people aged over 24 who are still in education. The United States includes people over 55 who are still in education and calculates employment rates for the 16-64 age group.
2. European Union 28 countries.
Source: OECD/European Union (2015), Indicators of Immigrant Integration 2015: Settling In.
In comparison to the 1990s, when many refugees to the European Union received a status that excluded them, often for years, from the labour market, most of the current asylum seekers have better access to the labour market, including in the stages prior to the application decision (OECD, 2015d). This is welcome as early labour market entry appears to be a key factor in ensuring a lasting integration of immigrants (OECD, 2014a). Even so, the conditions to access the labour market during the processing of asylum claims vary significantly across EU countries (OECD, 2015f). In some countries (Greece, Portugal, Sweden), labour market access can be granted almost immediately, while elsewhere there are waiting times of 2 months (Italy), 3 months (Austria, Finland, Germany), 4 months (Belgium), 6 months (Czech Republic, Netherlands, Poland, Spain), 9 months (France, Hungary, Luxembourg) or even 12 months (United Kingdom). Even after the waiting period, labour market access may be tied to fulfilling other conditions.
Differences in waiting periods for accessing the labour market broadly reflect the average duration of the application process and decision times. It may be possible to reduce the average duration of the standard procedure, including through fast-tracking, wider use of accelerated procedures and fines for administrators exceeding the time limits; these measures have been taken in the Netherlands, where the majority of applications is decided within one month. Such measures could be complemented by waiving labour market tests that require employers to look for suitable resident workers before hiring others (IMF, 2016a).
The Commission has made several legislative and non-legislative proposals to deal with the crisis. These include the scheme for permanent relocation of refugees across member states and strengthening Frontex into a European Border and Coast Guard with a rapid reserve pool of border guards and technical equipment. The proposals, especially for stronger joint protection of the external Schengen border, are welcome, because they increase confidence that the European Union can, through collective action, manage the crisis. However, the policy response at the EU level has been lagging developments on the ground and the member states are slow to fulfil their commitments, including the emergency relocation of asylum seekers agreed in September 2015 and pledges to match the increased EU funding for refugees by additional contributions. The March 2016 EU-Turkey agreement could lower incentives for irregular migration, if fully implemented.
One short-term effect of the crisis has been to strain the Schengen system, under which people can move between most EU countries (and the four non-EU Schengen countries of the European Free Trade Association) as though they were moving within a country. Disintegration of the Schengen area would result in higher transaction and transportation costs, which would hurt cross-border supply chains. Simulations from two computable general equilibrium models with slightly different assumptions about the modelling of the Schengen agreement disruption put the losses in the range of 0.1% to 0.2% of GDP per country per year (Böhmer et al., 2016) or about 0.8% of the Schengen area GDP between now and 2025 (Aussilloux and Le Hir, 2016). However, the disruption of the Schengen agreement would also have significant negative symbolic value, for the citizens regard border-free travel as the most noticeable representation of the European unification process.
The state of the Single Market
The EU Single Market remains unfinished and the degree of its completeness varies across the four fundamental freedoms of movement. The goods market is the most integrated in the European Union, well beyond markets in services, capital and labour, but still far from fully integrated. The progress of goods and services market integration has stalled in the aftermath of the financial crisis: price dispersion in the euro area remains above that among the US states, suggesting a persistent “border effect” distorting the Single Market (Figure 13). The positive effect of the Services Directive on growth since 2012 has been estimated at about 0.1% of the EU GDP and most reforms between 2012 and 2014, measured by the number of abolished restrictions in services, took place in countries under financial assistance, such as Greece and Portugal (European Commission, 2015a). Many other countries did not act on their services-related country-specific recommendations. The positive effect of Single Market on trade in goods and services and investment flows suffers from high level of regulation in some sectors as well as from a high level of regulatory heterogeneity among the member states (Fournier, 2015; Fournier et al., 2015).
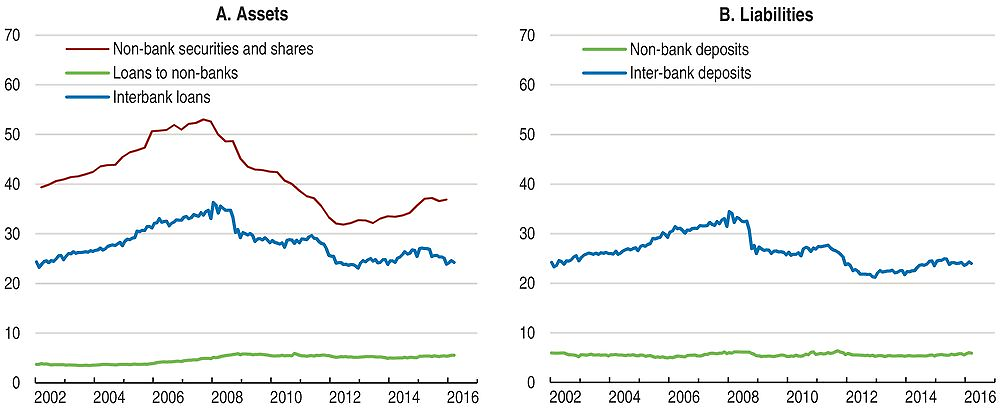
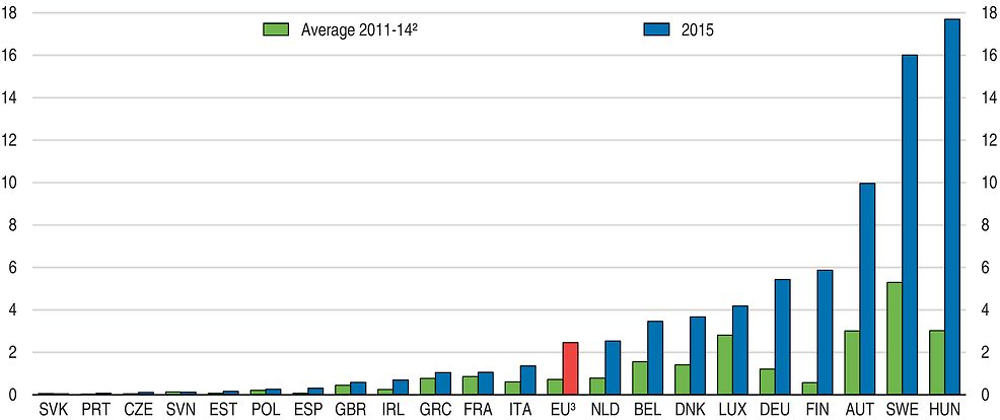
← 1. Cross-border activity as a percentage of the total provision of financial services in the euro area.
Source: ECB (2016), “MFI balance sheets: Monetary statistics”, Statistical Data Warehouse, European Central Bank.
Capital and labour mobility in the Single Market could in principle help improve economic performance and resilience to regional or country-specific shocks just as well as trade in goods and services. The euro area and EU financial markets remain fragmented along national lines, especially for small and medium-sized enterprises (SMEs), and financial intermediation in Europe is still predominantly bank-based. Although cross-border financial integration has been improving since 2012 (Figure 14), the degree of improvement differs across individual markets: it is less clear in equity market integration than in money, bond and banking markets (ECB, 2015). Labour mobility between the EU countries remains low compared to mobility between the US states and between Australian states, although the annual rates are similar to those between Canadian provinces with different languages (Figure 15). Although commuting and posting of workers may, in the EU context, be important alternatives to moving permanently to a different country, labour market fragmentation in Europe is still substantial. The financial crisis has triggered equilibrating labour flows, both within the euro area and between the euro area and the rest of the EU, but the overall effect of these flows has been too small for national labour market adjustment (Chaloff et al., 2012).
← 1. The coefficient of variation indicates the extent of variability relative to the mean of a series. Here the series shown are the price level index of household final consumption expenditure for the European Union and euro area, the implicit regional price deflator for the United States and the intercity index of price differentials of consumer goods and services for Canada.
2. European Union 28 countries and euro area 19 countries.
Source: Eurostat (2015), “Price convergence indicator”, Eurostat Database; BEA (2015), “Real Personal Income for States and Metropolitan Areas, 2013”, US Bureau of Economic Analysis; and Statistics Canada (2016), “Table 326-0015”, CANSIM Database.
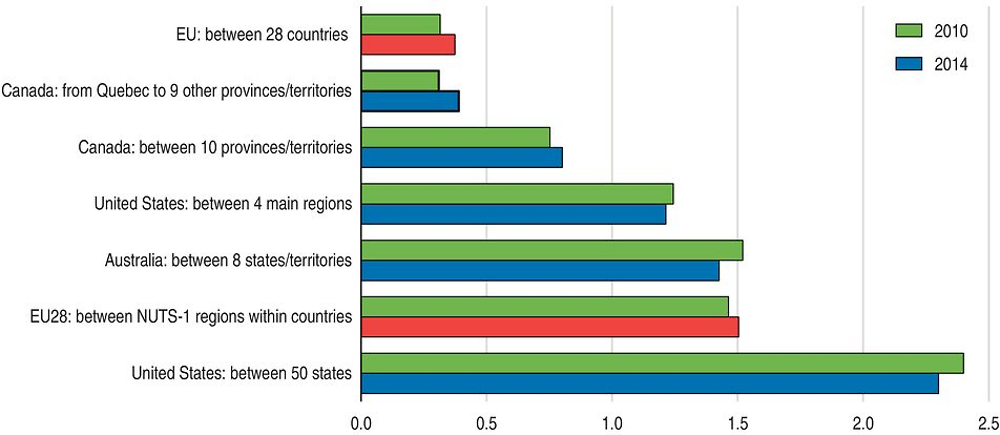
← 1. Population mobility for Australia, Canada and the United States; labour mobility for the European Union.
Source: Eurostat, “Employment and unemployment” Dataset; Australian Bureau of Statistics, ABS.Stat Database; Statistics Canada, “Population and demography” Dataset; and US Census Bureau, American Community Survey.
Completion of the Single Market through reforms of product markets and in policy areas, like trade, where the European Union legislates either alone or, like network sectors and environment, shares competence with the member states, could support the ongoing recovery and boost the EU potential growth in the medium and long run. Both labour and capital market mobility increase resilience in the event of shocks, making the macroeconomic policies at EU level more efficient and, by lowering transaction costs, enhancing private risk-sharing, in the absence of public risk-sharing mechanisms.
Capital mobility-enhancing policies
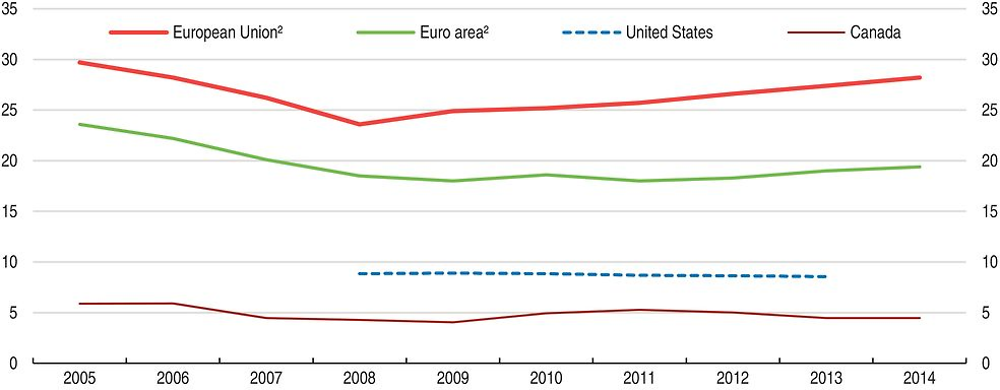
Capital markets in the European Union are less integrated than in the United States, and the reliance of EU firms on bank financing is much higher than in the United States (Figure 16). The objective of the Capital Markets Union (CMU), an important part of the effort to increase collective investment in the European Union, is to enhance both the domestic and cross-border supply of capital, especially to SMEs, mainly through lowering regulatory barriers, widening of investor base and investment choices, and deepening financial integration. The CMU package consists of both legislative proposals and non-legislative initiatives. The immediately actionable measures include a proposal for a Prospectus Regulation aiming at facilitating secondary issuances and simplifying disclosure requirements for smaller issuers, lower capital requirements for long-term and infrastructure investment in Solvency II and Capital Requirements Regulation and simple, transparent and standardised securitisation. These are commendable policies, but they need to create momentum for more ambitious actions to follow.
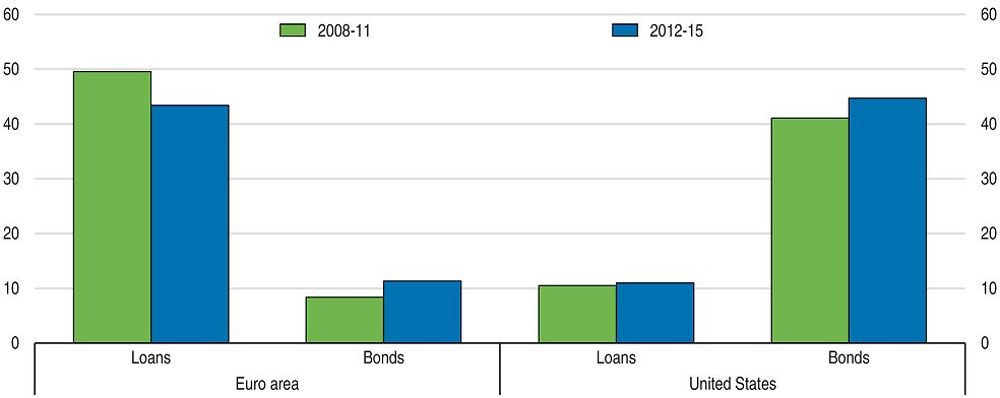
← 1. Loans of monetary and financial institutions.
Source: Eurostat, European Central Bank, US Bureau of Economic Analysis, Board of Governors of the Federal Reserve System, and Securities Industry and Financial Markets Association.
The fulfilment of longer-term aims of the CMU will require addressing the legal and regulatory barriers in the EU capital markets, including harmonisation of company, securities and insolvency laws. As harmonisation by the means of a single rulebook alone does not seem to be sufficient for effective implementation and consistent enforcement of the CMU rules and standards (Cœuré, 2015), it will also require an increased focus by the European Securities and Markets Authority (ESMA) on achieving convergence of supervisory outcomes. The links within the EU regulatory network, including the co-operation with national authorities and supervisory convergence with the Single Supervisory Mechanism (and vice versa) should be strengthened further. Implementation and enforcement of the single rulebook may profit from co-operation on issues common to banking and securities market supervision. Such co-operation may strengthen the integration of capital markets, without harming the peer-review model of the national supervisors (Valiante, 2015; Véron and Wolff, 2015).
Capital market integration under the CMU would also profit from improvements in areas under competence of national states, such as taxation. In particular, the CMU Action Plan aims at tackling burdensome withholding tax procedures, which remain a long-standing barrier to cross-border investment. Issues remain in other areas, including taxation of debt versus equity, and as announced in its Action Plan on Corporate Taxation, the European Union plans to reduce the bias in the corporate tax treatment of debt and equity, be it through carefully designed allowance for corporate equity schemes, limitations on the deduction of interest payments, or the integration of capital income taxes at the corporate and personal level. In addition, the EU Anti-Tax Avoidance Package tangibly contributes to the implementation of the OECD Base Erosion and Profit Shifting (BEPS) Project by addressing gaps in the tax laws of EU member states which have led to double non-taxation or less than single taxation (OECD, 2016b). Swift and comprehensive implementation of the internationally agreed standards is crucial for the success of the BEPS project. Consistent implementation of the BEPS package through international co-operation will enhance the efficiency of the tax system and will reduce compliance costs for taxpayers. The intention of the European Union to stay a frontrunner in BEPS implementation is thus welcome. Already significant progress has been made at the EU level as regards to transparency of tax information, and the European Union also plans to develop a list of non-cooperative jurisdictions and options for co-ordinated defensive measures which will be defined by the Council.
The accumulated gap in European infrastructure investment remains substantial (Della Croce and Gatti, 2014). Moreover, public investment in infrastructure could induce additional private spending (OECD, 2015a). The European Fund for Strategic Investments participates in financing economically viable projects and providing dedicated SME financing as discussed in the OECD Economic Survey of the euro area. In addition, the plan to lower the calculation of the regulatory capital for long-term and infrastructure investment is welcome, as it would allow banks and insurers to treat it as a specific asset class. The rules for simple, transparent and standardised securitisation may help SME lending, especially after the current very low policy interest rates come to an end.
The investor base could be expanded by the introduction of standardised pan-European financial products and investment vehicles, including venture capital fund-of-funds and multi-country funds. Supporting the development of the most effective information system that connects SMEs with a range of funding sources can be an effective tool to tackle the asymmetric information problem associated with SME financing, for example, through transparent and standardised data warehouses that collect and share credit information on smaller firms with all market participants, such as the ECB’s AnaCredit database (OECD, 2015g).
Labour mobility-enhancing policies
Labour mobility in the EU is low, reflecting non-policy factors such as linguistic and cultural differences, as well as policy barriers including the lack of harmonisation of social security systems and of professional qualifications (OECD, 2014b). There is some evidence of equilibrating migration flows in the wake of the financial crisis, as inflows to crisis-hit countries such as Spain and Ireland declined and immigration to others, like Germany and Austria, rose (Figure 17). At least in some labour market segments, such as health personnel, intra-EU mobility seemed to have a balancing effect by reducing the risks of under-employment in countries hit by the crisis; moreover, this adjustment has been facilitated by EU provisions for mutual recognition of professional qualifications (OECD, 2015b).
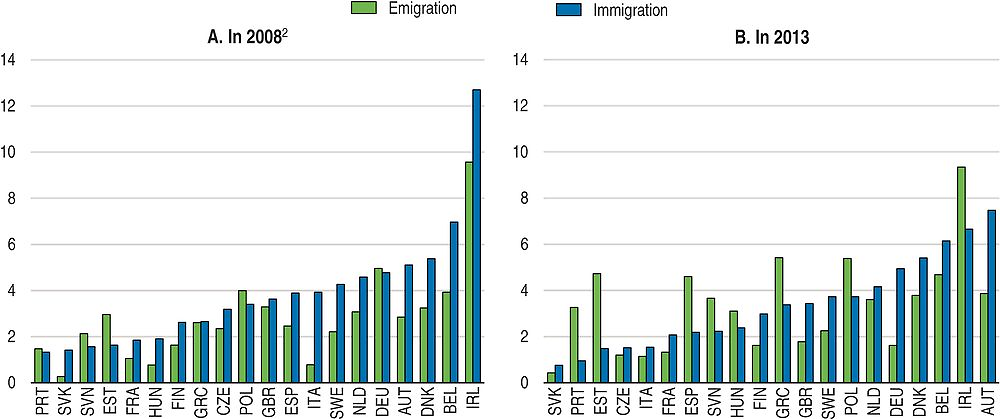
← 1. “Immigration” covers persons establishing their usual residence in an EU country for at least 12 months having previously been usually resident in another EU country; “Emigration” covers persons having previously been usually resident in an EU country who cease to have their usual residence in that country for at least 12 months. Data for EU27 countries in 2008 and EU28 countries in 2013. International migration flow data are based mainly on administrative sources or national surveys and differences in definitions and practices can affect the comparability of data across countries.
2. 2009 for Poland and 2010 for Belgium.
Source: Eurostat (2016), “Demography and migration”, Eurostat Database.
Since language skills are not firm-specific and given the significant positive externalities for society from ensuring that the host-country language is spoken well by immigrants, there is a strong case to boost public funding for language training. Indeed, an important factor that keeps the intra-EU labour mobility low is the lack of proficiency in the language of potential destination countries, an impediment cited by more than a half of respondents in the Eurobarometer survey on geographical and labour market mobility (European Commission, 2010). Publicly funded language courses are available to newcomers in only 14 member states. As they are usually available as part of integration policies for immigrants, they are largely disconnected from policies supporting labour mobility and are not tailored to EU workers (Eurofound, 2015). Few OECD countries provide publicly-funded language training for labour migrants, even though in some OECD countries language knowledge is a pre-condition for labour migrants (OECD, 2013a).
Regulated professions, such as medical personnel, lawyers, educators and transport workers, often impose legally binding qualifications. Only some 5% of applications for recognition of qualification have been rejected EU-wide in 2014, and an additional 15% are in the process of assessment (European Commission, 2016). But slow decision-making in itself can constitute a barrier to mobility, even if the overall success rate is high, so the European Union should monitor improvements and best practice (CEPS, 2014) and consider application of a silence-is-consent rule in areas without major safety or environmental concerns. The European Professional Card, initially available for nurses, physiotherapists, pharmacists, real estate agents and mountain guides, enhances communication of professionals with relevant authorities and includes a silence-is-consent rule for some aspects. It is a welcome policy tool, but would be even more beneficial if extended to other qualifications, such as engineers.
Differences in regulation affect the number of recognitions, which remains relatively small relative to employment and varies substantially across the European Union. Some countries, such as Norway, Sweden and United Kingdom, have awarded and applied for a large number of recognitions, while others, such as France and Italy, did not, despite being parties to the same mutual recognition directives. Moreover, countries with the lowest barriers to entry into professions may face the highest barriers to providing services abroad, as in the case of engineering. When engineering is not a regulated profession, the barriers to entry are low, including for entrants from countries with stricter regulations. The opposite is however not true in countries that regulate engineering through licensing, often creating insurmountable obstacles to engineers from unregulated countries (Nordås, 2016).
Under the revised Professional Qualifications Directive, member states have the obligation to demonstrate, when reviewing existing professional regulations or proposing new ones, that regulation be justified and that public interest objectives cannot be otherwise achieved through other means than by limiting access to professional activities. This obligation should be implemented in a more restrictive way, so as to limit the amount of regulation. Regulatory barriers arising from diverging legal forms, shareholding requirements and other organisational requirements in accounting, architecture, civil engineering and construction companies should be reviewed. Most reforms between 2012 and 2014 have taken place in countries under financial assistance, while other countries either did not act on their services-related country-specific recommendations or even reversed the liberalisation process (European Commission, 2015a).
The risk of losing part of acquired supplementary pension rights and long vesting periods to build up new rights is a strong disincentive to taking up work abroad (CEPS, 2014). The current situation often involves years without entitlement and five-year vesting periods. A directive adopted in 2014, introduces a maximum period of contribution and an obligatory minimum age for acquiring pension rights. Moreover, the pension rights of former workers must be preserved in a way comparable with those of current workers. This improvement is welcome.
Non-EU nationals outnumber EU immigrants in many EU countries (Eurostat, 2015). Non-EU nationals can normally move within the European Union for work and training purposes after becoming long-term residents, i.e. after at least five years of continuous residence, but the Long-term Residents Directive (2003/109/EC) is not well implemented in many member states, which tend to impose additional conditions (European Commission, 2011). However, Denmark, Ireland and the United Kingdom are exempted from the application of the directive. It is important that the member states take better account of temporary stays in the calculation of the five-year period and encourage circular migration through more flexible arrangements regarding periods of absence from EU territory.
The share of high-skilled immigrants in the EU is below the OECD average, despite the similar share of foreign-born in total population of about 10% in both areas (OECD/European Union, 2015). The Blue Card scheme allowing high-skilled non-EU citizens to work and live in the European Union remains the main tool for attracting workers from non-EU countries and filling skills shortages, but its uneven application and limited use stands in the way of achieving its objective. Member states have considerable discretion in defining the parameters, such as earning thresholds. The Blue Card scheme should be modernised and its eligibility requirements and procedures simplified, in order to make it more attractive relative to existing schemes (Chaloff, 2016).
Regulatory and horizontal policies to support potential growth
Both regulatory stringency within a country, as measured by the product market regulation index, and regulatory heterogeneity among OECD countries reduce trade intensity (Fournier et al., 2015) and cross-border investment flows (Fournier, 2015). Similar effects of regulatory heterogeneity on bilateral intra-EU trade and intra-EU foreign direct investment flows in service sectors were found by Kox and Lejour (2006) and Nordås and Kox (2009). Regulatory barriers in network sectors, such as barriers to entry, are strongly correlated with lower investment, both at the sectoral level (Égert, 2009) and the country level (Kerdrain et al., 2010), and hence reduce capital stock in the long run.
The lack of predictability and stability of legislation remains an important obstacle to firms’ activity in the European Union, as reported by 77% of firms at the EU28 level (European Commission, 2015b). The variation of assessment between countries is substantial, ranging from some 40% of firms in Denmark and Sweden to more than 90% in France and Greece, however it should be noted that the assessment conflates factors at the EU and national levels. Other surveys confirm ambivalence about EU regulation, noting the benefits of free markets and freedom of travel, but on the other hand reflect concerns about inefficient and overly interfering EU regulation (European Commission, 2014).
Regulatory quality enhancing policies
The European Union has launched a number of measures to reduce unnecessary costs of regulation, which in many cases remain to be implemented at the national level (OECD, 2014b). The Commission’s Better Regulation package proposes new ways to consult stakeholders, improves the tools and institutions involved in regulatory impact assessment, strengthens the ex post evaluation and outlines new modes of intra-institutional co-ordination at the EU level. However, it does not provide enough detail on where the resources for extended consultations and impact assessment are to come from, or enough guidance on the balance between regulatory costs on one hand and the quality of resulting regulation on the other. More detail would also be welcome on methodological issues, including a link between analytical criteria and the Europe 2020 indicators that, in principle, represent EU’s vision of smart, sustainable and inclusive growth.
The quality of regulation could be improved by more systematic use of impact assessment by co-legislators. While the Commission has produced some 700 impact assessments between 2007 and 2014, Parliament has since 2012 assessed about 20 of its amendments and the Council none (European Commission, 2015c). The Commission has emphasised evidence-based policy-making and it indeed seems useful to have an impact assessment of final legislation that can also serve as an input for the following evaluation, completing the policy cycle (Renda, 2015). In April 2016 a new inter-institutional agreement on better law-making was reached between the Commission, the Parliament and the Council. This agreement covers several aspects of law-making including transparency, simplification, evaluation and the feasibility of establishing objectives for administrative burden reduction in key sectors. It also sets out a general commitment to assess impacts of Commission proposals and of significant amendments by co-legislators, where considered relevant. However, an agreement on subjecting the Parliament’s and the Council’s legislation to impact assessment (similar to that applied to the Commission), already proposed by the Commission in 2003 and 2005, was not reached.
Regulatory co-operation in regional trade agreements
Regional trade agreements (RTAs) could be important regulatory co-operation instruments, as they often include provisions on competition, domestic regulation, technical standards or transparency of rules (OECD, 2013b). Achieving regulatory convergence may require prolonged negotiations and similar level of ambition. Less comprehensive and binding schemes of international regulatory co-operation may lead to lower compliance unless supported by other institutions, including multilateral forums and international organisations (OECD, 2015h). Looking at existing preferential trade agreements, it appears that regulatory compatibility can be achieved more effectively through strong institutional mechanisms, such as joint committees that meet on regular basis than with bilateral committees comprised of government officials that only meet once a year (Steger, 2012).
The Transatlantic Trade and Investment Partnership (TTIP), if agreed, would remove barriers to trade and investment and develop a new model of integration based on permanent bilateral regulatory co-operation mechanism including horizontal provisions as well as a number of sector-specific commitments (Alemanno, 2015). Importantly, the creation of a permanent institutional mechanism will allow identification of new areas of co-operation without re-opening the initial international agreement.
Key service sector policies to lift growth
Services liberalisation
In the process of transposition of the Services Directive, member states could maintain a number of regulatory requirements if they assessed them as non-discriminatory, necessary and proportionate. As a result, the EU trade in services remains subject to administrative and regulatory barriers that vary considerably across individual countries (Figure 18). There is evidence that unjustified and disproportionate requirements are still widespread (European Commission, 2015c) and that between 2012 and 2014, the most restrictions have been removed in countries under financial assistance, while other member states either did not act on their services-related country-specific recommendations or even introduced new barriers (European Commission, 2015a).
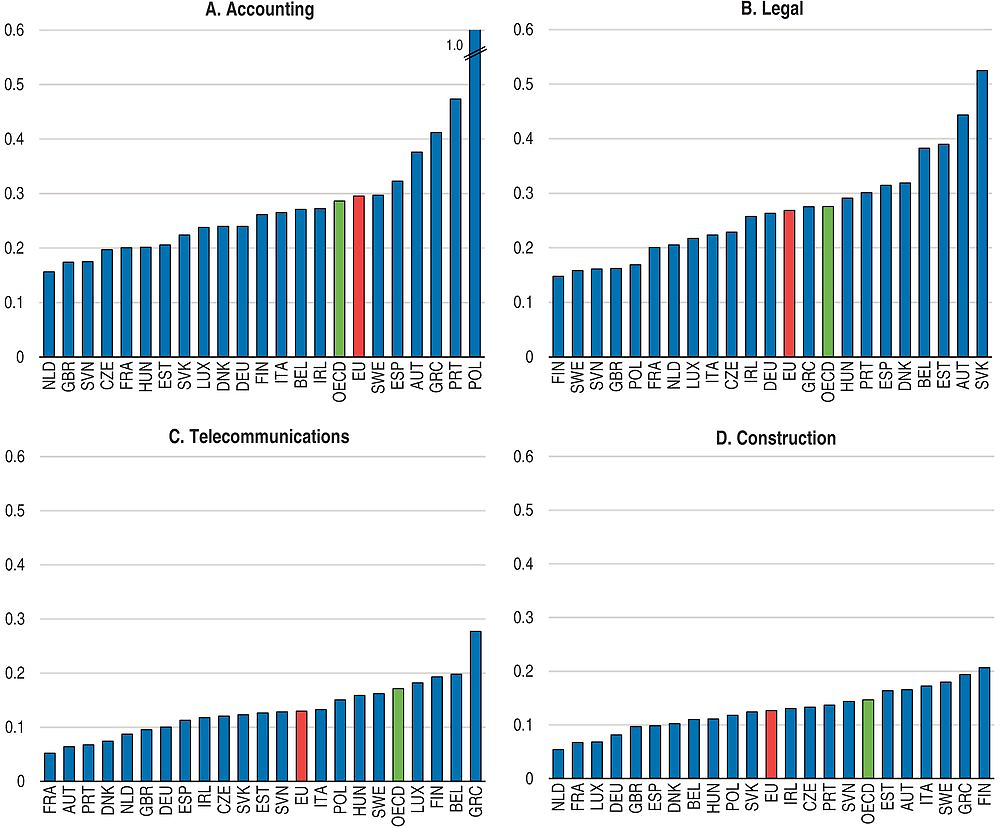
← 1. Measures included in the index cover restrictions on foreign entry and movement of people, barriers to competition, regulatory transparency and other discriminatory measures. Aggregates are unweighted averages; the European Union covers member countries that are also members of the OECD (21 countries).
Source: OECD (2016), Services Trade Restrictiveness Index Regulatory Database.
The Digital Single Market
Digitalisation facilitates diffusion and replication of innovative ideas and together with information and communication technology (ICT) is likely to remain a key driver of productivity growth, especially in advanced, frontier economies (Brynjolfsson and McAfee, 2011; OECD, 2015h). Digital technologies raise GDP growth through ICT-induced labour productivity improvements. Although the digital economy is growing quickly (OECD, 2013c), the scope for further uptake remains considerable, as consumers account only for a fraction of e-commerce, with some 90% of the value of e-commerce being transactions between businesses (OECD, 2015i). The consumer e-commerce also remains domestic (Figure 19), especially when involving SMEs: some 12% of large firms (above 250 employees) sold online across borders in 2012, but the same was true for only 6% of medium-sized firms (50-249 employees) and 3% of small firms (10-49 employees) (Eurostat, 2013). The Digital Single Market Strategy aims at providing more choice and better consumer protection to consumers as well as opportunities for firms, especially SMEs, to expand across the EU borders by making use of the growth potential of the digital economy (European Commission, 2015d).
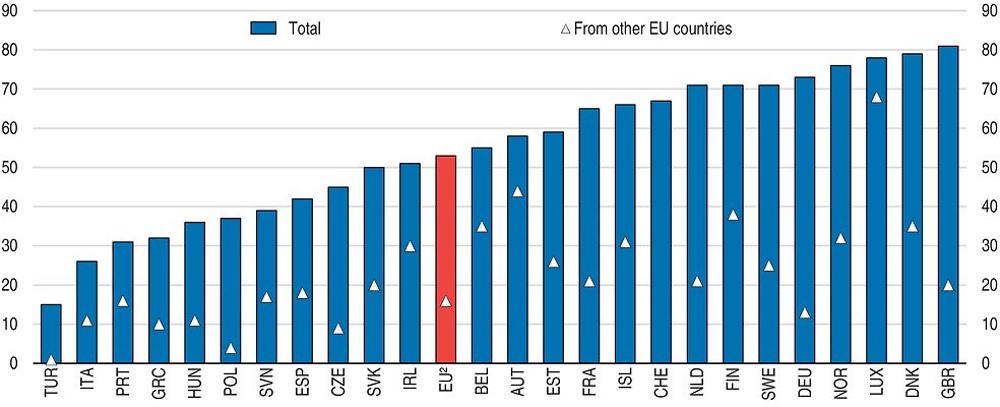
← 1. Individuals who bought or ordered goods or services for private use over the Internet in the last 12 months. 2014 for Iceland and Switzerland.
2. European Union 28 countries.
Source: Eurostat (2015), “Information Society Statistics”, Eurostat Database.
Modernisation of the EU copyright framework has begun with a proposed regulation for cross-border portability of online content based on the principles of residence and temporary presence. This will allow businesses to improve their offer to consumers as they will be able to have continued access to digital-content services legitimately acquired in the home member state when they travel. Further measures concerning cross-border access to copyrighted content will be proposed by the Commission at the later stage and may require revision of the EU copyright framework. In addition, the Commission has also committed to adopt measures against unjustified geo-blocking and other forms of discrimination in terms of access, prices or other sales conditions on grounds of residence or nationality.
The Energy Union and Circular Economy
The Energy Union is a welcome opportunity to achieve the “triple” objective of energy security, decarbonisation and competitiveness (Helm, 2015). The initial focus of EU energy policies on liberalisation and unbundling created necessary, but not sufficient, conditions for a well-functioning EU market. However, the full benefits of this effort have not yet fully materialised due to missing elements, such as interconnection between member states, common regulation for grid and pipeline access and common accounting basis for charging fees. The inefficiency of the EU energy market, and the corresponding potential for gains from trade, is illustrated by the substantial dispersion of energy prices across the European Union (Figure 20). On the other hand, the intended benefits of the EU energy market has been reduced by developments in climate policy and renewable energy support, such as provision of renewables at zero marginal cost, leading to a misalignment between the functioning of wholesale electricity markets and decarbonisation policies (OECD/IEA/NEA/ITF, 2015).
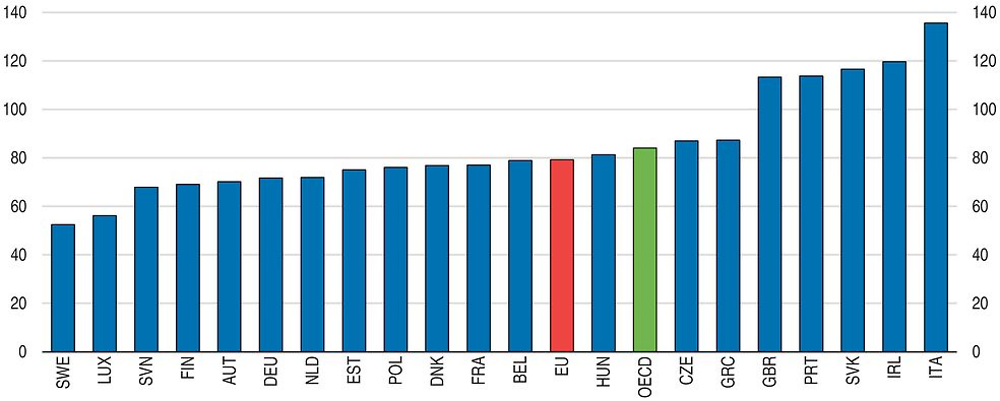
← 1. 2014 for Germany, Greece, Netherlands and United Kingdom. Aggregates are unweighted averages of latest data available. The European Union covers member countries that are also members of the OECD (21 countries) excluding Spain (no data available) and the OECD covers 29 countries.
Source: IEA (2016), IEA Energy Prices and Taxes Statistics and OECD (2016), OECD Economic Outlook: Statistics and Projections (databases).
Better interconnections help create more efficient electricity markets, encourage more competition and could alleviate the variability of flows associated with renewables generation (IEA, 2014). While most of the EU wholesale electricity markets are coupled to one or more neighbours, showing signs of price convergence, marked price differentials remain with regard to gas, partly due to long-term contracts and missing interconnections (European Commission, 2015e). The “triple” objective is politically difficult, but feasible, if one employs a top-down strategy, a credible estimate of the gains from fully integrated energy markets to build consensus and a centralised outline of European gas and electricity grids (Helm, 2015).
The Energy Union should ensure flexibility in the energy sector by increased interconnectivity. National regulation, budget constraints and weak incentives of national network companies could all prevent investment in interconnections and grids needed to achieve the existing interconnectivity targets. The adoption of the second list of cross-border projects of common interest is welcome, but more is needed. The European clean energy strategy should be put in place to ensure that the Investment Plan for Europe and other EU funds are channelled to the investment needs of the Energy Union to ensure that publicly-backed investment is used to deliver on European energy security and climate goals (Gaventa et al., 2015).
Disconnection between the EU energy policy and its climate policy should be eliminated or reduced following the recent COP21 agreement. In its 2030 Climate and Energy Policy Framework, now fully part of the Energy Union Strategy, the EU contributed a collective pledge to reduce domestic greenhouse gas (GHG) emissions by at least 40% below 1990 levels by 2030. In this context, it is worth noting that although the reduction of emissions by 19% achieved since 1990 is partly the result of the structural changes in member states that joined after 2004 and of the consequences of the global financial and economic crisis, concerted policy effort, such as the support of renewables, has contributed to this outcome (IEA, 2014). After 2008 an increasing decoupling of economic growth and energy consumption could also be observed, notably driven by a comprehensive set of energy efficiency policies. The other elements of the 2030 framework include a target for a minimum 27% share of renewable sources in energy consumption, an indicative target of 27% improvement in energy efficiency and an electricity interconnection target of 15% by 2030.
The effort going forward will require not only a shift to low-carbon and renewable sources of energy, but also improved resource efficiency, including more recycling and a reduction of raw material use (Behrens, 2016). The Circular Economy Package (European Commission, 2015f) outlines a welcome legislative proposal in this respect. It broadens the focus from energy efficiency to other features including best practices in repair, re-use, eco-design and recycling and waste that are together likely to reduce both the amount of natural resources used and emissions and waste produced by the EU economy. However, the proposal lacks even an indicative target for increasing resource efficiency, which is a weakness in terms of monitoring and sharing of best practices in resource efficiency policies (Behrens, 2016). The private sector, especially SMEs, may also need practical, technical and financial support to identify and realise business opportunities associated with the circular economy (Rizos et al., 2015).
EU climate and energy policies need to ensure balance between sustainability, competitiveness and security of supply. Strengthening market-based measures (including a reform of ETS), a competitive electricity market and a stable regulatory framework for low-carbon technologies will all be needed to deliver the 2030 targets. As part of the energy market liberalisation, energy subsidies that are still often used to lower energy prices should be phased out (IEA, 2014). Instead, a three-pillar approach, including carbon pricing (a more robust ETS and taxes on non-ETS sectors, where appropriate), targeted energy efficiency regulations ensuring rational energy use and support for low-carbon technologies, should be put in place (OECD/IEA/ITF/NEA, 2015). Carbon taxes or trading systems, such as those that are in place in the European Union, can raise revenues, creating room for reduction of other more distorting taxes, and establish price signals (IMF, 2016b).
The EU Emission Trading System (ETS) is the world’s largest GHG emissions trading system covering power generation, manufacturing and commercial aviation and thus about 45% of the EU’s total GHG emissions. The potential of the ETS and its practical impact on firms behaviour and investment patterns, however, has been limited by a surplus of emission allowances, mainly from lower-than-anticipated levels of energy demand, subsidies to renewable electricity supply and the large inflow of international credits from the Clean Development Mechanism. As a result, carbon emission allowances trade at less than EUR 10 per tonne of carbon dioxide (CO2) (Figure 1.21), providing only a weak incentive for sectors covered by the ETS scheme to invest in low-carbon technologies (OECD, 2015j). Analysis by the International Energy Agency (IEA) and business groups also shows that for ETS to drive capital investment in power generation, a carbon price of EUR 30 per tonne of CO2 would be needed for onshore wind investments, while the price of EUR 40 per tonne of CO2 would be needed to shift production from coal to gas plants reflecting the threshold for coal-to-gas switching at current commodity prices (IEA, 2014).
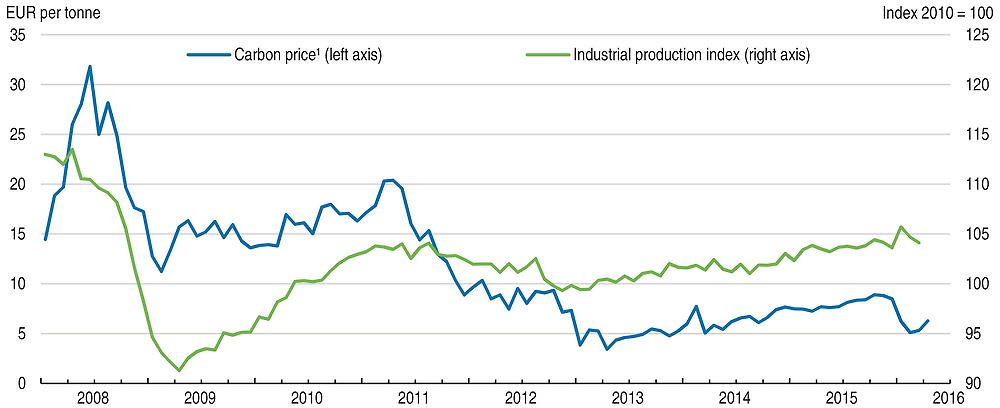
1. Intercontinental Exchange EUA Futures Contract, settlement price.
Source: Thomson Reuters (2016), Datastream Database and Eurostat (2016), “Short-term Business Statistics”, Eurostat Database.
The reform of ETS is vital to ensure a functioning carbon market in the European Union. Measures to reduce the cap, including the decision to postpone the auctioning of 900 million allowances to reduce the short-term supply, the decision to introduce a market stability reserve starting from 2019 and the proposal to reduce the cap by 2.2% a year are meant to achieve that goal. The consistency between ETS and other decarbonisation measures, such as policies supporting renewables and energy efficiency is unclear. Enlarging the scope of ETS into other sectors, such as transport fuels, may in current conditions only create a minimal price signal, while it risks undermining the use of taxation by member states as the primary environmental instrument in transport (IEA, 2014).
Transportation
The Single Market would profit from improved and more competitive transport services and the EU institutions should step up their efforts in this area (Figure 22). Competition in road transport could be improved by simpler and more enforceable rules in the haulage market and promoting a level playing field in domestic passenger services (European Commission, 2015g). The fourth railway package, in its recently agreed technical pillar, would strengthen the role of the European Railway Agency as authority in certification and approval of vehicles. Agreement is also building up on the more controversial part of the package regarding non-discriminatory access to the railway networks of member states and competitive tendering, with targeted measures ensuring impartiality of infrastructure managers and addressing risks of cross-subsidisation. In both cases, significant transition periods are foreseen, facilitating adoption.
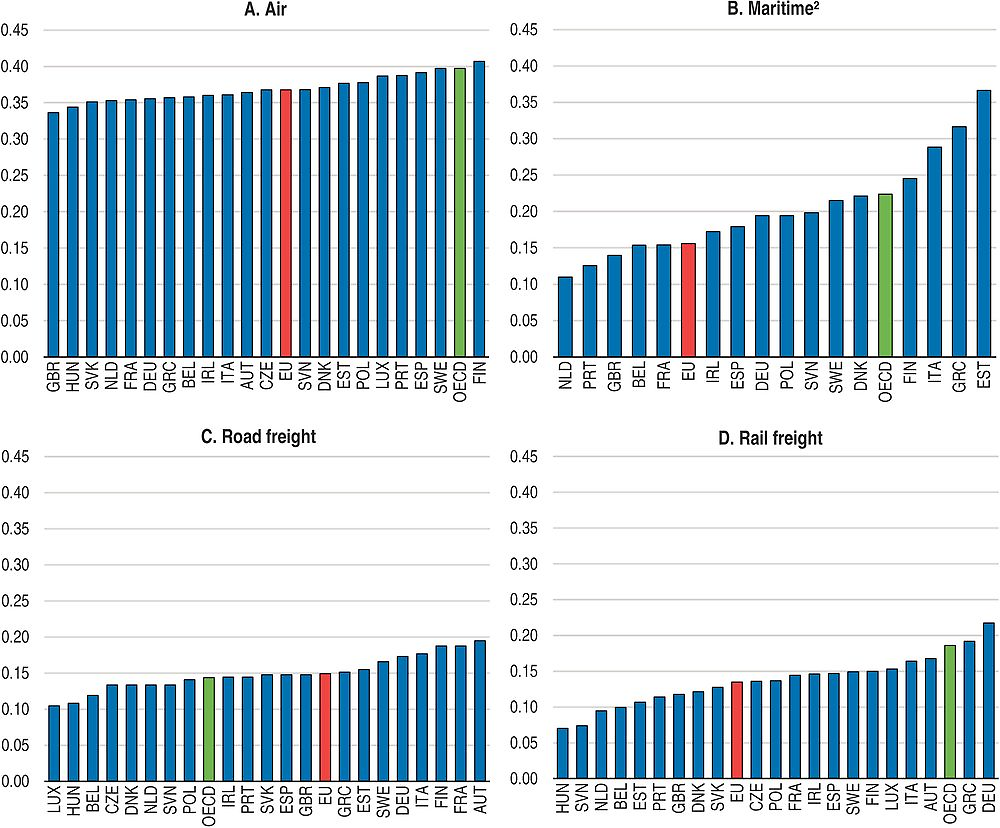
← 1. Measures included in the index cover restrictions on foreign entry and movement of people, barriers to competition, regulatory transparency and other discriminatory measures. Aggregates are unweighted averages; the European Union covers member countries that are also members of the OECD (21 countries).
2. Aggregates exclude countries where no data is available: Austria, Czech Republic, Hungary, Luxembourg, Slovak Republic and Switzerland.
Source: OECD (2016), Services Trade Restrictiveness Index Regulatory Database.
Competitive transport services require physical infrastructure that is often lacking or suffering from technical barriers such as incompatible standards. In some EU countries, maintenance of infrastructure assets has been neglected, to the point that replacement investment is needed (European Commission, 2015h). The development of Trans-European Transport Network, including the identification of main corridors and the work plans until 2030, is welcome. Collective action in transportation should focus on high-multiplier infrastructure investments that can augment GDP growth sufficiently to reduce debt-to-GDP ratios in the near term (OECD, 2015a). Member states, in co-operation with the Commission, should adjust their procurement as well as permitting procedures and consider developing a single legal framework for cross-border infrastructure projects. Financing from the Connecting Europe Facility and the European Structural and Investment Funds should be harnessed to enhance collective action and risk diversification across sectors and modes of transport (European Commission, 2015i).
Bibliography
Alemanno, A. (2015), “The Regulatory Cooperation Chapter of the Transatlantic Trade and Investment Partnership: Institutional Structures and Democratic Consequences”, Journal of International Economic Law, Vol. 18, No. 3, Oxford Journals.
Aussilloux, V. and B. Le Hir (2016), “The economic cost of rolling back Schengen”, Analytical Note, No. 39, France Stratégie, Paris.
Behrens, A. (2016), “Time to connect the dots: What is the link between climate change policy and the circular economy?”, CEPS Policy Brief, No. 337, Centre for European Policy Studies, Brussels.
Böhmer, M. et al. (2016), “Departure from the Schengen Agreement: Macroeconomic impacts on Germany and the countries of the European Union”, Bertelsmann Stiftung, Gütersloh.
Brynjolfsson, E. and A. McAfee (2011), Race Against the Machine: How the Digital Revolution is Accelerating Innovation, Driving Productivity, and Irreversibly Transforming Employment and the Economy, Digital Frontier Press.
CEPS (2014), “Making the most of EU labour mobility”, Report of a CEPS Task Force, Rapporteurs: M. Barslund and M. Busse, Centre for European Policy Studies, Brussels.
Chaloff, J. (2016), “The impact of EU Directives on the labour migration framework in EU countries”, OECD Social, Employment and Migration Working Papers, forthcoming.
Chaloff, J., et al. (2012), “Free labour mobility and economic shocks: the experience of the crisis”, in OECD, Free Movement of Workers and Labour Market Adjustment: Recent Experiences from OECD Countries and the European Union, OECD Publishing, Paris, https://doi.org/10.1787/9789264177185-5-en.
Cœuré, B. (2015), “Capital Markets Union in Europe: an ambitious but essential objective”, A speech at the Institute for Law and Finance in Frankfurt, 18 March.
Della Croce, R. and S. Gatti (2014), “Financing infrastructure – International trends”, OECD Journal: Financial Market Trends, Vol. 2014/1, https://doi.org/10.1787/fmt-2014-5jxvpb4jfrf1.
ECB (2015), Financial Integration in Europe, European Central Bank, Frankfurt am Main.
Égert, B. (2009), “Infrastructure investment in network industries: the role of incentive regulation and regulatory independence”, OECD Economics Department Working Paper, No. 688, Paris, https://doi.org/10.1787/225261508320.
Eurofound (2015), “The thorny issue of labour mobility: Hotly debated but still a slow burner”, Foundation Focus, December.
European Commission (2016), Regulated Professions Database, http://ec.europa.eu/growth/tools-databases/regprof (accessed on 23 February).
European Commission (2015a), “Assessment of the economic impact of the Services Directive: Update of the 2012 study”, European Commission, Brussels.
European Commission (2015b), “European Business and Public Administration”, Flash Eurobarometer, No. 417, European Commission, Brussels.
European Commission (2015c), “Better regulation for better results: An EU agenda”, Communication COM(2015) 215 final, European Commission, Brussels.
European Commission (2015d), “A Digital Single Market Strategy for Europe”, Commission Communication COM(2015) 192 final, 6 May.
European Commission (2015e), “State of the Energy Union 2015”, Communication COM(2015) 572 final, European Commission, Brussels.
European Commission (2015f), “Closing the loop – An EU action plan for the Circular Economy”, Communication COM(2015) 614 final, European Commission, Brussels.
European Commission (2015g), “Upgrading the Single Market: more opportunities for people and business”, Commission Communication COM(2015) 550 final, Brussels, 28 October.
European Commission (2015h), “Opportunities for the transport sector under the Investment Plan”, Note to Ministers for 8 October 2015 Transport Council, http://ec.europa.eu/transport/themes/infrastructure/ten-t-guidelines/doc/2015-09-30-non-paper-transport-sg.pdf.
European Commission (2015i), “Action Plan for Making the best use of new financial schemes for European transport infrastructure projects”, European Commission, Brussels.
European Commission (2014), “The Promise of the EU: Aggregate Report”, Eurobarometer Qualitative Study, European Commission, Brussels.
European Commission (2011), “Report on the application of Directive 2003/109/EC concerning the status of third-country nationals who are long-term residents”, Report COM (2011) 585 final, European Commission, Brussels.
European Commission (2010), “Geographical and labour market mobility”, Special Eurobarometer, No. 337, European Commission, Brussels.
Eurostat (2015), “Foreign citizens living in the EU Member States”, News Release, No. 230, Eurostat.
Eurostat (2013), “Information Society Statistics”, Eurostat Database.
Fournier, J. (2015), “The negative effect of regulatory divergence on foreign direct investment”, OECD Economics Department Working Papers, No. 1268, OECD Publishing, Paris, https://doi.org/10.1787/5jrqgvg0dw27-en.
Fournier, J. et al. (2015), “Implicit Regulatory Barriers in the EU Single Market: New Empirical Evidence from Gravity Models”, OECD Economics Department Working Papers, No. 1181, OECD Publishing, Paris, https://doi.org/10.1787/5js7xj0xckf6-en.
Gaventa, J., N. Mabey, S. Dixson-Declève, H. Spence-Jackson and D. Acke (2015), “EU Energy Union Assessment 2015: Towards a resilient Energy Union with a forward-looking climate policy”, E3G Briefing Paper.
Gonçalves, D. and Á. Pina (2016), “The composition of fiscal consolidation episodes: Impacts and determinants”, OECD Economics Department Working Papers, forthcoming.
Helm, D. (2015), “The EU Energy Union: More than the sum of its part?”, Centre for European Reform, London.
IEA (2014), Energy Policies of IEA Countries: European Union 2014 Review, International Energy Agency, Paris, https://doi.org/10.1787/9789264190832-en.
IMF (2016a), “The Refugee Surge in Europe: Economic Challenges”, IMF Staff Discussion Note, No. 16/02, International Monetary Fund, Washington DC.
IMF (2016b), “After Paris: Fiscal, Macroeconomic, and Financial Implications of Climate Change”, IMF Staff Discussion Note, No. 16/01, International Monetary Fund, Washington DC.
Kedrain, C. et al. (2010), “The impact of structural policies on saving, investment and current accounts”, OECD Economics Department Working Papers, No. 815, OECD Publishing, Paris, https://doi.org/10.1787/5km398ttzlkg-en.
Kierzenkowski R, N. Pain, E. Rusticelli and S. Zwart (2016), “The economic consequences of Brexit: A taxing decision”, OECD Economic Policy Papers, No. 16, OECD Publishing, Paris, https://doi.org/10.1787/5jm0lsvdkf6k-en.
Kox, H. and A. Lejour (2006), “The Effects of the Services Directive on Intra-EU Trade and FDI”, Revue économique, Presses de Sciences Po, Vol. 57, pp. 747-769, Taylor & Francis Online.
Nordås, H.K. (2016), “Does mutual recognition of qualifications stimulate services trade? The case of the European Union”, Applied Economics, Vol. 48, No. 20, pp. 1852-1865, Taylor & Francis Online.
Nordås, H.K. and H. Kox (2009), “Quantifying Regulatory Barriers to Services Trade”, OECD Trade Policy Papers, No. 85, OECD Publishing, Paris, https://doi.org/10.1787/5kgkcjqsm6kd-en.
OECD (2016a), Making Integration Work: Refugees and others in need of protection, OECD Publishing, Paris, https://doi.org/10.1787/9789264251236-en.
OECD (2016b), “Executive Summaries – 2015 Final Reports”, OECD/G20 Base Erosion and Profit Shifting Project, http://www.oecd.org/ctp/beps-reports-2015-executive-summaries.pdf.
OECD (2015a), OECD Economic Outlook, Volume 2015 Issue 1, OECD Publishing, Paris, https://doi.org/10.1787/eco_outlook-v2015-1-en.
OECD (2015b), International Migration Outlook 2015, OECD Publishing, Paris, https://doi.org/10.1787/migr_outlook-2015-en.
OECD (2015c), OECD Economic Outlook, Volume 2015 Issue 2, OECD Publishing, Paris, https://doi.org/10.1787/eco_outlook-v2015-2-en.
OECD (2015d), “Is this humanitarian migration crisis different?”, Migration Policy Debates, No. 7, OECD Publishing, Paris, www.oecd.org/migration/migration-policy-debates.htm.
OECD (2015e), “Can the performance gap between immigrant and non-immigrant students be closed?”, PISA in Focus, No. 53, OECD Publishing, Paris, https://doi.org/10.1787/5jrxqs8mv327-en.
OECD (2015f), “How will the refugee surge affect the European economy?”, Migration Policy Debates, No. 8, OECD Publishing, Paris, www.oecd.org/migration/migration-policy-debates.htm.
OECD (2015g), OECD Business and Finance Outlook 2015, OECD Publishing, Paris, https://doi.org/10.1787/9789264234291-en.
OECD (2015h), OECD Regulatory Policy Outlook 2015, OECD Publishing, Paris, https://doi.org/10.1787/9789264238770-19-en.
OECD (2015i), OECD Digital Economy Outlook 2015, OECD Publishing, Paris, https://doi.org/10.1787/9789264232440-en.
OECD (2015j), Climate Change Mitigation: Policies and Progress, OECD Publishing, Paris, https://doi.org/10.1787/9789264238787-en.
OECD (2014a), “Labour market integration of immigrants and their children: Developing, activating and using skills”, in International Migration Outlook 2014, OECD Publishing, Paris, https://doi.org/10.1787/migr_outlook-2014-5-en.
OECD (2014b), OECD Economic Surveys: European Union 2014, OECD Publishing, Paris, https://doi.org/10.1787/eco_surveys-eur-2014-en.
OECD (2013a), Recruiting Immigrant Workers: Germany 2013, OECD Publishing, Paris, https://doi.org/10.1787/9789264189034-en.
OECD (2013b), International Regulatory Co-operation: Addressing Global Challenges, OECD Publishing, Paris, https://doi.org/10.1787/9789264200463-en.
OECD (2013c), The Internet Economy on the Rise: Progress since the Seoul Declaration, OECD Publishing, Paris, https://doi.org/10.1787/9789264201545-en.
OECD/European Union (2015), Indicators of Immigrant Integration 2015: Settling In, OECD Publishing, Paris, https://doi.org/10.1787/9789264234024-en.
OECD/IEA/NEA/ITF (2015), Aligning Policies for a Low-carbon Economy, OECD Publishing Paris, https://doi.org/10.1787/9789264233294-en.
Ollivaud, P. and D. Turner (2014), “The Effect of the Global Financial Crisis on OECD Potential Output”, OECD Economics Department Working Papers, No. 1166, OECD Publishing, Paris, https://doi.org/10.1787/5jxwtl8h75bw-en.
Renda, A. (2015), “Too good to be true? A quick assessment of the European Commission’s new Better Regulation Package”, CEPS Special Report, No. 108, Centre for European Policy Studies, Brussels.
Rizos, V. et al. (2015), “The Circular Economy: Barriers and Opportunities for SMEs”, CEPS Working Document, No. 412, Centre for European Policy Studies, Brussels.
Steger, D. (2012), “Institutions for Regulatory Cooperation in ‘New Generation’ Economic and Trade Agreements”, Legal Issues of Economic Integration, Vol. 38, No. 4, pp. 109-126, Kluwer Law Online.
Valiante, D. (2015), “Light and shadows in Europe’s new Action Plan for Capital Markets Union”, CEPS/ECMI Commentary, No. 40/5, Centre for European Policy Research, Brussels.
Véron, N. and G. Wolff (2015), “Capital Markets Union: A Vision for the Long Term”, Bruegel Policy Contribution, No. 2015/05, Bruegel, Brussels.
← 1. The statistical data for Israel are supplied by and under the responsibility of the relevant Israeli authorities. The use of such data by the OECD is without prejudice to the status of the Golan Heights, East Jerusalem and Israeli settlements in the West Bank under the terms of international law.