Chapter 1. Macroeconomic and financial risks1
The Danish financial sector is big and there is a high degree of inter-connectedness between banks, mortgage institutions and pension funds. At the same time, Danish households have large balance sheets and high levels of gross debt. Even though the high debt levels are matched by large assets, notably in form of pension savings, there are feedback loops with the housing market and households’ balance sheets contributing to macroeconomic volatility. At the same time, the very low interest rate environment may contribute to the building up of risks, notably in the housing market. Given the on-going recovery of the housing market, it is an opportune time to eliminate the debt-bias in taxation, which would strengthen the automatic stabilisers of the fiscal system. In addition, further liberalising the private rental market would help create a more dynamic housing market overall and reduce the need to meet housing needs primarily with the owner occupancy segment.
Denmark has a substantial, inter-connected financial sector and households with large balance sheets. The recent Great Recession, coupled with the bursting of a domestic housing bubble, had significant repercussions in the Danish economy: growth remained subdued for 5 years and the country has not yet reached its pre-crisis level in terms of output although gross national income per capita taking into account terms-of-trade improvements is developing somewhat better. Current low interest rates are contributing to a potential build-up of internal imbalances over time, notably in the housing market, and may be encouraging excessive risk-taking by households and the financial sector, leading to the misallocation of resources.
In the medium-term households are vulnerable to rising interest rates and housing market developments. A considerable amount of their wealth is in housing, and on aggregate, they are the most indebted in the OECD, with mortgages with variable interest rates accounting for a substantial share of this indebtedness. This makes households vulnerable to interest rate rises and more generally to housing market developments, increasing the volatility of private consumption. At the same time, they hold large pension savings, with over a third of these invested in covered bonds that finance the households’ mortgages. Aside from circularity, asset price developments in the long term are uncertain, including those of housing. A number of empirical studies show that house prices will face substantial headwinds as the population ages, even if more recent estimates (e.g. Takats, 2012, Saita et al., 2013) fall short of earlier projected asset price falls (Mankiw and Weil, 1989). All these factors result in macroeconomic vulnerability, putting household wealth and pensions, and thereby sustainable ageing in Denmark, at risk.
This chapter examines the macroeconomic and financial risks to the Danish economy, including the pivotal role of the housing market. It starts by reviewing risks stemming from the housing market and large households’ balance sheets, which relate to the housing debt bias in the economy. It then looks at challenges posed by the current very low interest rate environment and examines risks present in the financial sector. The chapter concludes with a discussion of such a specific set-up on efficient resource allocation and inclusive growth.
Eliminating debt bias towards housing requires policy change
Housing represents the most valuable asset of household wealth across OECD countries. On one hand, there are general benefits to home ownership. It often serves as collateral for credit, allowing house-owners to smooth their consumption profile. In some countries it is a form of old-age saving; and it can have social and distributional implications as adequate housing enhances children’s opportunities for educational achievement and their future employment thus impacting social mobility. Well-functioning housing markets allow people to move in search of employment, contributing to efficient reallocation of resources in the economy. On the other hand, the housing market has been an important source of financial and real volatility and can exacerbate distributional as well as regional inequalities (Andrews et al., 2011).
The global financial crisis coincided with a sharp correction of the Danish housing market. In real terms, house prices rose by 71% from 2000 to the peak in 2007 and then bottomed out in the second quarter of 2009. Average price per square meter for houses dropped by 20% from peak-to-trough, prices for flats were even more volatile. This is comparable to the large house price cycles experienced simultaneously in the Netherlands, Ireland and Spain, also in terms of impact on consumption and housing investment (IMF, 2015). The housing market has recovered by now and property prices are growing again, the situation however differs markedly across the country (Figure 1.1). Prices of flats have been growing by close to 10% over the last couple of years in the capital, with the market turnover twice as high as in the rest of the country, while house prices have been flatter over the same period (Danmarks Nationalbanken, 2015a).
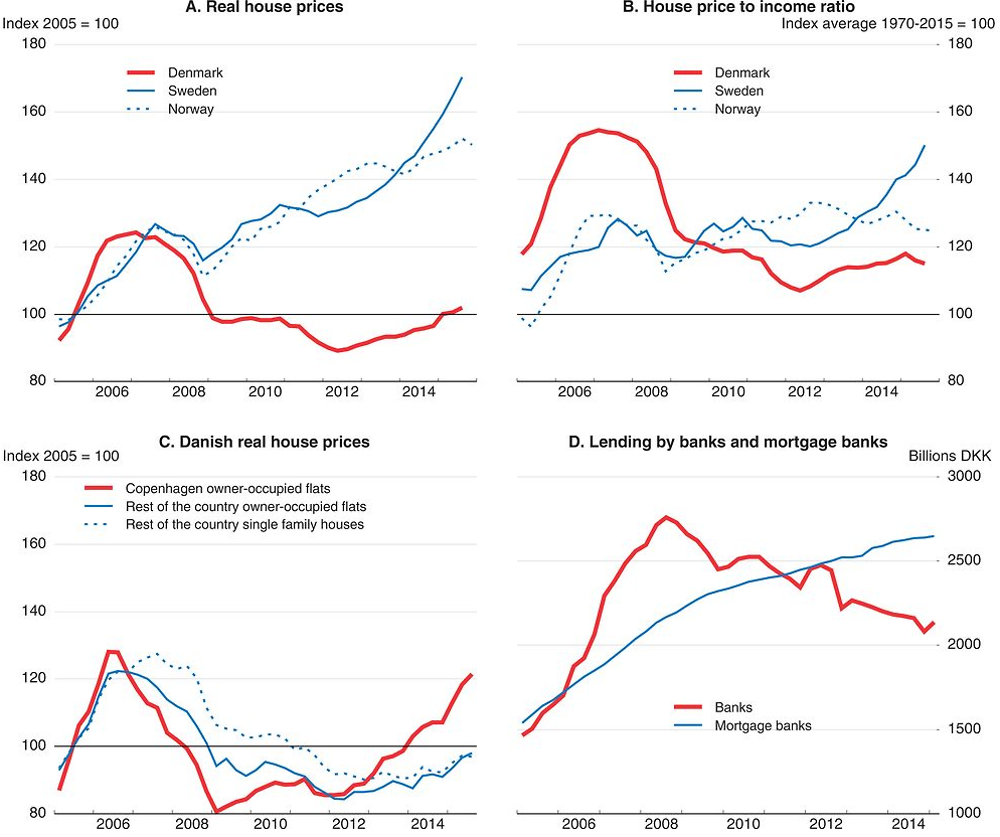
Source: OECD Housing database; Statistics Denmark.
Danish households spend almost 25% of their income on housing services, one of the highest shares in the OECD (Figure 1.2). The housing stock is relatively old –more than one third was built before 1945 – but overall, it is adequate in terms of equipment. Half of the housing stock is owner-occupied, and another 7% comprises of co-operative tenure (Salvi del Pero et al., 2016). Owner-occupancy has traditionally been seen as the top end of the housing ladder in Denmark and social housing plays an important role, with 22% of the dwelling stock run by housing associations under the responsibility of local municipalities. The private rental market is limited since rents are regulated for housing built before 1991; this concerns a large majority of the private rentals even though a number of new flats were built during the recent housing boom (OECD, 2006).
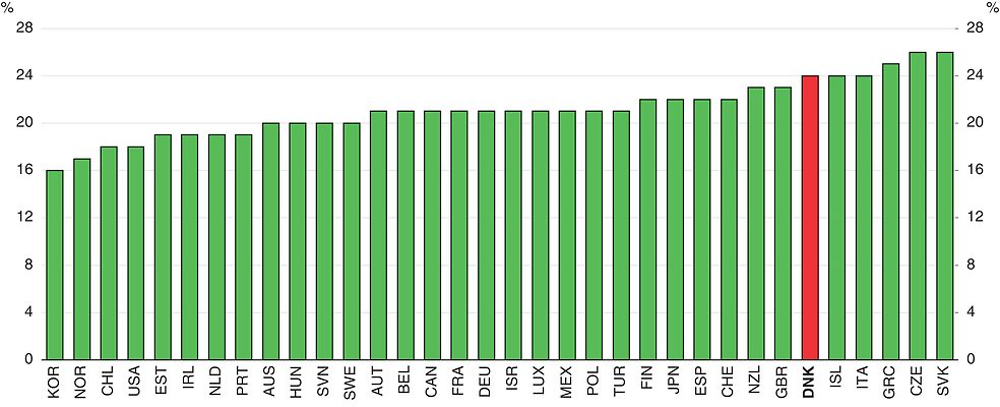
← 1. Housing expenditures include actual and imputed rents, expenditure on maintenance and repair of the dwelling, on water supply, electricity, gas and other fuels, furniture, furnishings and household equipment, goods and services for routine maintenance of the house. Gross of depreciation but after taxes and transfers as well as social transfers in kind such as education and health care.
Source: OECD calculations based on OECD Better Life Index (2015), OECD National Accounts.
Earlier estimates put overall public spending on housing at around 3% of GDP, including foregone revenues from various tax expenditures (OECD, 2006). Most forms of ownership enjoy public subsidies. Mortgage interest rates are tax deductible; there has been a freeze on recurrent tax on immovable property since 2002, and flats purchased before July 1998 and pensioners benefit from special tax reductions. Share-owners of housing cooperatives do not pay the immovable property tax. There are also subsidies for social housing as the central government and municipalities are responsible for a significant share of its construction costs. This comes on top of housing benefits that cover about a fifth of households, both in private and social housing, that amount to 0.7% GDP (OECD, 2006).
Both policy and the real economy feed housing bubbles
Policy tends to exacerbate house price fluctuations. During the 2004-07 boom, a combination of financial innovation, initial household income growth, expansionary monetary and fiscal policy, and the immovable property tax freeze fed into the price increases that soon turned into a self-fulfilling bubble, in particular in high density areas in and around Copenhagen (Pedersen and Sørensen, 2009, Dam et al., 2011, Heeboll, 2014). The following section looks at policy and the real economy drivers of the Danish housing market.
Interest rate flexibility led to increased competition in the mortgage market world-wide. OECD estimates showed that financial deregulation increased real house prices as much as 30% in the average OECD country over recent decades (Andrews et al., 2011). Nevertheless, in Denmark, financial innovation went somewhat further. Deferred amortisation mortgages – i.e. mortgages where for an initial period of 10 years only the interest is paid -were introduced in 2003 and peaked at 57% of all mortgages in 2013. Dam et al., (2011) estimate that the new types of loan – deferred amortisation and adjustable rate mortgages – explain around half of the increase in real house prices over the 1999-2007 period.
The residential housing price growth was – and continues to be – driven by prices of flats in urban areas. Owner-occupied flats, though accounting only for 11.5% of overall owner-occupied residencies, are highly concentrated in the cities and their prices are the most volatile. Just under a half of these flats is located in the capital and its surroundings (the Greater Copenhagen area). Prices of owner-occupied flats doubled in real terms between 2000 and the peak in 2007, while house prices increased only by about 60% across the country (Dam et al., 2014). Urban areas have also experienced the most dramatic declines in the downturn, but then started to grow again as early as June 2012. The urban price developments spilled into the rural areas but rural property prices are now taking longer to recover.
Demographic trends
A combination of increasing home ownership, urban sprawl and demographic trends such as a higher divorce rate drive housing market developments in many OECD countries and Denmark is no exception. The divorce rate has been largely stable since 1970s in Denmark and fluctuates around 2.4-3 per 1 000 inhabitants. It reached 3.4 in 2013, one of the highest among EU and OECD countries. While the rate of urbanisation has plateaued in the 1980s, urban sprawl in so-called hotspots plays a role, as households migrate to the urban fringe. The population of Copenhagen and Frederiksberg grew throughout the 2000s, and increased further by 10% since 2009 while remote rural areas in the country saw a decline in population (Dam et al., 2014). With over a half of the population growth in the capital areas accounted for by those under 30, many of which are students with tighter budget constraints, the pressure on the rental market has increased. For instance, due to the limited availability of privately rented apartments and long waiting lists for social housing, many parents are buying the flats for their student or adult children, thereby boosting even further the owner-occupied demand for housing (Dam et al., 2014). Such trends are expected to continue, since population growth in the urban areas is set to continue at the expense of rural ones, potentially resulting in a challenge in terms of regional disparities.
Estimates of housing demand trends in an ageing society are mixed. Some studies find that human capital (proxied by health and education) can be a key driver for housing demand since younger cohorts are better educated, healthier and wealthier, and on aggregate level an ageing society is likely to demand more housing (Eichnoltz and Lindenthal, 2014). Indeed, educational attainment has increased in Denmark, as in many OECD countries. The share of today’s 25-34 year olds that have at least upper secondary education is above 80%, ten percentage points higher than for the cohort of 55-64 year olds (OECD, 2014a). However, the demand for housing can differ significantly across the country. Regional housing markets with unattractive economic and living prospects face a double challenge. Firstly, the total number of households declines due to ageing and secondly, those with higher educational levels and thus better income prospects, are more likely to move away to prosperous regions, since their willingness to pay premium prices is higher (Eichnoltz and Lindenthal, 2014). Meanwhile, Takáts (2012) found a significant link between population growth and house prices, and that an increase in the share of elderly is associated with lower house price growth.
“Imported” monetary policy
Monetary policy is strongly influenced by the ECB since Denmark maintains a currency peg to the euro. The peg has been a cornerstone of Danish economic policy for over 30 years, reducing uncertainty arising from exchange rate volatility and adding credibility to the overall policy framework. It enjoys broad political support in Denmark and is generally perceived to have served Denmark well. However, ECB monetary policy does not always fully correspond to the Danish economic cycle (Figure 1.3). Jorda et al. (2014) show that loose monetary policy conditions can be a cause for mortgage and house price booms, and that exchange rate pegs can provide a source of exogenous variation in monetary conditions. Should monetary conditions become out of line with the Danish business cycle, other policies such as fiscal and macro-prudential must be stepped up. Denmark has had a negative policy interest rate for most of the period since July 2012 and given the euro area outlook the ECB rates will remain low for some time. Both the Systemic Risk Council and the central bank issue regular warnings about excessive risk-taking and relaxation of lending standards resulting from increased competition in the banking and mortgage sector (Danmarks Nationalbank, 2014a, Systemic Risk Council, 2015). However, the Systemic Risk Council has not yet issued such warning about a bubble in house prices or valuation of financial assets.
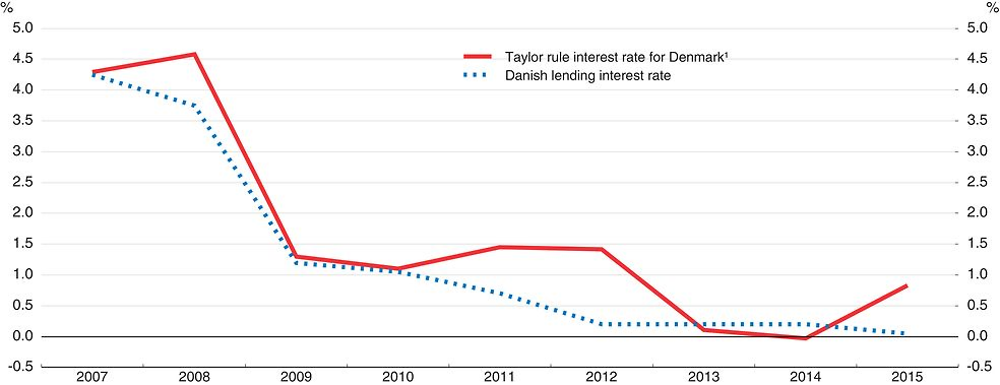
1. The Taylor rule rate interest rate is calculated as: i = annual real potential GDP growth + core inflation + 0.5 * output gap + 0.5*(core inflation – 1.9).
Source: Danmarks Nationalbank; OECD Analytical database.
Limited rental opportunities
Some 20% of the housing stock consists of private rental housing, which is close to the OECD average though at the low end when compared to a number of high-income OECD countries (Salvi del Pero et al., 2016) (Figure 1.4). However, the social housing sector is large, reducing the demand for private rental dwellings. As already mentioned, a considerable share of it falls under rent regulation since around 80% of the private rental market units were built before 1991, though during the recent housing boom new housing units for private rent have been built (OECD, 2006). Developing a well-functioning rental market could help ease off pressures on the owner occupied segment of the housing market notably in urban areas. Cuerpo Caballero et al. (2015) conclude that rent controls have a significant destabilising impact on the aggregate housing market by increasing house price volatility under various shocks (e.g. shift in population, disposable income, long-term interest rates). Experience from other countries confirms that the development of a bigger private rental market needs a comprehensive reform package which includes rent regulation, tenant protection and fiscal neutrality (de Boer and Bitetti, 2014). Rent flexibility could be increased for instance by allowing more scope for comparisons of flats when determining similar rents and lowering an investment threshold that the landlord needs to spend on upgrading the property to justify a rent rise. Any changes to the regulation need to strike a balance between landlord and tenant protection. A rental market commission should be set up, to look into the incentives for developing a bigger private rental market.
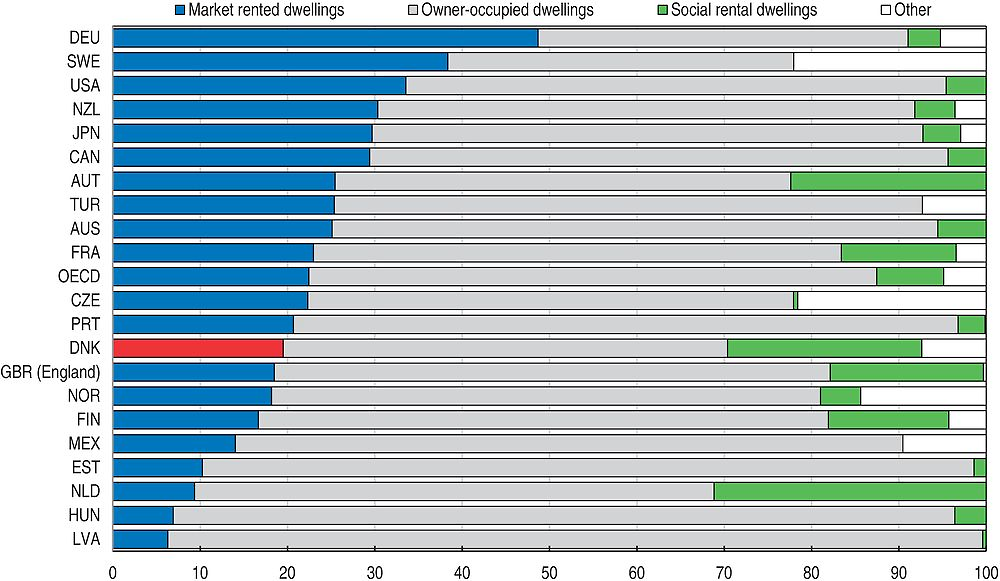
Source: Salvi et al. (2016), Policies to Promote Access to Good-Quality Affordable Housing in OECD Countries”, OECD Social, Employment and Migration Working Paper, no. 176.
Social and affordability concerns are already addressed by the large social housing sector and housing benefits, weakening the rationale for continuing rent regulation in the private rental market. Social housing consists of 22% of the housing stock and in order to promote a social mix, in principle, all households are eligible to receive social housing. There are however criteria for prioritising. Large disparities between rents of similar dwellings, depending on the date of construction exists in the segment of social housing. Also, there are long waiting lists. Once given social housing, no regular review of whether the need persists over time is carried out. Consideration should be given to the introduction of affordable co-payment for the cost advantage of living in social housing.
Housing taxes distort the market
The existing taxes on immovable property fail to dampen house-price fluctuations, and do not help to stabilise the economic and financial cycles (Danmarks Nationalbanken, 2015b). A land tax, commercial building tax and a residential property tax is in place. Introduced as a part of a general tax freeze in 2002, immovable residential and commercial property taxes are fixed at their nominal level of the time. This means that when house prices rise, effective property tax rate falls and vice-versa, that was the case particularly in mid-2000’s, when house prices rose much faster than property taxation (Figure 1.5, Panel A). Dam et al. (2011) illustrate how this nominal freeze in combination with the tax deduction for mortgage interest rates contributed to the housing market boom up to 2008. Moreover, Dam et al. (2011) also show the uneven regional distribution of the tax freeze; the largest average “tax savings” per household were in Greater Copenhagen, where the prices increase was the steepest during the upswing. In Northern Jutland, such tax saving was one fifth of that in the capital. The tax rates are set at a rate of 1% for value under DKK 3 040 000 (EUR 407 376) and 3% for properties above that value. Overall, the authorities collect around 2.1% GDP in immovable property taxes in total (Figure 1.5, Panel B and C shows only a land tax for Denmark, and does not include so-called property tax collected by the central government due differing classification of the tax on owner occupied property).
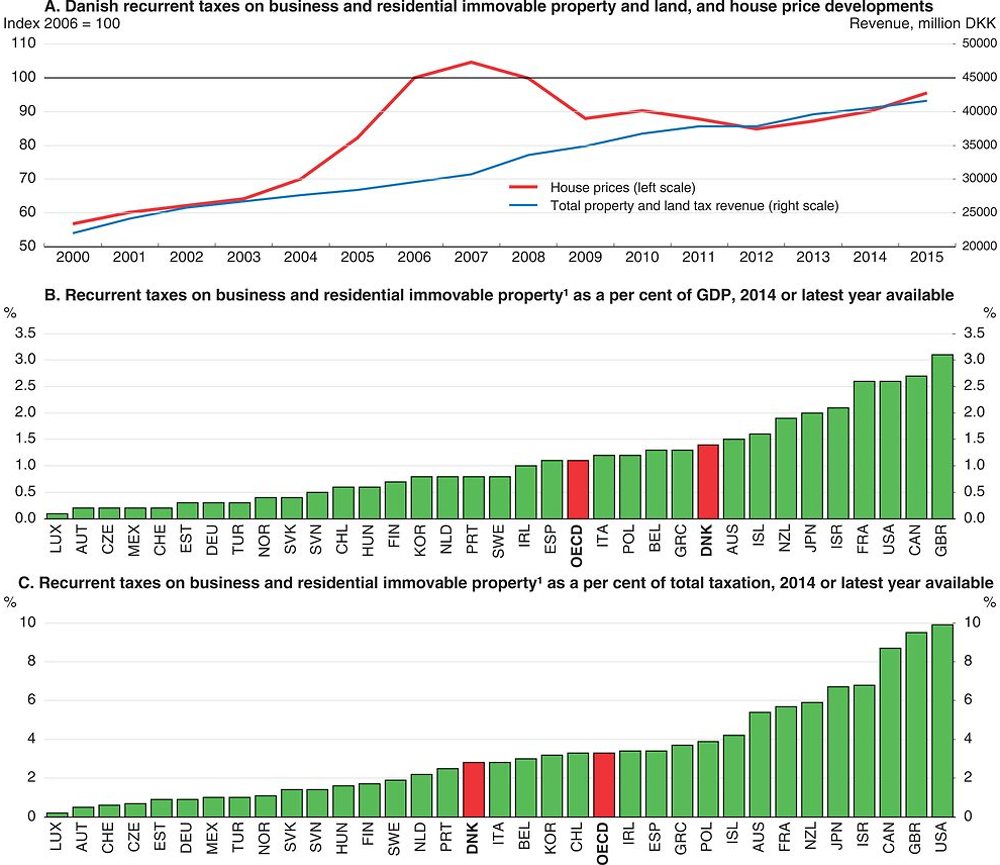
1. In Panel B and C, the data for Denmark includes only the land tax, not the property tax.
Source: Statistics Denmark; OECD Revenue Statistics database.
Some argue that the land tax (with rates varying between 1.6 and 3.4%) compensates in part for the property tax freeze. Nevertheless, increases of the municipal land tax have been subject to a ceiling of 7% per year and therefore no longer reflect the full appreciation of the local hotspots. Also, the land tax is collected with a considerable lag relative to developments in actual land prices, and has thus only a limited stabilisation role (Danmarks Nationalbank, 2015a). Moreover, it has been frozen altogether in the 2016 public budget. An update of the immovable residential property (and land) values is long overdue. Though usually done on a two-year cycle and generally well-regarded (Almy, 2014), the valuation process has been under a review for past three years, further weakening counter-cyclical fiscal tools. Currently, the tax is collected based on 2011 valuation and an update is scheduled for 2018.
Favourable tax treatment of owner-occupied housing contributes to distorting demand for housing services. Owner occupiers are exempt from capital gains taxation and as in many OECD countries, they are allowed to deduct interest rate expenditures on debt financing of home-ownership from the PIT tax base. The deduction has already come down significantly from 46% in 1994 to 32.7% currently. Moreover, for interest payments above DKK 50 000 (EUR 7 370) per year, the value of the deduction is reduced by one percentage point per year until it reaches 25% of the interest rate costs in 2019. Some countries that have been through a similar housing boom-bust have gone further in tightening the favourable tax treatment of owner-occupied housing. For instance, in Ireland, all mortgage tax relief expires by 2017, mortgage interest payments for property purchased after 2013 are no longer deductible from personal income tax in Spain, and the Netherlands will allow full deductibility only for new amortising loans (OECD, 2014b, OECD, 2014c, IMF, 2015). The Danish authorities should lower the interest rate expenditure deductibility for all mortgages to the level which achieves neutrality across different asset types. Now is an opportune time, since the housing market seems stabilised and such measure can help restraining overshooting house prices.
Recurrent taxes on immovable property are considered to be one of the least distorting taxes for economic growth (Arnold, 2008). Yet, increasing them is one of the least popular measures and can have distribution implications since it is not directly linked to ability to pay. In principle, property taxes have a stabilising effect on house prices. Although recent empirical analysis shows a relatively limited effect on dampening the price volatility (Blöchliger et al., 2015), eliminating the pro-cyclicality of the housing and debt related taxation is an important complement to macroprudential policy tools to restrain the overshooting of the housing market.
Land planning and zoning
Due to short term inelasticity of housing supply, land zoning and planning processes have also an impact on the housing market (Andrews et al., 2011). By some measures the Danish system is not particularly restrictive and housing supply tends to be responsive. Nevertheless, a tension between the national and regional views on urban development can contribute to an upward pressure on single family house prices, in particular in sought-after urban areas (Lauridsen, et al., 2013). Land regulation is delegated to municipalities, but the Ministry of Environment has an important say on urban development too. In case of development in and around Copenhagen, the central authorities seem to favour higher density in the urban areas, close to the existing transportation lines, while local municipalities tend to be more responsive to development of new single-family housing, which is often the voters’ preference, but can require new infrastructure investment (Lauridsen et al., 2013). Tight municipal budgets can restrict urban development as it would require financing of new public infrastructure, slowing the responsiveness of new housing supply and thereby contributing to price increases.
Household indebtedness increases consumption volatility
Debt financing can result in costs that are not borne by those involved in the debt contract: non-performing loans may lead to fire sales of assets below market prices which can have a widespread impact and massive aggregate demand shocks linked to de-leveraging weigh on the economy as a whole. Taking a full business cycle perspective, Isaksen et al. (2011) illustrated that Denmark – with the highest gross debt ratio among the OECD countries – experienced the second highest private consumption volatility during 1995-2010. Andersen et al. (2014) established a strong negative correlation between the pre-crisis leverage and the change in consumption during the downturn. They showed that highly leveraged households reduced their consumption between 2007 and 2011 more than those less-leveraged, with non-linear effect for loan-to-value ratios above 40%. Such consumption reduction is a result of unsustainable levels of consumption prior to the downturn, rather than differing dynamics during the recession. In other words, the more leveraged households had to unwind the unsustainable consumption levels that they had prior to the downturn.
These results are in line with the existing empirical literature on how high levels of debt amplify macroeconomic volatility. A growing number of studies show that recessions preceded by large increases in household debt tend to be more severe and protracted (Jorda et al., 2013). For the United States, Dynan (2012) shows that, after controlling for factors such as income and wealth, those with higher loan-to-value ratios prior to the crisis experienced larger declines in spending. Mian et al. (2013) show that the decline in consumption following the crisis was greater in areas with high pre-crisis outstanding loan-to-value ratios. Similar conclusions are reached by Bunn (2014) for the UK. Exploring the links between debt and macroeconomic stability, Sutherland and Hoeller (2012) find that when private sector debt levels rise above trend (for households in particular) recessions tend to be more severe.
Household debt has decreased, but remains high
The pace of mortgage credit to households has not really paused (Rohde, 2015), to a large extent replacing bank lending. However, the overall household debt to income ratio has decreased, reflecting a shift from bank lending to mortgage credit, and moderate deleveraging since the crisis (Figure 1.6, Panel B). Aggregate indebtedness has come down modestly (Figure 1.6, Panel A). Given past trends, the authorities do not expect much debt reduction to take place, arguing that part of the explanation for the indebtedness is increasing pension assets of the households. Some supply side measures to limit credit growth are already in place, e.g. loan-to-value ratios (LTV): 80% for residential properties, 70% for agriculture, 60% for commercial properties and secondary residences and 40% for plots. This is welcome since such instruments are effective (Tressel and Zhang, 2016). Nevertheless, the current practice is that while the mortgage credit bank respects the LTV ratio, a bank loan is usually arranged to cover the remaining house value. As of November 2015, best practice guidelines issued by the regulator recommend a down-payment of at least 5% of the property value, which is welcome.
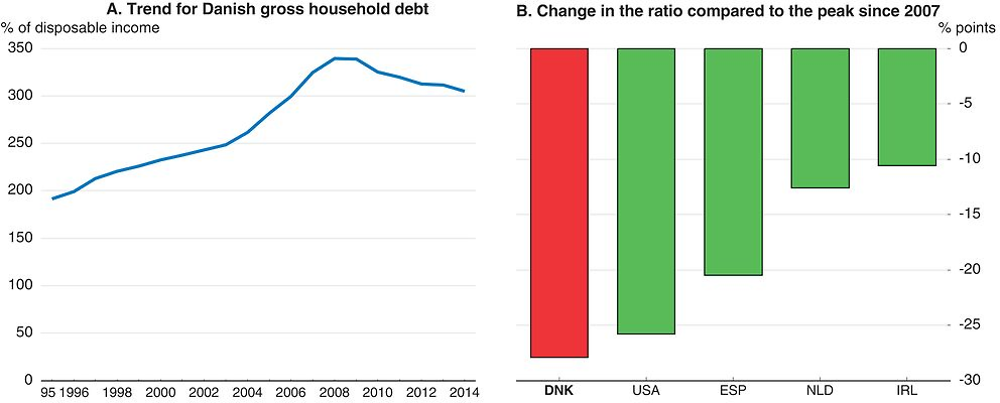
Source: OECD, Analytical database.
Seven best practices for granting an owner-occupied mortgage were introduced earlier this year by the supervisor for areas with large price increases (i.e. Copenhagen and the city of Aarhus), in addition to the general rule that borrowers should be able to afford the mortgage with 30 year fixed rate of at least 4% and/or one percentage point above the market rate. These practices require for instance that borrowers with debt-to-income ratios above 5 should have positive net wealth even if property prices fall by 25%, and borrowers with two mortgaged properties should be able to service the debt on both for at least one year. Other practices are aimed at commercial and housing cooperative borrowers. Such principles are sound and considerations should be given to extend some of them nation-wide, with modifications where necessary to account for regional differences. Given that the housing market is currently gradually recovering across the country, it is a good time to implement these measures.
The most recent housing market correction resulted in only limited arrears and forced sales, in particular when compared to the aftermath of the house-price correction of late 1980s (Andersen et al., 2014). Currently, the arrears (calculated as a percentage of payments more than three and a half months after the due date) stand at around 0.5%, while in the 1980s housing market correction they peaked at around 2.5% (Association of Danish Mortgage Banks, 2016). A similar picture emerges from statistics on forced sales too. Flexible interest rate setting and the current ultra-loose monetary policy act as a temporary buffer. Nevertheless, the loan impairment charge ratio for owner-occupied homes is higher for high LTV ratios (Systemic Risk Council, 2015).
Measures such as the best practices mentioned above are primarily aimed at safeguarding the balance sheets of the financial sector. However, there is a macroeconomic risk of households taking on too much debt, in particular during boom years, when credit standards tend to be relaxed and not all households make sound financial decisions. Looking at the most recent boom-bust housing cycle, Andersen et al. (2012) show that the highest median debt-to-income ratio was among those with loans with variable-rate with deferred amortisation. Meanwhile, debt-to-income ratios of families with fixed-rate mortgages with amortisation was half of that. More than half of families with mortgages had a variable rate and/or deferred amortisation type of loan and those with deferred amortisation tended to take out higher debt, while at the same time have lower savings than those with amortising loans. A study of the Ministry of Business and Growth showed that among the families with at least one mortgage, around 5% had debt service to income ratio of 40% and more
Further demand-side measures should be also considered. The lending limits do not contain debt in relation to incomes, especially when house values are rising faster than incomes. Furthermore, households can use unsecured, secondary loans to come up with the down payment for the mortgage. In the Danish case there is a tax incentive as interest rate cost on other credit is also deductible from personal income tax. In order to protect households from excessive leverage, it would be worth combining existing LTV ratios with binding debt service-to-income ratio limits (DSTI). The financial industry best practices has been to use of a debt-service-to-income check, requiring that the borrower is able to afford the mortgage assuming a 30-year fixed rate (and a stricter version of this for so-called hotspot areas, as mentioned above), though in the current low-interest environment this can have a limited effect, not to mention that as a “best practice”, it is a soft tool. The use of this debt-service-to-income ratio should be further strengthened and consideration should be given to imposing specific limit. Such tools are in place in a number of countries, such as the United States, the Netherlands or Canada, and can help to curb excessive demand for mortgage credit and address circumvention of LTV ratios caps through secondary loans.
Debt is high, but affordable
Low interest rates are a boon to indebted households
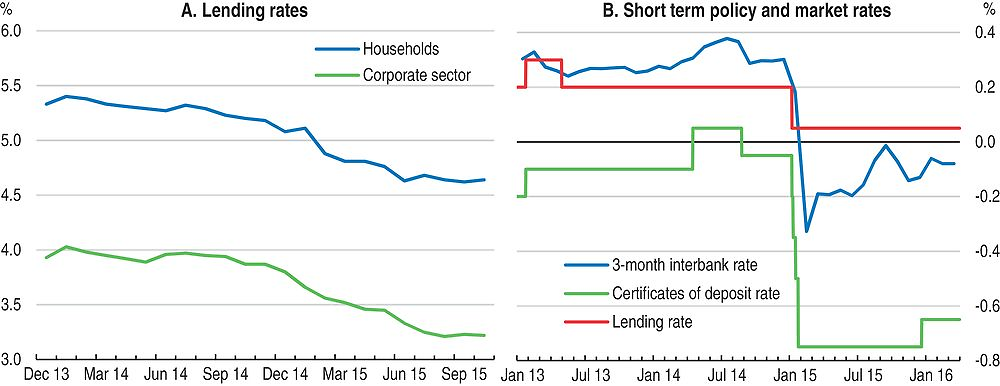
Current low interest rates help households to lower their debt-service obligations. Household debt – at 130% GDP – is of the highest among OECD countries also in terms of disposable income, albeit they also hold large assets, most of which are illiquid (Figure 1.7). Significant indebtedness has been the case since 1970s and although the debt has come down somewhat following a housing market correction of the late 1980s, Denmark has ranked the highest in the region in terms of household indebtedness. Some three quarters of total lending to households has a variable interest rate, which means that as interest rates plunged, debt-servicing obligations also fall (Figure 1.8). As André (2016) points out, household debt stands at a historically high level in most OECD countries. Aggregate household debt alone does not indicate serious risks, but rapid increases in debt, often associated with housing booms, can suggest upcoming adverse economic and financial developments, as experienced recently with the build-up to and during the global financial crisis. Even in the absence of a direct impact of adverse shocks – such as falls in housing prices, drops in household income or increases in interest rates – on the financial system, high household debt can amplify the business cycle, as households adjust consumption to cope with their financial obligations (André, 2016).
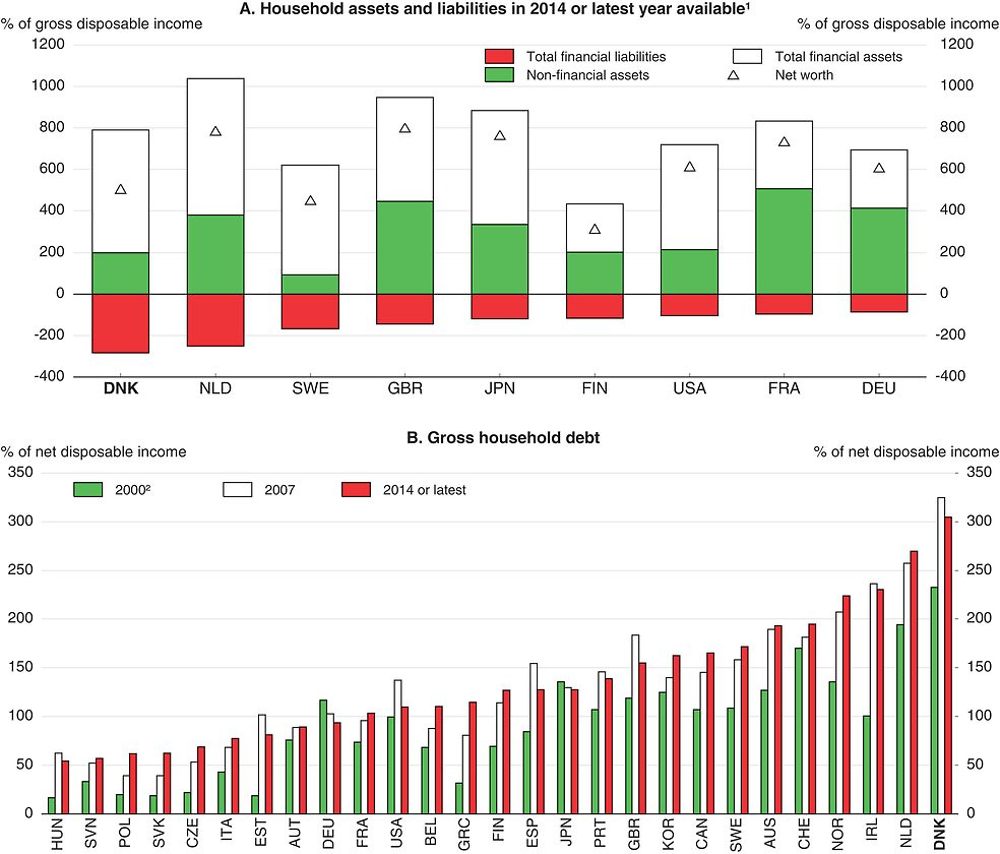
1. This decomposition is only available for these countries.
2. 2001 for Ireland and Slovenia, 2002 for Korea.
Source: OECD, Analytical database.
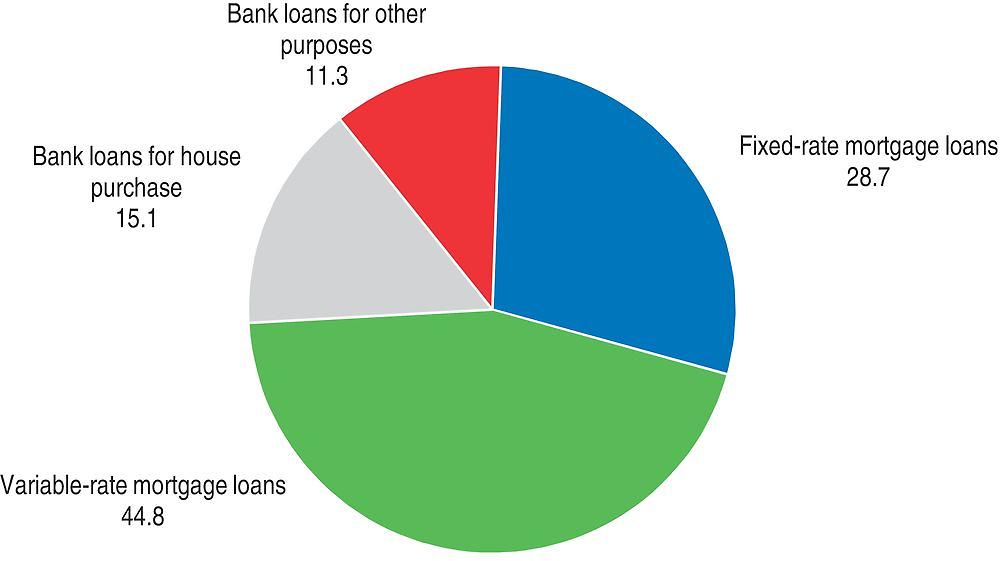
Source: Danmarks Nationalbank, Financial Stability, 2nd half 2015.
A large share of household debt is concentrated among high-income households (Figure 1.9). Andersen et al. (2012) show that the top three income deciles account for 70% of the debt stock. At the lower part of the income distribution, i.e. in the bottom three income deciles, the median family has no debt at all. Nevertheless, around a quarter of households in each of these deciles hold debt exceeding 80% of their net income. This is a significant increase compared to the situation in 2002 and the most pronounced increases were among the low-income: in the first four income deciles the debt stock increased by almost 100%. Furthermore, the debt stock has more than doubled among the elderly, i.e. households in which the oldest member is 60 years old and over. From a life-cycle perspective it may be reasonable for households take on debt while young, paying it off gradually over the life-time to smooth consumption inter-temporally, however, it is more difficult for older households to react to shocks.
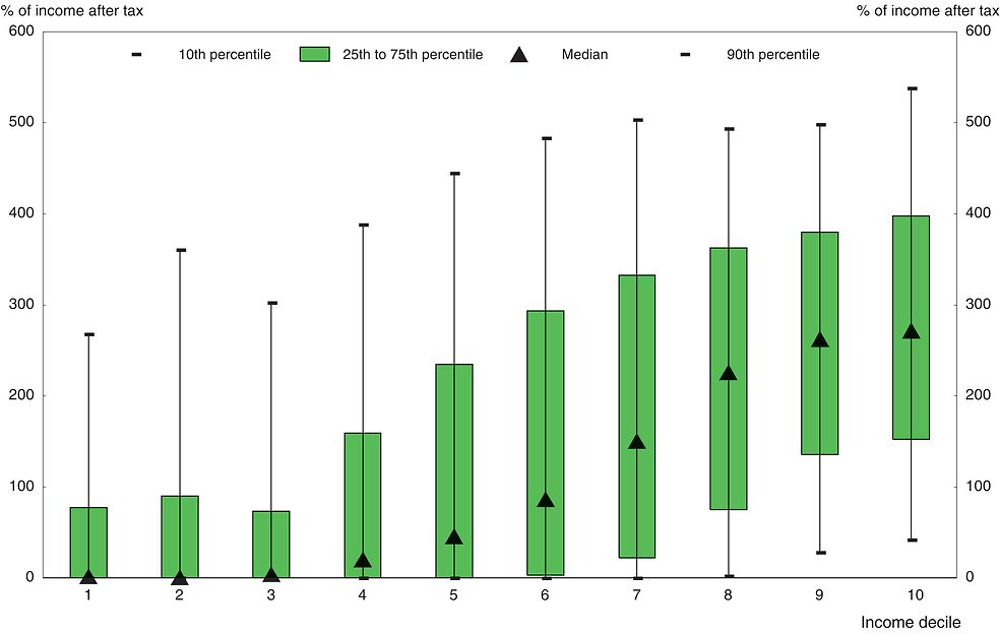
Note: A sample of households covers about 90% of families and 70% of the debt stock. It excludes self-employed and those with no or negative income tax.
Source: Danmarks Nationalbank.
While it is difficult to state when households become over-indebted, some authors put such threshold at three times the annual income, assuming that if one third of the income is saved, such a debt can be repaid within 12 years based on prevailing interest rates (OECD, 2015b). By this measure, some 23% of households in Denmark qualify as over-indebted. For the 18 OECD countries for which similar data are available, on average 11% of households are over-indebted, with Norway and the Netherlands having similarly high shares as Denmark (OECD, 2015b). Lunde (2016) illustrates that net-debt-to-housing-wealth ratios have been fairly stable over time, because the general increase in house prices was matched by increase in indebtedness. By this measure, around 20-25% of home owners have been “technically insolvent” at some point over the past 25 years, as first-time home buyers purchase their homes with nearly no down-payment. While during the housing market downturn of 1986-93, the number of foreclosures increased significantly, this time round the possibility to reduce interest rates helped to cushion the fall in their housing value (Lunde, 2016). Andersen et al. (2012) simulate a number of stressful situations for the households: an interest rate shock (i.e. a temporary jump in interest rates by 5 and 9 percentage points), temporary loss of income (3 and 6 months of unemployment) and an end of deferred amortisation period. None of these would result in an increase of default rates that would pose a threat to the financial stability. A more recent update of the simulations confirms such conclusion (Danmarks Nationalbank, 2015b).
Risks in the financial sector should be addressed now
The Danish financial sector holds assets of over 500% of GDP, and is one of the most concentrated in Europe (Danmarks Nationalbank, 2014a) (Figure 1.11). It is highly developed and thus appropriately suited for intermediating income and wealth across time, an essential function in an ageing economy. As noted already, on the savings side, the Danish population has one of the largest savings in funded quasi-mandatory occupational pension schemes among OECD countries (140% GDP). On the other side of the households balance sheet, a well-established mortgage market allows households to borrow at competitive interest rates. Some ¾ of households have debt, and in aggregate their debt is one of the largest in the OECD (at 130% of GDP). While such a set up bodes well in terms of consumption smoothing, savings diversification and access to credit, there are also risks involved.
-
Financial vulnerabilities have receded since 2007 (Figure 1.10), nevertheless international reach, interconnectedness, and reliance on short-term financing exposes the Danish financial institutions to developments in external financial markets. Size and interconnectedness represent a systemic risk that needs to be managed by rigorous oversight and regulation.
-
Large balance sheets make Danish households sensitive to interest rate and housing market developments. Currently, this does not seem to pose a financial stability threat, but vulnerabilities could rise. Given the on-going current recovery of the housing market, this is an opportune time to eliminate a pro-housing bias in taxation and lending practices that generate pro-cyclical distortions of the policy setting.
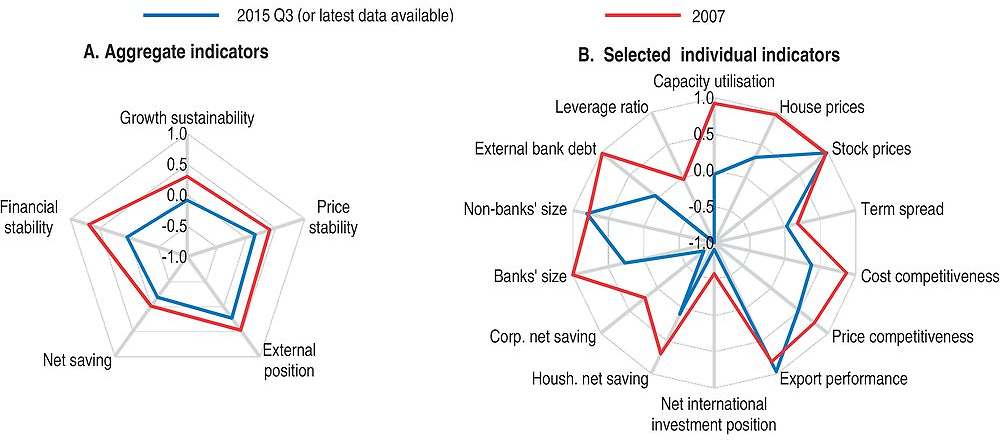
Note: Each aggregate macro-financial vulnerability indicator is calculated by aggregating (simple average) normalised individual indicators. Growth sustainability includes: capacity utilisation of the manufacturing sector, total hours worked as a proportion of the working-age population (hours worked), difference between GDP growth and productivity growth (productivity gap), and an indicator combining the length and strength of expansion from the previous trough (growth duration). Price stability includes: the average of overall inflation and core inflation (consumer prices), the average of house prices-to-rent ratio and house prices-to-income ratio (house prices), stock market index for all Danish shares adjusted by nominal GDP (stock prices), and the difference between long-term and short-term government bond interest rates (term spread). External position includes: the average of unit labour cost (ULC) based real effective exchange rate (REER), and consumer price (CPI) based REER (cost competitiveness), relative prices of exported goods and services (price competitiveness), export performance and net international investment position (NIIP). Net saving includes: government, household and corporate net saving. Financial stability includes: banks’ size as a percentage of GDP, non-banks’ size as a percentage of GDP, external bank debt as percentage of GDP, and capital and reserves as a proportion of total liabilities (leverage ratio).
Source: OECD calculations based on OECD (2015), OECD Economic Outlook: Statistics and Projections (database), December and Thomson Reuters.
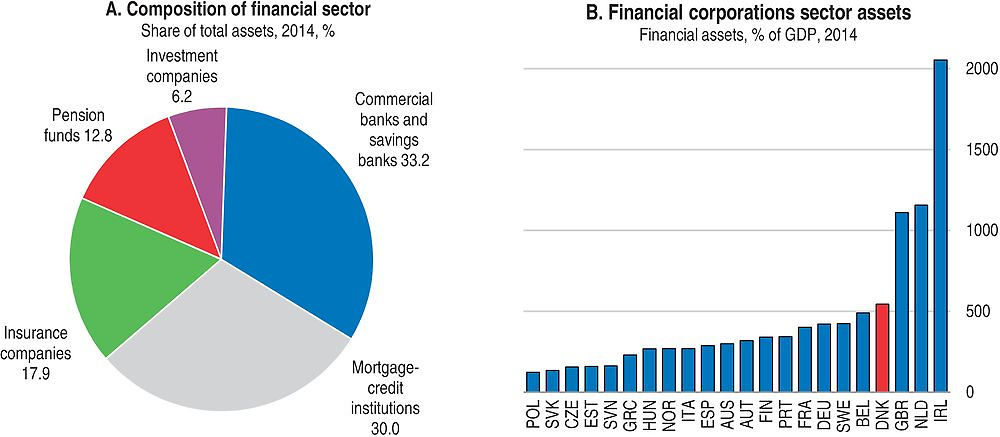
Source: DFSA, OECD National Accounts Statistics.
Following the Great Recession, the size of the financial sector has come to fore of the general economic debate. While a big financial sector had been previously seen as a sign of high and effective financial intermediation contributing to the efficient allocation of resources, the crisis led to a more critical view on the role of the sector. A question of “too big” and beyond a certain threshold actually harmful impact on economic growth has been raised (Cournede et al., 2015). Some authors point to the infinite capacity of banks to create new credit, money and purchasing power that is used for the purchase of finite and scarce supply of urban land thereby leads to self-reinforcing credit and asset- price-cycles of boom and bust (Turner, 2015). Others (Jones, 2015) claim that a rapidly growing asset management industry tends to contribute to pro-cyclicality and financial instability. This is due to inherent institutional features of the principal-agent relationship between the owners and asset managers that are strongly linked to remuneration incentives in the industry. As a result of these incentives, assets management firms lend themselves towards herding and “rational bubble-riding”. Such debates are of particular relevance for Denmark, given the size and depth of the financial sector, and the recent global downturn serves as a reminder that the financial sector can act also as a propagator of shocks, rather than an absorber, undermining robust growth.
Size and interconnectedness create significant implicit liabilities
The sheer size and interconnectedness of the financial sector pose a systemic risk. Two thirds of the assets are held by the banks and so-called mortgage credit banks. The life insurance sector also plays an important role since it provides many occupational pension plans (IMF, 2014). A significant share of the pension savings (on average around 40% over past 10 years) is invested in domestic bonds, majority of which are covered mortgage bonds that account for around half of total lending in the economy. Thereby, there is a considerable interconnectedness within the financial sector, i.e. between the mortgage banks and pensions and insurance sectors. All in all, Danish investors hold over 80% of the covered mortgage bonds (Box 1.1) and while historically, the mortgage business model was conservative, recent financial innovation altered some of its basic features, adding new important risks (see below).
The Danish mortgage market has earned much praise both before and during the recent crisis (Campbell, 2012, Gyntelberg et al., 2012). It links borrowers directly to the issued bond and allows for early repayment with no penalties attached. Also, it is backed by a strong bankruptcy regime that is both fast and efficient, with personal liability for remaining outstanding credit.
To finance mortgage loans mortgage credit institutions (MCIs) issue callable covered bonds. They do not take deposits and have no access to money markets, but are exposed to credit risk, which has generally desirable incentive effects, while the interest rate risk is passed on to investors who buy these bonds. There is a large nationally diversified mortgage pool that is relatively liquid. Homeowners can pass on the mortgage when selling the property, or pre-pay it earlier by buying the bond in the same value with no penalty. The ability of home-owners to buy the mortgage bond can provide a source of liquidity in a crisis, when investors dump the bonds (Campbell, 2012).
The outstanding stock of the bonds represents DKK 360 bn, i.e. 150% GDP (in 2013), four times bigger than the government debt market. The product has a long and successful track record: it originated in the great fire of Copenhagen in the late 18th century and there has never been a default of an issuer in fact. Borrowers’ difficulties are dealt with in an efficient and fast repossession. For life-insurance companies they represent some 43% of assets, for non-life insurers 65%.
The issuers of covered bonds have to adhere to a specific “balance principle”. According to this principle a number of tests have to be passed at all times by the issuing institution otherwise the supervisory authority has to be notified. These effectively regulate interest rate risk, exchange rate risk, option risk and liquidity risk of the entity. Maximum loan-to-value (LTV) ratios are set, varying according to sector. There are also limits on maximum duration of the repayment period, including those of interest-only loans and a 30% portfolio limit on the share of high LTV loans will come to force in the future (see below).
Supervision is carried out by regular monitoring and publishing of a number of indicators, including a so-called supervisory diamond, that is being introduced also for mortgage credit institutions and contains a number of financial variables, such as lending growth, large exposures, loans with short term funding, lending to home-owners with deferred amortisation and interest rate risk of the borrower. These indicators will be in force as of 2018, except for the one on deferred amortisation and short-term funding, which will come into force in 2020.
Source: IMF, 2014, Danish Financial Supervisory Authority.
Resolution and crisis management
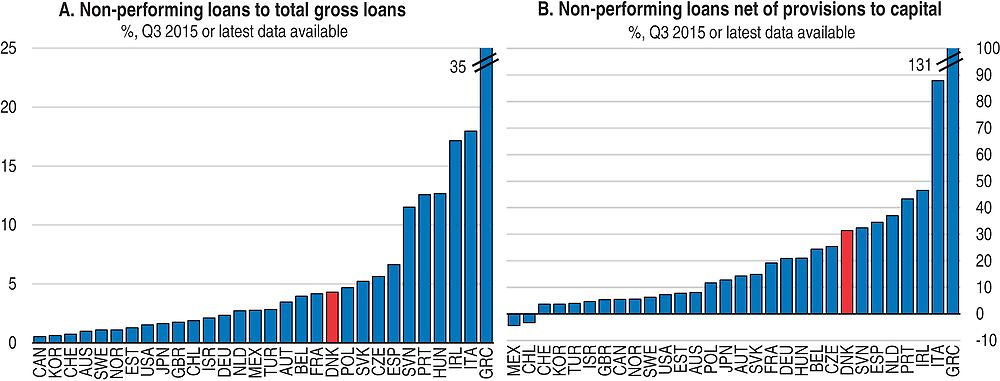
The large size of the financial sector creates important implicit liabilities for the public sector, highlighting the role of regulatory oversight and resolution mechanism. Following the global financial crisis, a number of new supervisory measures have been put in place (Box 1.2). Recent experience points to stable and strong foundations that helped to weather the recent downturn. The authorities acted decisively when the market liquidity became difficult, and the sector has gradually increased its capitalisation (Figure 1.12). The profitability of the banking sector has recovered among the big players, even if smaller banks continue to feel the weight of non-performing loans in the agriculture industry (Danmarks Nationalbank, 2015a).
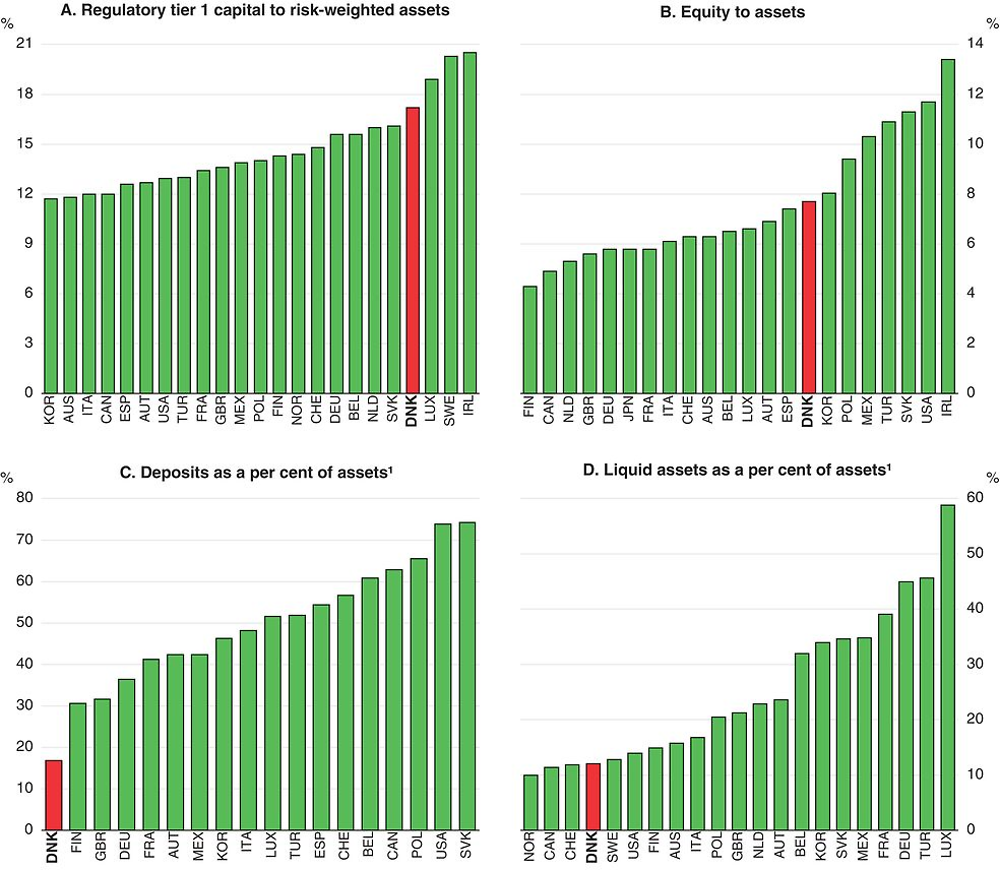
1. A significant share of the financial sector is formed by the mortgage credit institutions that by design do not take deposits. This affects the DNK ranking in Panels C and D.
Source: IMF, Financial Soundness Indicators database.
The crisis resolution consisted of several rounds of measures for strengthening financial stability during the downturn 2008-13, including so-called banking packages, comprising of a 2-year general government guarantee for deposits, public funding, a new resolution regime with important bail-in features and more stringent solvency requirements for distressed systemic institutions (IMF, 2014). All in all, 12 financial institutions were resolved over that period, with most of the cost falling on the banking sector.
Although the institutional setup of crisis management and resolution is complex (Box 1.2), it worked well during the financial crisis. Concerns have been raised about the clarity of the roles of the various agencies participating in the process and the need for formalisation of their interaction (IMF, 2014). For instance, the Financial Stability Company assesses, together with the Financial Supervisory Authority, whether the structure of a financial institution allows for orderly resolution. Such shared competencies may lead to fragmented accountability and a risk of deploying insufficient measures (Danmarks Nationalbank, 2014b).
The Danish Coordination Group is a strategic and leading body for crisis management and inter-agency discussion forum established in 2005. Though it has no executive or legislative powers, it is at the heart of crisis management, as illustrated in the recent downturn. The group consists of representatives from: the central bank, Financial Supervisory Authority, Deposit Guarantee Scheme company, the Financial Stability Company (established in 2008 to wind-down failing banks and to become the ultimate resolution authority) and the government – Ministry of Business and Growth, Ministry of Finance, Ministry of Economy.
Resolution issues are dealt with indirectly by the Danish Financial Supervisory Authority (DFSA) that enforces minimum capital requirements. In effect, the DFSA deals with institutions that are “not failing or not likely to fail”. When minimum capital requirements are not observed, the distressed institutions’ management decides either on liquidation, sale or a transfer to the Financial Stability Company. There is no one designated resolution authority with operational independence, robust governance structure and well-defined accountability that would have powers to effect forced mergers and recapitalisation, implement bail-ins and appoint special administrators to restore the firm, considered good international practices (IMF, 2014). The central bank acts as a lender of last resort, providing emergency liquidity assistance, and gets consulted on resolutions plans of SIFIs.
The Deposit Guarantee Company is funded ex-ante by the financial industry, with an annual contribution of 0.25% of net covered deposits. As in other EU countries, the coverage is provided up to EUR 100 000. It is run by a board of directors, whose members are appointed by the Ministry of Business and Growth, with a half of the members representing the financial industry. The IMF points to a potential for improvements such as removing financial industry representatives from the board, introducing risk-based premiums and explicit funding backstop by the government, a depositor preference scheme and limiting overdue financial obligations, as established by the international best practices.
The Resolution Fund must be built-up to 1% of all institutions’ covered deposits (currently around DKK 7 bn) and funded on an on-going basis by the financial industry. The funds role is to guarantee assets and liabilities of those under resolution, grant loans and buy assets to provide capital to so-called bridging institutions. After a bail-in has been applied, the fund can also be used to a limited extent for recapitalisation and loss absorption.
Source: Denmark – Financial System Stability Assessment, IMF, 2014. Danmarks Nationalbank (2015).
Supervision and oversight
Financial sector stability is a shared responsibility of the Danish Supervisory Authority (DFSA) and the central bank. Supervision is carried out by the DFSA that oversees both the banking and insurance sectors, while responsibility for the payments system is with the central bank. The DFSA is part of the Ministry of Business and Growth and is accountable to the minister, who appoints its seven board members. Nevertheless, the DFSA also acts as a secretariat to other inter-agency bodies, such as the Financial Business Council, Money and Pensions Panel and Danish Securities Council, established by the Parliament, which determine a considerable share of its work. A Systemic Risk Council was established in 2013 and tasked with monitoring, identifying and contributing to limiting of systemic risks and the central bank acts as a secretariat for the council’s work. The council has 10 members, mainly from the administration but it also includes three independent experts. The council issues observations, warnings and recommendations to the DFSA and the government, who then have to “comply or explain” and most of the decisions and explanations are published, while voting rules ensure that the representatives of the government do not vote when warnings and recommendations are directed at the government. A review of the functioning of the Systemic Risk Council is planned for 2016.
There are six systemically important banking and mortgage credit groups (SIFIs), the biggest of which (Danske Bank) holds assets of 180% of GDP. They face additional capital requirements that are gradually phased in during 2015-19, notably the so-called SIFI buffer. Regular stress-testing carried out by the central bank shows all the SIFIs have substantial excess capital relative to the current minimum requirements, and five of them vis-à-vis the regulatory requirements in place until 2017, i.e. the horizon of the most recent stress-testing exercise. A number of smaller banks continue to be affected by high impairment charges in the agricultural sector, though stress tests show that even in case of severe recession and deterioration of the banks’ capitalisation, they do not pose any threat to financial stability (Danmarks Nationalbank, 2015a).
Source: IMF, Financial Soundness Indicators database.
EU’s recent legislation (Bank Recovery and Resolution directive – BRRD and CRD IV) that came into force in 2015 introduced new tools for management of the SIFIs. This includes up-to-date and extensive recovery and resolution plans that have been submitted to the regulator in 2015 (for SIFIs) and early 2016 (for the rest of the sector). At the moment, the Financial Supervisory Authority can for instance impose limitations on dividend payments if a SIFI does not fulfil certain thresholds (i.e. total capital requirement consisting of the minimum, pillar II add-on and capital buffer). The main objective of much of the new legislation after the Great Recession, in the EU and elsewhere, is to limit the implicit liability of public finances to the financial sector. Bail-in clauses, industry-funded resolution funds and higher capital requirements should go a long way in decreasing the potential implicit liabilities, although the effectiveness of the new regulatory framework will only show in a crisis situation. The new bail-in rules however do not apply to the mortgage credit institutions. Since they do not have to comply with the requirement to hold eligible liabilities, the authorities do not have the same tools for handling a failing institution. Instead, a requirement to hold a “debt buffer” corresponding to 2% of their lending will be introduced.
Cross-border reach is always challenging to regulate
Danish banks also have an important presence abroad, mainly in the Nordic and Baltic region but also in the United Kingdom. Danske Bank’s lending and deposit market shares are between 5-10% in the region. The second largest domestic bank, Nordea, is based in Sweden and is also one of the global systematically important banks. In practice, this means that it has to comply with higher loss absorbency requirement as of January and is a subject to group-wide resolution planning and resolvability assessments, which have to be reviewed annually by the Financial Stability Board. The high interconnectedness of the Nordic financial sector makes Denmark vulnerable to developments elsewhere. A network spill-over analysis shows that extreme credit and funding shocks to banks in Norway, Sweden and Finland would have a large impact on baking sector stability in Denmark, and vice-versa (IMF, 2014).
Cross-border activities can pose a risk, notably in case of regulatory arbitrage. Lending of Danish banks to Sweden’s and Norway’s housing markets is of a considerable size, some DKK 370 billion (Danmarks Nationalbank, 2015a). Cross-border cooperation among the Nordic countries has been exemplary so far and Denmark is a member of the European Systemic Risk Board. Nevertheless, there is a scope for further improvement such as further harmonisation of the bail-in requirements, establishment of firm and institution specific crisis management groups and ensuring that foreign resolution mechanism work (IMF, 2014).
Denmark is contemplating membership of the emerging euro area banking union, but Sweden and Norway are not, so scope for regulatory arbitrage and differential treatment could persist. The main attractions of the banking union membership are stronger supervision of the largest financial players and a reduction of risk of political interference. Moreover, the broader scope of the single supervision can enable it to track trends across many large credit institutions, allowing for an early identification of build-up of risks (Danmarks Nationalbank, 2014c). Regulatory treatment of the covered bonds, the cornerstone of the Danish financial system, is currently under discussion, both at the global and European level. The outcome of these negotiations is likely to tilt the balance for or against the EU banking union membership.
Innovation and tightening of regulation can be pro-cyclical
Financial innovation of recent decades resulted into a maturity mismatch between funding and borrowing poses another risk (IMF, 2014). The financing model of the mortgage credit banks has evolved from historical practice: short maturity funding increased in importance to fund long-term loans and is currently the norm. During the crisis, the central bank had to intervene to ensure adequate funding of mortgage lenders (Campbell, 2012). Also, an industry agreement between the government and the pensions sector was reached to prevent fire-sales of mortgage bonds (Lunde, 2016). More recently, the authorities introduced a new supervisory tool (the supervisory diamond – see Box 1.1) for mortgage institutions and refinancing is increasingly spread to several occasions throughout the year (as opposed to one annual issuance of all mortgage credit institutions in the past). To reduce the risk of a failed re-financing case, legislation is now in place that automatically prolongs the financing by a year in case of interest rate increases of more than 5 percentage points (OECD, 2014a). This is welcome, given the importance of the covered bonds within the financial sector, as failed mortgage bond refinancing would have serious repercussions (OECD, 2014a).
New regulation, coming into force gradually, will also impact demand for holding mortgage bonds. For instance, wider use of leverage ratio (a ratio of unweighted exposures) means that mortgage bonds that typically have low risk-weights require more capital. Also, the liquidity coverage ratio stipulates how much and what kind of series of the mortgage bonds can be held by the financial institutions which can have an impact on certain bond issuances. Spreading out refinancing (mentioned above) helps to alleviate the pressure on market liquidity. Nevertheless, due to the ECB’s asset purchase programme, shrinking liquidity is currently affecting European covered bond markets more generally (Bloomberg, 2016). It remains to be seen whether this is a temporary issue that will be resolved with normalisation of European monetary policy.
The current very low interest rate environment is both a challenge and a boon to financial stability. On one hand it puts the traditional banking model under strain by increasing pressure on banks’ earnings. Also, it contributes to the volatility of asset prices, in the Danish case in particular to the property market (see below). One the other hand, it helps households lower their debt-service obligations, because a large share of the debt they hold has variable interest rates. The following section looks at the impact of the low interest rates in more detail.
No major change in earnings and risk appetite but challenging environment nevertheless
In response to the central bank’s rate cut at the beginning of 2015, market rates plunged even further into negative territory and on average the short-term interest rate was -0.12 during 2015. The central bank hiked the policy rate marginally at the beginning of this year, and it currently stands at -0.65 (Figure 1.14). At the same time as the central bank cut its rate further into the negative territory, it increased the current account limits that each bank (depending on the size) can deposit at the central bank. Total bank deposits rose to around 10% of GDP in early 2015, as a result of the rapid inflows into Danish krone assets despite negative rates (Goldman Sachs, 2016). With the foreign exchange pressures receding and the recent interest rate hike, the limits have been lowered again.
Source: Danmarks Nationalbank.
A recent banking survey showed no signs of increased cash holding by the financial sector and that the share of deposits with negative rate was small and slightly smaller than those with positive rate. The Danish banking sector is highly competitive and the corporate lending has been high prior to the downturn. Such an environment, in combination with the low interest rates, can lead to relaxation of standards in order to maintain and increase the customer base. Indeed, in the recent banking survey some medium-sized banks reported easing of credit standards, such as easing requirements for guarantees. At the same time, the authorities conclude that there is no major change in the earnings and risk appetite of the banks as compared to recent years of low but marginally positive rates. Banks’ income from fees has been on the rise since the financial institutions increased charges for mortgage and loan intermediation, compensating to some extent the fallout from net interest income (Danmarks Nationalbank, 2015b).
Ongoing structural shifts in the pensions and insurance sector
Low interest rates are more of a challenge in the insurance and pensions sector. The Danish population holds substantial pension assets of 140% of GDP, one of the highest in the OECD. Contributions are in the range of 12-18% of the salary shared equally between the employee and the employer, negotiated and set by collective agreements that cover large majority of the working age population. Low and declining interest rates can affect the adequacy of the retirement income by reducing the amount of assets accumulated and increasing annuity prices (OECD, 2015a). Provisioning of the second pillar pension schemes, where traditional life annuities with a guaranteed interest rate are the major product, is ensured by pension funds and life insurance companies.
The insurance industry itself has been moving towards non-guaranteed products, in particular during recent years, including in existing contracts. Both solvency ratios and return on equity were hit during the downturn, reaching their lows in 2011, but have been recovering since. The downturn provided the industry an opportunity for a structural shift away from the guaranteed products. By 2012, in terms of premiums (i.e. contributions) the guaranteed and unit-linked products had both equal shares. Nevertheless, in terms of liabilities, around 80% is tied to guaranteed plans, with the average guaranteed interest rate of the four biggest life insurers at 2.7% in 2014 (IMF, 2014).
Overall, the Danish pension funds perform well. Despite the financial crisis, real returns of autonomous pension funds (that represent around 50% of GDP, i.e. excluding pension insurance contracts) were close to 5% over the past ten years (OECD, 2015a). Search for yield does lead some of the pension funds into alternative investments such as real estate, infrastructure, and direct and indirect lending to companies. For instance, in 2015, three of the largest pension funds created a new subordinate loan fund for Danish SMEs. In fact, this is a part of a longer-term trend in the financial industry (OECD, 2015a). Over the past ten years considerable share of pension investments have moved away from bills and bonds as well as equities in Denmark into so-called alternative asset classes, such as loans, land and buildings, other mutual funds, unallocated insurance contracts, hedge funds etc. Nevertheless, the share invested in bond and bills in the autonomous pension funds stood still at 60% in 2014 (Figure 1.15). Given the size and interconnectedness of the sector to the rest of the financial system, the IMF recommended that the insurance and pensions institutions are included in the authorities’ financial stability analyses, in particular in the macro-prudential stress testing.
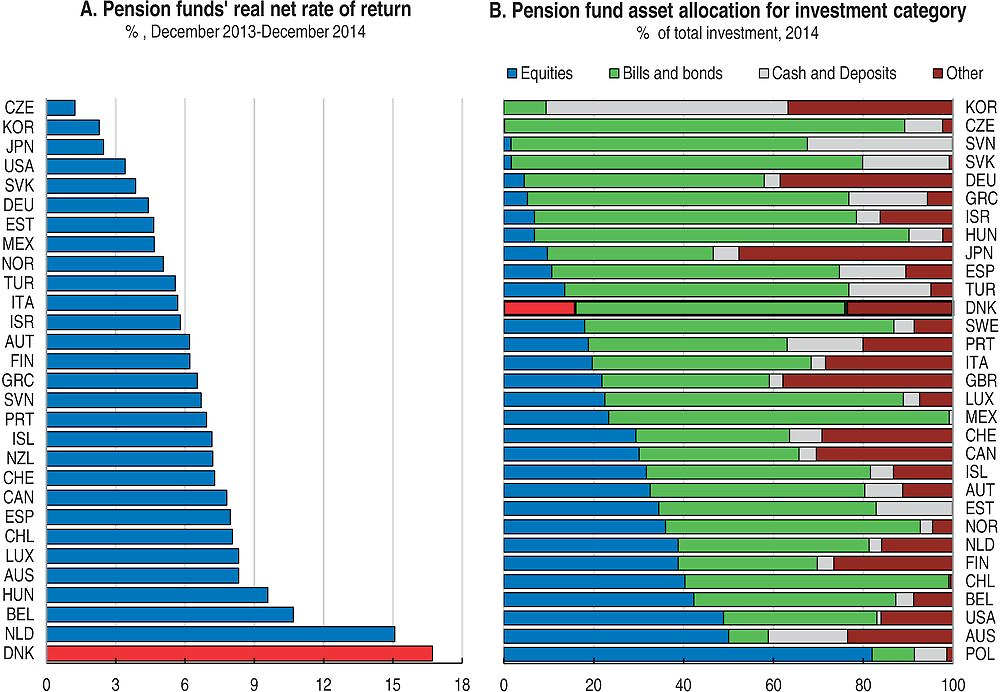
Note: The data refers to autonomous pension funds, which include all pension plan types managed by pension funds (occupational, personal, defined benefit and defined contribution plans) but excludes pension insurance contracts, which represent most of the private pension assets in some countries, such as Denmark and France.
Source: OECD Pension Markets in Focus No.12, 2015.
Resource misallocation and increasing inequalities undermine inclusive growth
A large financial sector can have wider implications, in particular in terms of resource allocation and income distribution. On average, financial sector workers receive a substantial wage premium, or earnings in excess of their profile. Denk (2015) shows that the European wage premium was on average 23% in 2013 and while Denmark was not part of the study, other estimates put wage premium between 10 and 20% (Abildgren et al., 2013), comparable to the levels estimated for other Nordic countries. A sector specific payroll tax was introduced in 1988 and currently stands at 10.9%. Cournede and Denk (2015) find a negative relationship between finance and income equality and also that credit is a stronger drag on long-term growth when it goes to households rather than business. Previous Surveys pointed to SME access to credit and low venture capital as an issue (OECD, 2012).
Inequality receives a lot of attention in Denmark. It has one of the lowest Gini coefficients in the OECD and it is possible that the current housing market policies and size of the financial sector contributed to the recent increase in inequalities. Based on the assumption that changes in intermediated credit are proportional to changes in financial sector employment and using the above mentioned wage premiums, Cournede and Denk (2015) estimate that increase in intermediated credit by 10% of GDP is associated with the increase in the Gini coefficient 0.13 points. Given such a channel, the income inequality has increased with the increasing number of people working in the Danish financial sector and collecting wage premia, despite the sector-specific payroll tax.
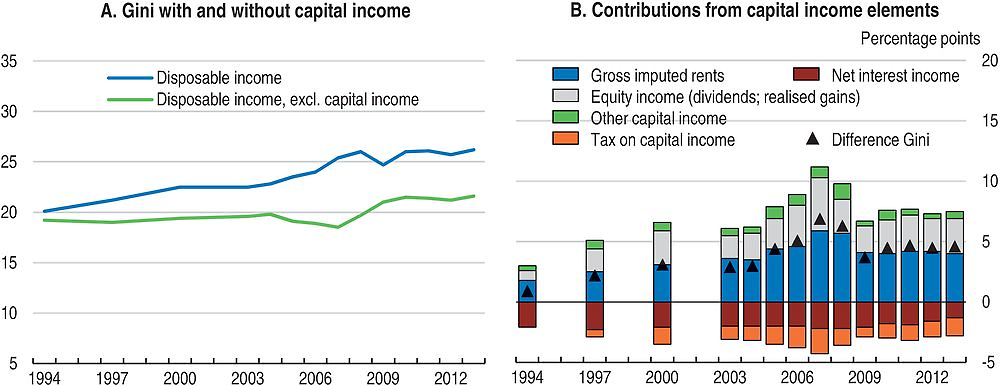
Causa et al. (2016, forthcoming) find a similar, inequality increasing impact of growing financial sector size in general. Approximated by value added of finance in the economy they find that it is associated with higher inequality (Figure 1.16). Moreover, various tax exemptions on owner-occupied housing and increases in house prices in general would have contributed to income growth of the better off, since home-ownership is more frequent for this part of the income distribution. Some studies attribute much of the rise on inequality to capital income (Figure 1.17) (Ministry of Economic Affairs and the Interior, 2015). Though in part this may be an issue of accounting for imputed rents, the sharp rise in house prices would have benefitted house-owners, particularly those in sought-after areas (Causa et al., 2016, forthcoming).
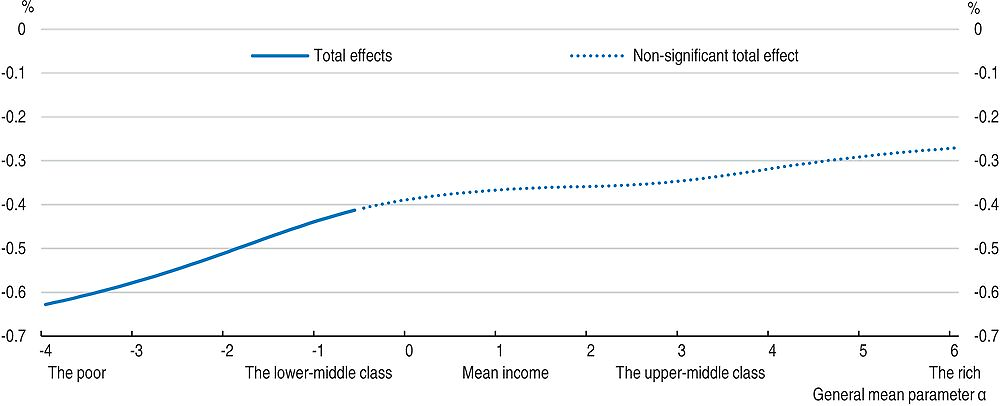
How to read this figure: An increase in value added for the financial sector (in per cent of GDP) by 1% is estimated to decrease household disposable income by 0.4-0.6% on average among the lower-middle class and the poor. This total effect can be decomposed along a direct and indirect effects through labour productivity, however in this case it is estimated to be insignificant. Non-significant estimates (at the 10% level) are indicated by dots on general mean curves.
Source: Causa et al., 2016, forthcoming.
Source: Ministry of Economic Affairs and the Interior (2015).
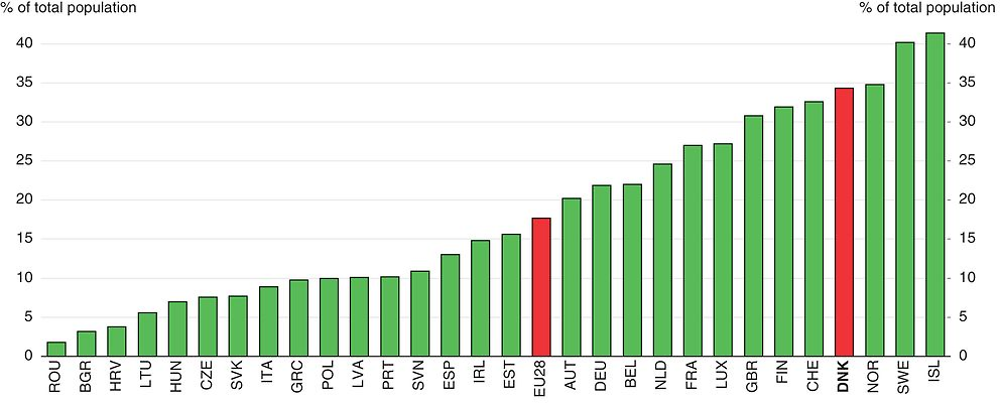
House ownership can impede labour mobility when transaction costs are high and in periods when housing market correction creates potential lock-in effects. Denmark ranks well in terms of residential mobility (Figure 1.18); also, transaction costs are low (Andrews et al., 2011). Moreover, in principle, the mortgage system does not impede mobility. Borrowers are allowed to pre-pay their mortgage at face value without penalty or can end their mortgage by buying a mortgage bond. Mortgages are typically assumable, so that new homeowners can take on mortgage from the movers (Campbell, 2012). This allows for significant flexibility in the mortgage market.
Source: Eurostat database.
While such a mechanism works in good times, when house prices fall, households can find themselves with negative equity and unwilling to sell at a loss. Data for United States confirm that with the rise of the number of households with negative equity, mobility between 2005 and 2009 declined by some 15%, concentrated among homeowners with mortgages and particularly the most leveraged ones (Andrews et al., 2011). Up to a third of existing mortgages had negative equity at the end of 2011 in Denmark (Ministry of Business and Growth, 2012) and as already mentioned, some estimates show that up to a quarter of families with mortgage are technically insolvent at any point in time over past 25 years. This is a result of existing practice where young families buy dwellings with almost no down payment (Lunde, 2016). Such situation can exacerbate regional disparities, in particular when the housing market is volatile.
Bibliography
Abildgren K. et al. (2013), “Productivity and Cost-Efficiency in the Danish Financial sector”, Monetary Review, 4th Quarter 2013, Danmarks Nationalbank, Copenhagen.
Almy, R. (2014), “Valuation and Assessment of Immovable Property”, OECD Working Papers on Fiscal Federalism, No. 19, OECD Publishing, Paris, https://doi.org/10.1787/5jz5pzvr28hk-en.
André C. (2016), “Household Debt in OECD countries: Stylised Facts and Policy Issues”, OECD Economics Department Working Papers, No. 1277, OECD Publishing, Paris, https://doi.org/10.1787/5jm3xgtkk1f2-en.
Andersen A., C. Duus, and T. Jensen (2014), “Household Debt and Consumption During the Financial Crisis : Evidence from Danish Micro Data”, Danmarks Nationalbank Working Paper No. 89, Copenhagen.
Andersen A. et al. (2012), “Danish Families’ Robustness, Variable Rates and Deferred Amortisation”, Monetary Review, 4th Quarter, 2012, Part 1 and Part 2, Danmarks Nationalbank, Copenhagen.
Andrews, D. and A. Caldera Sánchez (2011), “Drivers of Homeownership Rates in Selected OECD Countries”, OECD Economics Department Working Papers, No. 849, OECD Publishing, Paris, https://doi.org/10.1787/5kgg9mcwc7jf-en.
Arnold, J. (2008), “Do Tax Structures Affect Economic Growth? Empirical Evidence from a Panel of OECD countries”, OECD Economics Department Working Papers, No. 643, OECD Publishing, Paris, https://doi.org/10.1787/236001777843.
Association Danish Mortgage bank (2016), www.realkreditraadet.dk/Statistics/Arrears.aspx
Blöchliger et al. (2015), “The Stabilisation Properties of Immovable Property Taxation: Evidence from OECD countries”, OECD Economics Department Working Papers, No. 1237, OECD Publishing, Paris, https://doi.org/10.1787/5js0cqq93djg-en.
Bunn (2014), “Household Debt and Spending”, Quarterly Bulletin 2014 Q 2014, Vol. 54, No. 3, Bank of England.
Caldera, A. and Å. Johansson (2013), “The Price Responsiveness of Housing Supply in OECD Countries”, Journal of Housing Economics, Vol. 22 (3), pp 231-249.
Campbell, J. (2012), “Mortgage Market Design”, Review of Finance, Vol. 17, pp 1-33.
Cournède, B. and O. Denk (2015), “Finance and Economic Growth in OECD and G20 Countries”, OECD Economics Department Working Papers, No. 1223, OECD Publishing, Paris, https://doi.org/10.1787/5js04v8z0m38-en.
Caballero C., P. Pontuch, and A. Kalantaryan (2015), “Rental Market Regulation in the European Union”, European Economy, Economic Papers, No. 515, April, Brussels.
Dam, A. et al. (2014), “A Multispeed Housing Market”, Monetary Review 3Q 2014, Danmarks Nationalbank, Copenhagen.
Dam, A. et al. (2011), “The Housing Bubble that Burst: Can House Prices be Explained? And Can their Fluctuations be Dampened?”, Monetary Review 1Q 2011, Danmarks Nationalbank, Copenhagen.
Danmarks Nationalbank (2014a), Financial Stability – 2nd half of 2014, October, Copenhagen
Danmarks Nationalbank (2014b), Response to Consultation of Two Bills Concerning Restructuring and Resolution of Certain Financial Enterprises, October, Copenhagen.
Danmarks Nationalbank (2014c), Danish Participation in the Banking Union, http://www.nationalbanken.dk/en/publications/Documents/2015/01/Danish%20Participation%20in%20the%20Banking%20Union_Mon4-2014.pdf, Copenhagen.
Danmarks Nationalbank, (2015a), Financial Stability – 1st half of 2015, Danmarks Nationalbank, Copenhagen.
Danmarks Nationalbank, (2015b), Financial Stability – 2nd half of 2015, Danmarks Nationalbank, Copenhagen.
de Boer, R. and R. Bitetti (2014), “A Revival of the Private Rental Sector of the Housing Market?: Lessons from Germany, Finland, the Czech Republic and the Netherlands”, OECD Economics Department Working Papers, No. 1170, OECD Publishing, Paris, https://doi.org/10.1787/5jxv9f32j0zp-en.
Denk, O. (2015), “Financial Sector Pay and Labour Income Inequality: Evidence from Europe”, OECD Economics Department Working Papers, No. 1225, OECD Publishing, Paris, https://doi.org/10.1787/5js04v5wjw9p-en.
Dynan K. (2012), “Is a Household Ddebt Overhang Holding Back Consumption?”, Brookings Papers on Economic Activity, Spring.
Eichholtz, P. and T. Lindenthal, (2014), “Demographics, human Capital and the Demand for Housing”, Journal of Housing Economics 26.
Goldman Sachs, (2016), “Negative Central Bank Rates and the Banking Sector – the Danish Example”, Goldman Sachs Economic Research.
Gyntelberg, J., K. Kjeldsen, M. B. Nielsen, and M. Persson (2012). The 2008 financial crisis and the danish mortgage market. In A. Bardhan, R. H. Edelstein, and C. A. Kroll (Eds.), Global Housing Markets: Crises, Policies, and Institutions. John Wiley and Sons.
Heebøll C. (2014), “Regional Danish Housing Booms and the Effects of Financial Deregulation and Expansionary Economic Policy”, Kraka, The Financial Crisis Commission.
IMF (2014), Financial System Stability Assessment – 2014, International Monetary Fund, Washington.
IMF (2015), Housing Recoveries: Cluster Report on Denmark, Ireland, Kingdom of the Netherlands – The Netherlands and Spain, International Monetary Fund, Washington.
Isaksen J. et al. (2011), “Household Balance Sheets and Debt – an International Country Study”, Monetary Review, 4th Quarter 2011, Part 2, Danmarks Nationalbank, Copenhagen.
Jones, B. (2015), “Asset Bubbles: Re-thinking Policy for the Age of Asset Management”, IMF Working Paper 15/27, International Monetary Fund, Washington.
Jorda O., P. Sularick and M. Taylor (2014), “Betting the House”, NBER Working Paper No. 20771.
Lauridsen J., N. Nannerup and M. Skak (2013), “House Prices and Land Regulation in the Copenhagen Area”, Journal of Property Research, No. 30:3, pp. 205-220.
Lunde, J., (2016), “Milestones in Danish Housing Finance since 1990”, in Lunde J., Ch, Whitehead (eds), 2016, Milestones in European Housing Finance, Wiley-Blackwell.
Mankiw, N. and D. Weil (1989), “The baby boom, the Baby Bust and the Housing Market”, Regional Science and Urban Economics, Vol. 19, May.
Mian A,, K. Rao and A. Sufi (2013), “Household balance sheets, consumption, and the economic slump”, Quarterly Journal of Economics, Vol 128, pages 1687-1726.
OECD (2006), Economic Survey: Denmark, OECD Publishing, Paris, https://doi.org/10.1787/eco_surveys-dnk--2006en.
OECD (2012), OECD Economic Surveys: Denmark 2012, OECD Publishing, Paris, https://doi.org/10.1787/eco_surveys-dnk-2012-en
OECD (2014a), Education at a Glance 2014: Highlights, OECD Publishing, Paris, https://doi.org/10.1787/eag_highlights-2014-en
OECD (2014b), OECD Economic Surveys: Spain 2014, OECD Publishing, Paris, https://doi.org/10.1787/eco_surveys-esp-2014-en
OECD (2014c), OECD Economic Surveys: Netherlands 2014, OECD Publishing, Paris, https://doi.org/10.1787/eco_surveys-nld-2014-en
OECD (2015a), Pension Markets in Focus, OECD, Paris, www.oecd.org/pensions/private-pensions/pensionmarketsinfocus.htm.
OECD (2015b), In It Together, OECD Publishing, Paris, http://dx.doi.org/10.1787/9789264235120-en.
Pedersen, E. and S. Sørensen (2009), “Business Cycle, Asset Prices, and Credit”, Danmarks Nationalbank, Monetary Review, 1th Quarter 2009, Part 2, Danmarks Nationalbank, Copenhagen.
Rohde L., (2015), Speech at the Annual Meeting of the Association of Danish Mortgage Banks, 1 October, Danmarks Nationalbank. Copenhagen.
Saita Y., Ch. Shimizu and T. Watanabe (2013), “Aging and Real Estate Prices: Evidence from Japanese and US Regional Data”, CARF F-Series CARF-F-334, Center for Advanced Research in Finance, Faculty of Economics, The University of Tokyo.
Salvi Del Pero et al. (2016), “Policies to promote Access to Good-Quality Affordable Housing in OECD countries”, OECD Social, Employment and Migration Working Papers, No. 176, OECD Publishing, Paris, https://doi.org/10.1787/5jm3p5gl4djd-en.
Sutherland D. and P. Hoeller (2012), “Debt and Macroeconomic Stability: An Overview of the Literature and Some Empirics”, OECD Economics Department Working Papers, No. 1006, OECD Publishing, Paris, https://doi.org/10.1787/5k8xb75txzf5-en.
Systemic Risk Council, (2015), Press Release of the Systemic Risk Council meeting, 15 December, Copenhagen.
Takáts, E., (2012), “Ageing and House Prices”, Journal of Housing Economics, Vol. 21, Issue 2, pp. 131-141.
Tressel T. and Y. Zhang (2016), “Effectiveness and Channels of Macroprudential Instruments: Lessons from the Euro Area”, IMF Working paper No. 16/4, Washington.
Turner, A. (2015), Between the Debt and the Devil: Money, Credit and Fixing the Global finance, Princeton University Press.
← 1. The statistical data for Israel are supplied by and under the responsibility of the relevant Israeli authorities. The use of such data by the OECD is without prejudice to the status of the Golan Heights, East Jerusalem and Israeli settlements in the West Bank under the terms of international law.