Chapter 2. Enhancing public sector efficiency and effectiveness1
Spending on public administration itself is relatively low and so are indicators of its performance. Challenges include wastage in public procurement, insufficient management of the investment cycle and high levels of staff turnover. This chapter considers ways of building on recent reforms, including better procedures for EU-financed projects and the new Civil Service Act, to raise the efficiency and effectiveness of the public sector. Performance monitoring is underused but could help drive improvements in service delivery. The structure of local government, which includes over 6 200 municipalities, exacerbates the challenges of the public administration by complicating co-ordination and stretching capacity. Accordingly, the second part of the chapter focuses on ways of improving the efficiency and quality of public service delivery and realising greater benefits from decentralisation.
The public sector has played an important role in increasing the well-being of the Czech population and shaping the convergence process over the past two decades. As part of the transition from central planning towards a market economy, it has provided public goods and services and a social safety net. Technological developments have been a driver of change and also provided solutions. The structure of administration has also shifted closer to the community, with a system of self-governing regions and municipalities and a network of joined-up municipalities between. Major reforms are currently underway to enable the public administration to meet changing demands and strengthen its role in the income convergence process.
Previous OECD Economic Surveys have focussed on the role of local government in increasing public sector spending efficiency as well as the pension and healthcare systems (OECD, 2006, 2011a). This chapter examines ways that the public sector and its administration can become more effective and in doing so, deliver better outcomes. Because the division of responsibilities between levels of government has a strong influence on public sector efficiency, the second part of the chapter focuses on ways to improve the effectiveness of the arrangements with and between sub-national governments.
Enhancing the effectiveness of public spending
Government spending represented around 43% of GDP in 2014, close to the OECD average of 45%. Given spending pressures outlined in the Assessment and Recommendations, it is crucial to ensure that funds are being allocated to types of spending with the greatest benefits taking into account future needs; for example, effective public investment can help speed up convergence in income and living standards. There is also scope to increase the efficiency of spending. Three interrelated sources of past inefficiencies that the government aims to improve are: (i) wastage in public procurement; (ii) inadequate and at times ineffective investment spending, including difficulties absorbing available EU funds; and (iii) poor human resource management in the public service (Office of the Government, 2015). Collection and publication of indicators of output is increasing, which combined with benchmarking and e-Government tools, can drive the quality of government services towards best practices faster.
Spending on public administration itself is relatively low, just under three-quarters of the OECD average (per capita and PPP-adjusted), which is in line with other CEE (Central and Eastern European) countries (Figure 2.1, Panel A). However, the performance of the public administration also appears to be relatively low, as indicated by regulation and corruption (which affect competition as well as wastage), the quality of justice and government efficiency. Estimates by Dutu and Sicari (2016) imply that the performance of the public administration could be improved by around one-third, holding spending constant (Figure 2.1, Panel B). Recognising this problem, the government’s Strategic Framework of the Development of Public Administration for 2014-20 aims to strengthen the policy-making environment, improve implementation and evaluation and shift the focus of the administration more towards outputs and outcomes (Box 2.1).
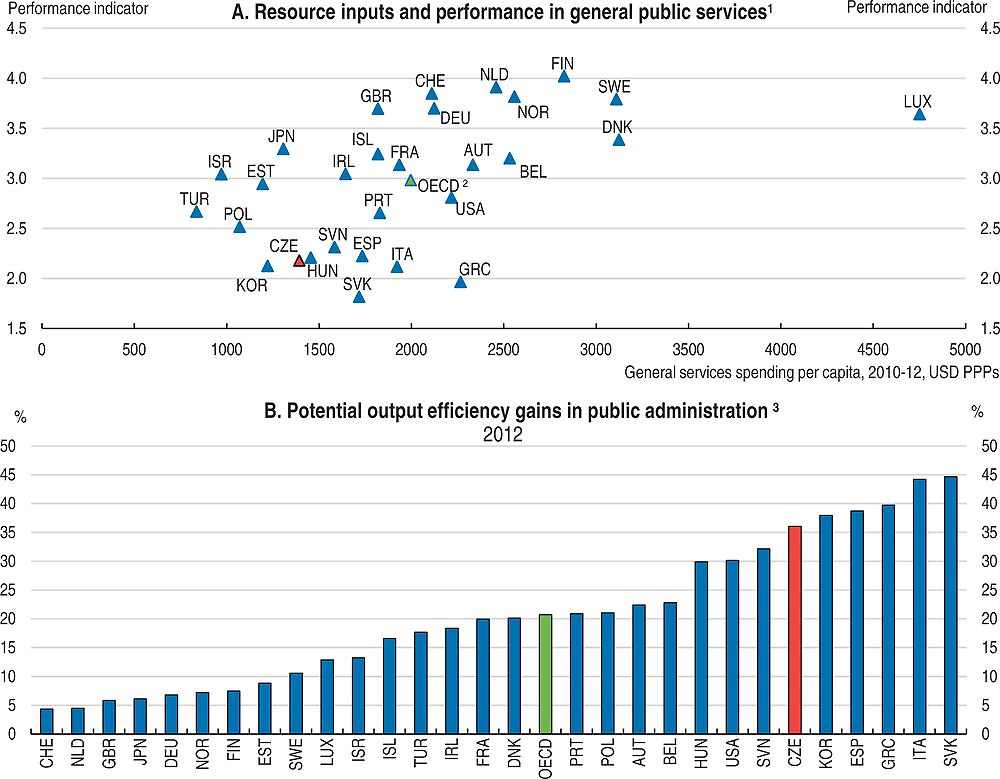
1. Composite performance indicator for public administration outcome based on OECD’s Product Market Regulation Indicator to proxy the levels of bureaucracy (33% of indicator) and results of the 2014 WEF survey on the quality of justice, level of corruption and government inefficiency. General services spending includes general public services, order and safety and excludes interest payments.
2. Unweighted average of data shown; excludes Australia, Canada, Chile, Mexico and New Zealand.
3. Potential gains are measured if efficiency in a country were to be raised to the level implied by the estimated efficiency frontier while holding inputs constant and under the assumption of non-increasing returns to scale. The frontier is calculated using data envelopment analysis based on one output (composite performance indicator) and two inputs (GDP per capita and public administration spending). Averages over the period 2010-12 were used for expenditure to capture its effects on performance and smooth its developments.
Source: Dutu, R. and P. Sicari (2016), “Public Spending Efficiency in the OECD: Benchmarking Health Care, Education and General Administration”, OECD Economics Department Working Papers, No. 1278, OECD Publishing, Paris.
The Strategic Framework links to the government's National Reform Programme and the EU operational programmes. The Ministry of Interior is responsible for co-ordinating its design and implementation, but other ministries have been allocated co-ordinating roles for some objectives. Management rests with the Government Council for Public Administration, which is chaired by the Ministry of the Interior. But some responsibilities overlap with the Government Council for Competitiveness and Informational Society.
Using public procurement for efficient provision of public services
Public procurement represents a relatively important means of purchasing goods, services and construction works at all levels of government in the Czech Republic, equivalent to almost 15% of GDP or one-third of government spending (Figure 2.2). Procurement by state-owned utilities is also significant (equalling 9% of GDP in 2008 (OECD, 2011b)). Significant reforms have been made in the past four years to increase transparency and controls over processes, largely driven by pressure from the European Commission. But concerns remain about the lack of transparency, competition and enforcement that cause wastage and distort competition in product markets (OECD, 2014a). In 2015 the Supreme Audit Office highlighted public procurement as “the highest-risk area of the state’s financial management” (SAO, 2015b). Expectations of corruption reduce competition if firms choose not to participate in tenders – survey data suggest this is a more common reason for not participating in tenders than in most other European countries (European Commission, 2014). Transparent and competitive procurement procedures with appropriate internal control systems and expertise are essential for effective procurement spending (OECD, 2013a, 2013b).
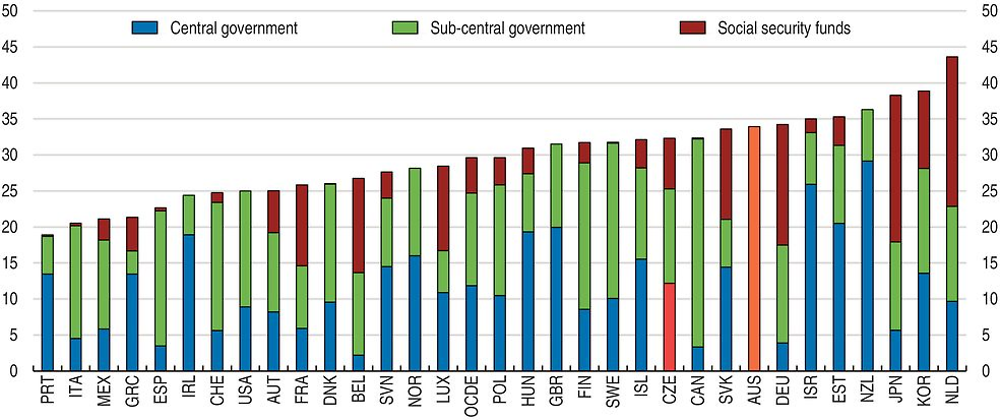
Source: OECD Government at a Glance database.
Significant steps were taken to increase transparency in 2012, including requiring publication of details of all contracts and increasing the number of cases where a new tender or competitive tender would be required. Increased data collection and the annual report on public procurement by the Ministry of Regional Development have facilitated greater scrutiny of public procurement and contracting authorities. From mid 2016 new public contracts above CZK 50 000 will be published in a centralised public register and from mid 2017 unpublished contracts will be automatically cancelled. However, there are exceptions that should be reconsidered, such as for small municipalities, the Office of the President, the Parliament and the Constitutional Court. To further increase accountability, the Ministry of Regional Development should compile performance indicators such as transaction costs, procurement times and usage of efficiency-enhancing vehicles (framework agreements and consolidated contracts). It should compare these across public entities to identify problems and facilitate learning from good practices.
Balancing accountability and enforcement against the compliance burden has proved difficult. Administrative demands were considered too high for all parties after the 2012 amendments. Accordingly, amendments in 2013, 2015 and 2016 aimed to reduce compliance burden. The scope for awarding a contract in the case of just one bidder was widened again, as was the scope for conducting a tender without negotiation. In 2015, the share of single-bid contracts increased to its 2010 level – one-third – after falling below 20% during 2013-14 (EconLab, 2016). Other means of enforcement are therefore more critical. Amendments in 2016 aim to reduce the compliance burden further. For example, only the successful company will need to prove its eligibility for the contract, which will improve accessibility for SMEs, as required by EU directives. Differences between the legislation governing procurement and other public tenders (concessioning and licencing) add to the compliance burden, as have frequent legislative changes. The legislation and procedures should be reviewed to evaluate the balance between enforcement and administrative burden. The review could be an ex post Regulatory Impact Assessment and should include a stakeholder survey. The implementation of EU directives on e-Procurement (by 2017) provides an opportunity to tackle compliance costs and improve processes.
Overall, competition in public procurement remains relatively low (Figure 2.3). Competitive procedures are crucial to achieve value for money and fight corruption (OECD, 2015c). A particular challenge is the large number of contracting authorities: in 2014 almost 15 000 contracts were signed and one-third (57% by value) were by non-governmental public bodies (e.g. the Academy of Sciences, associations of municipalities) (Ministry of Regional Development, 2015). Combining contracts would increase their size, supporting competition, and could also yield economies of scale and lower administration costs. Yet, the European Commission’s Single Market Scoreboard suggests just 5% of procedures in 2014 involved more than one buyer – half the EU average and one-quarter of the United Kingdom. Tools should be further developed to increase joint procurement, with rules and guidelines to increase their use. Options include centralised purchasing bodies, framework agreements, dynamic procurement, e-catalogues, consolidated contracts and contracts with options (OECD, 2015c). Central and regional governments should help co-ordinate joint purchasing solutions among other public bodies and municipalities. Tools from the OECD procurement toolbox should be applied to contracts that are negotiated without tender to preserve competitive elements. Information allowing comparison of the prices of goods and services is already published online and should be more widely used along with more systematic assessment of value-for-money.
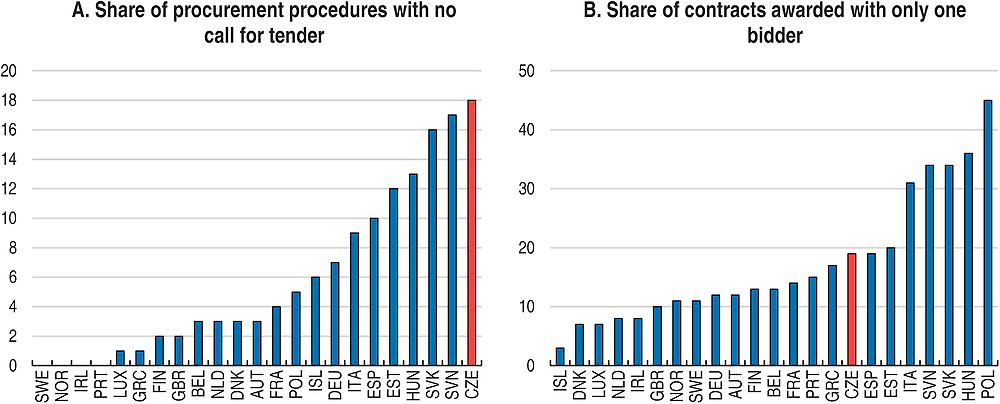
Source: European Commission, Single Market Scoreboard, http://ec.europa.eu/internal_market/scoreboard/performance_per_policy_area/public_procurement/index_en.htm
Problems related to a lack of effective oversight persist throughout the procurement cycle. These include failing to observe rules and regulations, setting discriminatory tender terms, contract splitting, inappropriate use of exceptions and failures in audit systems (SAO, 2015a, 2015b; UOHS, 2015). An increasing number of awarded contracts have been taken to the Office for the Protection of Competition for review and only a small fraction of cases were found free of misconduct but subsequent appeals generated delays (UOHS, 2015). Auditing, surveillance and enforcement of the procurement cycle are crucial to achieve value for money, and for reducing fiscal risks from EU funding being “corrected” due to compliance problems. These processes must also reach smaller local governments, where poor procurement practices appear more common (Table 2.2). Clear chains of personal responsibility should be established so that delivery is to the standards and timeframe contracted. Procurement officials should be required to disclose conflicts of interests (OECD, 2015c, 2003). Establishing a register of private interests of procurement officials and close relatives would also bring disclosures closer to best practice.
As in all OECD countries, procurement has expanded beyond an administrative function due to technological developments, the need for greater value-for-money and changes in tendering processes to a focus on non-price criteria such as quality and life-cycle costs. A specific challenge is the lack of expertise due to the multitude of contracting authorities. The national authorities have increased training, including via e-training on the public procurement portal. The portal should continue to be developed in a user-focussed way with clearer guidelines and more training and technical assistance. Competency centres should be developed within the central and regional governments to help bridge capacity gaps in other public bodies and municipalities (also in the area of public-private partnerships, discussed below). Turnover of key staff also erodes expertise. There may be benefits from certification of the profession: a majority of OECD countries now recognise public procurement as a specific profession (OECD, 2013a).
Maximising the impact of public investment spending through better planning and implementation
At 4.6% of GDP on average over the past two decades, public investment appears relatively high. Yet net investment has been low – or negative in some years – because of high levels of depreciation. And until 2015, investment in sectors associated with public infrastructure investment had also fallen (Figure 2.4, Panel A). Measures of infrastructure performance compare well to other CEE countries but there are gaps with high-income comparators in road quality and broadband access (Figure 2.4, Panel B). The Regional Development Strategy for 2014-20 also highlights the need for better infrastructure (Ministry of Regional Development, 2014). More infrastructure investment would help facilitate catch-up, through direct effects on the capital stock, as well as economies of scale, network externalities and competition-enhancing effects (OECD, 2015a). To capture these benefits, networks should be opened up to greater competition (OECD, 2014a). Other kinds of public investment that are needed include investment in research to support innovation and boost productivity (see Chapter 1) and investment to address population ageing and environmental challenges. Public investment can also crowd in business investment, for example, by creating backbone infrastructure.
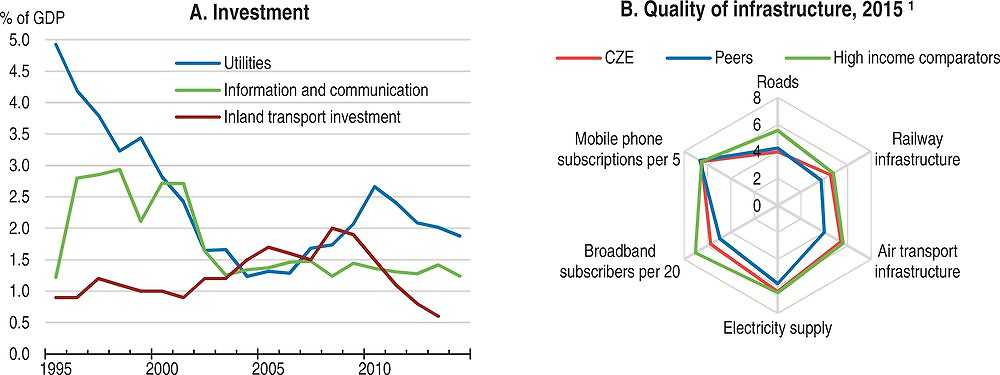
1. Measures of the quality of transport infrastructure and electricity are based on a score from 1 (low) to 7 (high). High-income comparators are: Austria, Belgium, Denmark and Sweden; CEE peers are: Estonia, Hungary, Poland, the Slovak Republic and Slovenia.
Source: OECD National Accounts database; International Transport Forum database; OECD Broadband database; World Economic Forum, The Global Competitiveness Index Historical Dataset 2005-15.
Public investment has also been volatile and, in recent years, procyclical (Figure 2.5). Fiscal consolidation, changes of government and the associated turnover of staff, procurement and co-ordination difficulties implementing EU-funded projects pulled down investment at all levels of government. Problems in large public bodies such as the Roads and Motorways Directorate also hindered investment. Problems integrating European requirements for environmental impact assessments into approval processes have also added to delays (European Commission, 2016a). Public investment contributed 1 percentage point to real GDP growth in 2015 (adjusted for the effect of the Gripen fighter jet lease) and will subtract from GDP growth in 2016. This reflects the transition between EU funding cycles, with a late finish to the previous cycle and new programmes not yet underway. This volatility also generates knock-on effects to product markets and the labour market.
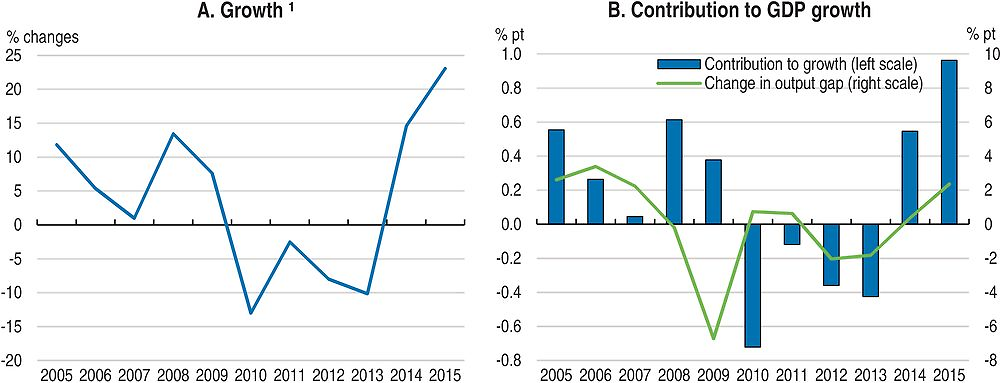
1. Investment in 2015 has been adjusted for the effect of the Gripen fighter jet lease.
Source: OECD calculations based on OECD Economic Outlook database.
Difficulties with EU-financed projects contributed to volatility in investment and illustrate many of the challenges for public projects more generally. In the 2007-13 programming period, available EU structural funds, mostly for investment projects, totalled EUR 26.5 billion (17% of average annual GDP, or 2½ per cent of GDP on average per year). By end 2013, only half of the funds had been paid out by the European Commission. Although available funds were larger as a share of GDP in Poland and Estonia, investment proceeded more smoothly (Figure 2.6). Accordingly, there was a rapid ramp-up in 2014 and 2015 and the absorption rate is ultimately expected to reach around 95% of the initial allocation. The process highlighted deficiencies in co-ordination, capacity and framework conditions – key pillars of effective public investment across levels of government (Box 2.2). In particular, delays stemmed from: too many programmes with differing, and complex, procedures; lack of co-ordination across and between levels of government; variations in programme rules; lack of personal accountability and monitoring, partly due to staff turnover; and problems with procurement processes delaying tenders (SAO, 2015a; European Commission, 2015a; Ministry of Finance, 2013). In some cases the Commission “corrected” its payments due to compliance problems and some funds were “decommitted” because they were not spent on time. The rapid increase in spending likely reduced spending efficiency: for example, construction prices were pushed up and 40% of tenders with EU funding in 2015 had just one bidder (EconLab, 2016; SAO, 2015a).
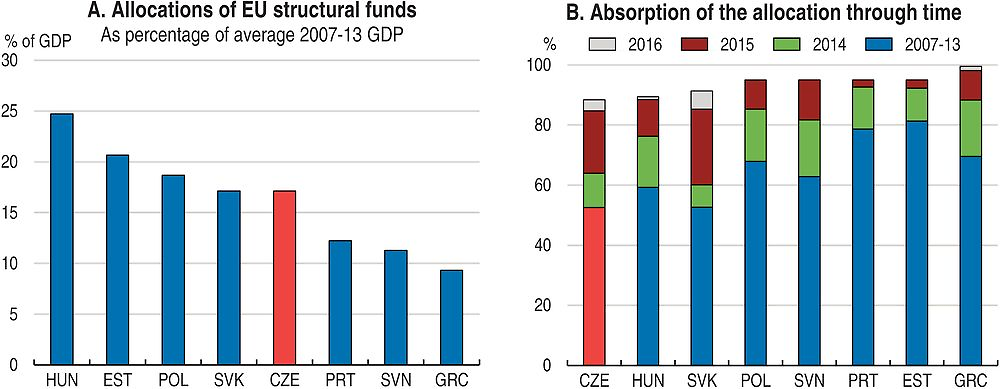
Note: This is the sum of all EU funds: Cohesion Fund, European Regional Development Fund and European Social Fund. Absorption rate is the total percentage of available funds paid out by the European Commission and is expected to rise further for some countries during 2016 and 2017.
Source: OECD Economic Outlook database; European Commission, European Structural and Investment Funds database.
Significant steps have been taken to improve co-ordination, capacities and framework conditions for the 2014-20 period. “Standing conferences” have been established at the national and regional level (using the eight regional groupings channelling EU funding). These conferences include important territorial stakeholders and will prepare action plans that form the basis for calls for tender. There is also a stronger focus on integrated strategies within regions and community-led local development. Greater emphasis on ex ante strategic planning, as required by the European Commission, could improve the framework for project selection and implementation. The number of programmes has been reduced, procedures for managing the programmes have been simplified and a uniform methodology applied across all programmes. More extensive use of indicators and electronic systems for monitoring progress should increase accountability and facilitate evaluation and corrective action being taken. Overall, these changes should improve the efficiency and effectiveness of investment and should be applied to other government processes. Greater use of available EU technical assistance could also help build capacity. Results will be conditional on the implementation of these improvements. Moreover, the current programming period is already delayed and problems with the previous period risk being repeated (SAO, 2015a).
OECD members have developed recommendations to help governments assess the strengths and weaknesses of their public investment capacity to maximise the quality and impact of public investment. A toolkit is available to help countries assess their current practices in line with the following principles.
A greater strategic focus is also needed so that national objectives drive the choice of projects, including co-financed projects, and resources are used most effectively. The forthcoming Strategic Framework of Sustainable Development to 2030 provides an opportunity to adopt a whole-of-government approach and overcome sector-based investment strategies. It should be informed by an evaluation of current and future infrastructure gaps. Prioritisation of projects across sectors should be able to draw on comparable analysis. The Strategic Framework should also build on the projects planned for the 2014-20 programming period. Clearer responsibility for co-ordination of investments and their prioritisation is also needed. An existing part of the government could be designated with this responsibility. Another possibility is to follow the model of Infrastructure Australia, a small independent statutory body tasked with preparing and updating “infrastructure audits” and a 15-year investment plan and maintaining a list of “priority projects” to inform the public debate. Multi-year planning would also reduce the volatility of investment and provide insulation from changes of government. An OECD Public Governance Review could be used to help implement the Strategic Framework and improve planning and co-ordination across levels of government.
Existing good practices should be extended more widely. For example, projects funded by “programme financing” (investment inside the national budget involving state organisational units) follow strict procedures and requirements, with cost-benefit analysis, reporting of indicators and tools for monitoring progress towards goals. But in other parts of the public sector, cost-benefit analysis is underused. It should be used more systematically, particularly for large projects. In a number of OECD countries ex ante cost-benefit analysis is mandatory for all investment projects above a given threshold (OECD, 2015b). Electronic platforms could be developed further to centralise and share knowledge and guidelines for the entire process of planning and implementation. The success of the reforms will also depend on the effectiveness of changes in procurement procedures, implementation of the Civil Service Act, and monitoring more generally, discussed in more detail below.
Public funds are to be leveraged through public-private partnerships (PPPs) and the Investment Plan for Europe (Juncker Plan). The Ministry of Transport plans to tender for a PPP project in 2016 to achieve faster construction and higher quality roads compared to undertaking the project directly. PPPs have been little used recently: the central government’s PPP unit was disbanded in 2012 and the only active PPPs are at the municipal level (OECD, 2014b). By drawing on private sector expertise in designing and operating assets, well designed PPPs generate gains through timeliness, cost and quality (OECD, 2013a). But the abovementioned difficulties with procurement highlight the risks of corruption and wastage. Lack of capacity and planning plagued earlier PPPs (Ondráčka, 2007). It is essential that the key principles from the OECD’s Principles for Public Governance of PPPs be applied, including: using ex ante value-for-money assessments; appropriately apportioning risk; concentrating expertise centrally and ensuring the budgetary process is transparent. If these conditions cannot be met, direct public investment would likely be more effective and efficient. Almost 50 projects worth over CZK 300 billion were initially submitted to the Investment Plan for Europe but only five agreements have been signed so far. Where eligible projects are in line with national priorities, this avenue of funding and access to technical support should be used to help leverage national funds.
Better management of human resources
In 2015, the Civil Service Act created a national civil service, which was an unfulfilled requirement of EU membership. Prior to this, employment at the central government level – almost half of general government employment in 2007 – was regulated by the general Labour Code and ethical requirements were addressed in various regulations. (Employees of sub-national governments have been subject to Act on Civil Servants of Self-governing Local Authorities since 2003.) Human resource management (HRM) policies and processes differed across central government departments and performance assessments were relatively underused (OECD, 2011b). High turnover after government changes caused discontinuity in policy implementation, depleted institutional knowledge and compromised perceptions of the public service (Figure 2.7, Panel A). The Act aims to depoliticise the public service and increase professionalism and stability, thereby improving HRM. Key changes include: specifying competitive procedures for all appointments and promotions; linking remuneration and performance assessment more closely; codifying rights and responsibilities; and facilitating whistleblowing (Box 2.3). These changes bring many HRM policies more in line with other OECD countries (Figure 2.7, Panel B).
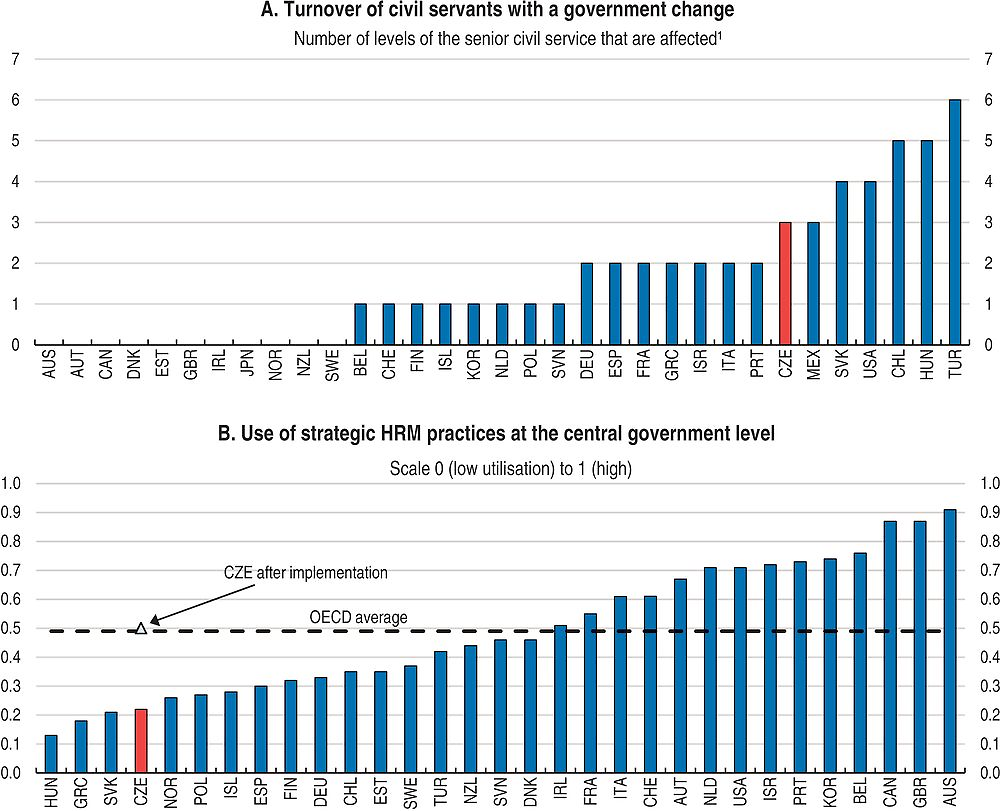
1. The bar shows to what extent there is a change of positions at different levels of civil servants when the government changes. In the countries with no turnover, a change of government does not directly affect the employment of public servants. The exception is a small number of public servants employed on a contract, which terminates when the relevant Minister leaves the office. Data on turnover in level 5 and/or 6 are not available for Czech Republic, Hungary, Israel, Portugal, Spain and United States.
Source: OECD (2011), Government at a Glance; OECD calculations based on responses received from the Ministry of the Interior.
Specific procedures for recruitment, promotion and dismissal, a more rigid organisational structure and reduced use of fixed-term contracts should reduce political interference and strengthen the career path of civil servants. Ministers will only be able to choose part of the selection panel for State Secretaries and Deputy Ministers. Vacancies are now advertised on a civil service-wide portal. However, some new requirements may constrain improvements in policies and practices. Barriers have been created for private-sector candidates applying to senior management positions; for example, for a director position the first two recruiting rounds must fail. This should be reconsidered. Similarly, making senior civil servants permanent in their role to bar political influence could increase rigidity too much. These effects could be mitigated by measures to encourage mobility, such as taking experience in other roles (or ministries) into account in promotion decisions, or by encouraging secondments. In Australia, Belgium and the Netherlands, competencies (knowledge, skills and behaviours) are being managed in a way that aims to increase transferability and accordingly, mobility and flexibility (OECD, 2015d).
Performance pay is now better linked to performance assessments, which have been formalised and include criteria relating to outcomes as well as behaviour. This should improve incentives and employee engagement. This link is particularly important because performance pay is used more than in other OECD countries (OECD, 2011b). The regular component can reach up to 43% of regular pay for a high-performing employee early in their career. With bonuses, performance-related pay can theoretically reach 57% of overall compensation. For experts and managers the share can be higher. To foster confidence in the process and enhance incentives, outcomes of assessments should be transparent at each level (with sufficient confidentiality) and bonuses should also be linked to assessments. Base pay is determined by a matrix of position and experience (as in sub-national governments) and the sizeable wage penalty that emerges for tertiary-educated workers (estimated at around 30% by de Castro, Salto and Steiner, 2013) will likely continue to hamper retention of skilled staff. A penalty is common in transition countries (Lausev, 2014). While the wage penalty may fall over time, the appropriateness of compensation and conditions should be reviewed with the aim of improving retention. Denmark, for example, regularly assesses whether pay is sufficiently high to be competitive without crowding out the private sector. Non-wage measures could be expanded, for instance, through training and skill development and policies to promote gender equality (as proposed in the Assessment and Recommendations).
To make sure that civil servants have sufficient expertise, examinations are used in the recruitment and appointment process, training is being reformed and the role of managers is being enlarged. However, the emphasis on “fields of specialisation” accompanied by compulsory examinations risks deterring applications from outside the public sector and hindering mobility of talented individuals within the civil service. The system of training and education of staff is being reworked. Outsourcing will be reduced, the Ministry of Interior will run cross-cutting training and ministries will run specific training. In some areas, effective use of e-learning tools could help reach more employees. Managerial skills have been lacking but will be increasingly needed as the management role changes. Training should be provided to help managers fulfil their expanded responsibilities in a more uniform way with support from HRM units. Tools such as 360 degree appraisals could help identify areas for improvement. Increasing the weight of managerial skills in appointment and performance evaluations could better align incentives. Overall, the success of the new approach will depend on its implementation; it should be monitored closely to allow for ongoing improvement.
The transition period has inevitably involved significant change, increased administrative burden and uncertainty. One concern is the considerable movement of personnel and positions ahead of the fixing of positions on 1 July 2015. In addition, the need to pass the Act quickly (to secure EU funding for the 2014-20 programming period) meant that many accompanying policies and guidelines were not finalised. Consequently, there has been uncertainty about how to comply with the Act in some practical situations and insufficient HRM expertise within ministries meant the burden on management increased sharply. The first evaluation of the Act is scheduled for 2016. It should include outcomes, such as staff engagement, hiring, turnover, as well as an assessment of human resource capacities within ministries. It should propose amendments to the Act, regulations and processes where necessary and identify where HRM skills need to be increased. An independent expert evaluation should be scheduled for 3-5 years’ time to consider the effects of the reform and suggest improvements. Legislation to improve whistleblower protection, as envisaged in the Act, should be passed swiftly.
These changes to stabilise the civil service come as other countries are moving towards greater flexibility within departments and allowing positions to change over time (OECD, 2015d). While the new Act specifies processes and rules to achieve consistent quality, these changes could also increase rigidity and administrative burden. The public administration unit within the Ministry of Interior should adopt a more forward-looking focus to identify upcoming challenges such as demographic change and future skill requirements and work with ministries to adjust to these. Retirements could, for example, be used to adjust the staff profile over time.
The Civil Service Act was adopted on 6 November 2014 and became effective on 1 January 2015. It regulates the organisation of civil service, the legal status of civil servants, their remuneration and other procedures.
-
Coverage: The Act applies to civil service employees of ministries and most other state administration bodies. It does not include Members and Deputy Members of the Government (and their staff), top management of some independent offices (e.g. the Energy Office), defence force employees or employees of state administration bodies who do not perform “state service” (e.g. personal assistants and IT technicians in ministries).
-
Administration: Overall co-ordination is carried out by a separate section of the Interior Ministry, which is controlled by the Deputy Interior Minister for State Administration who is appointed by the Government.
-
Organisational structure: For each ministry the number of staff in managerial and non-managerial positions and the overall wage bill is approved annually by a Government Resolution. Each ministry's organisational chart is approved annually by its State Secretary. Each position has a qualification requirement, in terms of education and “field(s) of specialisation”. The use of fixed-term contracts has been narrowed to specific circumstances. Positions can be made redundant.
-
Recruitment, promotion and dismissal: Recruitment and promotion is through a competitive process, with a committee of three people and written documentation of each stage. There are separate procedures and criteria for top management. There are two obligatory entrance examinations. The general exam tests knowledge of the activities of state, rights, responsibilities, ethics and the underlying legislation. The second exam verifies competence in the “field(s) of specialisation”, even for senior management.
-
Performance management and remuneration: The Act introduces annual assessments for all civil servants. They cover fixed criteria in the areas of: (i) knowledge and skills (e.g. communication, co-operation, leadership); (ii) performance of state services in terms of accuracy, speed and independence; (iii) compliance with legislative obligations; and (iv) professional development. The assessments will determine performance pay and also include goal-setting for personal development. The Act also defines basic parameters for continuous professional development.
-
Whistleblowing: The Act requires additional legislation to be prepared to facilitate whistleblowing by providing civil servants with adequate protection.
-
Transitional arrangements: Positions were fixed on 1 July 2015. All senior civil servants must pass a review process after which they keep their current positions. The process should be completed by mid 2017.
Focussing on performance to evaluate and reinforce improved processes
Performance monitoring and performance-based budgeting are still little used. Only a small fraction of line ministries use elements of performance-based budgeting process. Practices vary at the sub-national level. Unlike in most OECD countries, outputs and outcomes are not included in budget submissions or documentation and performance budgeting is optional (even for line ministries). Existing performance indicators are not evaluated, benchmarking is little used and the Supreme Audit Office has repeatedly highlighted the risks of insufficient monitoring and evaluation leading to poor project selection and failure to correct emerging problems (SAO, 2015b).
Recent steps to increase the publication of data have been in the right direction. Key costs for each ministry and budgetary unit – wages, operating costs and material costs – now feed into the preparation of the state budget. Large datasets that have been made available as part of the Open Government Partnership have helped to increase transparency and some municipalities, NGOs and academia to carry out benchmarking and other evaluation exercises. There is also monitoring of “programme financing” for state organisational units and the information collected to monitor EU programmes which is used by line ministries. These tools should be extended to include investment grants and subsidies. The Supreme Audit Office is also increasingly focussing on performance aspects in its audits – a trend seen in many OECD countries; however, its audits are limited by its own resources and its authority, which does not extend to regional and municipal government or state-owned companies. The legislation to extend these powers that is with the Parliament should be passed and additional resources allocated to this function.
The e-Government programme offers an opportunity to escape sectoral silos and adopt a whole-of-government approach to performance measurement and evaluation processes. The focus of the e-Government programme has been on creating portals for accessing information and interacting with the government (Box 2.4). To the extent that data exist, they are typically fragmented and unpublished, as is the case in healthcare and education (OECD, 2014e; Shewbridge et al., 2016). In general, data provision needs to expand more uniformly and be more outcome-focussed, perhaps with the help of the Czech Statistics Office. The Swedish system of measuring healthcare outcomes is a successful example of how to overcome the difficulties of monitoring a highly decentralised network (OECD, 2014e). The Norwegian KOSTRA system provides an example of best-practice in collecting and publishing information on local government performance. Its introduction has benefited central and sub-national governments and proved to be a useful tool for municipalities themselves. As well as informing policy-makers, publication of performance indicators and benchmarking exercises would help to make regional and municipal governments more accountable to their residents, improve decision-making and drive service improvements.
For the successful roll-out of e-Government projects, deficiencies in co-ordination, targets, supervision and evaluation that have beset earlier e-Government initiatives will need to be overcome (SAO, 2015c; Spacek, 2015). The experience of Estonia – a leader in e-Government – highlights the importance of interoperability facilitating information-sharing across government departments (OECD, 2015e). It is crucial to engage all stakeholders and improve co-ordination, as suggested by the Supreme Audit Office. Performance monitoring of the indicators that are developed could be by a central government unit (perhaps jointly run by Ministry of Finance and Ministry of Interior) or a body such as the Supreme Audit Office. An OECD Public Governance Review could help implement a well co-ordinated system of performance monitoring, benchmarking and e-government drawing on best practices.
There is also considerable scope to improve the provision of e-Government services. Take-up of online government services appears to have stalled and for individuals, it is much lower than in other EU countries (Figure 2.8). Rates of e-filing of taxes are among the lowest in the OECD. Large gaps have been found in all key aspects of e-Government: user centricity; transparency of service delivery and personal data involved; cross-border mobility; and enablers such as single sign-on (European Commission, 2015b). It is important to ensure the framework conditions such as security and privacy are sound. Interoperability has hindered the use of e-Government services by the public sector and needs to be addressed. The UK Government Digital Service Team provides an example of a nimble, user-focussed approach to improving ICT use in the public sector. It was established as a small team to work with government to simplify public services, provide data and provide tools for staff and ultimately led a transformation of online data services (OECD, 2015e). But as with other projects, continuous monitoring and evaluation is required to control costs and keep processes on target.
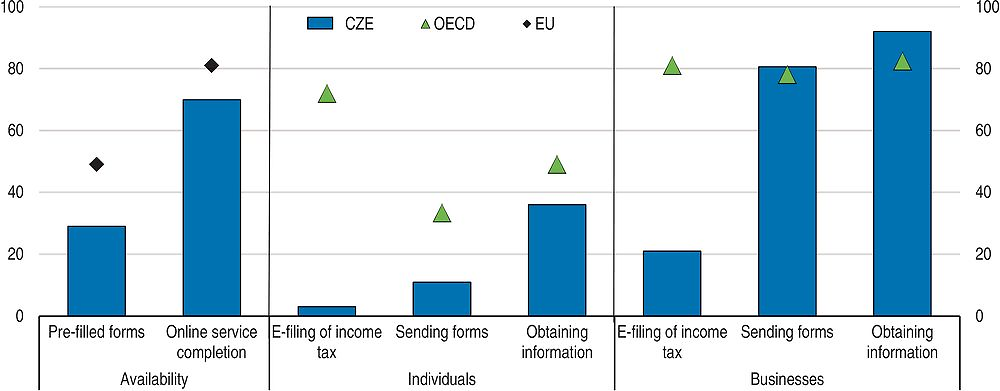
Note: Data for individuals are for 2014, data for firms are for 2013, data for availability are for 2015. Extent of data in pre-filled forms is normalised. Online service completion rate is the share of the steps in defined life events that can be completed online.
Source: OECD (2015), Government at a Glance database; OECD (2015), Tax Administration 2015: Comparative Information on OECD and Other Advanced and Emerging Economies, OECD Publishing, Paris; European Commission, Digital Market Scoreboard.
The Strategic Framework for the Development of the Public Administration involves implementing a “digital by default” policy. This in turn requires all public administration clients to have an electronic identity, addressing cybersecurity concerns, and linking up databases to enable pre-filling of forms. The International Competitiveness Strategy also lays out targets related to e-Government and ICT modernization in the public sector. Existing tools include:
-
Data boxes: repositories for storing electronic communications between citizens or companies and the state, between citizens and companies and between public authorities.
-
Basic Registry: comprises the register of inhabitants, the business registry (including public authorities), the land registry, and the registry of competency of public administration offices.
-
CzechPOINT: a service that allows registered users to obtain an extract from the Basic Registry. The service is also available at some municipal offices, post offices, notary offices and other public offices.
-
Public administration portal: offers centralised information for individuals, businesses and public bodies. Includes an “open data catalogue” so public bodies can publish datasets with standardised metadata and documentation in a centralised location.
-
Portals for procurement: Contracting authorities must publish tender notices above the national threshold on the e-Procurement system. All levels of government must publish all public tenders and awards on the e-Tenders portal. The portal on public contracts and concessions contains: legislation; links to the electronic marketplace; information on centralised procurement; e-Learning on public procurement; technical assistance; and information such as annual procurement reports.
-
Electronic portal of local self-governments (ePUSA) and Towns and Communities Online Portal (TCOP): contain an up-to-date database of basic information for local governments and their activities.
-
Electronic identification: electronic signatures (from three recognised providers) are valid for communicating and transacting with the public administration.
Source: Ministry of Regional Development; Ministry of Interior; European Commission (2016), “e-Government in the Czech Republic”, Joinup e-Government factsheet, January 2016, https://joinup.ec.europa.eu/sites/default/files/ckeditor_files/files/eGovernment%20in%20Czech%20Republic%20-%20February%202016%20-%20v2_00.pdf.
Realising the benefits of decentralisation
Czech local governments have responsibility for delivery of some key government services. Overall, sub-national spending accounts for just over one-quarter of general government expenditure, close to the average unitary OECD country. Spending is concentrated in education, economic affairs (particularly transport), and “other” spending (notably waste and waste water treatment) (Figure 2.9). In health, most spending is by social security funds but regions are responsible for hospitals and municipalities for primary care. Overall, municipalities have greater spending responsibilities than regions, being responsible for education up to lower secondary school, social services including housing, energy, water infrastructure and waste services. Yet, despite sizeable sub-national government spending in key policy areas, discretionary powers of the sub-national governments are much more limited (OECD, 2006; Table 2.4). The funding structure is also complex, which together with many earmarked grants, likely reduces efficiency (Bergvall et al., 2006).
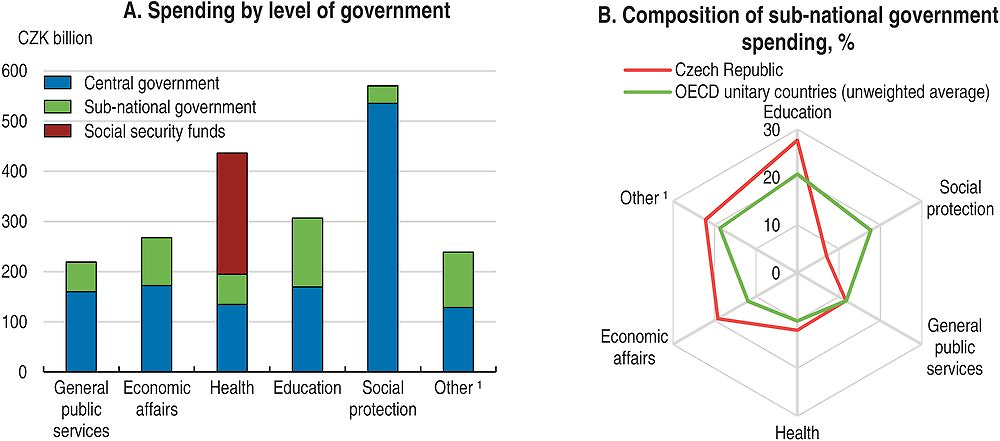
1. Comprises: public order and safety, defence, environment protection, housing and community amenities, recreation, culture and religion.
Source: OECD National Accounts database; OECD (2016), Subnational Governments in OECD Countries: Key Data (brochure), OECD, Paris, www.oecd.org/regional/regional-policy Database: https://doi.org/10.1787/05fb4b56-en.
The current territorial division is fragmented and complicated
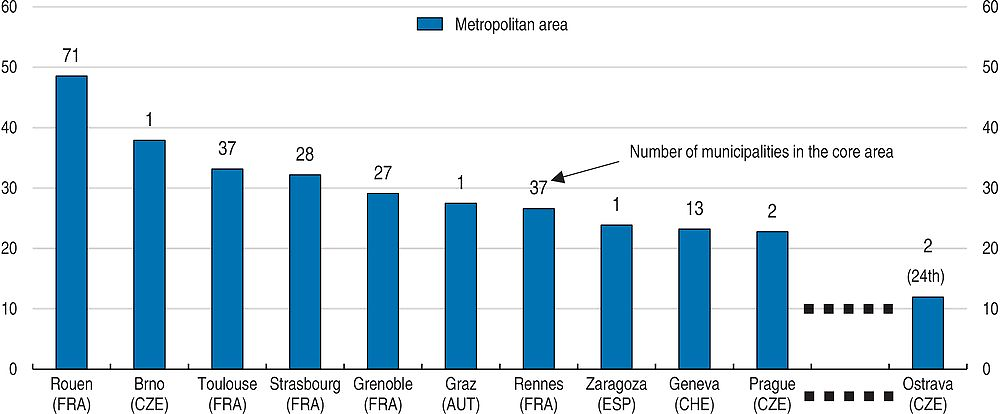
The country is divided into 14 regions and over 6 200 municipalities, with Prague having special status as a municipality and a region. The average population size of municipalities and regions – 1 686 and 754 000, respectively, in 2016 – are among the smallest in the OECD (Figure 2.10). Around three-quarters of municipalities have less than 1 000 residents, one-quarter have less than 200 residents and 7% have less than 100 residents. The three metropolitan areas – Prague, Brno and Ostrava – are among the most fragmented in the OECD when defined on a functional basis (Figure 2.11). The 1993 Constitution provides substantial independence to these forms of self-government. In contrast to other OECD countries, where the number of municipalities is declining, the number has been stable since the late 1990s, partly because incentives to merge are weak (OECD, 2011a, 2006). Starting a new municipality requires at least 1 000 residents. Municipal governments are traditionally viewed more favourably than regional or national governments (Freedom House, 2015). However, there are a range of costs associated with very small government units, as discussed in OECD (2006) and below.
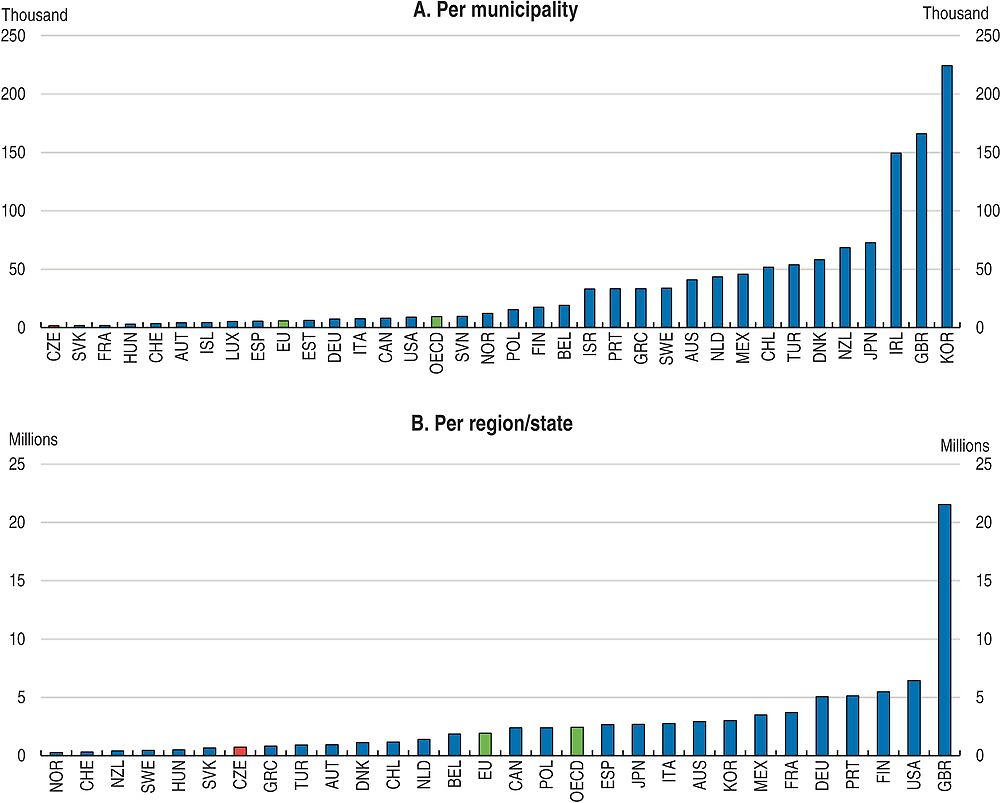
Note: Average calculations are based on estimated population data as of 2015 or 2016 for most countries. Data for OECD and EU are unweighted averages.
Source: OECD (2016), Subnational Governments in OECD Countries: Key Data (brochure), OECD, Paris, www.oecd.org/regional/regional-policy. Database: https://doi.org/10.1787/05fb4b56-en.
Source: OECD Cities database, http://dotstat.oecd.org/Index.aspx?DataSetCode=CITIES.
Changes in the early 2000s led to further fragmentation. Regions were created in 2001. Then in 2003, the responsibilities of the 76 “districts” (between regions and municipalities) were largely passed to 205 “municipalities with extended powers”. These municipalities perform functions for surrounding municipalities, so that all municipalities not designated as having extended powers are attached to one. Delegated functions performed on behalf of the central government (for example, child protection and issuing passports) are associated with additional funding and smaller municipalities also contract some functions to them (discussed below). But many other municipalities perform some but not all of the delegated functions (Table 2.5). This complicated arrangement deconcentrates expertise, increases the possibility of corruption, particularly in very small municipalities, and means that citizens may need to go to multiple offices to complete some processes (Ministry of Interior, 2012). Moving delegated functions to the 205 municipalities with extended powers (as proposed by the Ministry of Interior in 2012) would streamline the system and increase efficiency. The reassignment of functions would need to be accompanied by appropriate changes in funding arrangements.
Another source of administrative complexity is the incomplete transition from the earlier system of territorial division (under the Territorial Division Act of 1960) to the current system. Some data are still collected at the district level, which is inconsistent with the system of municipal borders and hampers performance monitoring and accountability. Some cities are split by different jurisdictions. This unnecessarily adds to costs and reduces the coherence of the public administration. It should be addressed as planned under the Strategic Framework of the Development of the Public Administration. Tasks and data at the district level should be reallocated in a way that facilitates comparison of costs and results to promote benchmarking.
Mergers are politically unpopular but voluntary co-operation between municipalities is common and has a long history. Three types of co-operation are permitted: (i) contracts for performing certain functions; (ii) voluntary associations of municipalities (VAMs); and (iii) formation of “mutual-interest associations of legal persons” (Sedmihradská, 2010). Ninety per cent of municipalities participate in some form of co-operation (Swiandiwicz, 2010). Contracts are used extensively to delegate some services that municipalities are required to provide, typically to the municipality with extended powers: in 2012 there were 5 784 contracts (Ministry of Interior, 2014). Responsibilities transferred include administration as well as services such as healthcare and education. While this is very flexible and has increased efficiency, it adds to complexity and has proved difficult to monitor. VAMs are the most significant type of co-operation (Box 2.5). They are very diverse but most commonly related to infrastructure and transportation (Sedmihradská, 2010). The attraction of grants or subsidies has been an important driver, either offered by the central government or when EU operational programmes imposed co-operation (Dvořáková and Strolený, 2011; Dabrowski, 2014).
VAMs vary in nature, purpose and membership. They may be established as joint stock companies (which can invest in another body alongside private companies) or public bodies. They can have a single purpose (e.g. an investment project) or ongoing provision of a service (e.g. waste removal). Funding can come from members, user charges, or grants or they can be established without funding. There are 743 active VAMs, of which one-third are located in Central Bohemia (around Prague) and South Moravia (which includes Brno). Two examples of successful but very different associations are:
-
Ongoing VAM providing services: The Water Management Association of West Bohemia was established in 1993 when water infrastructure was transferred to municipalities. Forty municipalities joined together, transferring their infrastructure to the association. The Association became one of the main shareholders of the water company when it was privatised in 1994. The number of municipalities in the Association has more than doubled over time.
-
Temporary VAM to achieve a single project: Pocidlini Municipal Association was created in 1998 by three municipalities to connect to the gas supply because they were individually too small for the company to construct the infrastructure. The Association has no employees: individual municipalities carried out or commissioned most of the functions for the project and the accountant of the largest municipality performs accounting work with costs reimbursed.
Source: www.municipal-cooperation.org; OECD (2015), Governing the City, OECD Publishing, Paris.
Although co-operation is common and flexible, it does not overcome all the problems of fragmented municipal government. Formation costs make co-operation especially costly for small municipalities and in cases where a number of municipalities are needed to make a project viable. The ongoing viability of a given association or agreement is often dependent on the mayor and local administration (Sedmihradská, 2010; Perlín, 2006). VAMs do not always include adjacent municipalities. Consequently, they may not be formed where they are most needed. Maps published by the Institute for Spatial Development suggest that the coverage of micro-regions in Central Bohemia around Prague has fallen, even though this is where the benefits of co-operation could be greatest. To make the system of VAMs more effective, assistance and financial incentives should be provided to motivate co-operation where the gains are largest. A unit should be established in the central government to monitor and facilitate co-operation, as proposed by Sedmihradská (2010), with additional support in their formation from regional governments and the two representative associations of municipalities.
Co-operation is more tractable at the regional level. Most of the administrative regions are too small to draw on EU structural funds alone so groupings of regions were created to access EU funds. Co-operation is likely helped by the shorter history of these groupings and their regular interactions. Over time, the Association of Regions has developed into a formal institutional structure comprising representatives from all regions and facilitates the accumulation of expertise and trust. The new system of standing conferences for EU-funded programmes will also build co-operation between regions, and between regions and other levels of government. This system should be used as a model for improving co-ordination of projects and all cross-cutting policies, as is the case in Austria, for example.
Better matching size and function to overcome fragmentation
The costs of small units of government to public service delivery include the loss of economies of scale and scope and as well as insufficient capacity due to difficulties attracting and retaining skilled staff. International evidence suggests that there can be efficiency gains up to populations of around 10 000 to 20 000, mostly driven by capital intensity (Holzer et al., 2009; OECD, 2014d). Labour-intensive services are considered more easily scaled but at very small sizes these services can also suffer. In Switzerland, for example, municipalities with less than 500 residents were found to have higher costs and lower quality services (Ladner and Steiner, 2003). There is evidence from Spain that costs were 20% higher in municipalities with 1 000 residents than those with 5 000 (Solé-Ollé and Bosch, 2003).
Estimating the efficiency of Czech municipalities is hampered by data constraints and significant differences in the activities of municipalities. Šťastná and Gregor (2015) find that among Czech municipalities with extended powers, smaller municipalities are more cost-efficient than larger municipalities. However, these municipalities all have over 2 700 residents, placing them above the threshold where overheads affect even labour-intensive activities. It is also possible that the increasing cost reflects a greater range of services that are not measured or differences in quality. Using expenditure as a proxy for cost for the other 6 000 municipalities with lesser functions reveals a slight increase in median per capita spending up to 10 000 residents (Figure 2.12, Panel A). But there is considerable variation for small municipalities, and this variance is higher in the same analysis for Finland (which also has many small municipalities) (OECD, 2014d). More pertinently, data on administrative expenditure per capita reveal that the median per capita cost declines up to a population of 1 000-2 000 (Figure 2.12, Panel B). This U-shape is consistent with the international evidence that overhead costs affect the efficiency of very small municipalities. It also leaves small municipalities with smaller financial resources for other services.
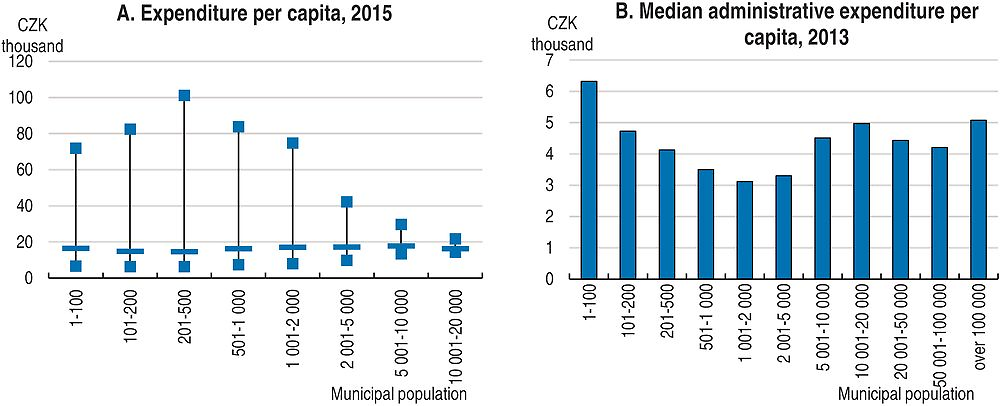
Note: Panel A excludes the 205 municipalities with extended powers. The thick horizontal lines show the median level of expenditure per capita and extreme values are the 2nd and 98th percentiles. Panel B shows median expenditure for all municipalities. Data are based on national budgetary definitions.
Source: Ministry of Finance CR MONITOR, http://monitor.statnipokladna.cz; Czech Statistical Office; Rozpočet Obce; OECD calculations.
It appears that services could be improved by scaling up, reducing duplication and achieving economies of scope. Administrative costs claim a higher share of government current health expenditure than in most other OECD countries (OECD Health database). Dutu and Sicari (2016) also find more scope to increase efficiency than most other countries, which is in line with the 2011 Economic Survey and the OECD Review of Healthcare Quality (OECD, 2014e, 2011a). Educational attainment is consistently high across regions and PISA test scores are near the OECD average despite lower spending per student (PPP-adjusted) (Figure 2.13, Panel A). But the large number of small schools points to potential gains from scale and scope: around 60% of schools have less than 200 students, a problem which extends beyond rural areas (Shewbridge et al., 2016). On average school sizes are smaller in regions that have more municipalities (Figure 2.13, Panel B). This likely reflects political economy difficulties with school closures in municipalities, which may be exacerbated by links between the tax allocation and number of students (discussed below). Decisions taken over larger schooling districts would better internalise gains from pooling teachers and facilities. Monitoring – and consequently performance – would also be improved, particularly since the school inspectorate only undertakes inspections every six years on average (Shewbridge et al., 2016).
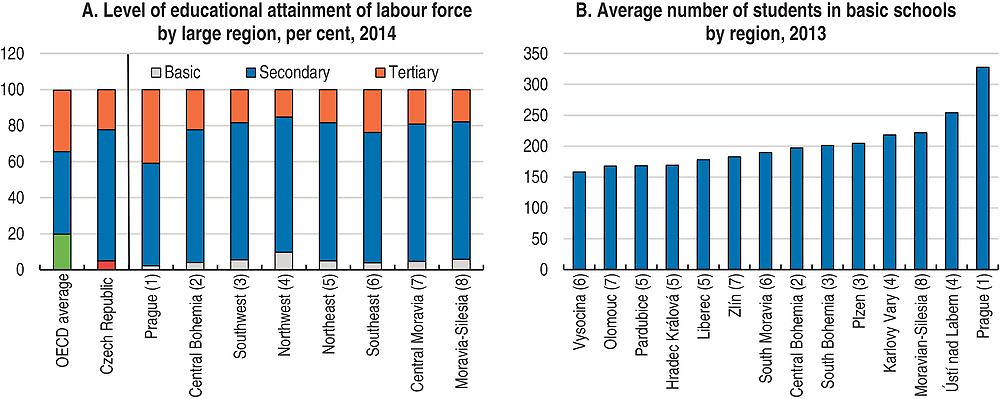
Note: Large regions (TL2 level) encompass several small regions (TL3 level). The numbers in parentheses show which larger region the small regions in Panel B belong to. Basic (or elementary) education includes primary and lower secondary education. OECD average is an unweighted average of countries with available data for 2013 or 2014.
Source: OECD Regional Statistics database; Shewbridge et al. (2016), OECD Reviews of School Resources: Czech Republic, OECD Publishing, Paris, forthcoming.
Small administrative units compound co-ordination problems by spreading expertise more thinly. This is especially a problem in specialised areas such as investment projects, procurement and quality management (Ministry of Interior, 2012, 2014; Dvořáková and Strolený, 2011). It may be adding to large differences in municipal investment per capita: in 2013-15, median investment per capita was around 20% lower in municipalities with less than 1 000 residents compared to those with 1 000-5 000 residents, and more fragmented regions had more variation in investment. Efforts to increase capacity and support include training, e-learning and a web platform for exchanging good practices, for example under the “Smart Councillor” and “Accountable Councillor” programmes. But very small municipalities – like those with a part-time mayor – will remain stretched. Jetmar (2015) finds the demand is strongest for assistance with grants and procurement. The competency centres proposed above would help with technical procurement. Centres of shared specialist services with teams of professionals are being piloted on a voluntary basis and, if successful, should be expanded to form a country-wide network. Allowing more variation in pay for specialised roles and including sub-national government employees in the civil service education system could support skill accumulation.
A multi-pronged approach is needed to generate larger functional sizes of municipalities, as shown by other countries’ experiences (Box 2.6). Mergers may be a first-best solution but they are politically difficult to achieve. They should nevertheless be supported more, as has been proposed in earlier OECD Economic Surveys. Financial incentives may be partly funded by efficiency gains. However, in other countries mergers have often raised output quality or accountability rather than lowering costs (Slack and Bird, 2013). This means that financial incentives should be well targeted and reinforced by non-financial incentives, such as greater autonomy for larger municipalities. Demonstrating the potential improvements to services may help generate public support; this would be aided by publishing indicators of municipal performance, such as outcomes of services and efficiency of service provision. Initially efforts to promote mergers could be focused on more urban areas, where local identity may be less strongly connected to the municipality and where fragmentation is more problematic, as discussed below. Small merged municipalities could maintain a sub-municipal status as in Korea, the United Kingdom, New Zealand, Ireland and Portugal (OECD, 2016). Regions or the Ministry of Regional Development could help municipalities understand the financial case for a merger; in Switzerland this is a free service provided by cantons. Regions could also act as a mediator, as in the Netherlands (OECD, 2014f).
Given that progress in voluntary mergers is likely to be slow, other means should also be used to secure a larger population size in the delivery of key services. One possibility is to establish a minimum size for provision of services that would yield gains from economies of scale and scope, or from planning over a larger population. Minimum standards could be established to generate joint provision, such as setting a minimum school size. Alternatively, financial incentives could be used but would need to be sufficiently strong. Hungary and Italy require small municipalities to co-operate in activities such as administration and some services, respectively. Successful co-operation may build trust that leads to voluntary merger later. Consideration should be given to circumstances where mergers should be compulsory; for example, following insolvency and when a municipality requires an administrator because there were no candidates at the election, as was the case in 12 municipalities at the last election.
Nonetheless, many functions will likely remain with small municipalities. The functions carried out by very small municipalities should be reduced in a more systematic way than the current network of contracts and ad hoc agreements. This is particularly important where municipal populations are in trend decline. One possibility would be to transfer demanding responsibilities – such as health, education and social services – to the municipality with extended powers when a municipality is below a certain size. Better collection of cost data would help ensure that financial arrangements were fair. The minimum size that triggered transfer of responsibilities could be higher if greater support was available to small municipalities, through centres of shared services or further development of e-Government tools that raised the quality of service provision.
Incentivising or mandating mergers
-
In Denmark mergers scaled up each level of government. Realigned responsibilities and financing changes drove a bottom-up process of amalgamation after a lower size limit of 20 000 had been imposed. The number of municipalities fell from 271 to 98 in 2007. At the same time, 13 counties were replaced by 5 regions.
-
In Greece the number of municipalities was reduced from 1 033 to 325 in 2011. The new municipalities received more competencies and resources. The number of municipal companies was also expected to fall (from 6 000 to 2 000). Concurrently, 54 departments were replaced by 13 regions, including two metropolitan regions.
-
France is undertaking major territorial reforms. Incentives are available to small municipalities who merge and shift their powers to “communities of municipalities”. The minimum size of communities will increase. Inter-municipal co-operation is mandatory in some cases, but grants also provide incentives. Compulsory mergers were imposed on regions. “Urban communities” were imposed on three metropolitan areas.
-
The Styria region contained one-third of Austria's small municipalities with under 1 000 inhabitants until reforms in 2010 that almost halved the number of municipalities. Aims included synergies in service provision, better spatial planning and future stability. Around 80% of municipalities merged voluntarily. The region also established a fund for voluntary mergers, in addition to existing national financial incentives.
Assistance from other parts of government
-
In Switzerland cantons encourage mergers with financial incentives and some cantons grants for evaluating a potential merger. Cantons also provide technical assistance, including free evaluations of the financial implications of mergers. The number of municipalities has declined by 263 since 2000. Cantons also provide financial incentives for co-operation in investment projects.
-
In the Netherlands provincial governments have a role as moderators in mergers of municipalities. They evaluate merger proposals before formally sending them to the central government to enact. There is also a temporary merger grant for municipalities' “friction costs” paid over five years.
Mandating joint service provision
-
In Italy municipalities with less than 5 000 inhabitants must provide basic functions using municipal unions and need to share resources using group purchasing.
-
In Hungary joint delivery through micro-regions was compulsory for some public services, including education, social services and healthcare. However, some municipalities chose to merge rather than form an association. Reforms implemented since 2010 have changed the territorial organisation, transferred some responsibilities (e.g. in education and health) to the central government and required that municipalities with less than 2 000 residents share their administrative offices (while maintaining their own mayor).
Source: Various sources compiled by OECD: OECD (2014), “Multi-level governance challenges in the Netherlands”, in OECD, OECD Territorial Reviews: Netherlands 2014, OECD Publishing, Paris; OECD (2014), OECD Regional Outlook, OECD Publishing, Paris; OECD (2015), OECD Economic Surveys: France, OECD Publishing, Paris; OECD (2015), Hungary: Reforming the State Territorial Administration, OECD Public Governance Reviews, OECD Publishing, Paris; Dexia (2012), Subnational Public Finance in the European Union; Council of Europe (2015a), “Local and regional democracy in Greece”, Congress of Local and Regional Authorities Report, No. CG/2015(28)8, Strasbourg; Council of Europe (2015b), “New Forms of Local Governance”, Congress of Local and Regional Authorities Explanatory Memorandum, No. CPL/2015(29)4FINAL, Strasbourg.
Specific solutions are needed in metropolitan areas – Prague, Brno and Ostrava – that have expanded to include hundreds of municipalities beyond the city core. As families moved out of the high-density core, they created new demands on these areas for services like childcare and transportation. Land use changes also have knock-on environmental effects including to flooding risks. The large number of governments hampers coherent and strategic policy-making and therefore planning of land use and transport. These borders also create mismatches between users of services and local taxpayers. A growing body of evidence suggests that fragmentation erodes the agglomeration benefits of cities that are gained through learning, specialisation and deeper labour markets (Bartolini, 2015; Ahrend et al., 2014; OECD, 2015g). Estimates for OECD countries from Bartolini (2015) imply that halving the average degree of fragmentation in urbanised regions could increase the pace of annual growth in GDP per capita by 4%. One mitigating factor is that the core metropolitan areas are not fragmented (Figure 2.11). Yet even with half as many municipalities, Prague and Brno would remain more fragmented than the average OECD metropolitan area.
In all three Czech metropolitan areas, governance bodies (e.g. jointly owned companies) run integrated transport systems, successfully overcoming municipal and regional borders. Metropolitan governance bodies are increasingly being used in OECD countries to offset municipal fragmentation. Ahrend et al. (2014) find that these bodies typically halve the cost that fragmentation imposes on labour productivity. In the Czech case, the focus should be on improving co-ordination of land use planning, including to address urban sprawl resulting from inadequate co-ordination. Even expanding the transport system is complicated when it crosses through municipalities. In 2014 the City of Prague proposed a strategic plan for the metropolitan area but it does not appear to involve significant co-operation with the municipalities in Central Bohemia. Prague’s Institute for Planning and Development could be extended to the full metropolitan area and include all stakeholders. Similar arrangements should be established in Brno and Ostrava. Effective governance arrangements would set out co-ordinated land use plans for the cities’ development and co-ordinate processes such as building permits. Strategic planning would also help prepare for future challenges, such as in Ostrava, where the population is in trend decline, and to provide more equal access to public services such as childcare and transport.
Using revenue decentralisation with performance indicators to improve service delivery
Sub-national governments are mostly financed through a mix of shared taxes (personal and corporate income tax and VAT) and grants and transfers from the central government. A little over 60% of municipalities’ revenue is from taxes, while for regions over 60% of revenue is from grants and transfers (Table 2.6). Compared to other OECD countries, sub-national governments have relatively little autonomy over revenues. Local governments’ raise just 1.2% of total tax revenue – the smallest share in the OECD. This makes Czech regions and municipalities much more reliant on revenue from the central government, through shared taxes, grants and transfers. Shared taxes are distributed according to the formulae discussed below, while grants and transfers are generally earmarked. Municipalities have more revenue from their own sources than regions, including recurrent taxes on immovable property, user charges and also property income (from infrastructure). However, their autonomy over property tax is limited by centrally determined restrictions, as are some user charges.
Recurrent tax on immovable property is currently relatively low, at 0.7% of general government tax revenue, compared to the OECD average of 3.3%. Moreover, it accounted for 2% of consolidated sub-national government revenue in 2013, compared to 9% on average in the OECD. This is partly because most municipalities do not impose tax rates above the minimum level, even though they have the power to charge up to five times more. Increasing the relative role of recurrent taxation on immovable property would increase the share of municipal revenues that are directly controlled and could form part of a growth-enhancing tax reform, as recommended in earlier Economic Surveys but changing the system has been difficult (OECD, 2006, 2011a). Nonetheless, it should be pursued and could also help drive improvements in public service provision by strengthening the link between taxation and services (OECD, 2015h). Most importantly, the calculation should be based on the property’s value, rather than size, with these values regularly updated, as in most OECD countries. A co-ordinated reform may help overcome political economy issues at the local level. To avoid unintended consequences such as urban sprawl, changes should be combined with land-use planning instruments such as controls over zoning (Blöchliger, 2015). Measures such as tax deferrals for seniors could be used to mitigate the burden on liquidity-constrained households.
The formula for allocating shared taxes has been the subject of much debate. The shares for regions and municipalities overall are set annually; for 2016, the shares are around one-tenth and one-fifth, respectively (Table 2.7). Each individual region’s share is set in the legislation. The calculation for municipalities is more complicated but the population size is the main determinant. There is a link to activity (to shares of employees and entrepreneurs) but it affects less than 1% of the shared revenue pool. The link to the number of entrepreneurs will be cancelled from 2017, partly due to administrative problems. The link to employment income could be strengthened to increase the incentives to improve efficiency and grow the tax base. Given the degree of municipal fragmentation and the need for more inter-municipal co-operation, it may be better to measure activity in the 205 municipal groupings, or even regions. If the link was increased substantially, explicit fiscal equalisation grants based on differences in revenue-raising capacity should then be used to address concerns about horizontal equity more efficiently, with the degree of equalisation chosen based on national preferences. Such grants should be based on a few core indicators that are immune to manipulation, and periodically reviewed (OECD, 2015h).
The vast majority of grants and transfers to sub-national governments are earmarked, notably for education and investment spending. Earmarking is generally associated with lower efficiency, particularly when the grants do not require matched funding (Bergvall et al., 2006). According to the OECD Fiscal Decentralisation database, 91% of grants were non-matching earmarked grants in 2010, and the remainder were earmarked but required matched funding. Earmarking also limits governments’ ability to adjust service provision to local needs. In education, transfers for direct costs (to regions and from regions to municipally run schools) are made on a per student basis but do not adequately reflect costs and do not encourage efficiency (Shewbridge et al., 2016). Part of the regions’ revenues earmarked for education is for municipally-run schools, which complicates administration and assessment of the system (ibid.). There is substantial scope to shift toward greater use of block grants, which would encourage innovation and efficiency gains. To safeguard performance this should be accompanied by greater use of benchmarking, including measures of quality, and minimum service levels. By increasing fiscal autonomy, spending on growth-enhancing projects such as infrastructure investment may increase (Kappeler et al, 2013).
As part of the Strategic Framework for the Public Administration, transfers to municipalities for performing delegated administrative functions are being reviewed. These transfers are currently based on the service performed and the municipality’s size. Municipalities with extended powers receive an additional transfer that is also a function of its size relative to the rest of its administrative area. However, there is little relationship between the cost of service provision and the transfers being made for these services. There is also no allowance for the possibility of declining marginal costs as municipal size rises (even for services such as a population register). The formula should be reformed to better reflect cost, accompanying the streamlining of responsibilities proposed above.
Strengthening the macro-fiscal framework
The financial management of Czech sub-national governments has been fairly sound, with sub-national debt totalling just 4% of GDP in 2014 or 7% of total debt, compared to 11% on average in other unitary countries (OECD Government at a Glance database). Although debt has increased in nominal terms, it has been broadly in line with GDP growth. Debt is concentrated in the four largest cities and the median municipal debt level was around CZK 3 500 per capita (EUR 130) in 2015 (based on the national definition). Regional governments are more indebted; the average debt per capita across regions is CZK 19 200 and Prague has the highest debt per capita (CZK 32 100). The Ministry of Finance monitors the indebtedness of all sub-national governments and issues warnings about those at risk of insolvency. However, there is currently no binding rule about budget balances or debt, except that bond issuance must be approved (which does not affect small municipalities). Indebtedness is not considered a risk to the economy, but some, mostly small, municipalities are heavily indebted (Table 2.8). Only three municipalities are considered to be at high risk of insolvency (Ministry of Finance, 2015). The 2014-20 EU programming period may see sub-national governments making greater use of debt to fund the co-financed parts of projects, particularly since banks are promoting loans more actively and interest rates are unusually low.
The planned fiscal framework includes an explicit debt ceiling for local government (see Assessment and Recommendations). When debt (using the national accounts definition) reaches 60% of income averaged over the previous four years, the Ministry of Finance will divert transfers towards debt repayment. The appropriate level is difficult to determine and would depend on factors that vary considerably, such as vulnerability to macroeconomic shocks and history of fiscal prudence (based simulations by Fall et al. (2015) for general government debt). A debt brake could complement the ceiling by slowing the accumulation of debt, thereby preventing the painful adjustments required at the ceiling. One unresolved issue in the announced framework is the situation of those municipalities with debt burdens at risk of insolvency. To avoid creating moral hazard, they should not be bailed out. A second issue is that future changes by the central government to tax policy or the funding formulae could have large implications for municipalities close to the ceiling. Guidelines should be provided about the policy response in this situation. An important ex ante measure is to grant the Supreme Audit Office powers to review sub-national governments (as recommended above).
Enhancing the effectiveness of public administration
-
Further improve tools and rules to increase use of joint procurement by public entities. Increase auditing throughout the process and monitoring of processes and outcomes.
-
Establish specialist competency centres to help public bodies and local governments with technical procurement contracts.
-
Designate responsibility for the co-ordination and prioritisation of investments on the basis of the highest social return. Evaluate investment needs in a standardised way across sectors and use cost-benefit analysis for all large projects.
-
Increase monitoring and accountability throughout the investment cycle, from project selection through to ex post evaluation.
-
Use and publish standardised performance indicators for publicly funded activities at all levels of government. Increase the use of benchmarking.
-
Extend the national and regional standing conferences for EU-funded projects to all significant investment projects and cross-cutting public policies.
-
Give the Supreme Audit Office powers to audit all public bodies and local government.
-
Review the implementation of the Civil Service Act, including the capacity of human resources units, the overall remuneration system and conditions and staff engagement.
-
Introduce conflict of interest disclosures and create a register of private interests for officials involved in procurement.
Realising the benefits of decentralisation
-
Establish framework conditions which help municipalities to reap the benefits from joint service provision, while building support for mergers.
-
Increase incentives and technical support for mergers.
-
Increase local capacity through technical assistance and supporting shared services centres. Consider establishing a minimum size required for carrying out certain municipal functions.
-
Reduce the share of grants and transfers that are earmarked and ensure adequate service standards are maintained by monitoring performance.
-
Simplify the system of territorial administration by completing the transition from the system of districts and streamlining delivery of delegated functions at municipal level.
-
Increase incentives in local government revenues to grow local economies. Use a fiscal equalisation component to adjust for differences in revenue-raising capacity.
-
Proceed with plans to introduce a debt rule for local governments.
Bibliography
Ahrend, R., E. Farchy, I. Kaplanis and A.C. Lembcke (2014), “What Makes Cities More Productive? Evidence on the Role of Urban Governance from Five OECD Countries”, OECD Regional Development Working Papers, No. 2014/05, OECD Publishing, Paris.
Bartolini, D. (2015), “Municipal Fragmentation and Economic Performance of OECD TL2 Regions”, OECD Regional Development Working Papers, No. 2015/02, OECD Publishing, Paris.
Bergvall, D., C. Charbit, D.J. Kraan and O. Merk (2006), “Intergovernmental Transfers and Decentralised Public Spending”, Public Governance and Territorial Development Directorate, OECD Publishing, Paris.
Blöchliger, H. (2015), “Reforming the Tax on Immovable Property: Taking Care of the Unloved”¸ OECD Economics Department Working Papers, No. 1205. OECD Publishing, Paris.
de Castro, F., M. Salto and H. Steiner (2013), “The Gap between Public and Private Wages: New Evidence for the EU”, Economic Papers, No. 508, European Commission, Brussels.
Dutu, R. and P. Sicari (2016), “Public Spending Efficiency in the OECD: Benchmarking Health Care, Education and General Administration”, OECD Economics Department Working Papers, No. 1278, OECD Publishing, Paris.
Dvořáková, Z. and A. Strolený (2011), “Social Dialogue and the Public Services in the Aftermath of the Economic Crisis: Strengthening Partnership in an Era of Austerity in the Czech Republic”, National Report, Kings College, London.
EconLab (2016), Czech Single-bid Procurement in 2015, Prague.
European Commission (2016a), Country Report: Czech Republic, Commission staff working document.
European Commission (2016b), “e-Government in the Czech Republic”, Joinup e-Government factsheet, January 2016, https://joinup.ec.europa.eu/sites/default/files/ckeditor_files/files/eGovernment%20in%20Czech%20Republic%20-%20February%202016%20-%20v2_00.pdf.
European Commission (2015a), Country Report: Czech Republic, Commission staff working document.
European Commission (2015b), Czech Republic: E-Government State of Play, Country Factsheet.
European Commission (2014), “Businesses’ Attitudes towards Corruption in the EU”, Flash Eurobarometer Report, No. 374, Brussels.
Fall, F., D. Bloch, J.-M. Fournier, P. Hoeller (2015), “Prudent Debt Targets and Fiscal Frameworks”, OECD Economic Policy Papers, No. 15, OECD Publishing, Paris.
Freedom House (2015), Nations in Transit 2015: Czech Republic, https://freedomhouse.org/report/nations-transit/2015/czech-republic.
Holzer, M., J. Fry, E. Charbonneau, G. Van Ryzin, T. Wang and E. Burnash (2009), “Literature Review and Analysis Related to Optimal Municipal Size and Efficiency”, Local Unit Alignment, Reorganization, and Consolidation Commission, New Jersey.
Jetmar, M. (2015), “Preference obcí a měst při zajištění vybraných veřejných služeb formou meziobecní spolupráce” [Preference villages and towns in the provision of selected public services through inter-municipal co-operation], Conference proceedings, 18th International Colloquium on Regional Sciences, 17-19 June 2015, Hustopeče, pp. 456-62.
Kappeler, A., A. Solé-Ollé, A. Stephan, and T. Välilä (2013), “Does Fiscal Decentralization Foster Regional Investment in Productive Infrastructure?”European Journal of Political Economy, Vol. 31(C), pp. 15-25.
Ladner, A. and R. Steiner (2003), “Die Schweizer Gemeinden im Wandel: Konvergenz oder diverrgenz?”, Swiss Political Science Review, Vol. 9, No. 1, pp. 233-259.
Lausev, J. (2014), “What has 20 Years of Public-Private Pay Gap Literature Told Us? Eastern European Transitioning vs Developed Economies”, Journal of Economic Surveys, Vol. 28, No. 3, pp. 516-550.
Ministry of Finance (2013), “Box 1: Investments of general government sector during 2009-2012”, Fiscal Outlook of the Czech Republic, November.
Ministry of Finance (2015), Zadluženost územních rozpočtů v roce 2014 [Indebtedness of local budgets in 2014], www.mfcr.cz/cs/verejny-sektor/uzemni-rozpocty/zadluzenost-uzemnich-rozpoctu/2014/zadluzenost-uzemnich-rozpoctu-v-roce-201-21237.
Ministry of Interior (2014), Strategic Framework of the Development of Public Administration in the Czech Republic for 2014 -2020.
Ministry of Interior (2012), Analýza výkonu státní správy u obcí se základním rozsahem přenesené působnosti (s návrhem řešení) [Analysis of the performance of State administration in municipalities with a basic range of delegated scope (with design solutions)].
Ministry of Regional Development (2015), Výroční zpráva o stavu veřejných zakázek v České republice za rok 2014 [Annual report on state procurement in the Czech Republic], Prague.
Ministry of Regional Development (2014), Regional Development Strategy of the Czech Republic 2014-2020 (Summary), Prague.
OECD (2016), “Multi-level Governance Reforms: Overview of OECD Country Experiences”, OECD Publishing, Paris, forthcoming.
OECD (2015a), “Lifting Investment for Higher Sustainable Growth”, in OECD, OECD Economic Outlook, Vol. 2015, Issue 1, OECD Publishing, Paris, https://doi.org/10.1787/eco_outlook-v2015-1-46-en.
OECD (2015b), Government at a Glance, OECD Publishing, Paris, https://doi.org/10.1787/gov_glance-2015-en.
OECD (2015c), OECD Recommendation of the Council on Public Procurement, Directorate for Public Governance and Territorial Development.
OECD (2015d), “Using Human Resources Management Strategies to Support Strategic Agility”, in Achieving Public Sector Agility at Times of Fiscal Consolidation, OECD Publishing, Paris, https://doi.org/10.1787/9789264206267-5-en.
OECD (2015e), “Effective Implementation of Digital Government Strategies” in OECD, OECD Public Governance Reviews: Estonia and Finland: Fostering Strategic Capacity across Governments and Digital Services across Borders, OECD Publishing Paris, https://doi.org/10.1787/9789264229334-10-en.
OECD (2015g), The Metropolitan Century: Understanding Urbanisation and its Consequences, OECD Publishing, Paris, https://doi.org/10.1787/9789264228733-en.
OECD (2014a), “Completing the Transition to a Competitive Domestic Economy”, in OECD, OECD Economic Surveys: Czech Republic 2014, OECD Publishing, Paris, https://doi.org/10.1787/eco_surveys-cze-2014-5-en.
OECD (2014b), Toolkit on Effective Public Investment across Levels of Government: Czech Republic.
OECD (2014c), Recommendation of the Council on Effective Public Investment across Levels of Government.
OECD (2014d), “Local Public Finances and Municipal Reform”, in OECD, OECD Economic Survey of Finland, OECD Publishing, Paris, https://doi.org/10.1787/eco_surveys-fin-2014-5-en.
OECD (2014e), OECD Reviews of Health Care Quality: Czech Republic 2014: Raising Standards, OECD Publishing, Paris, https://doi.org/10.1787/9789264208605-en.
OECD (2014f), “Multi-level Governance Challenges in the Netherlands” in Multi-level Governance Challenges in the Netherlands, OECD Publishing, Paris, https://doi.org/10.1787/9789264209527-7-en.
OECD (2013a), Government at a Glance 2013, OECD Publishing, Paris, https://doi.org/10.1787/gov_glance-2013-en.
OECD (2013b), Investing Together: Working Effectively across Levels of Government, OECD Publishing, Paris, https://doi.org/10.1787/9789264197022-en.
OECD (2013c), Fiscal Federalism 2014: Making Decentralisation Work, OECD Publishing, Paris, https://doi.org/10.1787/9789264204577-en.
OECD (2011a), “Enhancing Public Spending Efficiency”, in OECD Economic Survey of the Czech Republic, OECD Publishing, Paris, https://doi.org/10.1787/eco_surveys-cze-2011-4-en.
OECD (2011b), Government at a Glance, OECD Publishing, Paris, https://doi.org/10.1787/gov_glance-2011-en.
OECD (2006), “Ensuring Fiscal Sustainability: Motivating Regional and Municipal Governments”, in OECD Economic Survey of the Czech Republic, OECD Publishing, Paris, https://doi.org/10.1787/eco_surveys-cze-2006-5-en.
OECD (2003), Recommendation of the Council on OECD Guidelines for Managing Conflict of Interest in the Public Sector.
Office of the Government of the Czech Republic (2015), National Reform Programme of the Czech Republic, Prague.
Office for the Protection of Competition (UOHS) (2015), 2014 Annual Report.
Ondráčka, D. (2007), Why Study PPP (Public Private Partnership) with Caution?, Transparency International – Czech Republic, Prague.
Pavel, J. (2010), “The Analysis of the Relationship between the Rate of Competition and the Prices of Large Transport Infrastructure Buildings”, Politickáekonomie, Vol. 58, No. 3, pp. 343-356.
Perlín, R. (2006), “The co-operation of rural municipalities – chance or condition of achievement”, Agricultural Economics – Czech, Vol. 52, No. 6, pp. 263-272.
Sedmihradská, L. (2010), “Voluntary Municipal Associations in the Czech Republic: Unfulfilled Expectations?” in P. Swianiewicz (ed.) Working Together: Intermunicipal Co-operation in Five Central European Countries, Open Society Foundation, http://observgo.uquebec.ca/observgo/fichiers/85195_GLR-3.pdf.
Shewbridge, C., J. Herczynski, T. Radinger and J. Sonnemann (2016), OECD Reviews of School Resources: Czech Republic, OECD Publishing, Paris, forthcoming.
Slack, E. and R. Bird (2013), “Merging Municipalities: Is Bigger Better?”, IMFG Papers on Municipal Finance and Governance, No. 14, Institute on Municipal Finance and Governance, School of Global Affairs, University of Toronto.
Spacek, D. (2015), “E-Government Policy and its Implementation in the Czech Republic: Selected Shortcomings”, Central European Journal of Public Policy, Vol. 9, No. 1, pp. 78-101.
Solé-Ollé, A. and N. Bosch (2003), “On the Relationship between Local Authority Size and Expenditure: Lessons for the Design of Intergovernmental Transfers in Spain”, in G. Färber and N. Otter (eds.), Reforms of Local Fiscal Equalization in Europe, Speyerer Forschungsberichte, No. 232, Forschungsinstitut für Öffentliche Verwaltung, Speyer am Rhein.
Šťastná, L. and M. Gregor (2015), “Public sector efficiency in transition and beyond: evidence from Czech local governments”, Applied Economics, Vol. 47, No. 7, pp. 680-699.
Supreme Audit Office of the Czech Republic (SAO) (2015a), EU Report 2015: Report on the EU Financial Management in the Czech Republic.
Supreme Audit Office of the Czech Republic (SAO) (2015b), Annual report for the year 2014.
Supreme Audit Office of the Czech Republic (SAO) (2015c), “Increasing the efficiency of public administration: goals not met because of insufficient coordination; errors amounted to CZK 226 million”, Press release, 29 June 2015.
Swianiewicz, P. (2010), “Demanded but Difficult: Intermunicipal Co-operation in Central and Eastern Europe” in P. Swianiewicz (ed.) Working Together: Intermunicipal Co-operation in Five Central European Countries, Open Society Foundation, http://observgo.uquebec.ca/observgo/fichiers/85195_GLR-3.pdf.
← 1. The statistical data for Israel are supplied by and under the responsibility of the relevant Israeli authorities. The use of such data by the OECD is without prejudice to the status of the Golan Heights, East Jerusalem and Israeli settlements in the West Bank under the terms of international law.