Chapter 1. Reigniting growth through productivity-enhancing reforms
Over the past decade sound macroeconomic policies and an improved business environment have helped generate relatively strong GDP growth. Investments in infrastructure are improving connectivity and trade integration has been facilitated by lower tariffs. Simplification in opening of businesses, getting construction permits, registering property and payment of taxes improved the ease of doing business. Nevertheless, labour productivity remains low with large differences between firms and regions, and the contribution of technological progress to growth has been negative in recent years. Low productivity growth reflects poor educational and managerial quality, still large infrastructure gaps, low investment in innovation and R&D and stringent regulations in some sectors. To raise productivity growth Colombia should focus on some key areas. First, reverse the drop in public investment and reduce high transport and logistics costs. Second, intensify trade links and participation in GVCs, by further improving trade facilitation, to encourage firms to adopt the best technologies and know how. Third, create better incentives for firms to invest on R&D, and strengthen the links between the business sector and research institutions to foster innovation. Fourth, increase competition and reduce regulation in specific sectors to promote investment and facilitate the allocation of resources towards most productive firms. And fifth, upgrade the quality of education to develop better skills and professional management to enhance the creation and diffusion of new technologies. In 2016, the government established the National Policy for Productive Development to address the impediments to increased productivity.
Growth has been strong, driven largely by the commodity boom, while productivity growth has been low (Figure 1.1.A). The economy grew by an average of 4.3% between 2000 and 2015, significantly more than the OECD average of 1.7% (see the A&R). Strong macroeconomic policies and structural reforms contributed to this performance; for example, simplification in opening of businesses, getting construction permits, registering property and payment of taxes improved the ease of doing business. However, most of the strong growth was explained by the remarkable rise in commodity prices that attracted capital to mining, while the resulting appreciation of the exchange rate made other tradable sectors less attractive. Indeed, growth between 2000 and 2015 was driven mainly by the accumulation of physical capital (2.5 percentage points); the combined effect of population growth, employment and human capital accumulation was much less (1.7 percentage points). Total factor productivity growth, on the other hand, had a small negative contribution to GDP growth, more pronounced in the last 5 years.
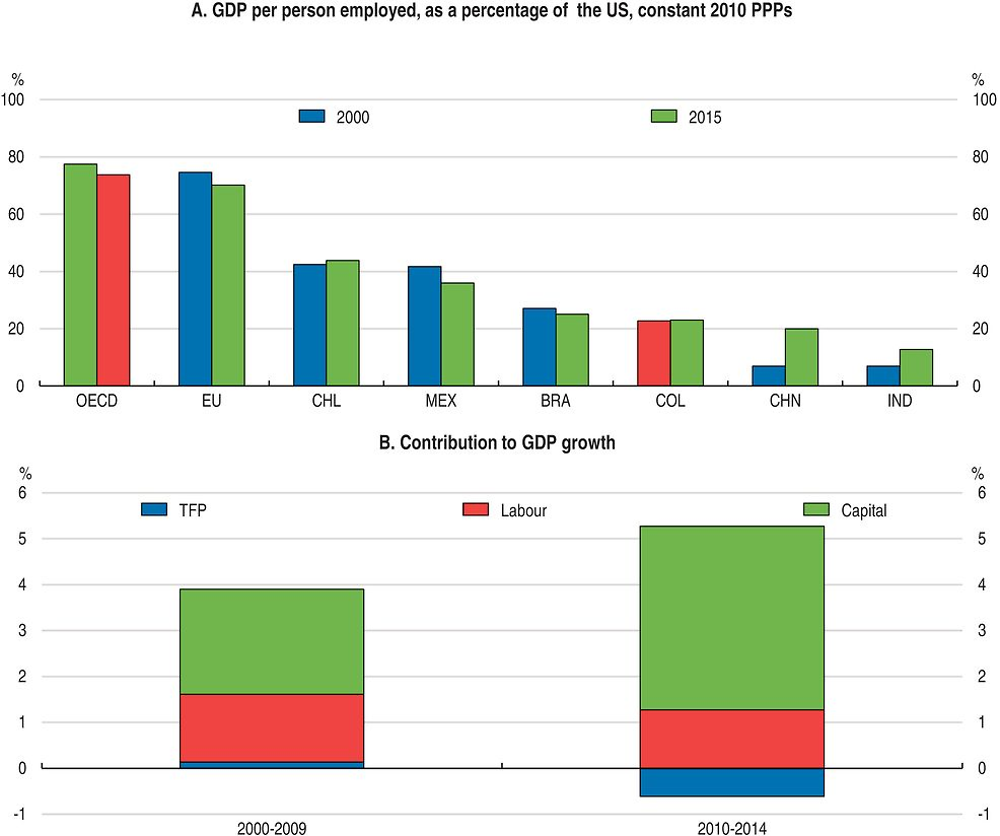
Note: For OECD and China, data refer to 2014.
Source: OECD, Productivity Statistics Database, February 2016 and OECD calculations based on the STAN database.
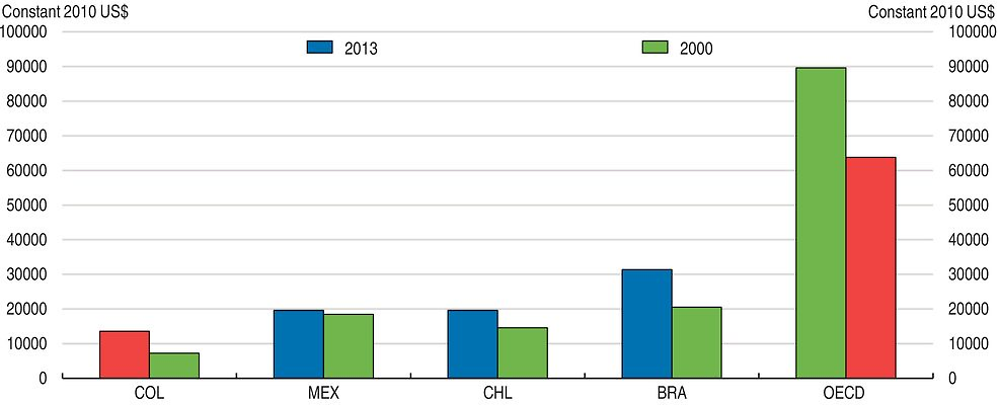
Now that the boom in commodity prices has lost steam, activity has slowed down. This is particularly worrisome as, despite progress, poverty and inequality remain high relative to the OECD average. Colombia needs to reignite growth and make it broader and more inclusive to continue making social progress (see Chapter 2). The best way to reignite growth is with productivity enhancing reforms, as productivity is the ultimate engine of growth in the long run. Four-fifths of the income gap between Colombia and OECD countries is explained by differences in labour productivity (Figure 1.2). Furthermore, productivity in Colombia is very heterogeneous, even within narrowly defined sectors, with a few very productive firms and many firms of extremely low productivity. This suggests there is room to catch up faster.
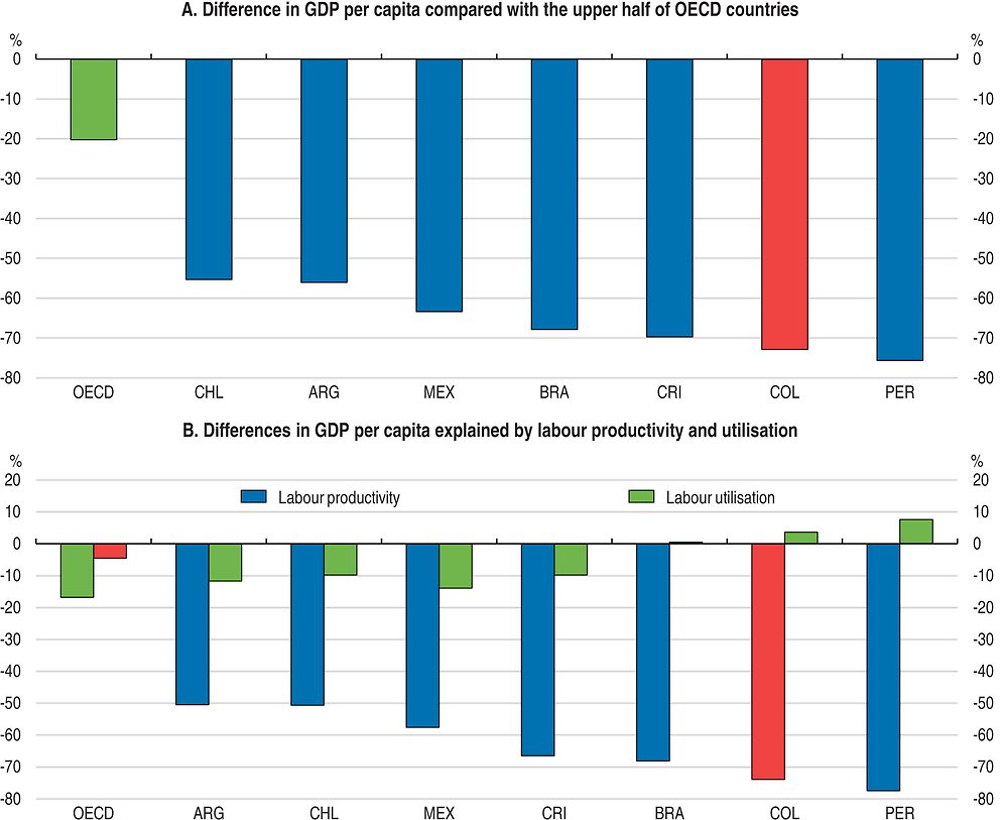
Source: OECD, Economic Outlook 99 Database.
This chapter discusses how to raise productivity in Colombia. It presents aggregate trends in productivity and its key drivers based on recent OECD work (OECD, 2015a). It takes an inclusive approach to productivity growth, hoping to enable all people and firms to raise their productive potential to yield improved aggregate productivity as well as more equitable share of the proceeds. After identifying the key factors constraining productivity growth in Colombia (infrastructure gaps, business environment, informality in labour markets, skills, innovation, global value chains and institutional settings), it makes relevant recommendations to raise productivity.
Trends in productivity across sectors, firms and regions
Recent OECD research shows that to uncover productivity weaknesses and their causes, it is important to look at total factor productivity, but also at productivity indicators at the industry and firm level, as aggregate productivity is shaped by structural factors that operate at the industry or firm level (Albrizio and Nicoletti, 2016; Box 1.1). These indicators include, among other things, the degree of heterogeneity in productivity performance across regions, sectors and firms, including proximity to global or national frontier, and industry composition, as cross-country differences in observed labour productivity developments partly reflect differences in industry structure.
In 2015, the value added of the industrial sector in Colombia was 34% of GDP, the highest among the 6 largest economies in Latin America and significantly higher than the OECD average of 24% (WDI, 2016). However, this high share is mainly explained by the Mining and Construction sectors as the importance of Manufacturing has been declining and is lower than the OECD average (Figure 1.3). The large mining sector also dominates exports (more than 40% of total exports in 2015 was oil and its derivatives, DANE) and industrial production, and has attracted much of investment over the last decade. The boom in mining generated a strong real appreciation of the currency, making it harder for other tradable goods, like parts of agriculture and particularly manufactures, to compete. It also attracted resources into non-tradables such as housing and construction.
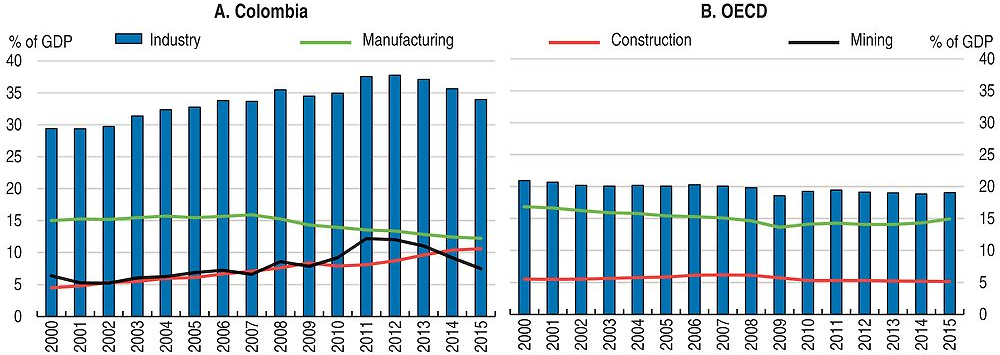
Source: OECD National Accounts Database and DANE.
Firm-level evidence shows that, in Colombia, productivity is correlated with size, age, regional location and participation in GVCs (Camacho and Conover, 2010; Eslava and Haltiwanger, 2012). Most manufacturing businesses are small and medium size that tend to have low productivity, often due to informality that reduces incentives to grow. Medium sized manufacturing plants account for 48% of total manufacturing establishments, generating 15% of employment. Large and very large ones are 32% of establishments and 83% of employment; small plants, 21% of total, only contribute to 1.8% of employment (Brown et al., 2015). There are significant differences in firm productivity across regions; for instance, manufacturing firms in Santander and Casanare are around 500 per cent more productive than firms in Nariño or Quindio.
Similarly, there are large differences in productivity between industrial sectors and firms within sectors. Firm-level productivity in the manufacturing sector remains far from the global productivity frontier. The average firm is only 5.5 % as productive as the global productivity frontier (defined as the top 25% of firms in the United States) – (Brown et al., 2015).
There is a large dispersion in productivity growth among firms in manufacturing, which usually indicates inefficient allocation of factors of production among firms. While heterogeneity of firm level productivity is common around the world, the dispersion in Colombia is much higher than in OECD countries and especially the United States. In Colombia, firms in the 90th percentile of the productivity distribution are more than 500% more productive than those in the 10th percentile in contrast with 200 % in the U.S. (Busso et al., 2012). This is also the highest level of dispersion in all Latin American countries for which data is available. Such disparities mean that some firms are able to produce much more given the same inputs, within the same sector.
Colombia’s low performance of manufacturing companies reflects in part high costs and poor incentive structures (DNP, 2016). Costs beyond the influence of firms make it harder for them to compete with external competitors both on domestic and export markets, limiting their ability to exploit scale economies. For example, lack of adequate public infrastructure is a result of regulatory gaps, such as investment requirements; low and inefficient public investment in transport, telecommunications and education. However, some of the regulation issues have been addressed, for example in transportation infrastructure. Skills shortages, high informality and corruption may also have a negative effect on firms’ growth and investment. Distorted incentives, including low competitive pressures, mean that firms will not exploit the full potential of internal productivity improvements. They can also impede the functioning of market mechanisms that reallocate resources towards the most productive firms, including new entrants. Low productivity also reflects the economy’s concentration on few sectors of low sophistication and little value added (DNP, 2016).
The high dispersion in productivity shows potential for productivity catch-up to raise aggregate productivity. Raising the currently limited trade integration into global value chains can foster the adoption of frontier technologies and new business models, reducing the large productivity gaps. Global trends that have shaped industrial production have largely bypassed Colombia’s industry. These include a growing fragmentation and optimisation of value chains, which have allowed companies to focus on their core capabilities, and increased integration into international trade. Intermediate inputs have come to represent a large share of world trade flows as part of the emergence of global value chains. While many countries nowadays use significant amounts of imported goods to produce exports, almost 90% of the value added of Colombia’s exports is domestically produced (see below).
Productivity is also low in agriculture (Figure 1.4.C). The agricultural sector continues to be of key importance in terms of GDP and employment (Figure 1.4, Panels A and B). Its share in value added (in GDP) is almost 7%, which is four times higher than the OECD average (1.6%), and higher than in the large Latin American countries. Similarly, employment in agriculture is above 16% of total compared to 6% in the OECD.
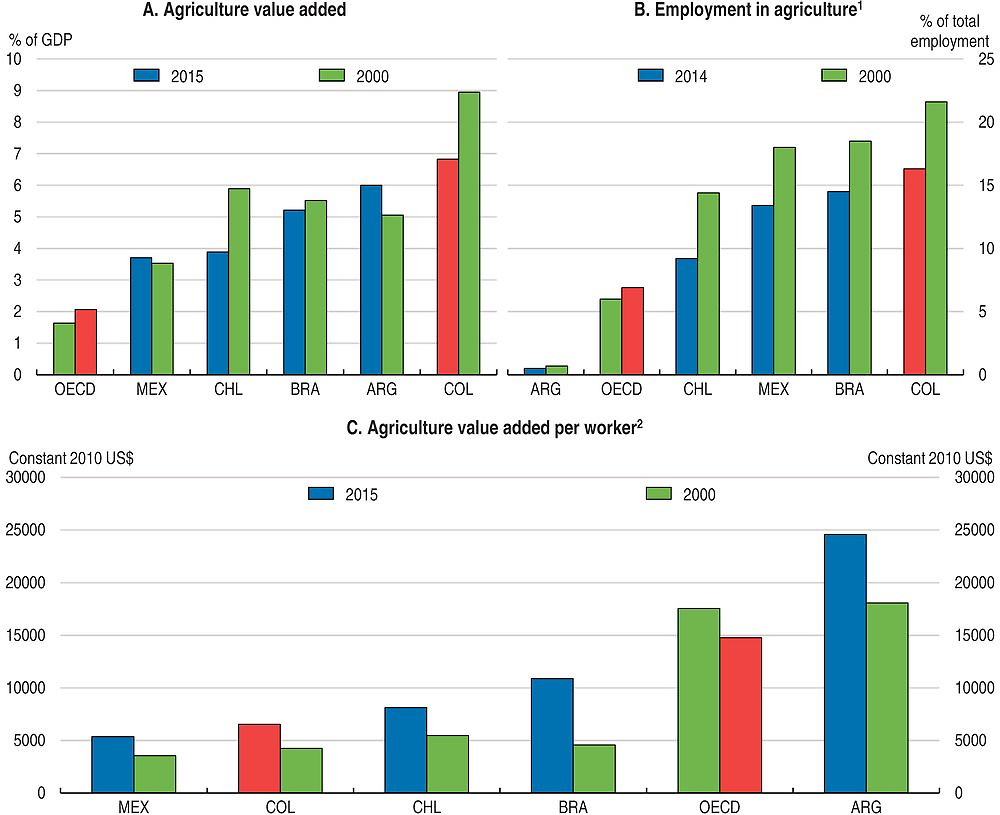
1. For Brazil, Chile and Mexico, data refer to 2013.
2. For OECD, data refer to 2014 instead of 2015.
Source: World Bank, World Development Indicators database.
Productivity growth in agriculture has been undermined by a variety of factors (OECD, 2015c). The high cost of transport due to poor internal basic infrastructure connecting producing regions to consumption centres and ports raise trading costs. Agricultural policy has been heavily based on subsidies and price smoothing mechanisms, with less attention to productivity enhancing investments (such as infrastructure and R&D). Finally, as compensation for the unequal distribution of land, current legislation regarding land tenure and ownership does not favour the creation of new large-scale production plots. Combined, this factor led to the poor agriculture outcomes observed in the last decade.
The service sector plays a major role in the Colombian economy, as it explains a high share of the gross domestic product and employment. Nearly 60% of the GDP and 70% of the workforce are in the service sector (DANE). Furthermore, firms in the service sector innovate more than their manufacturing counterparts (Gallego et al., 2015): The share of innovators in the service sector is almost 14% larger than in manufacturing, and the share of non-technological innovators is about three times as large in the service industry. However, productivity growth in services remains well below OECD and large Latin American countries (Figure 1.5).
1. For Brazil, Chile and Mexico, data refer to 2013.
2. For OECD, data refer to 2014 instead of 2015.
Source: World Bank, World Development Indicators database.
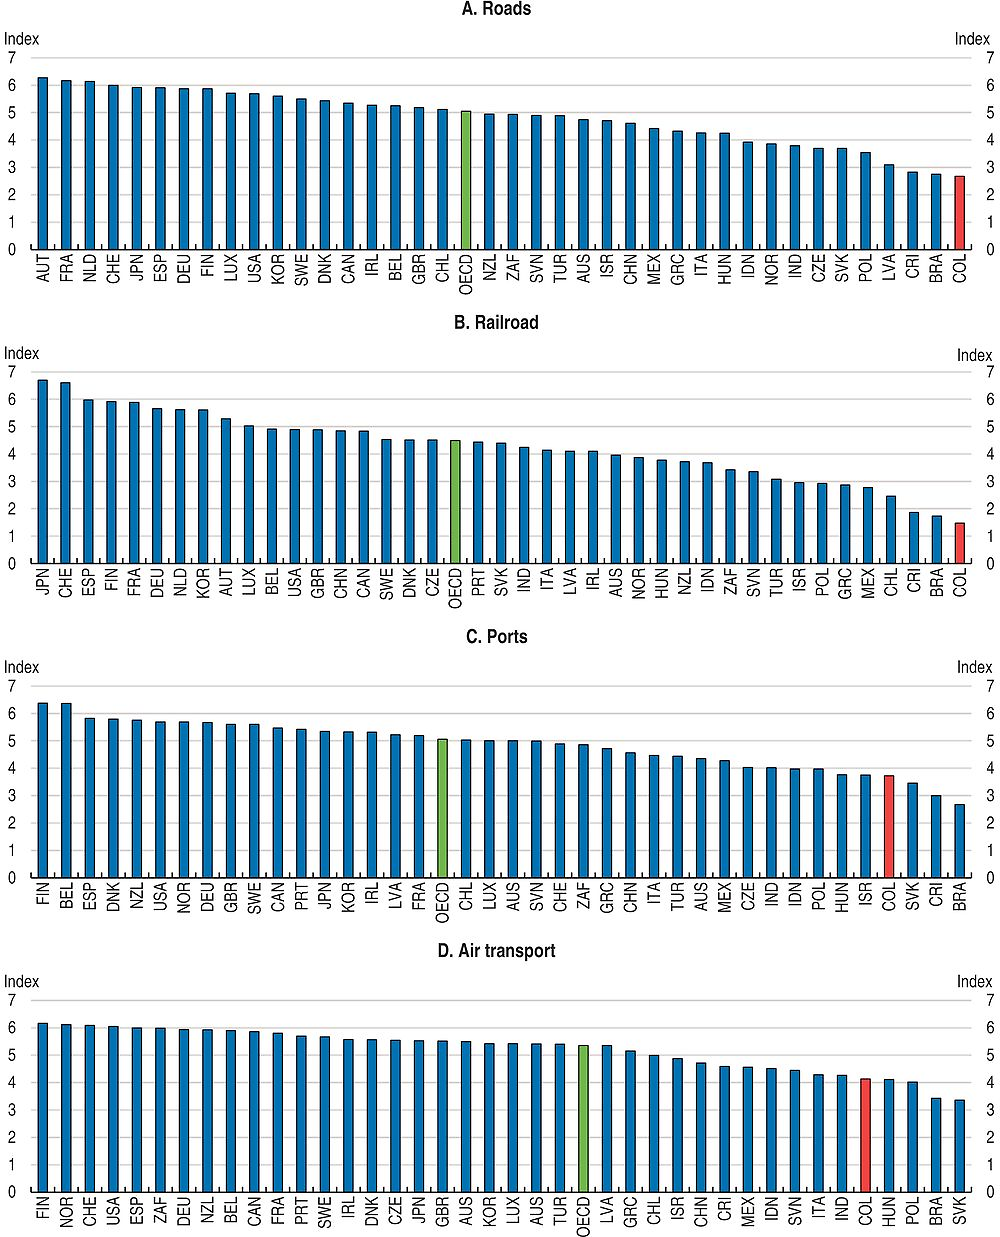
Note: Index scale 1-7, from lowest to highest quality. For OECD, data refer to the simple average of values for all OECD countries.
Source: World Economic Forum, the Global Competitiveness Index Historical Dataset, 2005-2014.
Given its importance in the economy, to reignite economic growth and improve the foundations for the future performance of the economy, the services sector will need to do better. Cross-country evidence from OECD suggest that low productivity in services could be related to high informality, which affects job prospects for low-skilled workers, impediments that prevent services firms from seizing the benefits of ICT, stringent employment protection legislation that affects the capacity of the economy to create and reallocate employment, poor education and training policies that prevent workers to rapidly adopt requirements for new skills, and regulatory policies.
More and better public investment can boost productivity growth by reducing gaps in infrastructure
Despite significant improvements over recent years, the transport and logistics infrastructure, which is the backbone of domestic commerce and international trade, remains less developed than in OECD or other Latin American countries (Figure 1.6). Road density coverage and percentage of paved roads is relatively low. Also connectivity between the most important agricultural production, consumption, and export areas, and ports and airports is limited. High domestic transportation costs related to the country’s difficult geography and internal conflict act as a significant barrier to improvements in competitiveness, and particularly penalise the regions that are far from adequate port or airport facilities.
The differences in labour productivity across regions are influenced by high costs of domestic transportation. This affects the ability of firms in these regions to compete in domestic and international markets, which tends to raise productivity. Exporting and exposure to international competition allows firms to benefit from international technologies and best practices. The low connectivity is reflected in export performance, which varies markedly from region to region. For example, just four departments – Antioquia, Bogotá, Cundinamarca, and Valle del Cauca –, account for approximately half of the country’s exports (DANE). The high concentration of exporting activity in the main metropolises suggests that Colombia’s integration into world markets has not produced a significant dispersion of production away from the large centres and particularly towards the non-coastal regions. Exporters in the south-eastern part of the country face various obstacles, including very low road density. All of these factors limit connectivity for exporters in remote regions (Fedesarrollo, 2013).
Reducing transport costs by improving or investing in new roads can have large benefits. The trade impact of reduced transportation costs from better conditions on all roads can be important (IDB, 2013). At the national level, a reduction of 1% in domestic transport costs (ad valorem) could increase annual exports by 7.8% in the manufacturing sector and 7.9% in agriculture. Therefore, fostering trade, and in particular improving the chances of less developed regions to benefit from international trade, is highly dependent on the quality of transport-related infrastructure.
Improving non-road rural infrastructure is also key to increasing productivity in agriculture (Lozano-Espitia and Ramirez-Villegas, 2016). Deficiencies in physical infrastructure such as irrigation not only reduce factor productivity and crop yields, but also weaken market competitiveness and limit their spatial and temporal integration (Fan, Zhang and Rao, 2004; Pinstrup-Andersen and Shimokawa, 2006). The irrigation system coverage was 8% which is low compared to other countries in the region (Chile, 44%; Peru 40%; Brazil 18% and Argentina 15%). There are also great discrepancies within regions. The majority of municipalities do not have access to irrigation districts, simply because there are none available and only a very small number (178 out of 1 122) has access to this type of infrastructure in restricted circumstances.
Recent research shows that the impact of improving the irrigation and drainage systems on crop yields in Colombia can be very large (Lozano-Espitia and Ramirez-Villegas, 2016). The larger impact is on the rice yield (oscillates between 1.7 and 3.5 tons per hectare and year), which could be associated with the higher humidity requirements for its production cycle from irrigation systems.
To reduce these large infrastructure gaps, Colombia needs to sustain and amplify its public investment effort. Public investment in relation to GDP has increased over the last decade and since 2012 is above the OECD average (Figure 1.7). This is welcome. However, the level of investment per capita remains lower than the OECD average (OECD, 2016a). Given the large investment needs to catch up with leading countries public investment should be raised and the cut in 2016 reversed (see A&R). Higher spending is also necessitated by Colombia’s geography. Mountainous terrain makes building new roads and maintaining existing ones much more expensive than in countries with flatter topography. As a result, they spend more per kilometre of transport infrastructure than other countries to maintain and build similar levels of density of its road network.
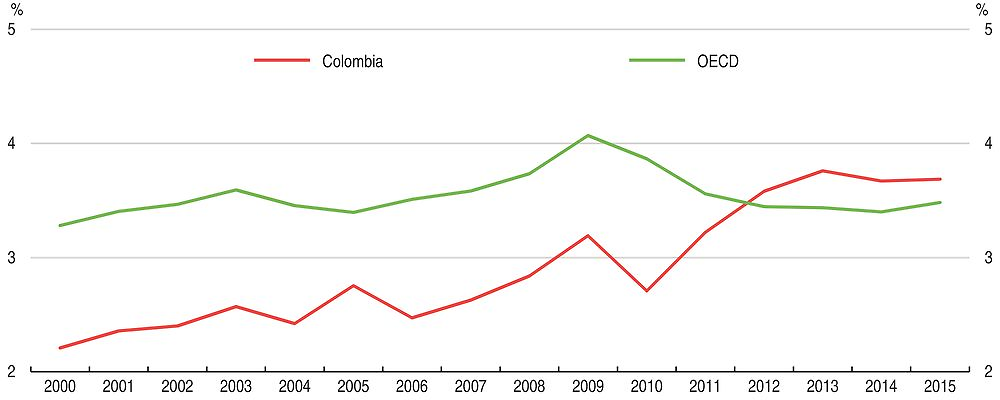
Source: OECD Economics Department Database.
Since the needed investments can hardly be undertaken by the public sector alone, public and private partnerships (PPPs) can improve transport connectivity across the country. The government has launched a new generation of public-private infrastructure programmes (fourth generation or 4G) on road concessions. Over the next eight years, the new 4G programme is expected to deliver 5 892 km of roads in three waves via public-private partnerships. With aggregate capital expenditures of USD 15 billion, the 4G concession program is the most ambitious infrastructure development initiative in Colombia’s history. As of December 2016, 32 projects through PPP schemes have been approved and 21 of them have already reached financial close. 20 projects are public initiatives, meaning that the project has been proposed, designed and funded by the Government, while the other 12 are private initiatives, which have been proposed by a private party and don’t require governmental funds. Thanks to the regulatory changes made since 2012, all the 4G projects have completed a rigorous and comprehensive analysis process involving different governmental entities (see Box 4 in the Assessment and Recommendations). The target is to reduce travel times by 30 % and transport costs by 20% by 2020. Most PPPs are for large projects financed by the central government, but subnational governments can also contract PPPs. In April 2016, the government held its first concession as a part of its highway plan. Colombian pension funds also have played a stronger role in recent years in financing infrastructure investment. In addition to the 4G program, the government has also invested in revived river and rail transport and improved telecom infrastructure and access to internet.
A recent OECD study on public investment in Colombia (Box 1.2) makes recommendations on how to use more effectively existing resources and catch up to OECD countries in infrastructure development. The study emphasises that the different investment priorities need to be articulated in coherent territorial strategies. Colombia has strongly enhanced the territorial approach to its national investment in the 2014-18 National Development Plan. At the subnational level, major efforts have also been made to improve the preparation of the territorial development plans for 2016-20.
A recent OECD study on public investment in Colombia (OECD, 2016a) provides a diagnosis of the strengths and challenges of the Colombian system and makes recommendations for how it could be further improved by using more effectively existing resources and catch up to OECD countries in infrastructure development. The main recommendations of the report are the following:
Enhance subnational revenues to finance investment through: continuing efforts to update and modernize the cadastral and land registries to improve the municipal property tax performance; streamlining the portfolio of taxes levied by departments and municipalities and promoting shared taxation between the central and subnational governments; and reducing the number of earmarked taxes.
Strengthen the effective use of local development plans as strategic planning tools. Sub-national governments should have more adequate time schedule to design territorial development plans, allowing better diagnosis and priorities setting, and better articulation between the national, departmental and municipal levels. The government should intensify the effort to increase technical assistance to subnational governments for the design of territorial development plans and land use plans and enhance local capacity.
Support the preparation of integrated investment programmes/projects, including financial plans.
Ensure continuity and stability in the rules to strengthen subnational capacities. Consider developing a comprehensive assessment (both quantitatively and qualitatively) of employees to get a clearer picture of the needs and gaps of territorial entities.
Source: OECD, (2016a).
Overall, the large differences across regions suggest that the different investment priorities need to be articulated even more in coherent territorial strategies. Colombia should move from a project based approach to a more strategic and regional approach to investment, through articulated programmes rather than just individual projects. Royalties are supposed to encourage regional projects, but in practice projects funded by royalties are split into thousands of small projects. This fragmentation means that large scale infrastructure projects with higher social returns are not prioritised. In October 2015, only 5% of the projects approved had a regional dimension (DNP, 2016a).
Greater horizontal cooperation is also required. Coordination between jurisdictions is a recurrent concern, as for many development and investment issues the relevant scale goes beyond administrative boundaries. The lack of financial incentives to support cross-jurisdictional cooperation is a significant obstacle. The General Royalties System, which was restructured in 2012 (OECD, 2014) has been a major achievement to help reduce regional and social disparities. Royalties are supposed to encourage regional-scale projects, but because of the high number of collegiate bodies of administration connected with the royalty payments, projects financed by royalties are split into thousands of projects (OECD, 2014). More coordination tools among departments, such as the creation of the Central Region (RAPE), which unites the departments of Cundinamarca, Boyacá, Meta, Tolima and the Capital District of Bogotá D.C could be implemented. The experience of France and Italy, which have put in place specific financial incentives (e.g. higher central government transfers for inter-municipal projects) to promote inter-jurisdictional cooperation, might be of interest to Colombia. The government might consider providing financial incentives to support horizontal associative schemes across municipalities and departments, for example, through matching grant or co-financing projects between the national government and subnational governments’ entities.
Further improve the business framework for investment and productivity growth
Investment as share of GDP has increased during the last 15 years, but remains below the average of other emerging economies. Most of the recent increase in investment is also explained by the investment boom in oil. To raise investment to levels of other fast growing emerging economies Colombia needs to continue developing a sound policy framework for private investment. To ensure that investment contributes to productivity, reducing regulation, strengthening competition, deepening trade integration and simplifying the tax system are particularly important. An increasing number of binding public investment commitments (Contratos Paz) between national and sub-national administrations have been signed.
Product market regulations
Colombia ranks around the OECD average in some dimensions of product market regulation, but many key sectors face restrictions (Figure 1.8). Over the last decade Colombia significantly improved its regulatory environment by simplifying the process to start a business, paying taxes, protecting investors and resolving insolvency, as well as reducing entry costs and barriers to entrepreneurs. In the restrictive areas, the state’s involvement in business operations can be further aligned with best practice. Regulatory procedures in some sectors remain complex, which includes licensing requirements. Competition in some network sectors such as gas is hampered by still high entry barriers. Aligning product market regulation with OECD best practice could boost GDP (OECD, 2015b).
Note: Index scale 0-6, from least to most stringent. More information is available at www.oecd.org/eco/pmr.
Source: OECD, Product Market Regulation Database.
The government is determined to continue enhancing the investment framework, simplifying procedures and removing unnecessary administrative burdens to investors in the National Development Plan. The National Policy of Productive Development also aims to raise the quality and pertinence of human capital, to increase the degree of both innovation and technology adoption by firms and to improve the quality of managerial skills (DNP, 2016). Colombia’s investment promotion agency, ProColombia, is in charge of promoting non-traditional exports, international tourism and foreign investment in Colombia. They are undertaking studies on barriers to investment, and are putting in place procedures to identify and remove unnecessary barriers to investment.
Competition policy
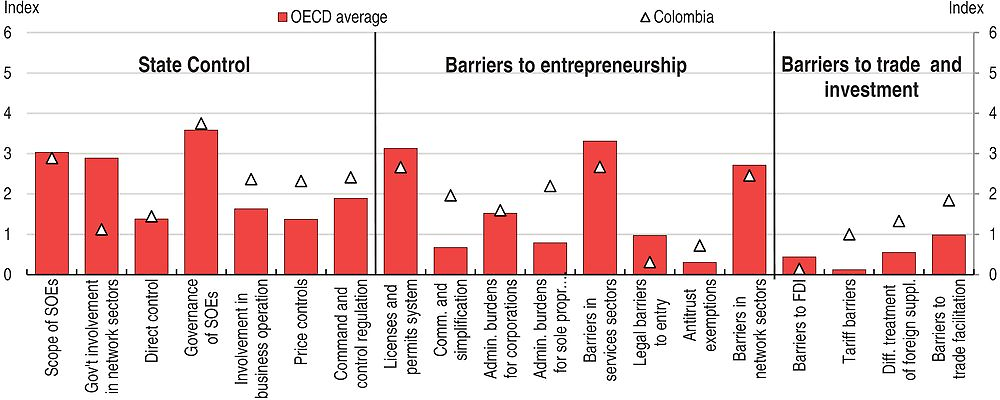
Colombia has made great strides toward OECD standards in competition policy. On product market regulation (PMR) indicators, Colombia compares well in areas of pro-competition network sector regulation, limited state economic activity, and general openness to trade (Figure 1.9). Colombia’s extent of state control is comparable to the OECD’s, consistent with the government’s policy of encouraging growth through enabling private initiative. However, as discussed below, barriers to competition are hindering well-functioning markets in important sectors.
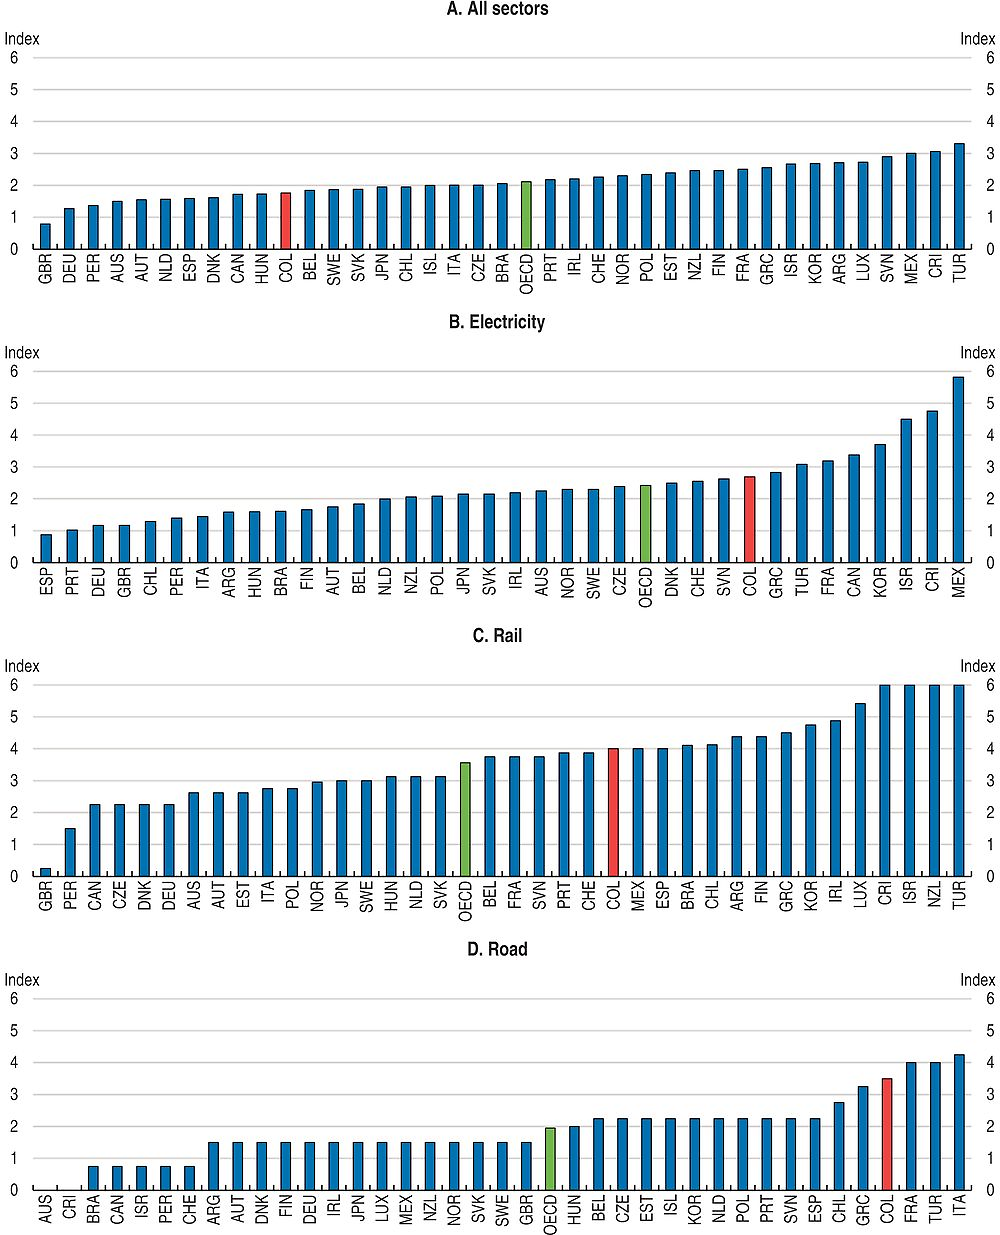
Note: Index scale 0-6, from least to most restrictive.
Source: OECD (2015), Product Market Regulation Database.
Regulation in roads and rails remains stringent (Figure 1.9). The bargaining power of truck drivers and the existence of barriers to entry affect the level of domestic transport costs (IDB, 2013). Furthermore, Colombia’s trucking industry is highly fragmented with many one-truck firms that are relatively inefficient. The cargo fleet is old and operates at only 50% capacity (in weight) which suggests an excess of supply over demand (Ministry of Transport, 2015). Also the scrapping scheme – which is currently being modified – has made it profitable to maintain old trucks, as importing a new truck requires scrapping an old one.
Continuing the regulatory reform process and increasing public-sector efficiency would further stimulate competition (OECD, 2014). The National Planning Department is in the process of becoming the single institution responsible for the coordination of regulation efforts across the administration. There are no comprehensive standards for how to prepare regulations. Although the government expressed interest in introducing regulatory impact analysis to improve the quality of new regulations, more political support will be needed to ensure the tool is used at the subnational level.
High barriers to competition prevent entry of new innovative and dynamic firms and contribute to misallocation of labour and capital resources towards low-productivity firms and sectors. Colombia could further improve the efficiency of its economy by prioritising reforms that enhance competition in services markets. The OECD Services Trade Restrictiveness Index Regulatory Database shows that regulation on broadcasting, telecommunications and insurance services remain restrictive. In broadcasting, Colombia maintains a 40% foreign equity limit for public broadcasters, and reserves 70% of screen time for local productions in prime time and 50% at other times. Moreover, the number of shares that foreign investors can acquire in public broadcasters is limited and subject to authorisation from the government. In telecommunication, there are commercial presence requirements to provide telecommunication services and the needed pro-competitive regulations are not all in place to ensure access to foreign providers. In addition, the government can overrule the decisions of the telecommunications regulator. In the insurance sector, Colombia maintains commercial presence requirements to provide cross-border services, there are restrictions in writing insurance contracts in foreign currency.
It is important that the regulatory authority is vested with the necessary powers as well as human and financial resources, and that it correctly carries out market analysis. To avoid bid rigging, public procurement officials should undertake comprehensive market studies on a consistent basis. Establishing the minimum acceptable content for market studies through the creation of a checklist, based on best practices, should be used by Colombian procurement groups when they undertake their market studies. Colombia has made progress in making regulations more accessible and communicating administrative requirements, yet regulatory management processes need to be improved, with the introduction of more systematic use of regulatory impact analysis. Colombia also lacks an appropriate legal framework to carry out market studies, together with adequate resources to effectively perform them. Market studies provide competition authorities with an in-depth understanding of how sectors and markets work.
Further reducing corporate taxes could contribute to investment growth
Colombia’s relatively high corporate taxes and a complicated tax code are important constraints for investment and productivity growth. Past tax reforms often focused on finding short term fixes instead of more fundamental structural reforms, thereby creating a very complicated system. For example, the 2012 tax reform reduced the statutory corporate income tax (CIT) rate from 33% to 25% but introduced a new “equity” tax on corporate income (known as the CREE) to fund social programmes which were previously financed through payroll taxes. The CREE applied to a broader base than the corporate income tax at a rate of 9% through 2015 and 8% thereafter. The resulting combined statutory rate of 39% is above the average for Latin American and OECD countries (Figure 1.10), and resulted in a high effective corporate tax rate.
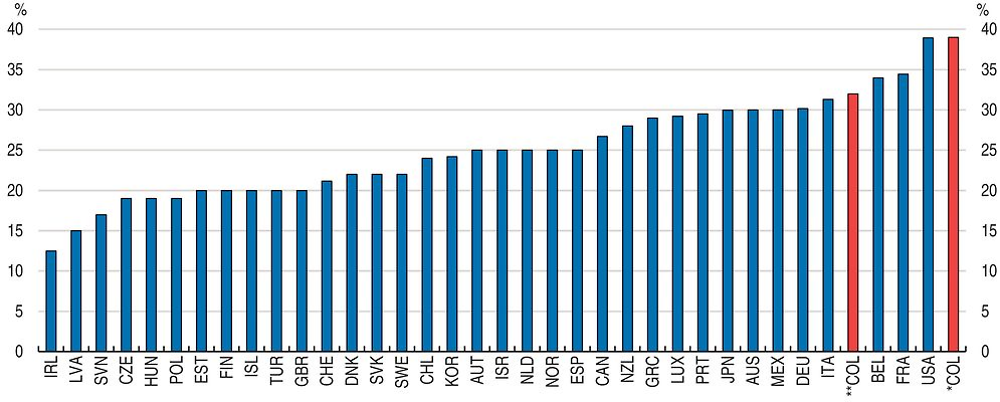
Note: * COL refers to 2017 and ** COL refers to 2019.
Source: OECD Tax Database.
In December 2016, the Congress approved a major tax reform, which includes a reduction in the corporate tax rate and unification of current rates into one in line with previous OECD recommendations (A&R). The reform introduces a standard CIT rate of 33% from 2018 onward. However, during the transition period the rate will be 34% in 2017 and 33% in 2018 augmented by surtaxes of 6% in 2017 for large corporations (profits exceeding COP 800 million or about EUR 250 000), and 4% in 2018. The surtax rate will be 0% for profits below this threshold (see Table a1). As a result, the top standard CIT rate will be 40% in 2017 and 37% in 2018 for companies earning profits above the threshold. The current rate of 40% also applicable in 2017 is the highest in the OECD. However, after the transition included in the 2016 tax reform the ranking will improved slightly. The tax burden is further decreased by the deduction of VAT on investment goods from CIT.
While corporate taxation is only one factor that shapes firms’ investment decisions, maintaining high statutory and effective tax rates is still likely to have a negative impact on domestic and foreign investment. Therefore, Colombia should continue making efforts to reduce the corporate tax rate towards the OECD average.
Improving contract enforcement and the efficiency of judicial system will raise productivity
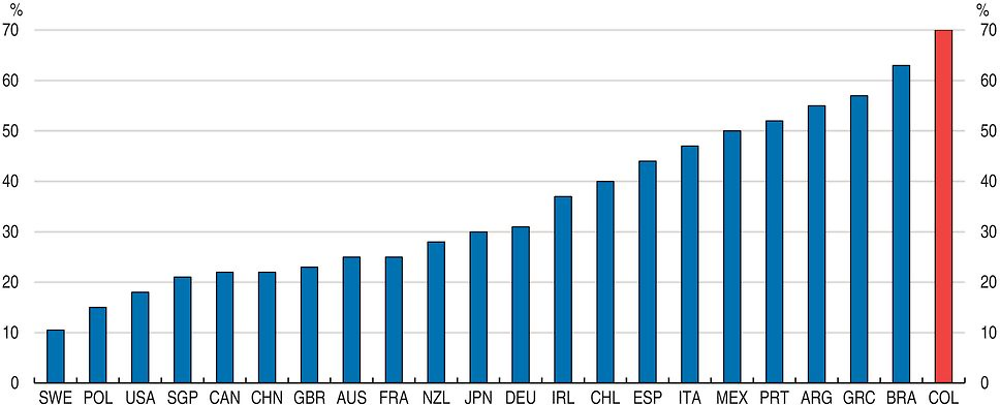
A stronger and more efficient judicial system and rule of law will help reduce corruption and informality, favouring the reallocation of resources towards the most productive firms. The costs of doing business in Colombia are pushed up by the difficulties in enforcing contracts through the judicial system. Companies regularly rely on the court system to enforce contracts or settle disputes. Lengthy and cumbersome procedures of dealing with courts can substantially add to firms’ costs and reduce their productivity. Enforcing a standard debt contract takes much more time than in OECD and EMEs (Figure 1.11). Empirical evidence suggests that higher enforcement costs hamper firm productivity, and this effect becomes particularly pronounced for young firms (Arnold and Flach, 2015).
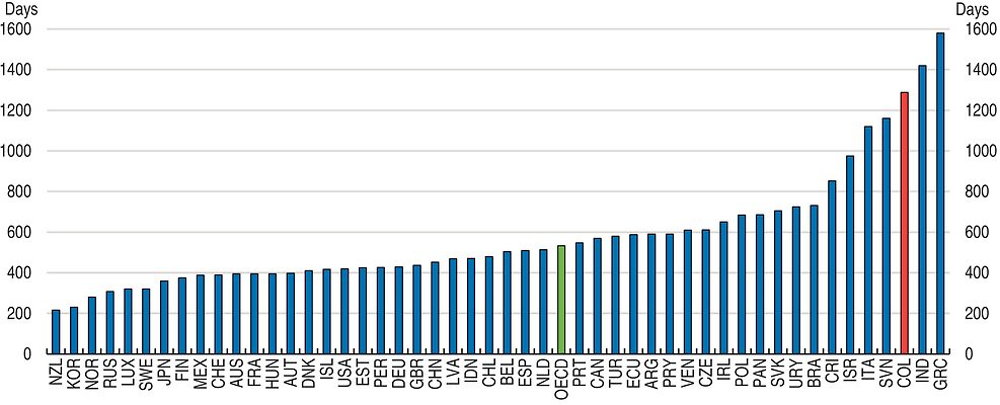
Source: World Bank, Doing Business Database, 2017.
Strengthening contract enforcement through the court system or other forms of arbitration and ensuring sufficiently quick decisions to make contract enforcement easier would improve productivity. Colombia should enhance the efficiency of the judicial system to enforce contracts by introducing a court or division of a court dedicated solely to hearing commercial cases, and make case management easier by introducing electronic case management tools.
Skills development
Improving management quality
Firms’ productivity growth has also been hindered by low management quality. Recent economic literature has drawn attention to the role of differences in management practices in explaining productivity differences. In particular, this research shows that management practices are like a “technology”, in the sense that they raise total factor productivity, and can account for a substantial portion of cross-country differences in development (Bloom et al., 2016). Colombian’s scores on management practices are among the lowest among emerging markets for which data is available (Figure 1.12). This suggests that Colombian manufacturing firms are, on average, poorly managed in global terms, and similar in standard to many low-income countries. When self-assessed, however, Colombian firms described their managerial practices as high quality, suggesting lack of information about best practices around the world. The escalamiento de la productividad program will help 3600 firms improve their managerial quality over the next ten years. The program was designed based on a pilot conducted with the World Bank on 180 firms that used a randomized control trial to assure the positive impact of the pilot on firms’ managerial practices (DNP, 2016).
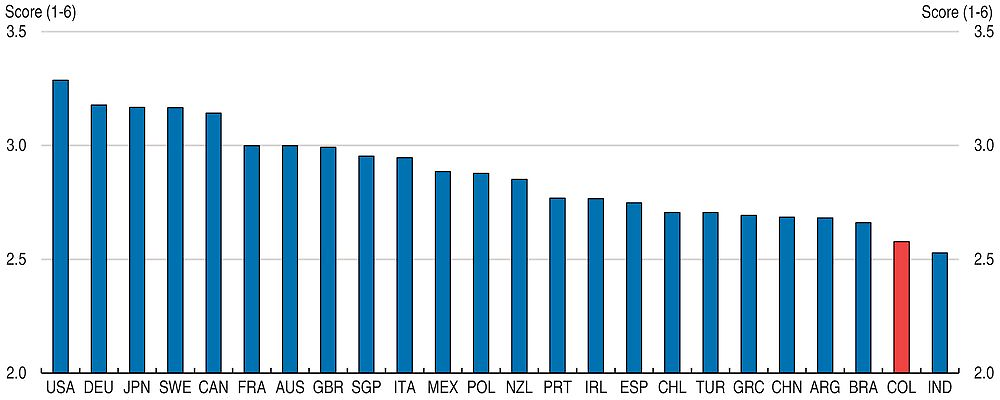
Source: World Management Survey, 2015.
Evidence shows that low management quality could be related to a shortage of skills (Bloom et al., 2012), which as it will be discussed below, is an important constrain in Colombia. But research has shown that the two factors that appear to play an important role are product market competition and family firms (Bloom and Van Reenen, 2007; Lemos and Scur, 2016a). Higher levels of competition (measured using a variety of different proxies, but particularly as trade openness) are strongly associated with better management practices. This competition effect could arise through a number of channels, including the more rapid exit of badly managed firms and/or the inducement of greater managerial effort. As it will be discussed below, although Colombia has made significant improvements integrating to world markets, trade openness remains low, and lack of competition in some sectors continues to be limited.
In terms of family firms, evidence shows that family-owned firms in which the chief executive officer (CEO) is chosen by family ties tend to be very badly managed (Bloom et al., 2012; Lemos and Scur, 2016a). Colombia has one of the highest rates of family owned/family managed firms in the world (Figure 1.13). The typical structure of ownership in Colombia is characterised by a majority shareholder who would also be the manager of the firm. Minority shareholders have then limited means to redress violation of their rights.
Source: Lemos and Scur (2016a).
Education, information and incentives are key determinants of the differences in performance. In terms of education and ability, family CEOs tend to be less well educated than non-family CEOs (Bennedsen et al., 2007). When the firm stays under family control, the outgoing CEO inherently has a limited talent pool constrained by family size and is thus less likely to find a talented CEO compared to the broader market. In terms of information, managers in family firms are systematically less aware of their own shortcomings than those in non-family firms (Lemos and Scur, 2016a). This suggests that family firms are less well informed about their own level of quality of management, of “best practices”, or whether it is profitable to implement new practices or how to do it.
Furthermore, Colombian firms are financed mainly by majority shareholders (usually the family who owns it), suppliers and banks (Gutierrez et al., 2005; Bernal, 2006). This often means high reliance on short-term debt, which can restrict growth. Most of the closely held companies in Colombia are reluctant to seek out an external investor or multiple shareholders through the use of a public market as a source of capital. This reflects lack of knowledge of the public markets and the unwillingness of controlling shareholders to lose their control over the company. This is clearly a constraint to firms’ growth.
A factor explaining why a relatively high share of manufacturing firms are family owned and with a family CEO is that in Colombia taxes and other distortive policies favour family-run firms. For example, the wealth tax created an incentive to create many family own firms and divide the wealth between a corporation and family members so each taxpayer would own wealth valued at just below the threshold that triggered the tax. The 2016 tax reform did not extend the wealth tax.
Providing the right skills to the labour force
An important factor behind the low productivity levels in Colombia is the low skill level of the labour force. Skill shortages affect particularly the industrial sector, with 30% of companies identifying difficulties in finding skilled workers as the main obstacle to productivity growth (WEF, 2015). The economic benefits from enrolling more children (see Chapter 2) have been limited because the quality of education. Since 2006, Colombia has had the second largest improvement in PISA – among the 52 education systems with comparable data –, however, it still performs below the OECD average (OECD, 2016b). The majority of students leave school with weak basic skills. The average student has a PISA score in mathematics of 390 out of 600, which is much lower than the OECD average of 490. A significant proportion of young people are unable to demonstrate attainment of Level 2 of skills in PISA exams – 420 points on the PISA mathematics scale – (Figure 1.14.A). This means that many students do not have the basic skills necessary for participating productively in modern economies.
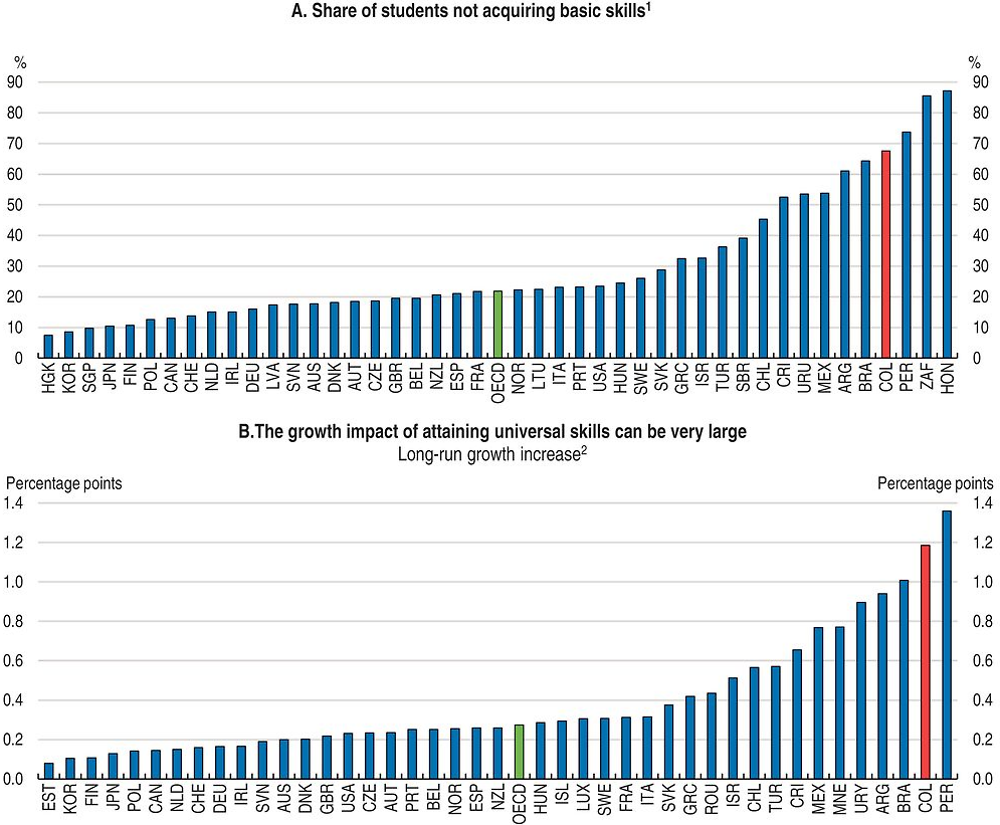
1. Share of students performing below 420 points on international student achievement test. Average of mathematics and science. PISA participants: based on PISA 2012 micro data; TIMSS (non-PISA) participants: based on 8th-grade TIMSS 2011 micro data, transformed to PISA scale.
2. “Long-run growth increase” refers to increase in annual growth rate (in percentage points) once the whole labour force has reached higher level of educational achievement.
Source: OECD (2015), Universal Basic Skills: What Countries Stand to Gain, OECD Publishing.
Having a large share of the population below this skill level affects productivity growth in Colombia. There is a large body of evidence showing the importance of skills in determining the productivity of individuals, and the value of education in raising skills (Heckman, 2013). Deficiencies in educational attainment and skills can also have an adverse impact on overall productivity in times of rapid technological change (Goldin and Katz, 2007). The potential gains of attaining universal skills – when all students fully attain Level 1 in PISA exams can be very large. Recent OECD estimates suggest that ensuring universal access to secondary education by 2030 at the current level of quality could increase Colombia’s annual economic growth by 0.3 percentage points (OECD, 2015c). Improving quality of education so that students attain basic skills by 2030 could raise annual economic growth by 1.2 per cent per year (Figure 1.14.B). Improving education coverage and quality is discussed in more detail in Chapter 2.
An important factor that has affected the quality of education has been the long armed conflict; ending it will help increase the educational level of Colombian children, particularly in those regions that were more affected by it. Research shows that violent attacks in Colombian municipalities where students reside increase the probability of school drop-out (Rodriguez and Sanchez, 2012). According to these results, on average, the end of the armed conflict in Colombia will increase the average education of students residing in conflict areas by almost half a year of education.
Colombia also needs to introduce reforms in all levels of education, starting with early childhood education and care. More investment in Early Childhood Education can help reduce high school dropout rates, improve student performance and reduce gaps in learning achievement (Heckman, 2013; OECD, 2011a). Empirical evidence shows that participation in quality early childhood education is associated with stronger reading performance at age 15, especially for children from families with disadvantaged socio-economic backgrounds (OECD, 2013).
In primary education, Colombia needs to establish a national curriculum framework for school education. This would help in setting high, and equal, expectations for all children and provide guidance to teachers on what students should be learning at each stage of their school career (OECD, 2016b). It should also encourage and support teachers to make more effective use of student assessment. Teachers need greater assistance in how to assess whether students are learning, identify those at risk of falling behind early on and design effective support strategies. To this end, teachers need to be provided with adequate supports such as assessment tools, instructional materials, teacher assistants and recourse to remedial courses. This should be complemented with the development of professional standards and improve teacher education and professional development. Research done for this Economic Survey finds that students at schools that have a higher share of teachers with university degrees perform significantly better in Saber 11 (a Colombian student test) than students in schools that have a low share of teachers with university degrees (Box 1.3).
A research conducted for this Economic Survey estimated the drivers of students’ performance in Colombia, using data from Saber 11, a national standardized test conducted by Instituto Colombiano para la Evaluación de la Educación. Saber 11 is mandatory for all senior year high school students who wish to obtain their school degree, and serves as an input for college entrance.
The analysis proposes a model where student performance in mathematics is the dependent variable, and economic, social and cultural status of students and schools, sex and age are included as independent variables. The estimation also exploits differences in policy indicators across regions, and employs interactions to study if more investment in public education can help reduce the impact that socioeconomic factors, such as family income and level of education of the mother, have on student performance. Specifically, the following equation was estimated employing different methodologies:

Where Pi represents the SABER 11 score in mathematics for student i, Inci is family income, MEi is the level of education of the student’s mother, Sexi is a dummy variable for sex taking the value 1 for girls, Agei is the age of student i, A is a matrix containing the identified “traditional” variables (e.g. school characteristics), PSEj is the level of public spending per student that varies at the regional level j, and ∈i is an error term.
The results show that students’ characteristics and their environment (i.e. sex, age and economic, social and cultural status of students and schools, level of education of their mothers) explain more than 20% of the variation in education performance in Colombia, a percentage relatively high when compared to those found by other studies focusing on OECD countries and based on PISA (Avendano et al., 2016). After controlling for students’ characteristics and their environment, the results show that in Colombia, public spending per student are positively related to better learning outcomes. The results suggest that if all regions reach the level of spending per student of the region with the highest spending,– average math scores can increase by 3.8 to 4.3 points (around 8%), depending on the regions, with the highest improvement for low income students (Figure 1.15).
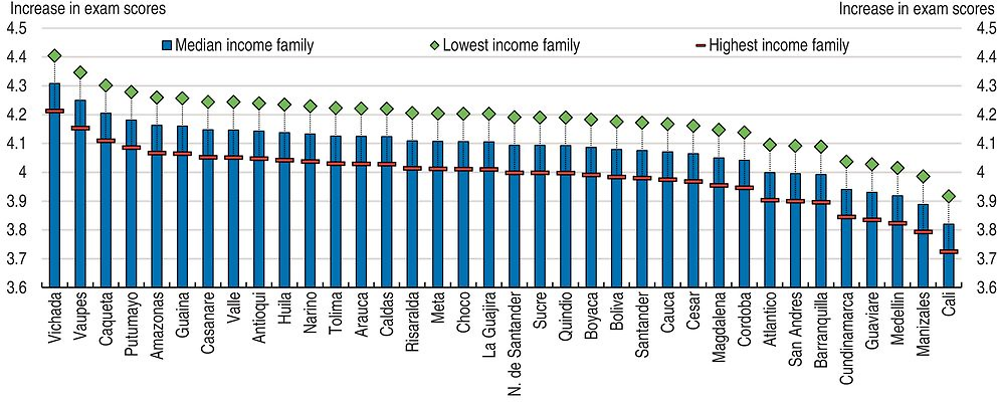
Source: Heras-Recuerdo and Olaberria, 2017.
More efforts should be made to improve technical education. Most pressing skill shortages faced by industrial companies’ concern technical workers. Evidence shows that these students perform relatively well: In PISA 2015 students enrolled in pre-vocational or vocational programmes score 27 points higher in science than students in general programmes, after accounting for socio-economic status. However, the share of students both at the secondary levels enrolled in professional and technical degrees in Colombia is low in international comparison (Figure 1.16.A). Evidence shows that, out of all online job listings that included the level of education required, 57% specified a preference for candidates with technical degrees (Lora, 2015). It is, without a doubt, the level of education that has the largest difference between supply and demand, as only 11% of Colombians have a technical degree (Figure 1.16.B). Therefore, more investment in vocational education and training, at both secondary and tertiary level, will help reduce the skill shortage.
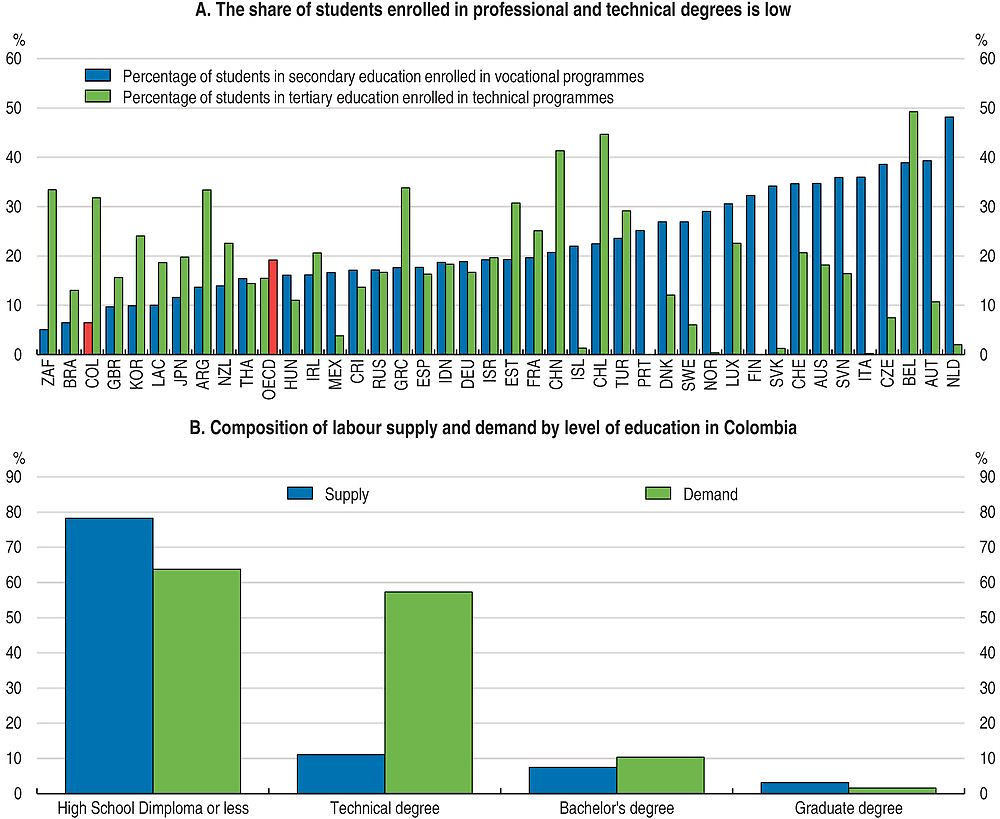
Note: Technical/vocational enrolment in secondary education (ISCED 2 and 3) as % of total secondary enrolment (ISCED 2 and 3) is the percentage of all lower and upper secondary students enrolled in technical/vocational education programs including teacher training, expressed as a percentage of the total number of students who are enrolled in lower and upper secondary education. Enrolment in technical tertiary education is the enrolment at ISCED level 5B programmes as a percentage of total enrolment in tertiary education. The content of tertiary ISCED level 5B programmes is practically oriented/occupationally specific and is mainly designed for participants to acquire the practical skills needed for employment in a particular occupation or trade or class of occupations or trades - the successful completion of which usually provides the participants with a labor-market relevant qualification
Source: UNESCO Institute for Statistics. Data for 2012; Colombian Atlas of Economic Complexity (Lora, 2015).
Producing innovations and facilitating its diffusion to promote productivity gains
To increase productivity and strengthen competitiveness in international markets more spending is needed on research and innovation activities. R&D expenditure at 0.2% of GDP is well below other countries in the region or the OECD on average of 2.4% (OECD, 2015d). Colombia’s innovation system is still modest, and lacks a strong business core, which is reflected in low average product/process innovation in the manufacturing sector (Figure 1.17). The share of firms introducing new products to the market is also low (Figure 1.18.A). However, firms performing R&D are more likely to introduce new or significantly improved products (Figure 1.18.B). Therefore, more public investment in research and development, and better incentives for firms to innovate, could help increase productivity. The Productive Development Policy (CONPES document 3866 of 2016) includes actions to strengthen productive units through improvements in managerial skills, as well as the incorporation and transfer of knowledge and technology. It includes programs aimed for the scaling up of productivity and technical assistance plans for the agricultural sector.
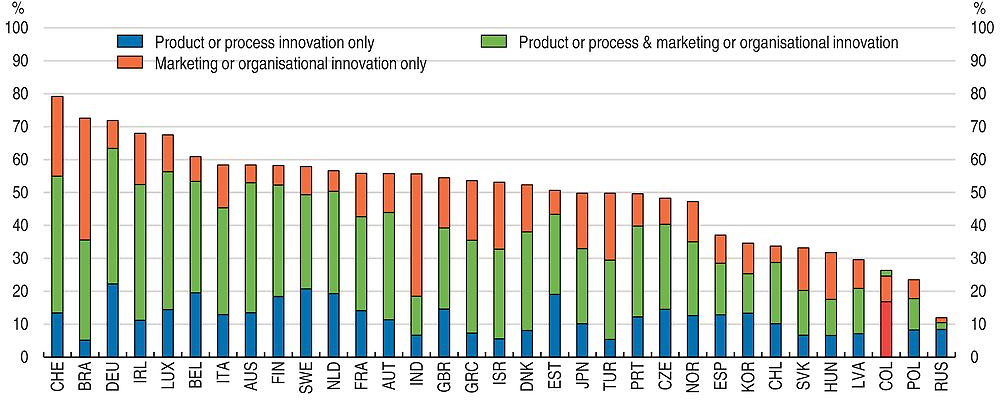
Note: International comparability may be limited due to differences in innovation survey methodologies and country-specific response patterns. European countries follow harmonised survey guidelines with the Community Innovation Survey. Please see www.oecd.org/sti/inno-stats.htm and chapter notes for more details. For countries following the Eurostat CIS 2012 the data include ongoing or abandoned innovative activities. Only enterprises with 10 or more employees are covered.
Source: OECD Science, Technology and Industry Scoreboard 2015.
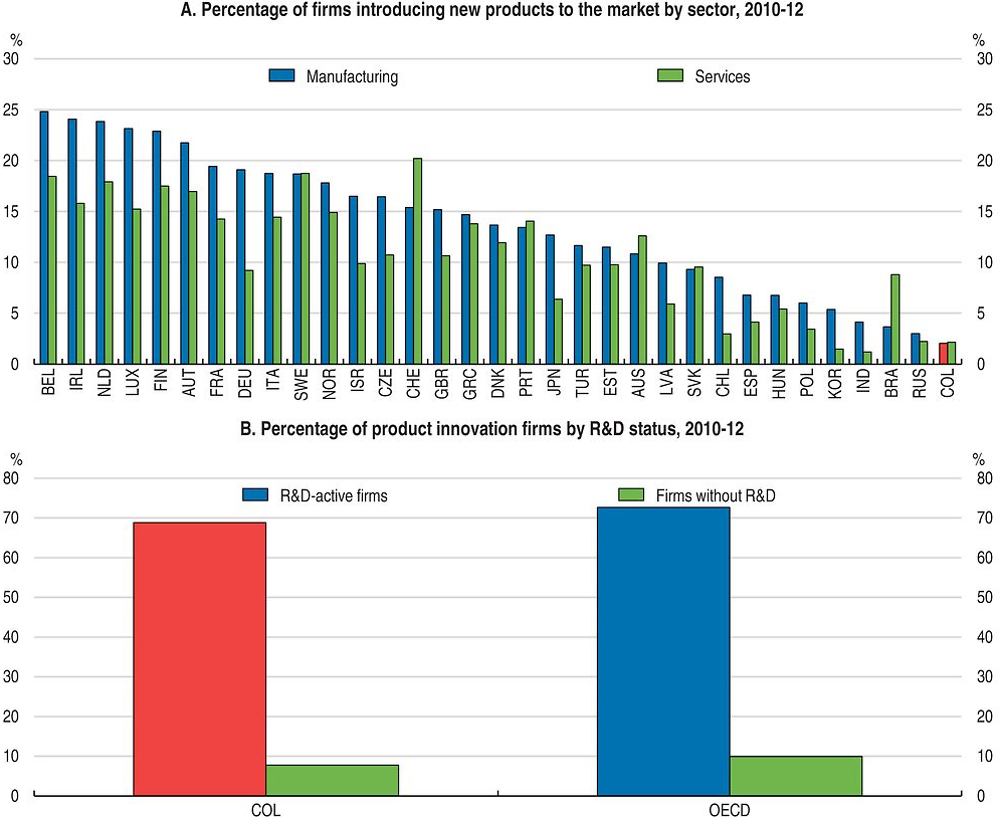
Note: International comparability may be limited due to differences in innovation survey methodologies and country-specific response patterns. European countries follow harmonised survey guidelines with the Community Innovation Survey. Please see www.oecd.org/sti/inno-stats.htm and chapter notes for more details; For Colombia, data refer to the simple average of the estimates for manufacturing the in 2011-12 and for services in 2012-13. For the OECD, data refer to the simple average of 28 member countries.
Source: OECD Science, Technology and Industry Scoreboard 2015: Innovation for growth and society, OECD Publishing, Paris.
Framework conditions for innovation have improved significantly, and Colciencias is promoting research and innovation activities through a number of programmes. Innovation systems is a programme by which Colciencias provides specialized training to develop innovation capabilities. Innovation alliances, managed jointly by Colciencias and the chamber of commerce, promote the culture of innovation across companies in clusters. The Ministry of Information Technologies and Communications is also running several programmes linked to innovation, and has an innovation centre geared towards supporting government bodies in implementing e-government tools, as well as training government employees to develop a culture of innovation. This ministry also runs programmes, in conjunction with Colciencias, to finance the development of IT-based innovation products and services among companies. Finally, another important tool for promoting innovation and new business creation has been the establishment of iNNpulsa in 2012. Managed by Bancoldex, a state-owned international commerce and business bank, this government agency promotes innovative businesses by allocating co-financing grants to start-ups and other firms, and by running programmes that help strengthen the environment for credit allocation.
To enhance innovation the authorities are implementing measures to encourage expenditure on research and innovation activities in the private sector. The government plans to double expenditure on science, technology and innovation from 0.5% of GDP in 2015 to 1% of GDP by 2018 (National Development Plan 2014-18). The government has also introduced tax incentives for innovation. As a result of the 2016 tax reform, companies that invest in activities that qualify as research, technological development or innovation are able to deduct 100% of related expenditure from their tax base and can subtract a further 25% of the investment value from the tax due. Most private companies that benefit from this tax incentive use it to acquire intellectual property products. This is important, as Colombia has a very low share of investment in intellectual property products (Figure 1.19). OECD research shows that productivity is driven by innovation, and that this process relies not only on investment in research and development (R&D), but also on complementary assets such as software, design and human capital (OECD, 2015d).
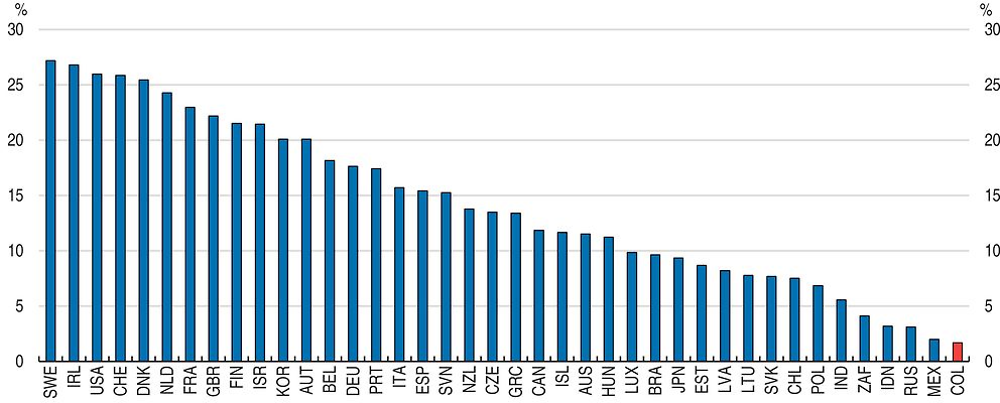
Source: OECD National Accounts Statistics (database); National statistical offices, February 2016.
Increasing the efficiency and effectiveness of innovation also requires improvements in knowledge diffusion channels. Therefore, it is important to increase collaboration between businesses and education and research institutions, which is weak in Colombia (Figure 1.20). Collaboration with higher education or public research institutions constitutes an important source of knowledge transfer for large firms. Linking business and scientific research institutions can help demonstrate the importance of research crossing several disciplines in new technology development and identify need for relevant applied sciences (OECD, 2015d). Colombia should follow the example of many European countries, where providing grants and loans to firms for R&D is a common mechanism. Furthermore, it should start subsidising joint work between companies and universities or institutes, to boost collaboration. The aforementioned Productive Development Policy, envisages a scheme of vouchers as a mechanism to promote innovation and collaboration between high education institutions and the business sector.
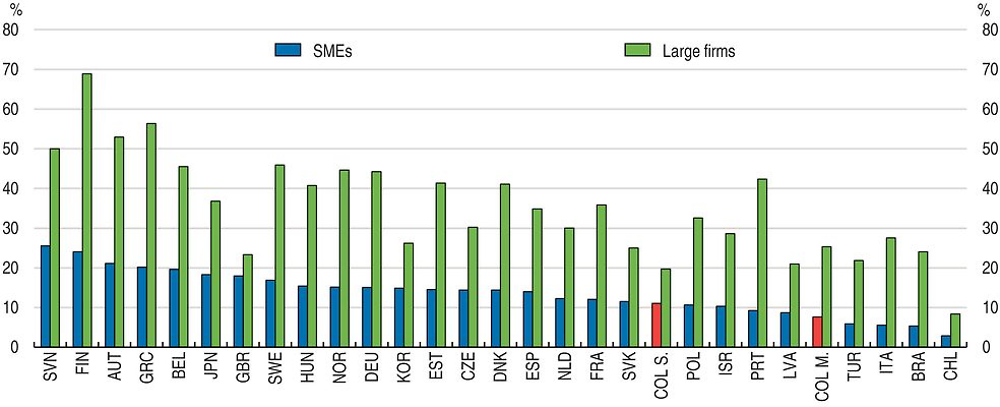
Note: For Colombia, data on manufacturing (COL M.) and services (COL S.) are collected for separate reference periods and refer to 2011-12 and 2012-13.
Source: OECD, based on Eurostat Community Innovation Survey (CIS-2012) and national data sources.
Improving the economy’ ability to innovate and grow ultimately depends on the participation of citizens in innovative processes, the degree of sophistication of demand, and the readiness to accept and recognise the potential of science and technology (OECD, 2015d). This requires empowering society to innovate by encouraging participation in the digital economy. More efforts are needed to extend broadband communication networks and services provided. Although the penetration of fixed broadband networks has increased significantly between 2009 and 2014, it remains below OECD averages (Figure 1.21).
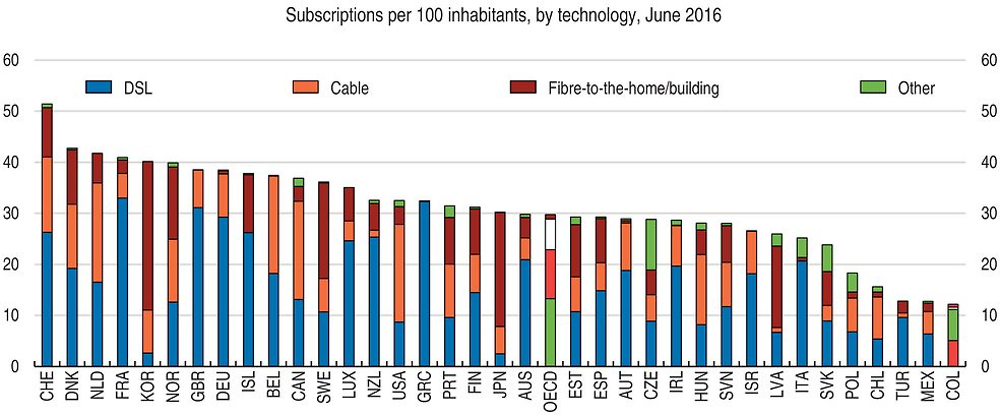
Source: OECD, Broadband Portal.
Extending broadband communication networks and services provided can also enhance productivity in the public sector. Simplifying interactions between citizens and public authorities with digitisation and automation of processes can save both time and taxpayer resources, and reduce corruption. The overall share of individuals using the Internet to interact with public authorities has increased in recent years, but remains below OECD countries (Figure 1.22.A). Online interactions between businesses and public authorities are more developed than for individuals, as enterprises undertake administrative procedures more frequently (Figure 1.22.B).
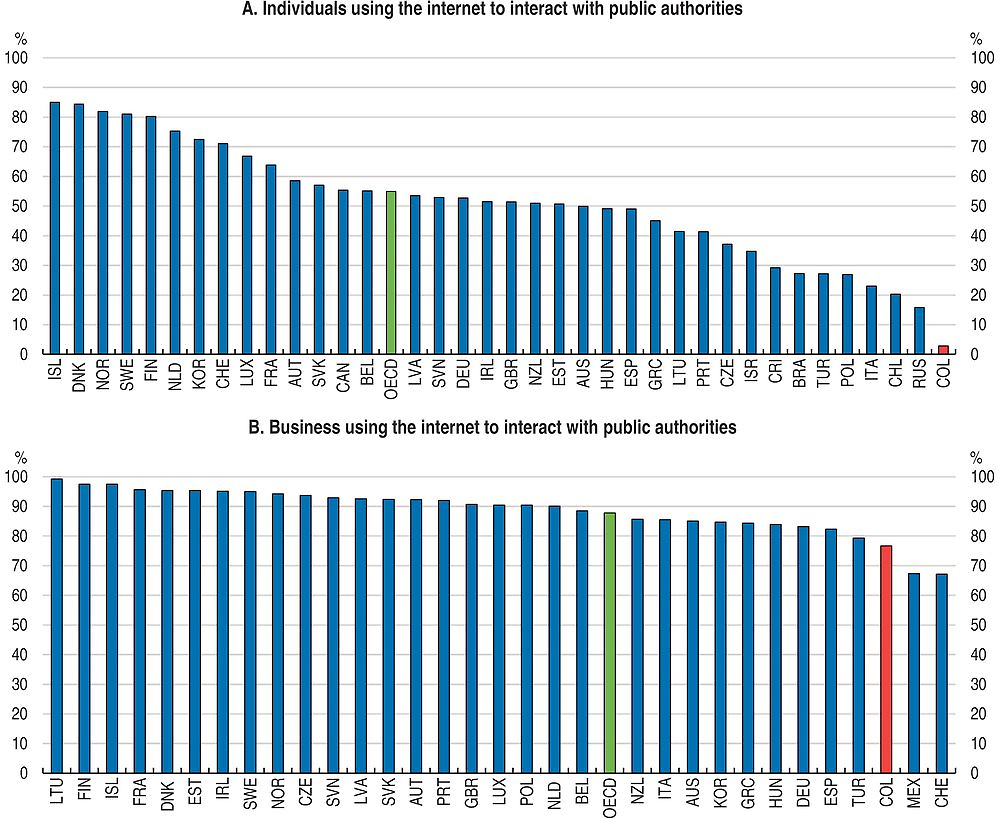
Source: OECD, ICT Database; Eurostat, Information Society Statistics Database and ITU, World Telecommunication/ICT indicators Database, July 2015.
Facilitating integration into global value chains
Colombia has made important efforts to promote trade integration in the recent years by negotiating trade agreements with the U.S., EU, Costa Rica, Korea, Israel, and the Pacific Alliance. These have helped reduce average tariffs from 12.8 % in 2000 to 5.2 % in 2014 (Figure 1.23.A). There is evidence that opening the economy increased plant productivity levels for firms that export goods (Camacho and Conover, 2010). However, while having lower tariffs than many Latin American countries, Colombia still holds higher tariffs than the average of OECD countries (Figure 1.23.B).
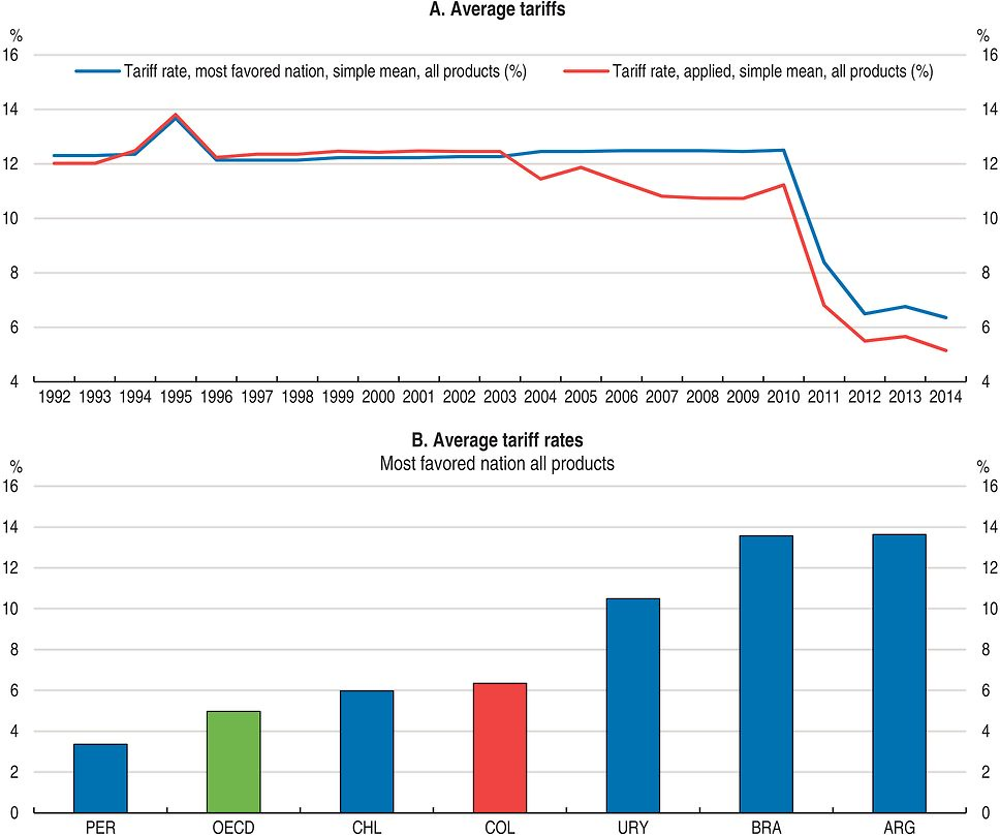
Source: World Bank, World Development Indicators 2016.
Limited access to and competition from international markets tends to lower productivity and potential growth. A large body of literature suggests that more integrated economies tend to grow more rapidly than less integrated ones. Recent empirical studies show that tariffs have a negative effect on productivity and export decisions of firms in downstream industries. Bas (2012) and Chevassus-Lozza et al. (2013) demonstrate that the probability of entering the export market is lower for firms in industries that face higher input tariffs (if the country has no duty-draw-back scheme). Trade openness can reduce the marginal cost of investments in research and development (R&D) or knowledge capital by reducing the price of “knowledge capital.” Similarly, international integration can affect the incentives of the private sector and households to invest in human capital. Finally, trade openness increases competition, lowering inputs, capital, and final prices. Recent OECD research finds evidence suggesting that the negative effect of tariffs has been increasing in time due to the increasing role of GVC (Johansson and Olaberria, 2014). This is because higher tariffs can significantly reduce the degree of integration to GVCs (OECD, 2013).
Recent OECD analysis suggests that efficient integration into global value chains (GVCs) can be an important element in raising productivity (OECD, 2016c). Colombia’s participation in GVCs is limited. It mainly supplies primary inputs via downstream linkages, which is likely to reflect the dominance of commodities in exports (Figure 1.24). Colombia participates little in sectors typically associated with dynamic GVCs like motor vehicles, electronics, and services offshoring, which is likely to reflect the high costs of transport and trade (Figure 1.24B).
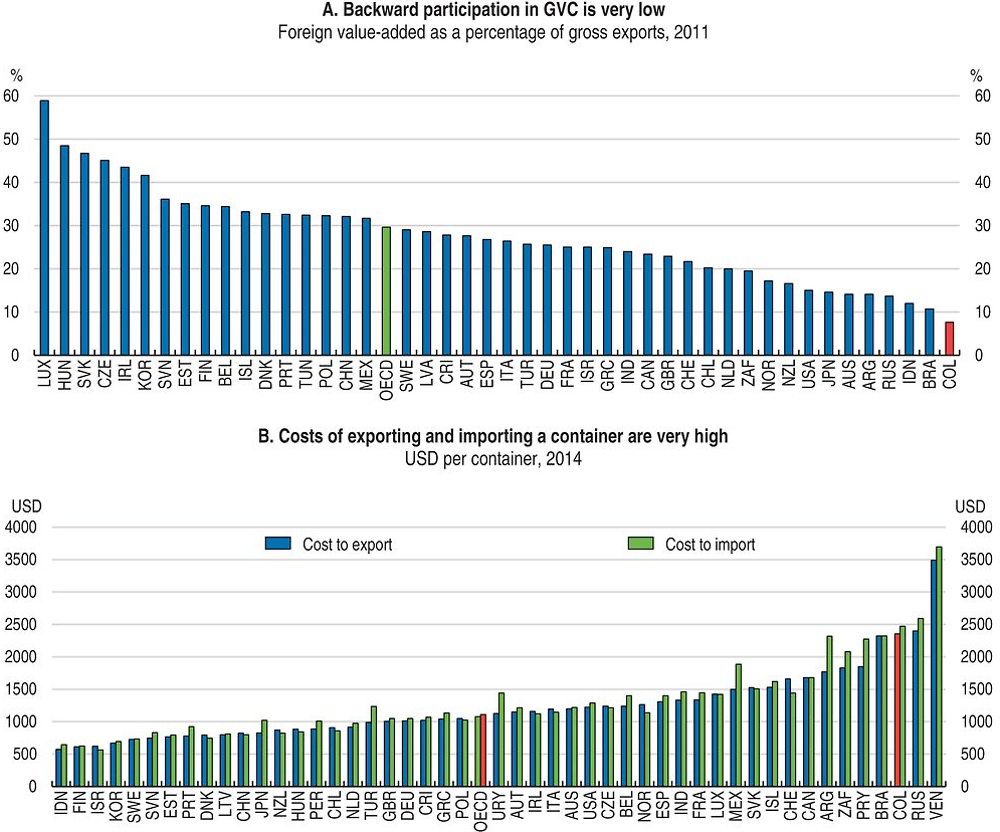
Source: Trade in Value Added (TiVA) Database, OECD (2015); World Bank (2015), Doing Business 2015 data.
Colombia seems to be better integrated to GVCs from a forward participation perspective (Figure 1.25.A), which means that the share of Colombia’s value added in trading partners’ gross exports is important. Colombia’s forward participation is mainly connected with the European Union, United States and Canada, and is mainly explained by the mining sector (Figure 1.25, Panels C and D). Colombia’s forward participation in medium-high and high technology industries is the lowest of all Latin American countries for which data is available. The government is aware of the importance of a better integration, therefore the aforementioned Productive Development Policy (CONPES 3866) focuses on implementing policies for the productive apparatus to diversify into more sophisticated products for which the country has (or is close to having) a comparative advantage, there is high potential demand in local and international markets and products that are similar, as regards know-how and technology, to the ones that the country already produces.
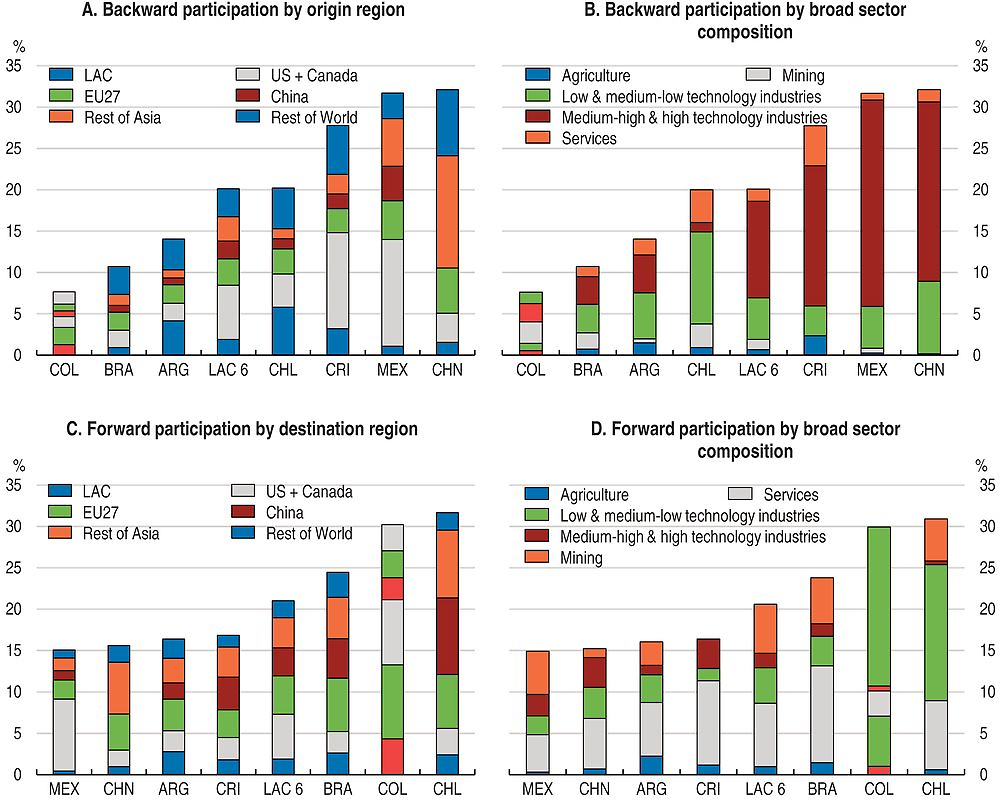
Note: The backward participation index is defined as the share of foreign value added in a country’s gross exports. Forward participation is defined as the share of domestic value added embodied in foreign countries’ exports. For comparibility reasons, most countries included are non-OECD peer countries, such as Brazil, Argentina, Indonesia, Romania, Vietnam, among others.
Source: OECD-WTO Trade in Value Added Database.
Colombia remains below peer countries regarding its backward participation to GVCs (Figure 1.25.B). This means that the share of foreign value added embodied in Colombia’s exports is low and under-performing against peer countries (Figure 1.26). This is shown in a recent paper (OECD, 2016d), which finds that trade policy and FDI openness play an important role for Colombia when compared with countries such as Argentina or Brazil, but not as much when compared with Chile.
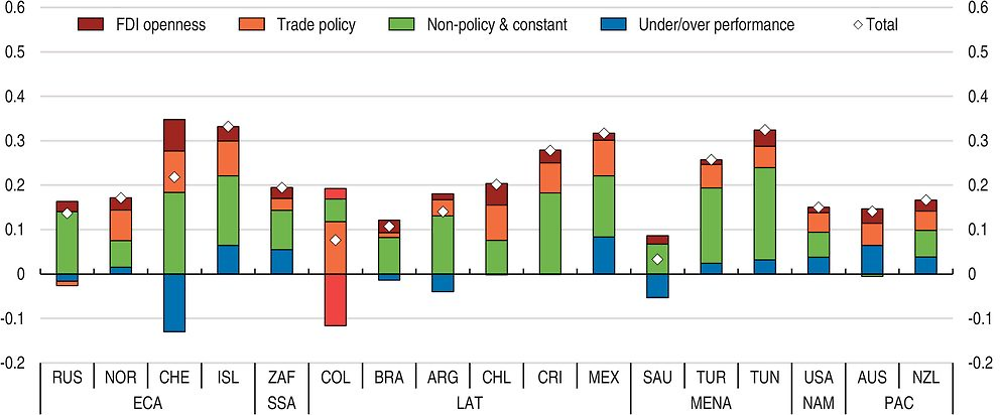
Source: Cadestin et al. (2016).
Barriers to trading at the border can be measures by the OECD Trade Facilitation Index (TFI). Colombia performs well in information availability, involvement of the trade community, simplification and harmonisation of documents and internal border agency cooperation matching or exceeding the average performance of upper middle income countries in all areas measured by the Trade Facilitation Index (OECD, 2015e). Performance in the other TFI areas is stable with the exception of appeal procedures, fees and charges, the streamlining of border procedures and governance and impartiality. Performance in advance rulings, appeal procedures, fees and charges, automation, the streamlining of procedures, external border agency cooperation and governance and impartiality continue to be below best practice.
For upper middle income countries like Colombia the assessment of the impact of trade facilitation measures, both on bilateral trade flows and on trade costs, shows that reforms with the greatest benefit are in the areas of formalities (streamlining border procedures, simplifying and harmonizing documents, and automation), governance and impartiality and information availability (Box 1.4). The indicators involvement of the trade community, advance rulings, and fees and charges also have a significant impact on trade flows. Efforts at reforming these areas should continue.
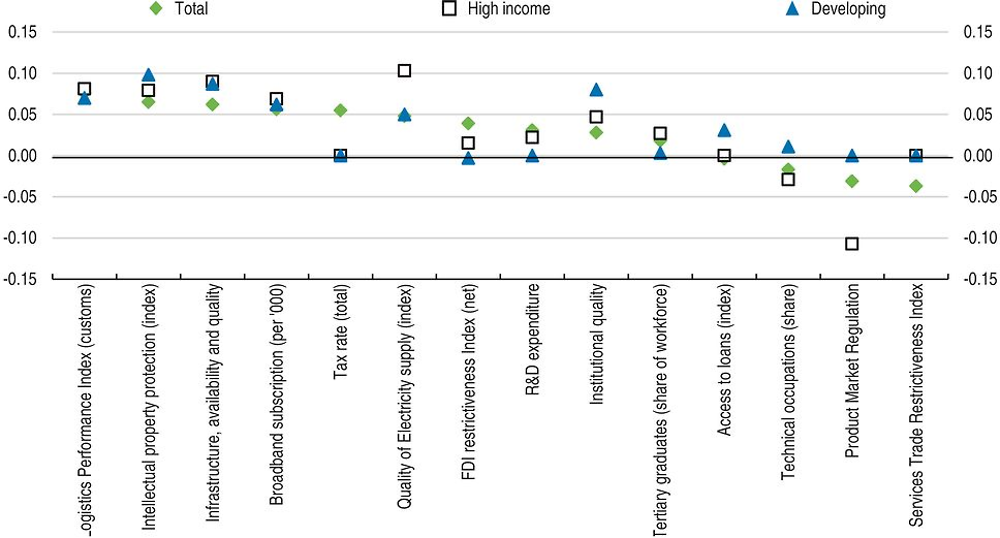
In a recent OECD study, Kowalski et al. (OECD, 2015a) quantify the importance of GVC participation determinants across a large number of developed and developing economies. They found that trade facilitation and logistics performance, quality of infrastructure and of institutions, intellectual property protection and quality of electricity supply are particularly important (Figure 1.27). These are all areas where Colombia performs relatively poorly, and where efforts are required to improve GVC participation. Improving infrastructure for trade and logistics, and dealing with other behind-the-border issues present a significant opportunity to boost trade. Colombia’s logistics costs, about 23% of product value, are well above OECD countries, including the Latin American members (Chile is 18%, the OECD average is only 9% of product value).
Strengthen productivity-enhancing institutions
Productivity-enhancing institutions are important in the identification and implementation of policies to solve productivity challenges (Albrizio and Nicoletti, 2016). Unlike most Latin American countries, Colombia has one such institution: the Competitiveness and Innovation System is in charge of articulating policies to strengthen competitiveness. As part of this system, the National Commission for Competitiveness is a consultative body that provides recommendations for the competitiveness agenda. Given its large size, this commission is very broad and well represented in terms of bringing together different interest in society. This is critical to legitimizing the main policy strategies. At the same time, broadness can make the commission ineffective in terms of making reform happen (Eslava et al., 2014). In practice, the true heart of the system is the commission’s executive committee, composed of the heads of four government agencies and two private representatives: the Private Council for Competitiveness and Confecámaras.
The active public-private collaboration in the Executive Committee of the National Competitiveness Council has given some degree of continuity to a public agenda of competitiveness, which used to be affected by changes in government or ministers. It has been successful in the removal of government failures, such as lack of regulations, complexity of procedures, lack of coordination between government agencies, which were identified through the interaction between the program and the private sector (Eslava et al., 2014).
Key recommendations
-
Sustain the increase in public investment.
-
Finance more infrastructure programmes on a regional basis. Implement the road infrastructure program (4G) and guarantee that Private-Public-Partnerships continue to have proper cost-benefit analysis.
-
Provide more grants and loans for R&D to enterprises. Fund R&D projects that bring industry and academia together.
-
Remove regulations on public ownership and vertical integration in electricity, vertical integration and market structure in rail. Introduce a court or a division of a court dedicated solely to commercial cases and facilitate case management through electronic case management tools.
-
Make information on advance rulings on import conditions available more quickly and with higher visibility.
Other recommendations
-
Establish a body/forum to engage employers and unions in vocational programs. Ensure that good data on the labour market outcomes of vocational programs is available to inform student career choice and reduce the technicians’ gap.
-
Provide more grants and loans for R&D to enterprises. Continue to increase the number of e-government services and monitor service quality, and Stimulate competition in the telecommunications sector.
-
Fund longer-term projects that bring industry and academia together. Ensure affordable Internet access, especially for lower-income groups.
References
Adalet McGowan, M. and D. Andrews (2016a), “Insolvency Regimes and Productivity Growth: A Framework for Analysis”, OECD Economics Department Working Papers, No. 1309.
Adriana C. and E. Conover (2010), “Misallocation and Productivity in Colombia’s Manufacturing Industries”, 4654, Inter-American Development Bank, Research Department.
Albrizio, S. and G. Nicoletti (2016), “ Boosting productivity: A framework for analysis and a checklist for policy”, Background Paper, prepared for the 2016 Conference of the Global Forum on Productivity: Structural Reforms for Productivity Growth.
Andrews, D. and C. Criscuolo (2013), “Knowledge based capital, innovation and resource allocation”, OECD Economics Department Working Papers, No. 1046.
Arnold, J. and L. Flach (2015), “Structural policies and the productivity of firms in Brazil”, OECD Economics Department Working Papers.
Avendaño, R., F. Barrera-Osorio, S. Nieto Parra and F. Vever (2016), “Understanding student performance beyond traditional factors”, OECD Development Centre Working Papers, No. 331, OECD Publishing, Paris, https://doi.org/10.1787/5jlz7n7bxn0p-en.
Barrera-Osorio, F., M. Bertrand, L.L. Linden and F. Perez-Calle (2011), “Improving the Design of Conditional Transfer Programs: Evidence from a Randomized Education Experiment in Colombia”, American Economic Journal: Applied Economics 3: 167-195.
Bennedsen, M., K. Nielsen, F. Perez-Gonzales and D. Wolfenzon (2007), “Inside the family firm: The role of families in succession decisions and performance”, The Quarterly Journal of Economics 122, pp. 647-691.
Bernal, A. (2006), “ Non-listed Companies in Colombia”, Paper prepared for the The Seventh Meeting of the Latin American Corporate Governance Roundtable, 22-23 June 2006.
Bloom, N., C. Genakos, R.a Sadun and J. Van Reenen (2012), “Management Practices across Firms and Countries”, Academy of Management Perspectives 26, No. 1 (February 2012): 12-33.
Bloom N., R. Sadun and J.V. Reenen (2016), “Management as a Technology?”, NBER Working Papers 22327, National Bureau of Economic Research, Inc.
Brown, J.D., G.A. Crespi, L. Iacovone and L. Marcolin (2015), “Productivity Convergence at Firm Level: New Evidence from Americas”, in Araujo, J., E. Vostroknutova, K. Wacker and M. Clavijo, eds Understanding Latin America and the Caribbean’s Income Gap”, World Bank, Washington, DC, http://documents.worldbank.org/curated/en/2015/07/24838845/understandinglatin-america-caribbean%E2%80% 99s-income-gap.
Busso, M., L. Madrigal and C. Pagés (2012), “Productivity and Resource Misallocation in Latin America”, IDB Working Paper Series No. IDB-WP-306.
Camacho, A. and E. Conover (2010), “Misallocation and Productivity in Colombia’s Manufacturing Industries”, Research Department Publications 4654, Inter-American Development Bank, Research Department.
Departamento Nacional de Planeación (2010), Lineamientos de política para el fortalecimiento del Sistema de formación de capital humano SFCH (Documento CONPES 3674), Bogotá D.C.: DNP, disponible en: https://colaboracion.dnp.gov.co/CDT/Conpes/Econ%C3%B3micos/3674.pdf.
Departamento Nacional de Planeación (2013), Misión para consolidar el Sistema de Ciudades en Colombia, 2013, Bogotá D.C.: DNP.
Departamento Nacional de Planeación (2015a), Lineamientos de política para estimular la inversión privada en ciencia, tecnología e innovación a través de deducciones tributarias (Documento CONPES 3834), Bogotá D.C.: DNP, disponible en: https://colaboracion.dnp.gov.co/CDT/Conpes/Econ%C3%B3micos/3834.pdf.
Departamento Nacional de Planeación-DNP (2015b), El campo colombiano: Un camino hacia el bienestar y la paz. Informe.
Departamento Nacional de Planeación-DNP (2016), Politica Nacional de Desarrollo Productivo, Documeto Conpes 3866 Informe.
Eslava, M., J. Haltiwanger, A. Kugler and M. Kugler (2004), “The effects of structural reforms on productivity and profitability enhancing reallocation: Evidence from Colombia”, Journal of Development Economics, vol. 75 (2), December, 333-371.
Eslava M. and J. Haltiwanger (2012), “Young businesses, entrepreneurship, and the dynamics of employment and ouput in Colombia’s manufacturing industry”, CAF Working Papers No. 2012/08.
Fan, S., X. Zhang and N. Rao (2004), “ Public Expenditure, Growth and Poverty Reduction”, DSDG Discussion Paper 4, Washington, DC, International Food Policy Research Institute.
Fedesarrollo (2013), “Infraestructura de Transporte en Colombia”, mimeo.
Gallego, J.M., L.H. Gutiérrez and R. Taborda (2015), “Innovation and Productivity in the Colombian Service and Manufacturing Industries”, Emerging Markets Finance and Trade, 51:3, 612-634.
Goldin, C. and L.F. Katz (2007), ”The Race between Education and Technology: The Evolution of U.S. Educational Wage Differentials, 1890 to 2005”, NBER Working Papers 12984, National Bureau of Economic Research, Inc.Rodriguez and Sanchez, 2012.
Gutierrez, L., C. Pombo and R. Taboada (2005), “Ownership and Control in Colombian Corporations”, mimeo.
Heckman, J. (2013), Giving Kids a Fair Chance (Boston Review Books).
Inter-American Development Bank (2010), “The Age of Productivity. Transforming Economies from the Bottom Up. Development in the Americas”, New York: Palgrave McMillan.
Inter-American Development Bank (IDB) (2013), “Too Far to Export: Domestic Transport Costs and Regional Export Disparities in Latin America and the Caribbean”.
Johansson, Å. and E. Olaberría (2014), “Long-term Patterns of Trade and Specialisation”, OECD Economics Department Working Papers, No. 1136, OECD Publishing, Paris, https://doi.org/10.1787/5jz158tbddbr-en.
Lemos, R. and D. Scur (2016a), “All in the family? CEO choice and firm organization”, London School of Economics, Centre for Economic Performance mimeo.
Londoño-Vélez, J. (2016) “Diversity and Redistributive Preference: Evidence from a Quasi-Experiment in Colombia”, Working Paper.
Lora, E. (19/08/2015), “The worrisome deficit of technicians and technologists in Colombia”, Colombia Atlas of Economic Complexity, Harvard University, http://projects.iq.harvard.edu/colombia/news/deficit-technicians-and-technologists-colombia.
Lozano-Espitia and Ramirez-Villegas (2016), “ How Productive is Rural Infrastructure? Evidence on Some Agricultural Crops in Colombia”, Borradores de Economia Num. 948 2016,
Manpower Group (2015), 2015 Talent shortage survey, www.manpowergroup.com/wps/wcm/connect/db23c560-08b6-485f-9bf6-f5f38a43c76a/2015_Talent_Shortage_Survey_US-lo_res.pdf?MOD=AJPERES.
Ministerio de Comercio, Industria y Turismo, Confecámaras (2014), Informe de diagnóstico de las Comisiones Regionales de Competitividad y sus retos frente al desarrollo regional, Bogotá.
Ministerio de Educación Nacional (2015), Bases para la construcción de los lineamientos de política pública del Sistema Nacional de Educación Terciaria (SNET), Bogotá: Dirección de Fomento de la Educación Superior, Viceministerio de Educación Superior, https://q10academico.s3.amazonaws.com/405614869814/News/Bases%20politica%20Sistema%20Nacional%20de%20Educacion%20Terciaria.pdf.
OECD (2013), Supporting Investment in Knowledge Capital, Growth and Innovation, OECD Publishing, Paris.
OECD (2014), OECD Territorial Reviews: Colombia 2014, OECD Publishing, Paris, https://doi.org/10.1787/9789264224551-en.
OECD (2015a), The Future of Productivity, OECD Publishing, Paris.
OECD (2015b), Chile: Policy Priorities for Stronger and more Equitable Growth, OECD Publishing, Paris.
OECD (2015c), Universal Basic Skills: What Countries Stand to Gain, OECD Publishing, Paris.
OECD (2015d), OECD Science, Technology and Industry Scoreboard 2015: Innovation for growth and society, OECD Publishing, Paris.
OECD (2015e), “Developing countries participation in global value chains and its implications for trade and trade related policies”, OECD Trade Policy Papers, No. 179, OECD Publishing, Paris.
OECD (2016a), “Making the Most of Public Investment in Colombia: Working Effectively across Levels of Government, OECD Publishing, Paris.
OECD (2016b), Education in Colombia, Reviews of National Policies for Education, OECD Publishing, Paris.
OECD (2016c), “The Relationship Between GVCs and Productivity”, Background Paper by Criscuolo, C., J. Timmis and N. Johnstone for the Global Forum on Productivity, http://oe.cd/GFPLisbon.
OECD (2016d), “Participation in Global Value Chains in Latin America: Implications for Trade and Trade-Related Policy”, OECD Trade Policy Papers, No. 192.
Pinstrup-Anderson, P. and S. Shimokawa (2006), “Rural Infrastructure and Agricultural Development”, Paper for Annual Bank Conference on Development Economics, Japan.
Rodríguez, C. and S. Fabio (2012), “Armed Conflict Exposure, Human Capital Investments and Child Labor: Evidence from Colombia”, Documentos CEDE.
World Bank Group (2015), COLOMBIA, Systematic Country Diagnostic, 97878, www-wds.worldbank.org/external/default/WDSContentServer/WDSP/IB/2015/07/01/090224b082fc8bd3/1_0/Rendered/PDF/Colombia000Systematic0country0diagnostic.pdf.
World Bank, World Development Indicators Database (2016).
World Economic Forum (WEF) (2015), The Human Capital Report 2015, Employment, Skills and Human Capital Global Challenge Insight Report, WEF in collaboration with Mercer.
World Management Survey (2014), 2014 Regional Manufacturing Reports.