Assessment and recommendations
- The economy is gradually emerging from the recession
- Inflation has declined but financial intermediation could be improved
- Fiscal outcomes need to improve to ensure the sustainability of public debt
- Improving governance and reducing corruption
- Raising investment is a key policy priority
- Supporting the integration with the region and the world economy
- Green growth challenges
Strong growth and remarkable social progress over the past two decades have made Brazil one of the world’s leading economies, despite the deep recession that the economy is now emerging from. Macroeconomic stability, favourable demographic trends and external conditions allowed an expansion of private and public consumption, in the context of solid employment and wage growth. A buoyant labour market coupled with improving access to education and extensive transfer programmes allowed millions of Brazilians to move into better jobs and attain better living standards. As 25 million Brazilians have escaped poverty since 2003, growth has become much more inclusive. These are remarkable achievements.
However, Brazil remains one of the most unequal countries in the world. Half of the population receives 10% of total household incomes, while other half holds 90%. Severe inequalities continue to put women, racial minorities and youths at a disadvantage. Male workers are paid 50% more than women, a gap that is 10 percentage points higher than the OECD average. Women are also more likely to have informal employment. Poverty is highest among children and unemployment among youths is more than twice the overall average. These inequalities tend to feed off of each other, considerably limiting the ability of part of the population to fulfil their productive potential and improve their lives. Brazil performs well in only a few measures of well-being, including subjective well-being and social connections, but below average in income and wealth, jobs and earnings, housing, environmental quality, health status, safety, education and skills (Figure 1). At the same time, there has also been considerable progress. Besides falling inequality and poverty, the gender gap in labour force participation has halved since 1990, and with 52% of women participating in the labour force, Brazil exceeds the average of OECD or Latin American countries.
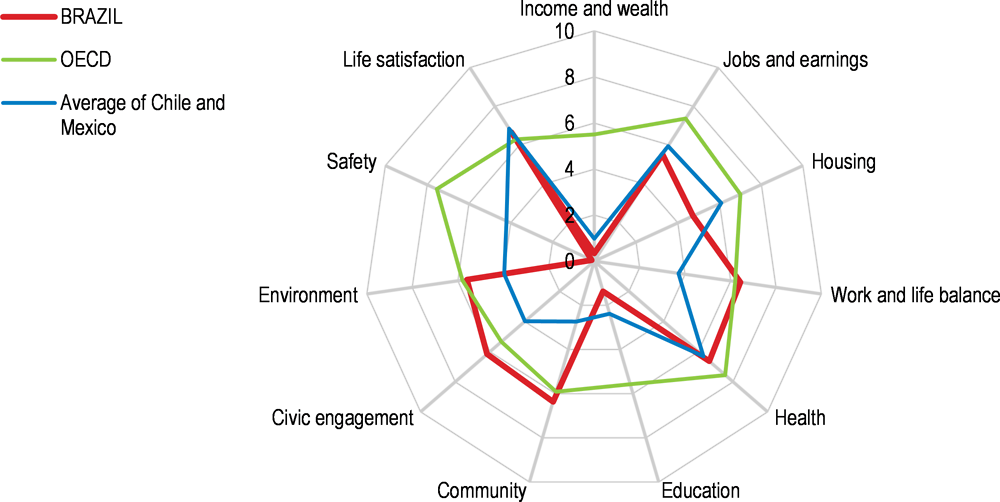
Note: Each well-being dimension is measured by one to four indicators from the OECD Better Life Index set. Normalised indicators are averaged with equal weights. Indicators are normalised to range between 10 (best) and 0 (worst) computed over OECD countries and non-OECD countries according to the following formula: (indicator value - minimum value) / (maximum value - minimum value) x 10.
Source: OECD calculations based on OECD Better Life Index – 2017 Edition.
Since the turn of the millennium, a rising labour force lifted per-capita incomes while rising commodity prices supported public revenues (Box 1). But this growth model is now largely exhausted and the recession has brought long-standing structural imbalances to the fore. Brazil’s population has started to age rapidly and the sustainability of public finances can no longer be taken for granted. Policies have been slow in adapting to this new situation. Attempts to remedy longstanding policy-induced competitiveness challenges with generous subsidies and transfers to domestic companies helped little as they failed to solve the real problems. Rising public spending has in part come at the cost of lower private investment. This and other factors including deteriorating terms of trade, political turmoil and corruption allegations have led to a decline in investment by around 30% since 2014. Inflation rose into double digits. In this context, confidence in economic policies and business prospects declined sharply, leading the economy into a deep and prolonged recession in 2015 that wiped out almost 7 years of growth and doubled unemployment (Figure 2). Labour productivity growth began to stagnate in 2010, even before demand declined.
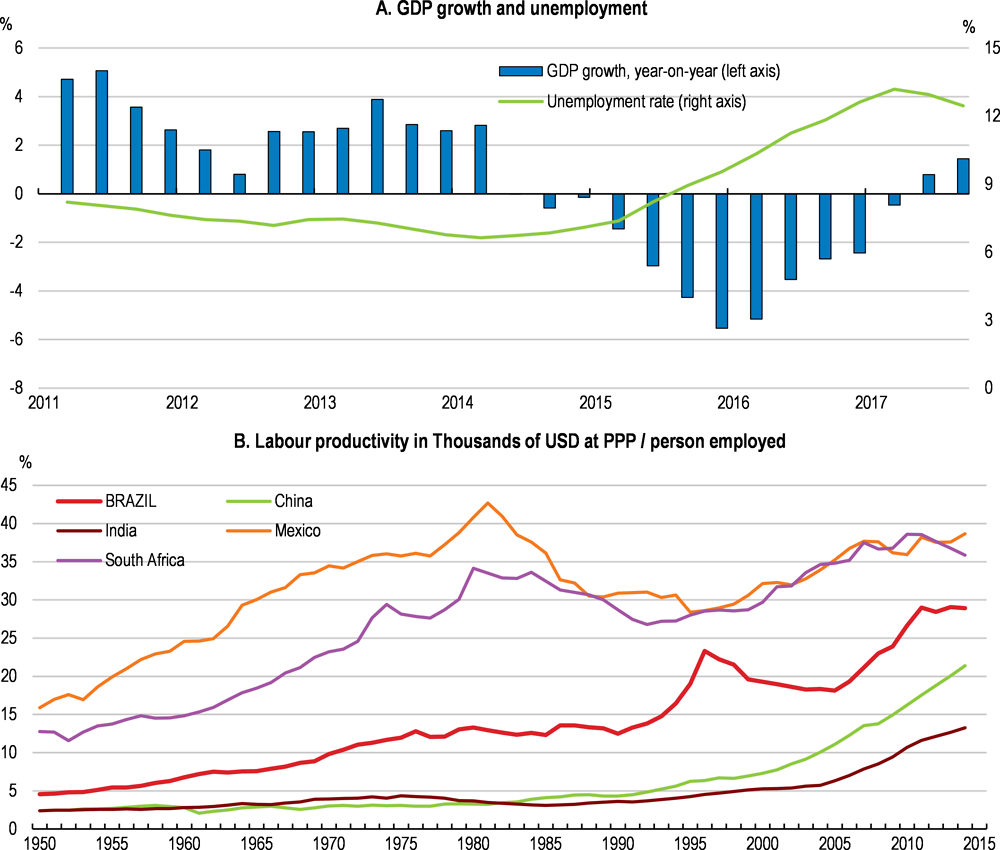
Source: OECD Economic Outlook database, Feenstra, Robert C., Robert Inklaar and Marcel P. Timmer (2015), "The Next Generation of the Penn World Table" American Economic Review, 105(10), 3150-3182, available for download at www.ggdc.net/pwt
Further advances in living standards will hinge on finding a new inclusive and green growth strategy, ensuring actively that the benefits of growth will be broadly shared across the population as a whole. Productivity will have to become the principal engine of growth, but that will require significantly higher investment and a wide-ranging agenda of microeconomic reforms. This would also contribute to create more and better remunerated jobs for all Brazilians. There is a tight nexus between raising productivity and making growth more inclusive. Improvements in productivity require not only more investment in physical capital, but also in the skills of people, which will in turn help everyone to contribute to stronger productivity growth and ensure that it benefits all parts of society (OECD, 2016e, World Bank, 2018).
Brazil’s economic history is characterized by significant economic volatility until 1994. Between the return to democracy in 1985 and 1994, the economy went through spells of hyperinflation, recessions and brief intervals of relative stability under ultimately unsuccessful economic plans. Inflation peaked at 2950 percent in 1990. Macro-economic turbulence gave rise to a strong short-term focus of economic agents and was most detrimental to the poor, who were not able to protect themselves against inflation. This only changed with the 1994 Real plan, which established a crawling currency peg, limited public spending and undid much of the existing inflation indexation. Under the new currency regime, the real became overvalued and significant current account deficits emerged, which became difficult to finance as international liquidity dried up after the Asian crisis. As a result, the exchange rate was floated in 1999 and an inflation targeting regime was adopted. Brazil entered the 2008 global crisis with significant buffers to enact countercyclical policies and initially showed strong resilience, with economic growth rebounding strongly in 2010. Since then, however, a combination of rising fiscal imbalances, increasingly interventionist economic policies and unaddressed structural weaknesses have led to a sharp erosion of confidence, which ultimately led into the economy's strongest recession on record.
A number of structural weaknesses that had been masked by the commodity boom have by now become visible. At the same time, the more limited fiscal room will make it more difficult to achieve consensus for reforms in the fragmented political system, as in the past consensus was achieved mainly on the back of significant inefficiencies in government spending. Without a significant reform of mandatory public spending, the fiscal deficit of 7.8% of GDP and public debt at 74% of GDP in November 2017 risks becoming unsustainable.
The public sector will need to make a politically difficult choice between keeping the status quo or cutting back on transfers to the non-poor while boosting support to poor and the vulnerable households to continue contributing to growth and social progress, both of which are intertwined. Past reductions in inequalities have been based on a combination of solid growth, the resulting improved labour market prospects, better access to education and social transfers. Among the latter, highly efficient and well-targeted programmes co-exist with others transferring significant resources to middle class households, with very limited effects on inequality and hardly any impact on poverty. Fine-tuning the allocation of resources across and within social programmes could multiply the potential social progress that Brazil could achieve.
The pervasive dimensions of corrupt practices exposed by recent allegations at the highest levels have also revealed significant challenges in economic governance. Tax exemptions, subsidised lending, sector-specific industrial support policies and irregularities in contracts with public entities or state-owned companies distributed large economic benefits to the corporate sector, creating fertile grounds for rent-seeking behaviour and political kick-backs. Rents have also arisen as a result of policies that are shielding sizeable parts of the economy from competition, including through trade protection. These policies have effectively redistributed resources towards the affluent and made the political decision-making process less transparent. At the same time, they have rewarded firms for seeking political connections rather than performing better. Reconsidering these policies will reduce inequalities in incomes and opportunities and boost productivity.
However, recent events also reveal a steady strengthening of Brazil’s institutions, evidenced by an independent judiciary that has not shied away from pursuing and sentencing senior leaders. This provides an opportunity for Brazil to distance itself from the past and continue strengthening its institutional framework, which would reduce future vulnerabilities and could strengthen long-term growth prospects. International evidence shows strong links between well-functioning institutions and growth (Acemoglu et al., 2005).
In spite of the political upheaval of the last few years, significant reforms have been approved (see Box 2). Building on this reform momentum would have substantial payoffs. OECD estimates suggest long-run GDP effects from a continuation of structural reform of over 20%, to be realised over a horizon of approximately 15 years (Table 1). This would have a substantial impact on incomes (Figure 3) as well as on inequality and poverty, although these benefits may occur with a lag. Reform areas with the highest growth payoff include improvements in institutions, business regulations, financial markets and trade integration. At the same time, the political economy of undertaking these reforms will not be easy. Finding the right sequencing, good communication and effective flanking policies to ensure that the benefits are shared by all will be crucial.
Since 2016, the following reforms have been implemented:
-
An expenditure rule requires a freeze of real federal primary expenditure growth over the next 20 years.
-
An independent fiscal council has been established and has started to produce high-quality monthly reports.
-
A financial market reform will align directed lending rates with market rates within at most 5 years.
This reform will level the playing field and facilitate the development of private long-term financial markets through a new, market-based long-term interest rate called TLP.
-
Competition in the oil and gas sector has been strengthened.
Local content rules have been scaled back in the sector and the state oil company Petrobras no longer has to be a partner in every offshore drilling project.
-
A labour market reform has removed obstacles to stronger formal employment growth.
The reform has allowed firm-level agreements to take prevalence over the law, which provides a legal basis for long-standing practice and reduces legal uncertainties. At the same time, essential employee rights have remained non-negotiable.
-
An education reform was passed in 2016.
The reform has reduced the number of mandatory subjects, providing more options and more room for tailoring teaching content to less academically inclined students. This is likely to help reducing drop-out rates.
-
A new immigration law was passed in 2017.
The new law streamlines work visa application processes and enables workers already in the country to switch jobs without applying for another visa.
-
Tax assets have been included in credit registry information and can be used by firms as loan collateral.
-
Brazil has requested to adhere to the OECD Codes of Liberalisation of Capital Movements and of Current Invisible Operations.
Further reform proposals are currently being discussed, including:
-
An extensive pension reform proposal has been submitted to Congress, but has not been voted on. It is expected that a new, less ambitious reform proposal could be submitted to Congress in the near future.
The original reform proposal as sent to Congress defined a minimum retirement age of 65 and raised the minimum contribution time from 15 years to 25 years, with a transition rule for those already close to retirement. Rules for women would gradually converge to those for men over 20 years. For those receiving more than the minimum pension, more years of contribution would be required to achieve the same replacement rates as at present. Survivor pensions would be reduced and the possibility of minimum survivor pensions below the minimum wage was proposed.
-
A substantial privatisation package of state-owned enterprises has been announced.
-
A bankruptcy reform aimed at accelerating insolvency procedures has been prepared.
-
A proposal to improve credit registries aims at reducing interest rate spreads.
The proposal will widen the coverage of positive information in credit registries, such as payment history on utility bills, unless the individual opts out from having this information covered.
-
Plans about a tax reform are currently being discussed.
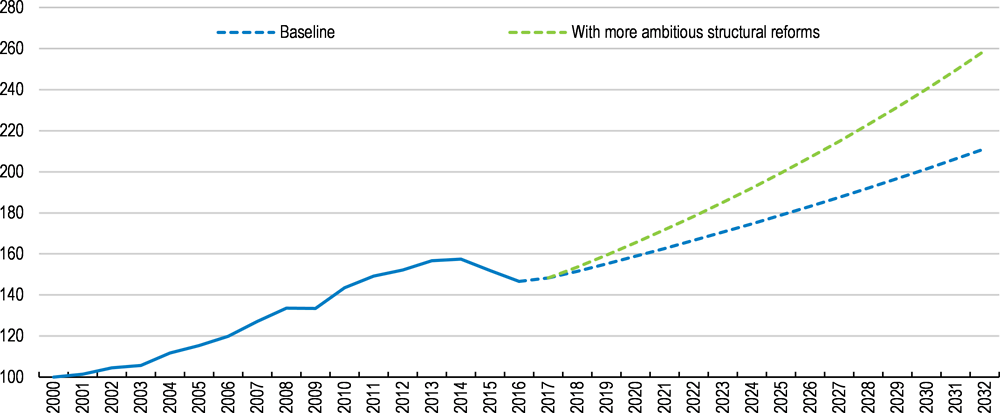
Note: The baseline growth projection assumes growth as in Table 2 and 2.4% from there onwards, while the more ambitious structural reform scenario adds estimated GDP gains resulting from additional structural reforms as in Table 1.
Source: OECD estimates based on OECD Economic Outlook Database.
Against this background, the main messages of the Survey are:
-
Stabilising public debt and ensuring that inflation remains close to the target are key macroeconomic priorities. The new expenditure rule will be crucial for restoring the credibility of fiscal policy.
-
Well-being is significantly affected by high inequalities, both in terms of incomes and opportunities. Improving the effectiveness of public spending, and in particular public transfers, will be crucial for further social progress. Well-targeted transfers in combination with further improvements in education and health hold the key to more inclusive growth.
-
Raising investment by improving the business climate and access to finance would raise productivity and potential growth. Addressing infrastructure bottlenecks from years of underinvestment will be crucial.
-
Greater integration into the global economy would raise potential growth and productivity through increased competition and efficiency gains, and help share in the gains of international trade. It would also create more jobs with higher productivity and better wages and allow more workers to join the formal sector.
The economy is gradually emerging from the recession
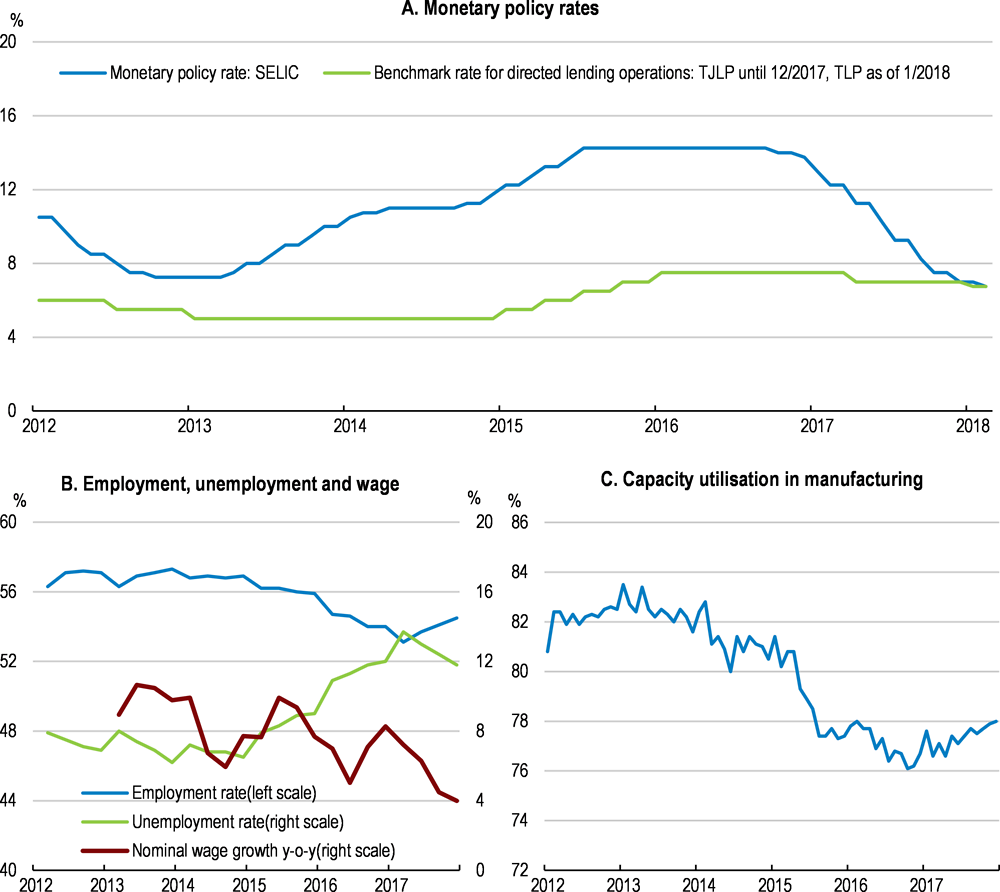
After falling for eight consecutive quarters, growth resumed at the beginning of 2017. A stronger government commitment to fiscal sustainability and several structural reforms improved confidence and short-term indicators (Figure 4). Unemployment peaked at 13.3%, but started to decline. Total credit to the private sector is still contracting on a year-on-year basis, but credit to households has been recovering significantly.
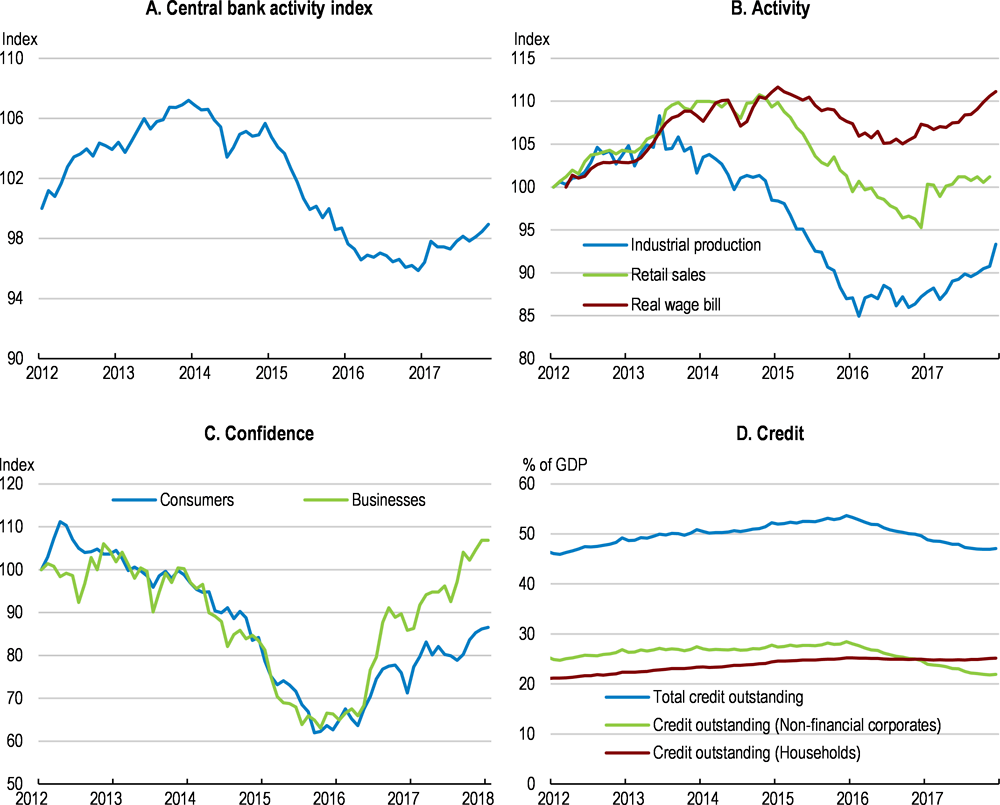
Source: Central Bank, CEIC.
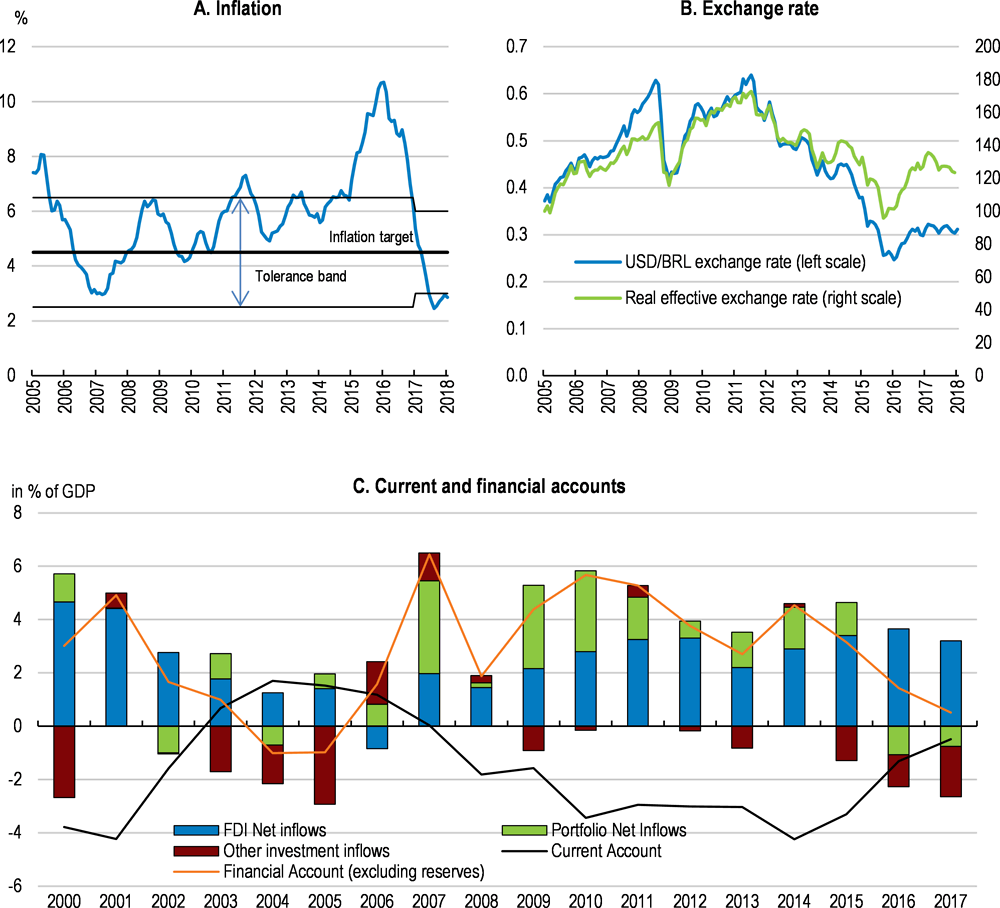
Annual inflation has come down substantially, from a peak above 10% in January 2016 to below 3% in January 2018. This is supporting household real incomes and has opened space for significant interest rate reductions. Private consumption has started to grow and will gain momentum as employment growth picks up and the real wage bill increases. Aided by more favourable external conditions, exports are projected to outpace import growth, resulting in further improvements in the trade balance. Foreign direct investment, amounting to a multiple of the current account deficit, will continue to hold up strong, while portfolio inflows, which had turned negative in 2016 but have since recovered, will be buoyed by a slow pace of interest rate hikes in advanced economies. The exchange rate has depreciated markedly since 2011, both in nominal and in real terms (Figure 5).
Source: Central Bank, CEIC.
Growth is projected to strengthen during 2018 and 2019 (Table 2). Assuming the implementation of a substantial part of the current reform projects, confidence and easier credit conditions will support investment. Monetary policy can continue to provide support maintaining the current low level of interest rates in light of significant slack in the economy, although much will depend on the successful implementation of the fiscal adjustment. Against the background of subdued inflationary pressures and the need to ensure the sustainability of fiscal accounts, this policy mix appears appropriate.
Risks related to political developments are substantial
Risks to these projections include a failure to implement planned reforms, such as the much-needed fiscal adjustment. If the new expenditure rule is not adhered to, unsustainable fiscal dynamics could reduce confidence and trigger a return to recession. In particular, a successful implementation of the pension reform, without which the expenditure rule cannot be met in the medium term, will be a litmus test for the ability of the authorities to implement further structural reforms. Higher volatility on financial markets related to a normalisation of US monetary policy could also present risks for Brazil, although bouts of volatility have been well managed by the Central Bank in the past. Reserves and the strong FDI component of inflows would cushion related exchange rate risks.
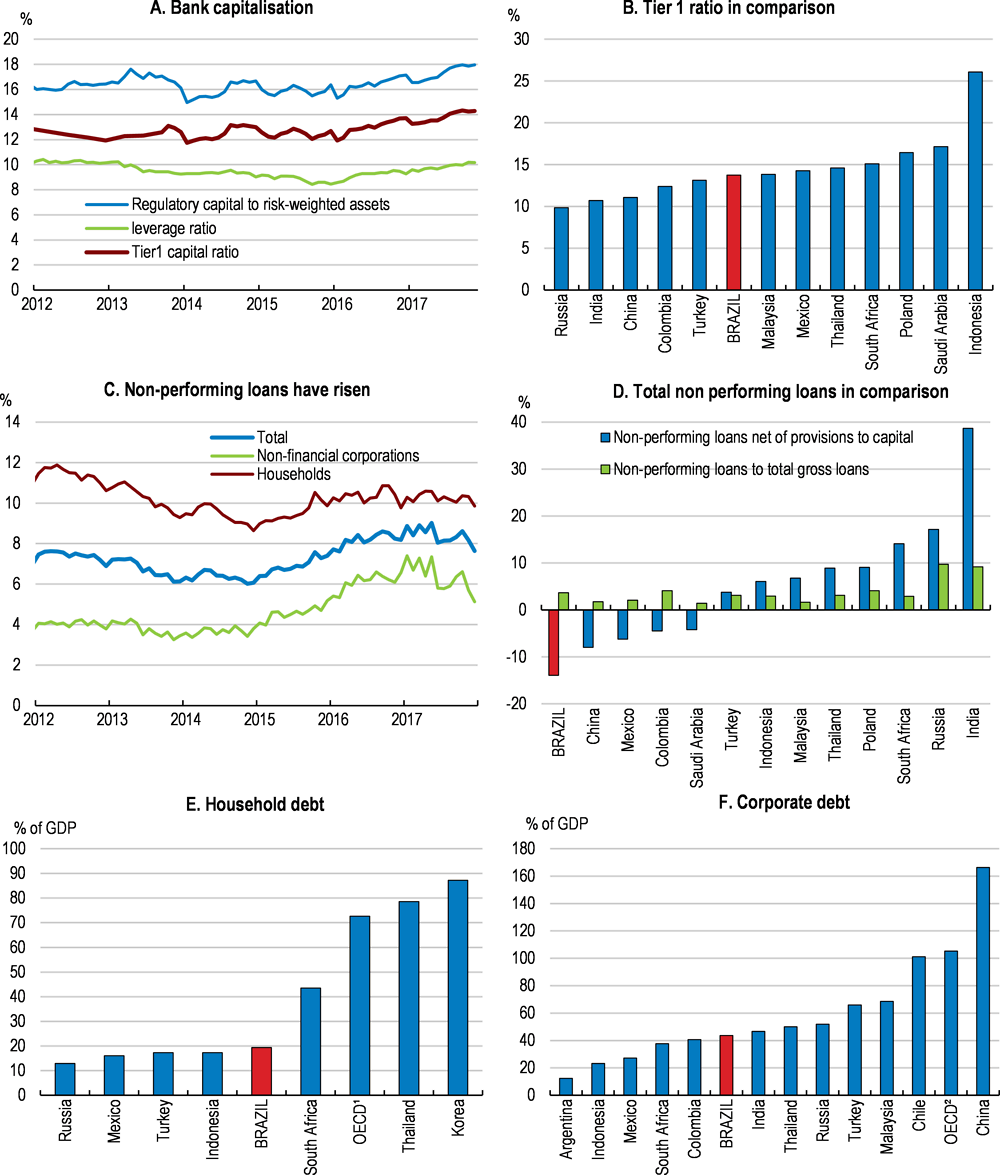
In the banking sector, capitalisation exceeds regulatory requirements mitigating solvency risks (Figure 6). Stress test results point to an ability to withstand substantial shocks to growth or risk premiums (BCB, 2017; IMF, 2017a). In some sense, the severe downturn has acted like a real-world stress test for financial institutions, which have anticipated the recession by tightening credit standards and increasing fee income, and have remained solid. However, non-performing loans have risen and around a third of firms have interest obligations exceeding their earnings. Under adverse scenarios, this share could rise to 40%, corresponding to around 15% of total outstanding corporate debt (IMF, 2017a). On the household side, financial education has a role to play for prudent borrowing decisions and the resulting asset quality, as well as for fostering financial inclusion (Banco Central do Brasil, 2015, OECD, 2015h).
1. Unweighted average of 24 OECD countries with available data.
2. Unweighted average of 30 OECD countries with available data.
Source: CEIC, Central Bank.
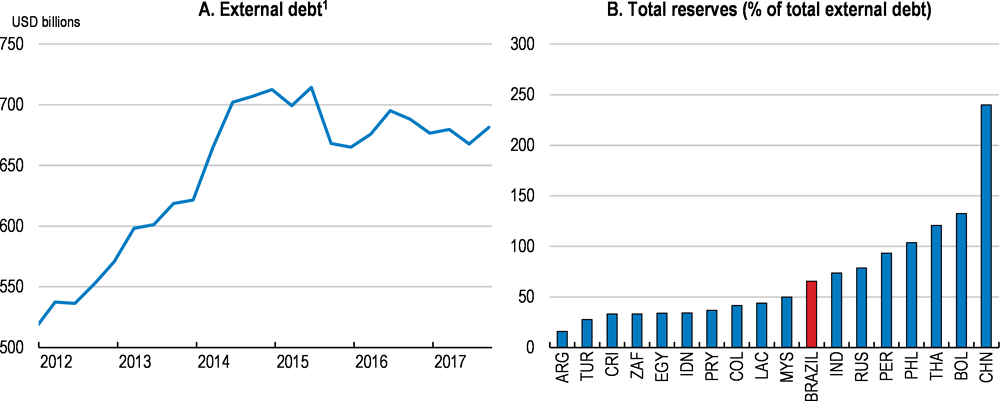
The flexible exchange acts as a shock absorber, but in interaction with unhedged foreign-currency debt it can create risks. The corporate sector, whose debt amounts to around 43% of GDP, is exposed to exchange rate risk as unhedged corporate liabilities of non-exporting firms in foreign currency amount to around 9% of GDP (BCB, 2017). By contrast, external debt is not a vulnerability for the public sector, with only 3.6% of public debt denominated in foreign currency and 12.7% of domestic public debt securities held by non-residents. Economy-wide external debt has risen over the past 5 years but is lower than in most emerging market economies (Figure 7). The total amount of external debt to be rolled over within 12 months amounts to 40% of currency reserves.
1. The external debt definition used here includes intercompany lending and domestic fixed income securities held by non-residents.
Source: CEIC, Central Bank
Inflation has declined but financial intermediation could be improved
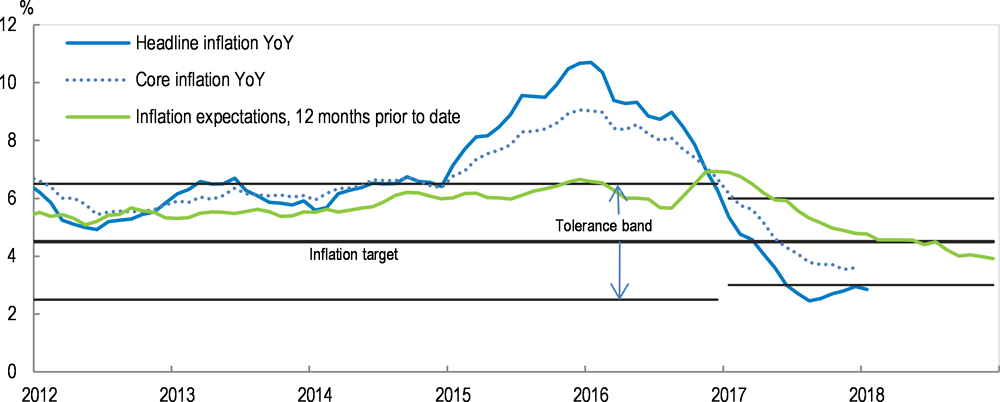
Inflation began to trend upwards in early 2014 and rose to almost 11% in early 2016 as overdue adjustments of administered prices were implemented, among other factors. Since then, it has fallen well below the 4.5% inflation target of the Central Bank (Figure 8). Core inflation has declined to below 4.5% as well and expectations remain firmly anchored around the inflation target, which represents a break with recent history. Tight monetary policy until mid-2016 helped contain inflation, supported by improving market expectations about macroeconomic policies, food prices, weak domestic demand and the fading administered price effects.
Source: CEIC, Central Bank.
The Central Bank has responded to the decline in inflation by a series of reductions in the policy target rate SELIC from 14.25% in October 2016 to 6.75% in February 2018 (Figure 9). This is close to the level suggested by a Taylor rule, although much will depend on fiscal dynamics (IFI, 2017d). The labour market still has slack, with unemployment remaining high. Falling employment has also reflected lower participation rates, particularly among youths. The inflation target has been reduced for 2019 and 2020 to 4.25% and 4%, respectively.
While the Central Bank has acted independently recently, the effectiveness of monetary policy could be improved further by formalising this independence and shielding it from possible future political interference. Setting a fixed term for appointments of the central bank governor and members of the monetary policy committee, during which they cannot be dismissed, would be in line with current practice in most inflation-targeting countries (Hammond, 2012). Furthermore, safeguarding the financial independence of the Central Bank, including through an adequate budget and adequate levels of capital, are key for maintaining a strong credibility. Chile and Mexico have had formal Central Bank independence for over 20 years, which include long fixed-term appointments of board members.
The financial sector has many public and private banks, but most of them are only operating in the short-term segment. Long-term credit beyond 3 years is almost exclusively provided through directed lending operations, in particular by the national development bank BNDES, while private domestic financial markets accounted for only 8% of investment financing in 2016. There is no empirical evidence that the stark increases in BNDES lending to particular sectors since 2008, with subsidies peaking at over 2% of GDP in 2015, were able to prevent a massive decline in investment (World Bank, 2017; Bonomo et al., 2014; Ribeiro, 2016). All other firms seeking investment financing face severe credit constraints, high lending rates and short maturities.
In the past, directed lending was guided by a benchmark rate that was independent of but much lower than the monetary policy rate, resulting in negative real interest rates over many years. A new law approved in September 2017 introduced a gradual alignment of directed lending rates with market rates by 2022 at the latest, although much of the alignment may de facto take place earlier. The new law is expected to make the credit channel of monetary policy more effective, as recommended in the 2015 OECD Economic Survey of Brazil (Table 5). It will also allow the development of private long-term credit markets by levelling the playing field between public and private lenders. A sophisticated financial industry consisting of domestic and foreign banks, without major practical barriers to entry, is likely to be able to provide long-term finance in the future. If this turned out to be difficult, then additional measures may be required.
Source: CEIC, Central Bank.
Fiscal outcomes need to improve to ensure the sustainability of public debt
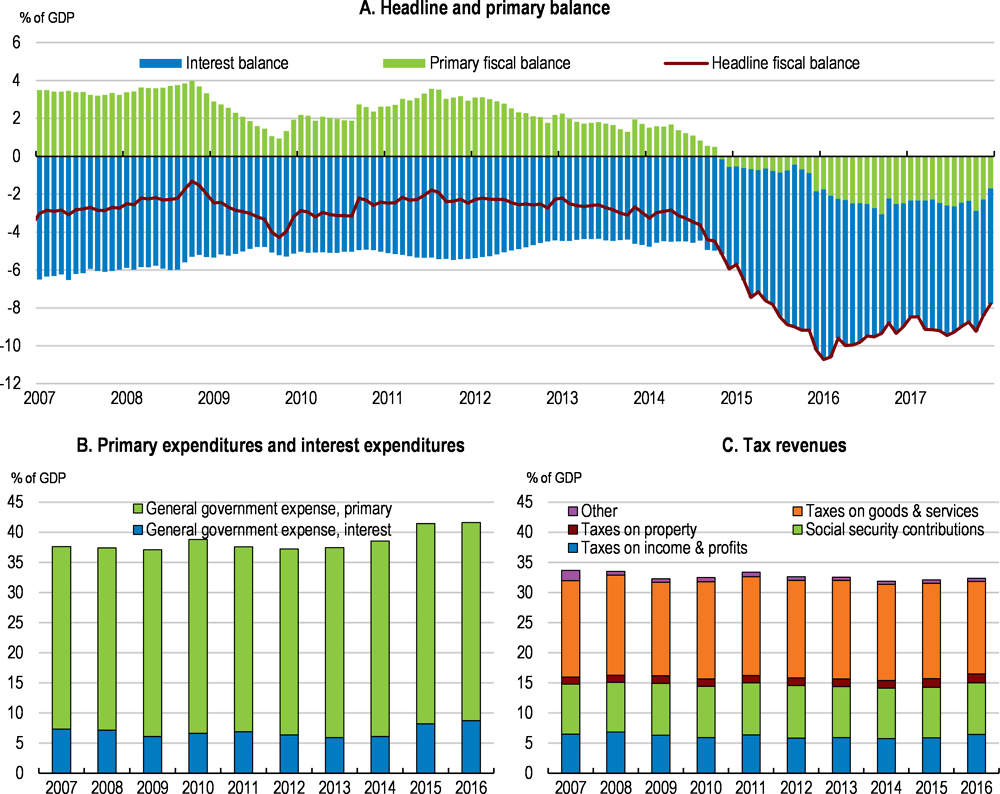
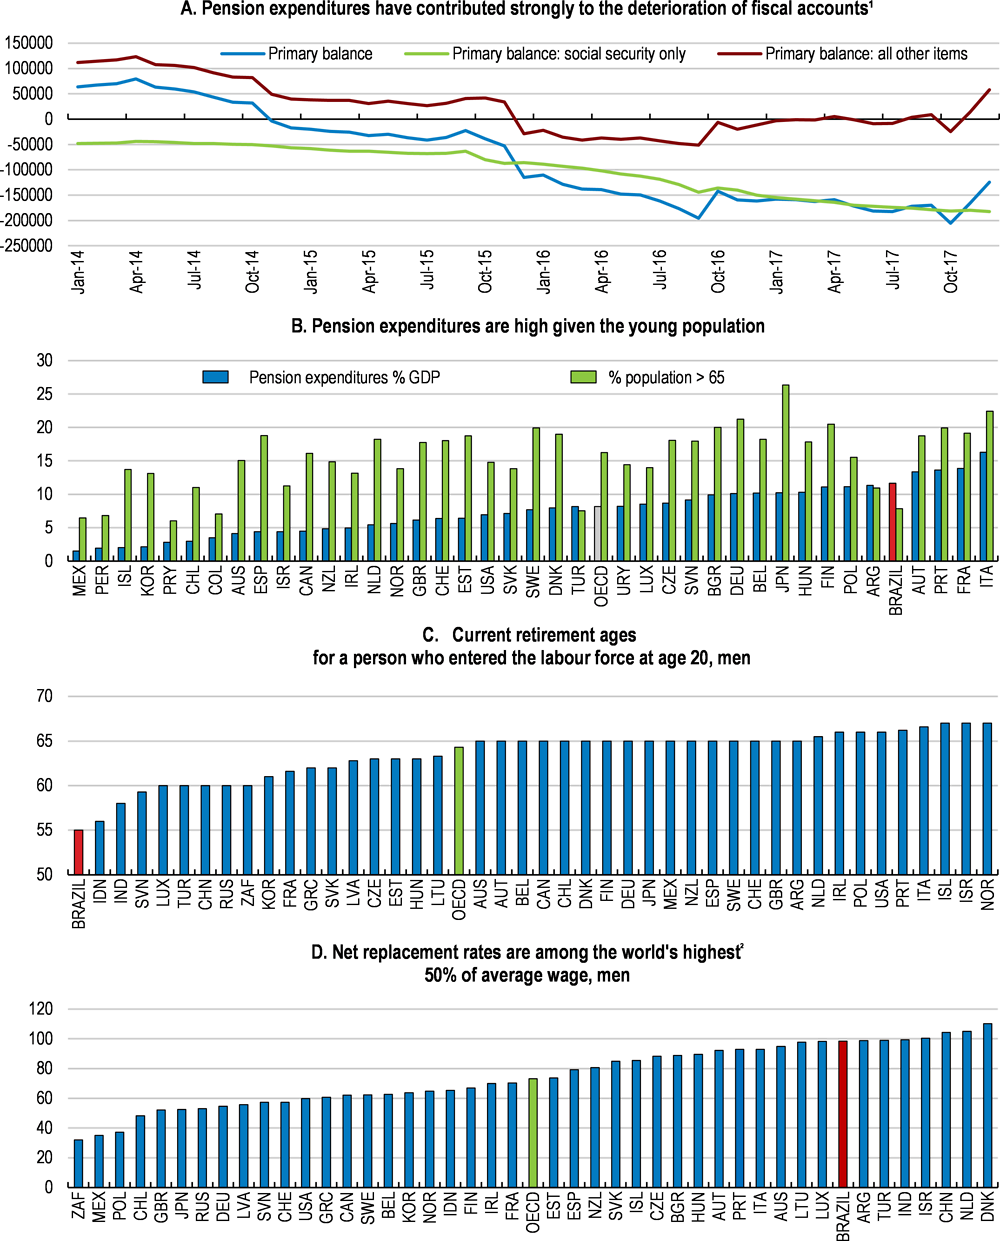
Fiscal outcomes have deteriorated substantially since 2014, when the primary balance (excluding interest payments) turned negative after more than a decade of primary surpluses, reflecting mostly increases in expenditure, including tax expenditures (Figure 10). The current primary deficit of 1.7% of GDP (November 2017) is significantly below the primary surplus required to stabilise public debt in the medium term, estimated at around 2% of GDP. Interest expenditures have declined from 9% of GDP in January 2016 to 6.1% and will likely decline further as maturing debt is rolled over at lower interest rates. Tax revenues amounting to 32% of GDP are close to the OECD average of 34%. The headline fiscal deficit stood at 7.8% of GDP in December 2017. The fiscal situation of a few Brazilian states has deteriorated substantially in recent years, which may create fiscal risks, although measures have been taken to contain these risks (IMF, 2017a).
Source: Central Bank, Treasury.
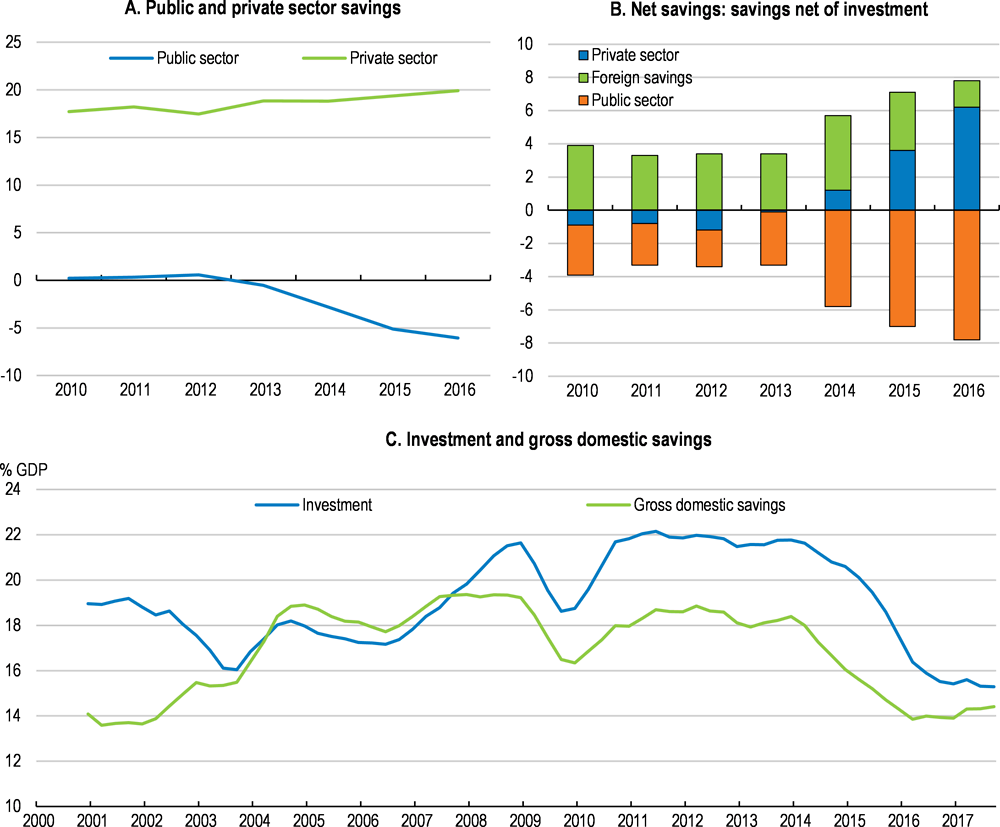
The rising public deficit has also reduced domestic savings and crowded out private investment which has more or less followed developments in gross domestic savings over the years (Figure 11). As public investment has also declined, private investment has been replaced by public consumption.
Source: IBGE, CEIC, CEMEC (2017).
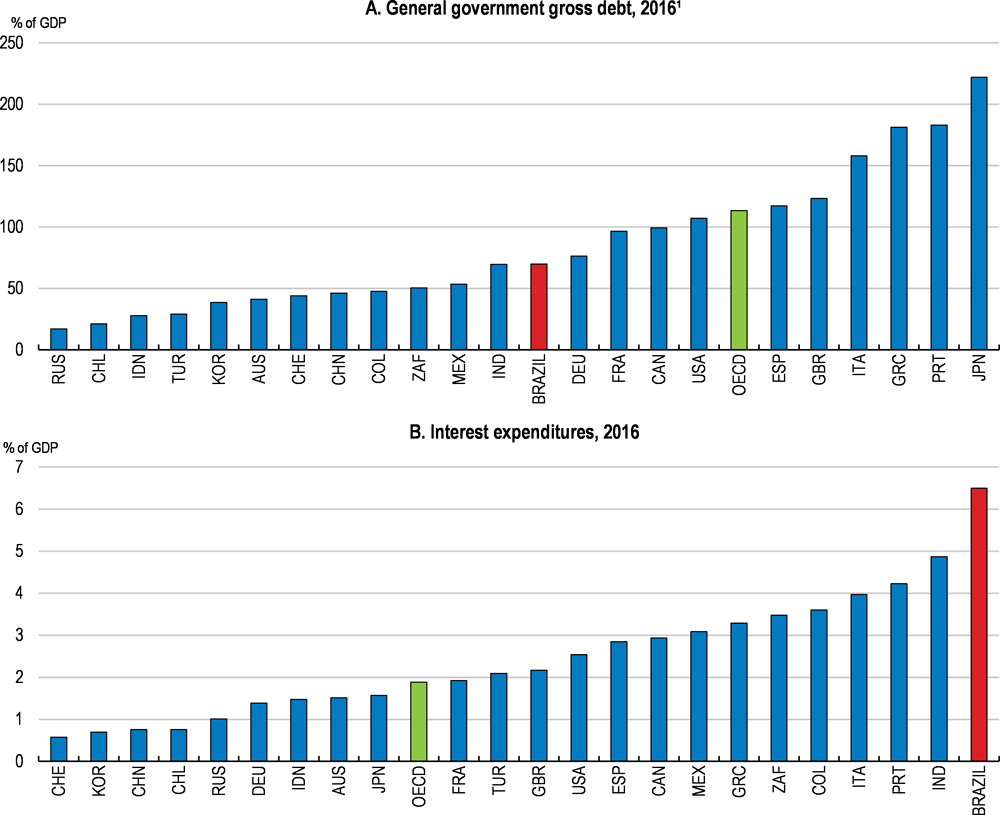
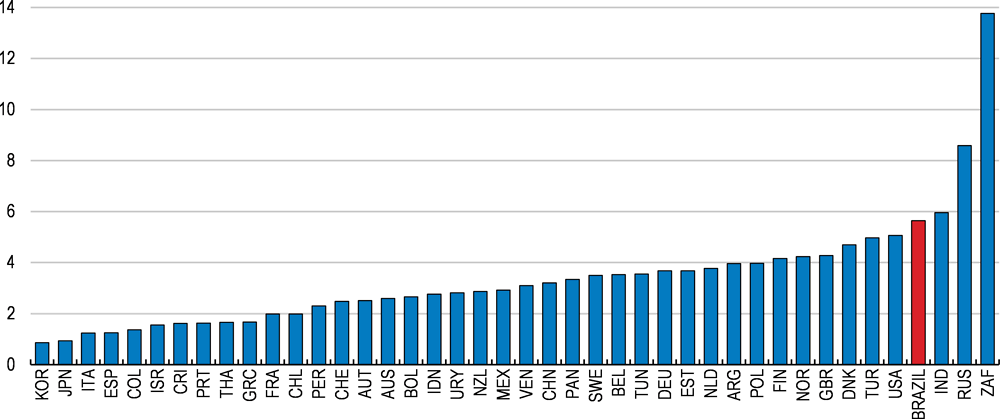
Gross public debt has increased by approximately 20 percentage points of GDP over the last 3 years and currently stands at 74% of GDP (December 2017), according to the Brazilian official methodology. Both rising expenditures and lower revenues in the context of the recession have contributed to this. This level is high for an emerging market economy (Figure 12, Panel A). Brazil’s average debt cost of 8.6% and interest expenses of 6.1% of GDP (December 2017) are among the world’s highest (Figure 12, Panel B). While the explanations for Brazil’s high interest rates are hard to pin down, a history of macroeconomic instability, low public and private savings, low confidence in fiscal dynamics, high inflation of the past and credit market segmentation have likely played a role (Segura-Ubiergo, 2012).
1. Using the IMF debt definition, which also includes securities held by the Central Bank that are not part of gross debt by the official Brazilian methodology.
Source: OECD Economic Outlook Database, IMF World Economic Outlook 4/2017, Central Bank.
Debt simulations suggest that gross debt will continue to rise until 2024, peaking at around 90% of GDP, and decline gradually thereafter (Figure 13). These simulations assume that the current fiscal plans are met by the present and incoming governments and compliance with the expenditure rule is ensured. However, the trajectory of debt is highly sensitive to the implementation of the reform agenda. In a scenario in which only minimal reductions in mandatory spending items can be achieved and the primary deficit is reduced but not turned into a surplus, debt relative to GDP will continue to rise without bounds and not be sustainable. By contrast, in an ambitious reform scenario as in Table 1 with 1.4 additional percentage point of GDP growth from 2021, debt would stabilise earlier and return to current levels by 2027.
Over the next years, fiscal targets aim at a gradual improvement of the primary balance to -0.6% of GDP by 2020, from the current -1.7%. Beyond 2020, the new fiscal rule will become binding, essentially limiting the growth of almost all primary central government expenditures to inflation for the next 20 years, with a possibility of review after 10 years. The rule contains credible enforcement mechanism and only transfers to subnational governments, emergency expenditures, expenses with the electoral process, certain education expenditures and capital increases in state-owned enterprises are excluded. The establishment of an expenditure rule was recommended in the 2015 OECD Economic Survey of Brazil (Table 5).
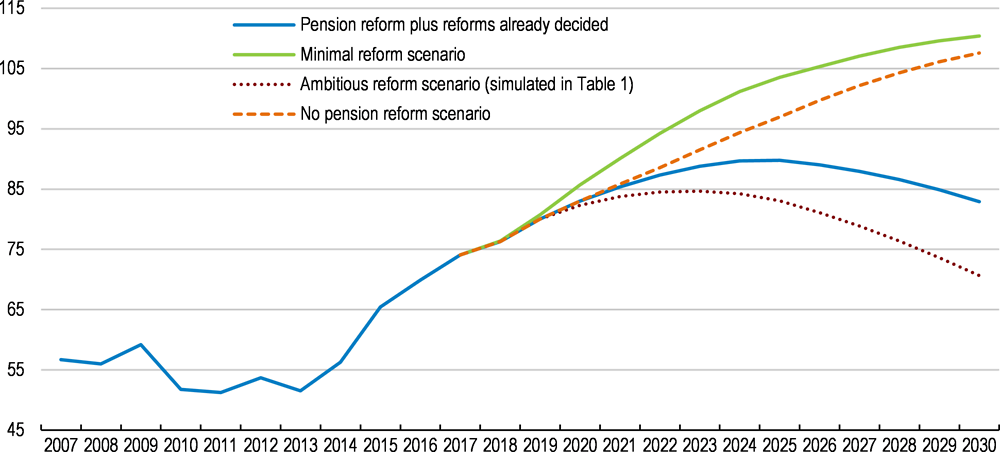
Note: In the baseline scenario, the primary deficit is as in government targets. Hence, using OECD GDP projections, the primary balance is -2.3%, -1.8% and -0.6% of GDP for 2018, 2019 and 2020, respectively. After 2020 compliance with the expenditure rule is assumed. The exchange rate and the interest rate are assumed to remain constant over the projection horizon. GDP growth is assumed as in table 2 and constant at 2% after 2019. The minimal reform scenario assumes a slower reduction of mandatory spending, with a balanced primary result not before 2030. The ambitious reform scenario assumes structural reforms that boost raise productivity growth (see table 1) and results in 3.4% GDP growth in the period 2021-2027. The no pension reform scenario assumes the absence of any noticeable parametric reform to the pension system.
Source: OECD calculations.
While current plans are just about sufficient to stabilise public debt, compliance with the expenditure rule will be challenging. The deterioration of fiscal accounts reflects an unsustainable path of primary expenditures which have grown almost 3 times faster than GDP over the last decade. Discretionary spending, which includes public investment and cash transfers to the poor, is only 20% of the central government’s primary spending and does not present much room for further savings.
The expenditure rule can only be met with ambitious reductions of rigid mandatory spending items and this should be the main avenue forward. Otherwise, the sustainability of public debt would be in jeopardy, with the possibility of a serious fiscal crisis looming in the medium term. The downside to this is that reforms to mandatory spending are politically more difficult as they require approval by Congress. The upside is that there is significant scope for improving the efficiency of public expenditures and reducing tax expenditures such as exemptions and reduced rates without detriment to attaining social and economic objectives.
Enhancing the efficiency of public expenditures, including tax expenditures
Brazil spent over 15% of GDP on social benefits in 2016, corresponding to 35% of total public sector expenditure (Figure 14). Social benefits are responsible for more than half of the increase in primary expenditures and continue to outpace GDP growth. Several of these programmes are crucial for more inclusive growth but much can be done to raise the social returns through better targeting towards those most in need of support. In some cases, this will require reconsidering acquired rights to reduce the inequalities across generations, recognising that the state has made promises that cannot be upheld for future generations.
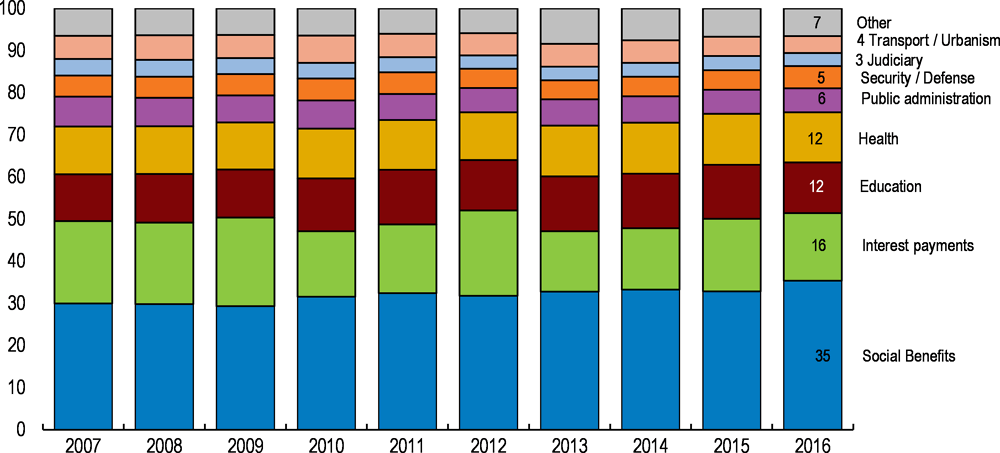
Note: A significant part of the 4.5% of GDP that Brazil spends on private sector development programmes are not visible in this breakdown as they take the form of tax expenditures. Part of the cost of past transfers from the National Treasury to public banks that allowed an expansion of subsidised lending operations show up as interest payments in public accounts, as the National Treasury issued additional debt to finance these transfers.
Source: OECD calculations based on National Treasury data.
A large and rising share of social benefits is paid to households that are not poor, which reduces their impact on inequality and poverty. Already, poverty is highest among children and youths (Figure 15). Limiting future increases in social benefits that mostly reach the middle class could help to increase social transfers with a strong inequality-reducing impact and a strong targeting towards children and youths, like the conditional cash transfer programme Bolsa Família. The attached conditionalities regarding school attendance and medical check-ups also help to reduce inequalities with respect to education and health, which in turn strengthens productivity.
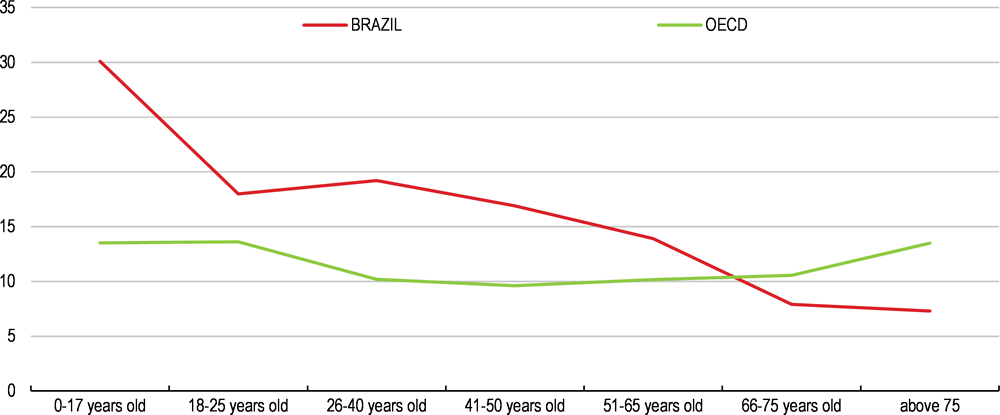
Source: OECD Income Distribution Database (IDD).
Brazil’s constitution defines that many social benefits cannot be lower than the minimum wage, but the current level of the minimum wage is almost 7 times as much as the poverty line (Figure 16). In fact, it is even above the median income as more than 56% of Brazilians have incomes below the minimum wage. The minimum wage has increased rapidly over the years, and its real value is now 80% higher than 15 years ago while GDP per capita increased by only 23%. Maintaining the minimum wage as a floor for many social benefits will likely lead to a continuation of rapid increases, with the result that an ever larger share of benefits will be paid to those with above-median incomes and not to the poor.
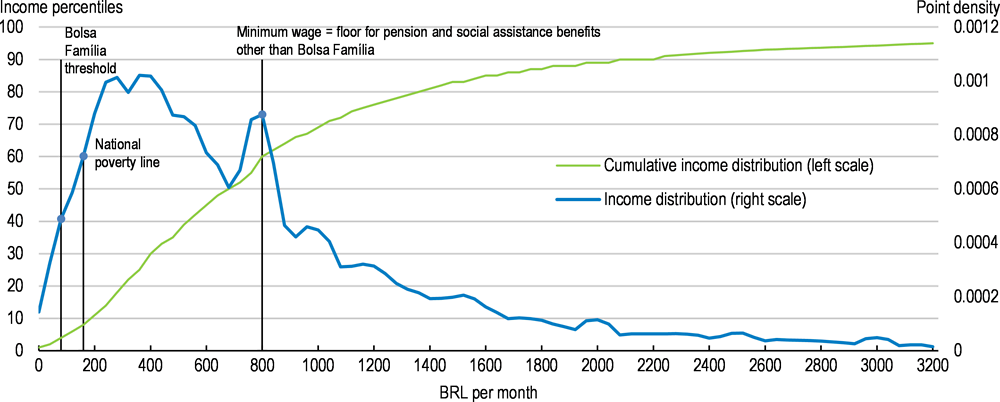
Note: The blue line represents the income distribution of Brazil (or point density function). Higher values mean that more people have incomes of the corresponding level on the horizontal axis. The green line is the cumulative distribution function, showing how many people have incomes equal or lower than the corresponding income level on the horizontal axis. The 2015 minimum wage of 788 BRL, for example, corresponds to the 56th income percentile, meaning that 56% of Brazilians had incomes of BRL 788 or less in 2015.
Source: OECD calculations based on 2015 Pesquisa Nacional por Amostra de Domicílios, IBGE.
A comprehensive social security reform has become the most urgent element of fiscal adjustment, and is also an opportunity to make growth more inclusive through better targeting of benefits. Brazil’s pension system costs almost 12% of GDP, which is high given Brazil’s young population (Figure 17). Pension expenditures have been largely responsible for the decline in the primary balance. All pension benefits are subject to the minimum wage floor, resulting in high replacement rates, in particular for low-wage earners. Aligning Brazil’s pension rules with those practiced in OECD countries would imply a minimum pension lower than the minimum wage, with eligibility to some prorated pensions for shorter periods. Indexing pension benefits to the consumer price index for low-income households would preserve the purchasing power of pensioners while improving the sustainability of the pension system. Sustainability would also be helped by establishing a formal minimum retirement age as current effective retirement ages of 56 years for men and 53 for women are far below the OECD average effective retirement age of 66 years for men and women (OECD 2015b). Without reform, pension expenditure will more than double, rendering the system clearly unsustainable (OECD, 2017a; IFI, 2017a). Moreover, the highly regressive subsidy element of the pension system with 82% of funds spent on the richest 60% would rise further (World Bank, 2017).
1. Accumulated over 12 months in BRL million.
2. Net replacement rates for a male full-career worker having entered the labour market in 2016.
Source: National Treasury, OECD Pensions at a Glance 2017.
A pension reform bill has been submitted to Congress, and, if passed without significant amendments, would improve pension sustainability. Still, delinking the minimum pension from the minimum wage will become inevitable in the future. Moreover, aligning more generous pension provisions for civil servants with that of private employees would be another source of potential savings. Consideration should also be given to prorate the minimum contribution period of 25 years for those with fewer years of contributions to avoid difficulties for poorly educated workers migrating between formal and informal employment, as years spent in informal employment do not give rise to pension rights.
Beyond contributory pensions, different social assistance programmes could be coordinated better or merged to eliminate overlaps and duplication of benefits. Brazil spends around 0.7% of GDP on non-contributory pensions for disabled people and the elderly without pension contributions. With no means-testing, only 30% of this benefit reaches the bottom 40% of the income distribution, with the remainder accruing to the more affluent (World Bank, 2017).
The only truly progressive social expenditure is the 0.5% of GDP spent on the well-targeted conditional cash transfer programme Bolsa Família, which also helps families to move out of poverty over time by conditioning transfers on children’s’ school attendance and basic health check-ups. 83% of benefit outlays reach the bottom 40% of the income distribution. The maximum benefit for a whole family is less than a third of one minimum wage. These benefits have been subject to discretionary increases broadly following prices, but a planned adjustment for 2017 was suspended until 2018.
Bolsa Família is the only transfer where incremental spending would really reach the poor. It is also a key instrument to protect the most vulnerable, including women, Afrodescendants and people of indigenous origin, many of which still suffer discrimination, despite recent progress made (World Bank, 2016). A package of reforms that would sever the link between minimum benefit levels and the federal minimum wage while shifting at least some of the savings to Bolsa Família could have led to 63% faster declines in inequality over recent years (Arnold and Bueno, 2018). In the same vein, tax revenues lost with some consumption tax exemptions, such as basic food, would be more effectively spent on Bolsa Familia.
Labour market benefits have a strong focus on passive income support measures for the 64% of workers that are in the formal sector. With around 36% of employment currently informal, the existing unemployment protection schemes fail to reach the most vulnerable group of workers (IBGE, 2017).
Formal sector unemployment insurance consists of two parallel schemes, Seguro Desemprego and the individual unemployment accounts called FGTS. These two programmes have a joint fiscal cost of around 1% of GDP when considering government top-ups of withdrawals as expenditure. They could be merged gradually as they essentially serve the same purpose and the current mandatory employer contribution to FGTS of 8% of salaries raises the cost of formal employment. In the transition, account balances, whose remuneration has traditionally fallen short of inflation, should be remunerated at market rates to reduce the currently strong incentives for frequent job turnover, often involving self-induced layoffs by arrangement with the employer. Merging the two unemployment insurance schemes Seguro Desemprego and FGTS would allow savings that could finance extending the maximum coverage period of Seguro Desemprego. At currently 3-5 months, this period is short relative to an OECD average of 16 months.
Two overlapping employment subsidy programmes with a joint cost of 0.2% of GDP and no proven effects on formalisation, Abono Salarial and Salário Família, could be reconsidered as they reach only workers with above-median incomes given that the legal floor for this benefit is the federal minimum wage (Figure 16).
The fact that the most vulnerable segment of workers is not covered by labour market programmes as a result of informality limits their effectiveness as a broad-based insurance or support mechanism. Acknowledging that informality is a complex issue and will only recede over time, a stronger focus towards general income support schemes that protect workers would provide more effective insurance against income losses than benefits tied to a history of formal employment. This may strengthen the case for raising benefit levels in conditional cash transfer schemes, most notably Bolsa Família.
At the same time, further efforts to reduce informality will be key for more inclusive growth going forward. Informal employment offers not only lower job quality, but is also generally less productive (OECD, 2016e). Where informality affects entire firms, as it often does, it precludes access to financial services, credit, and public procurement opportunities. Brazil can build on substantial progress in reducing informality, including programmes to reduce the administrative and tax burdens for micro and small enterprises to join the formal sector (World Bank, 2016; Silva et al., 2015; ILO, 2014). The recent labour market reform may also strengthen the incentives for formal job creation as restrictive regulation on formal labour markets has been identified as one factor behind informality (Estevão and de Carvalho Filho, 2012). Further improvements in the ease of registering a business may also improve incentives for firms and their workers to become formal, while enforcement efforts also have a role to play.
Public health expenditures of 4.4% of GDP finance Brazil’s unified public health system that provides public health services to the population since 1989. In comparison to other countries, the efficiency of health expenditure in Brazil appears to be low. International comparisons based on data envelopment analysis indicate Brazil could gain more than 5 years of health-adjusted life expectancy, a commonly used health indicator, through efficiency improvements, while maintaining current per-capita health expenditures (Figure 18; Chapter 2 of the 2015 OECD Economic Survey of Brazil). Significant savings could result from better coordination across different levels of government and care complexity, improving performance monitoring and strengthening incentives. Since 1990, Brazil has seen one of the strongest declines in child mortality in Latin America (World Bank, 2016). However, indigenous communities suffer from significantly worse health conditions, including higher child mortality rates, suggesting the need for a better focus on vulnerable and disadvantaged groups. Developing a more explicit definition of what is covered by the public healthcare system and what is not would allow a better focus of existing resources on the most important kinds of treatment and those most in need. This would include putting an end to the current practice of relatively well-educated and better-off patients suing the state to cover their drug expenses with no regard to their cost-effectiveness, which exacerbates inequalities. A tax deductibility of private health plan contributions paid by 25% of Brazilians and their employers has regressive effects and could be phased out, saving 0.3% of GDP (Castro, 2014).
Source: OECD calculations based on World Bank and WHO data.
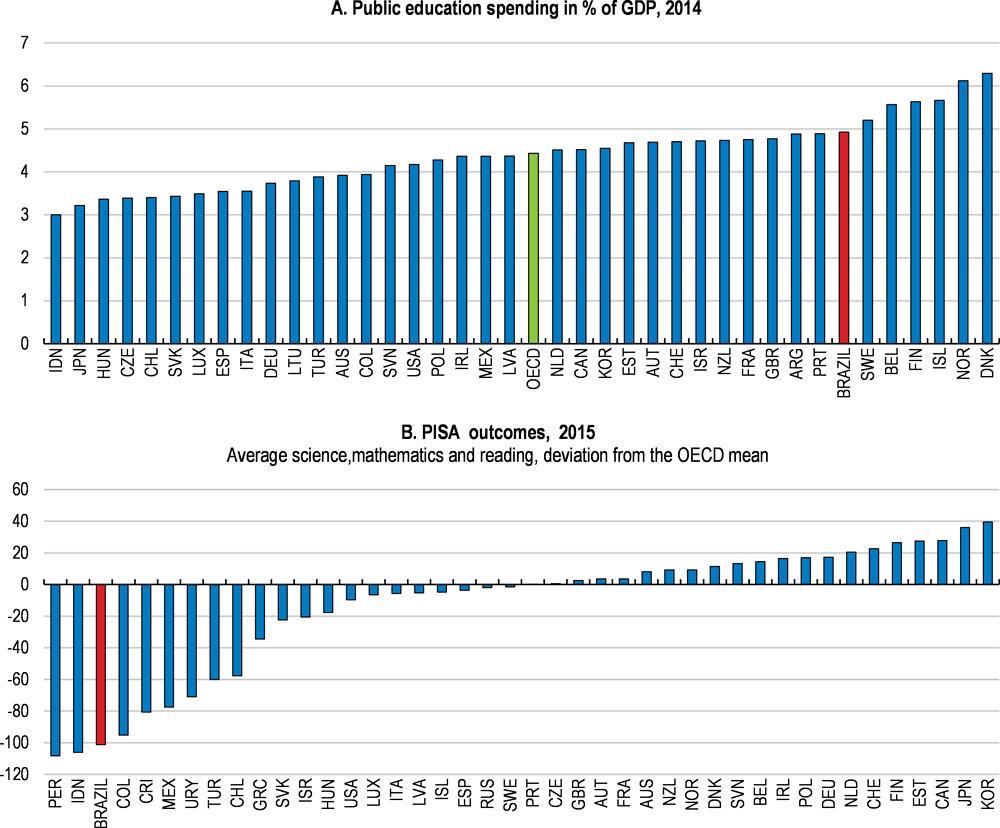
Brazil’s public sector spends 5.4% of GDP on education, above the OECD average and other Latin America Countries (Figure 19). However, while Colombia, Mexico and Uruguay spend less per student than Brazil does, they perform better in the OECD PISA tests, suggesting scope for raising spending efficiency (OECD, 2015f). Shifting spending from tertiary to the pre-primary, primary and secondary levels of education would simultaneously raise progressivity and efficiency. Free public tertiary education tends to benefit students from high-income families as graduates of private secondary schools tend to score better on admission exams. By contrast, early childhood education significantly decreases the likelihood of disadvantaged student dropping out from the education system later on (OECD, 2016p). When allocating scarce spaces in early childhood education, preference should be given to low-income households and single mothers, as this would allow more women to participate in the labour market. Only 15% of poor families with children below 3 years have access to child-care, compared to 40% of the more affluent families (World Bank, 2016). Although it has been narrowing in recent years, there is still a substantial gap in educational attainments between whites and Afrodescendants (World Bank, 2016).
Source: OECD Education at a Glance 2017; OECD PISA 2015 Results (Volume I): Excellence and Equity in Education.
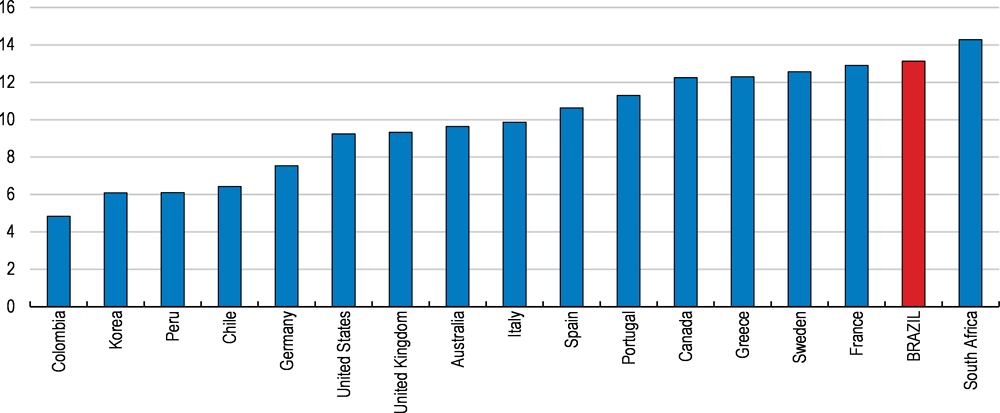
The public sector wage bill of 13.1% is high in international comparison (Figure 20). Following through on current plans to align entry-level salaries for civil servants with private sector pay has significant potential for saving as 39% of civil servant will retire within 10 years (World Bank, 2017). The efficiency of public administration could also be improved by further limiting the scope for political appointments, including in regulatory agencies and public enterprises. The executive’s right of political appointments is regularly passed on to parliamentarians to reward specific voting behaviour. Empirical research suggests that political appointments are associated with lower agency capacity, thus diminishing spending efficiency, and also the bureaucracy's ability to effectively combat corruption (Bersch et al., 2017). Especially in public enterprises, where technical or management experience is paramount, the rationale for political appointments is weak. The new SOE law of 2016 has effectively put some limits on political appointments in SOEs by defining minimum technical requirements for candidates.
Source: Government Finance Statistics, IMF.
Programmes specifically geared at parts of the industrial sector cost an annual 4.5% of GDP, most of which in the less transparent form of tax expenditures, but also subsidies. Rigorous evaluations of these policies are rare but existing evidence has failed to find significant benefits for productivity or investment (World Bank, 2017).
At 1.2% of GDP, the targeted tax regime for small and medium enterprises Simples Nacional combines a lighter tax burden with a simplified calculation of tax liabilities based on turnover. This encourages firms to stay small and reduces the possibilities to achieve productivity gains by sourcing intermediate inputs from potentially more efficient external providers (Caprettini, 2015; OECD, 2009b). For very small firms, the easier compliance may outweigh these considerations, especially considering that youth and women are overrepresented in informal micro- and small enterprises, either as workers or entrepreneurs (ILO, 2014). However, with a high participation ceiling of USD 1.5 million in turnover per year, the regime is currently used by 74% of Brazilian firms. Evidence that the scheme has been successful in fostering firm formality is limited to micro-enterprises in the retail sector (Piza, 2016; Monteiro and Assunção, 2012). In the context of a broader tax reform that would simplify the general tax system, lowering the participation ceiling of Simples Nacional would allow to narrow the scope of application of the targeted tax regime to firms where formalisation gains are more likely and the resulting distortions of the organisation of the value chain matter less. Such a reform would bring substantial productivity benefits for businesses and foster inclusiveness. At significantly lower fiscal cost, the Microempreendedor Individual programme, with a ceiling of USD 20 000 in turnover, has contributed to lower informality among low-income entrepreneurs, especially women (OECD, 2012c).
Special tax benefits have also been given to domestically-produced electronics and vehicles and to promote technological upgrading, often adding to trade protection. Some of these measures have recently been found in breach with WTO rules (WTO, 2017). In most cases, they have raised prices for consumers and increased income for producers, but there is no solid evidence of positive longer-run effects. In addition, large-scale tax benefits for producers in the Manaus Free Trade Zone, located in the state of Amazonas, and a few other special zones cost around 0.4% of GDP per year. Submitting these special regimes to systematic evaluations could allow identifying scope for fiscal savings.
State-owned enterprises (SOEs) play a sizeable role in Brazil. There are 141 SOEs in Brazil, with revenues on the order of 5% of GDP (OECD, 2015b; OECD, 2012a). The authorities have passed a new SOE law as a first step to harmonise and improve governance in 2016 and announced a package of privatisations of state-owned enterprises in 2017, including the electricity generator Electrobrás, oilfields, energy transmission lines, highways and several airports. While privatisations generate one-off revenues that can help improve fiscal accounts in the short term, the principal reason for undertaking them should be to improve governance mechanisms and raise efficiency. In Brazil, management positions in state-owned enterprises have often been political appointments, which tends to affect management quality and governance, and at the state level, political parties have maintained strong influence over local SOEs. This suggests scope for efficiency gains from private operation. The OECD Guidelines on Corporate Governance of State-Owned Enterprises (OECD, 2015b) can be a powerful tool to address governance challenges usually faced by state-owned enterprises attributable to political interference, lack of incentives to improve performance and complex institutional arrangements.
Estimates suggest that these proposals to raise spending efficiency could generate annual fiscal savings of up to 7.9% of GDP (Table 4).
Improving the fiscal framework
Brazil has made substantial progress on its fiscal framework, including the new expenditure rule and the recently established fiscal council (IFI), which has been publishing high-quality monthly reports, including fiscal projections and scenarios. Its establishment has been a recommendation in previous OECD Economic Surveys or Brazil (Table 5). Fiscal transparency has also made progress (IMF, 2017b). Further improvements could include systematic periodic policy impact evaluations for major expenditure items. Moreover, the widespread practice of budget appropriations by parliamentarians for projects in their constituency could be reduced and made more transparent, as empirical evidence suggests links between these appropriations and corruption (Azevedo and Colaço, 2010). Without systematic audits, these budgets are essentially used for coalition building, as evidenced by their sharp increases ahead of key parliamentary votes.
Improving governance and reducing corruption
Brazil ranks 79th out of 176 countries in the latest Transparency International corruption index (TI, 2016). Corrupt practices and kick-backs such as those revealed in recent years (see Box 3) waste public resources and exacerbate income inequalities by allowing relatively prosperous public officials and businessmen to divert taxpayer resources. Evidence has mostly surfaced in the context of public procurement, including by state-owned companies, credit subsidies or tax benefits to specific companies and sectors. Infrastructure concessions are also vulnerable to collusion among bidders and corruption, as estimates suggest that corporate campaign donations by companies have significantly increased the probability of being awarded public contracts (Boas et al., 2014). Regulating the financing of political parties and campaigns, which Brazil is currently discussing, is crucial to prevent powerful special interests from capturing the policy process, which makes growth less inclusive and decreases trust in government (OECD, 2016d).
A series of corruption allegations began to surface in Brazil in 2014, associated to the term “Operação Lava Jato” (Operation Car Wash). The investigations, facilitated by a new anti-corruption law and enhanced scope for plea-bargain agreements, were initially focused on the state oil company Petrobras, but later extended to other sectors, including construction, infrastructure, energy and food processing. Through plea bargain arrangements, business executives implicated high-ranking politicians, some of which have been sentenced. In many cases, investigations are still ongoing.
Improving transparency and accountability are key for addressing the root causes of corruption. Brazil already has a transparency law, but despite progress at the federal level, its enforcement is uneven across states and municipalities. Essential information about procurement contracts whose disclosure is mandated by law is often not provided (Mohallem and Ragazzo, 2017). Moreover, institutions charged with combating corruption have sometimes failed to collaborate, despite a national Anti-Corruption and Anti-Money Laundering Strategy (ENCCLA) (Mohallem and Ragazzo, 2017). At the same time, recent progress in exposing and prosecuting corruption charges is remarkable and shows the strength of Brazil’s judiciary.
Efforts to combat corruption should include a thorough assessment of public procurement laws, in particular how their many complexities and exemptions affect integrity and competition in the tendering process. Such a review should also cover the risk of collusion in public tenders, which is substantial. Reducing collusion will reduce the prices paid by public authorities and opportunities to corrupt the collusion process (OECD, 2010b; OECD, 2014). Rules pertaining to conflicts of interests, incompatibilities and impartiality in public procurement could be streamlined and strengthened. The mandatory use of centralised purchasing bodies, which are less prone to corruption, could be expanded, together with systematic training of procurement officials on effective tender design and effective detection of collusive practices (OECD, 2012b). Whistleblowing procedures are presently hampered by concurrent competences and parallel systems for similar offences, which make it difficult to protect whistleblowers effectively. Most OECD countries have dedicated whistle blower protection laws while Brazil does not (OECD, 2016c). With respect to foreign bribery, Brazil has significantly improved its ability to proactively investigate foreign bribery in close cooperation and coordination with other parties to the OECD Anti-Bribery Convention (OECD, 2017e).
Raising investment is a key policy priority
Investment has been on a steady decline since 2013 and is low in international comparison (Figure 21). Investing more would lift the economy’s growth potential and strengthen productivity growth, which also defines the wage increases that workers can pocket without jeopardising the competitiveness of domestic producers.
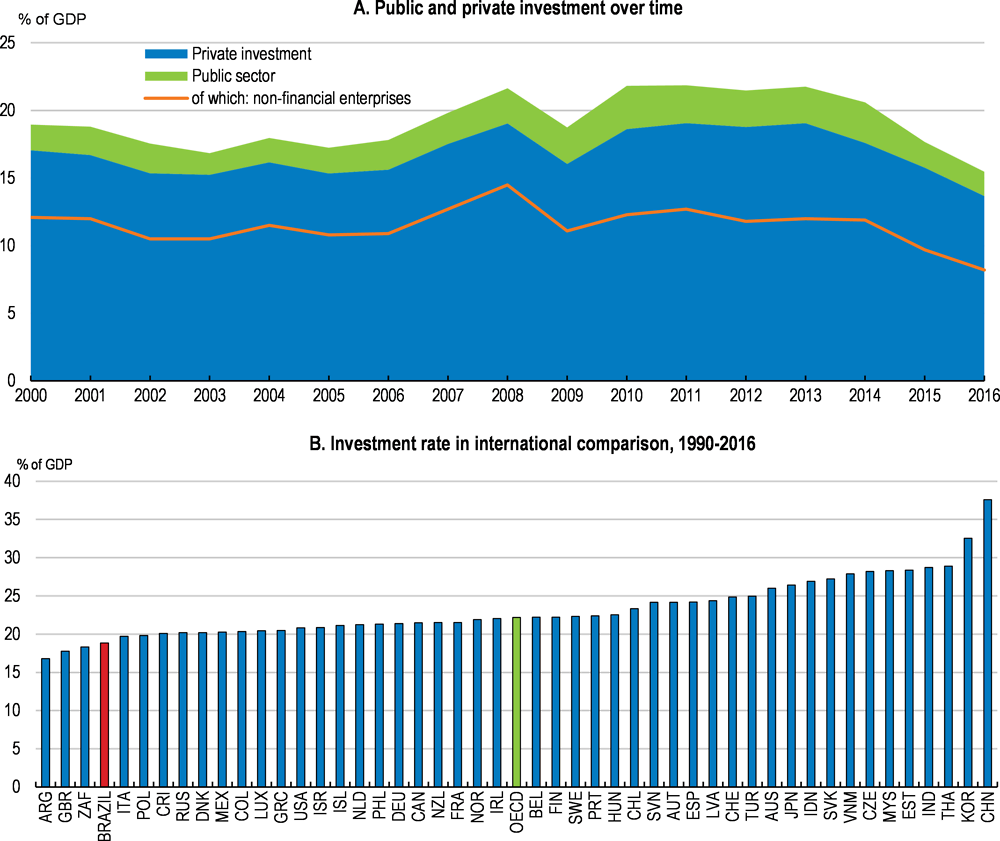
Source: OECD EO database, IBGE, CEMEC (2017).
Investing in infrastructure is particularly important. Brazil ranks 116 out of 138 countries on infrastructure quality in the latest World Economic Forum survey, following years of losing ground to other countries. Quality shortcomings are common to many infrastructure areas (Figure 22).
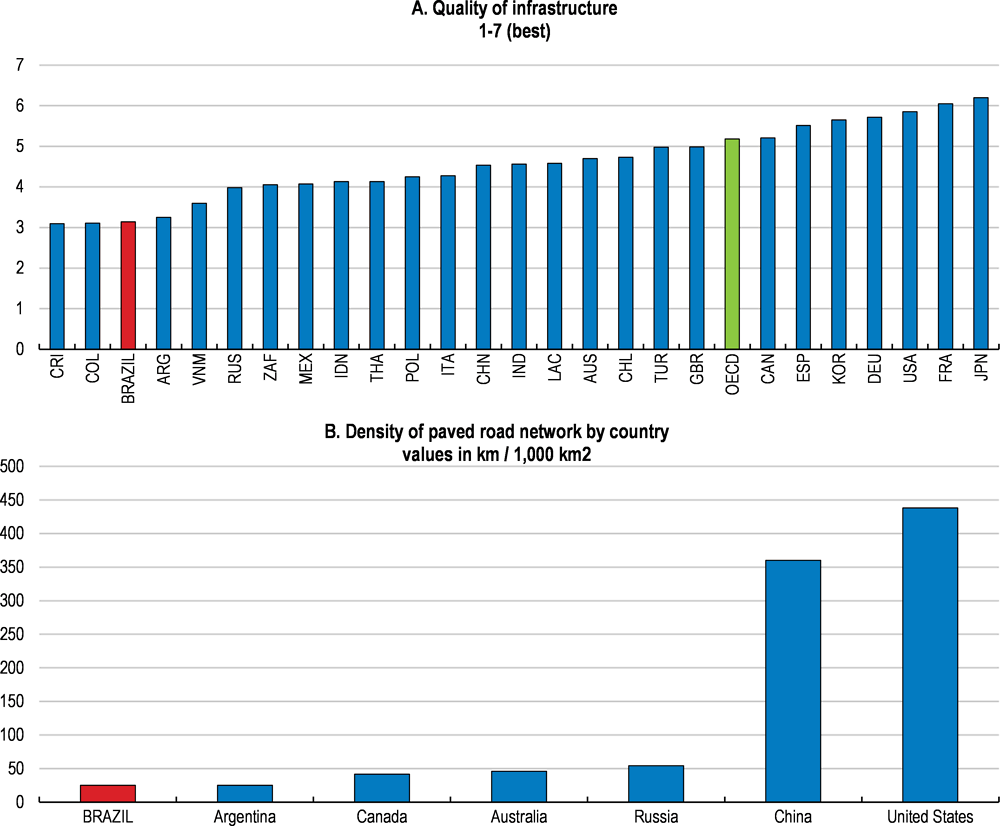
Source: World Economic Forum, Global Competitiveness Indicator database; CNT, available at http://pesquisarodovias.cnt.org.br/. Data are for 2016.
Enhancing the options for investment financing
Access to finance and high costs of credit have been a key impediment to investment. Dominated by the public development bank BNDES, long-term corporate credit markets may not be allocating scarce available funds effectively, as even long-term investments are overwhelmingly flowing into short-term, mostly overnight instruments. A competitive private credit market is likely to lead to better outcomes and the conditions for its development are now better than ever as BNDES lending rates will converge with market rates and returns on safe government bonds have declined.
At the extreme long end of the credit market, 53% of outstanding infrastructure loans are extended by BNDES, whose resources will be insufficient to meet future infrastructure needs. Drawing in more private funding requires relying on a wider variety of financial products to suit different kinds of investors such as international banks, sovereign wealth funds, foreign pension funds and multilateral development banks.
The focus of BNDES could evolve from being the principal source of infrastructure finance in Brazil to serving as a catalyst for mobilising private, including foreign financing. Co-financing requirements for investment loans are one way to engage private lenders. For large infrastructure loans, BNDES could arrange syndicated loans among several banks. BNDES could also lead the creation of structured financial instruments, tranches of which could be purchased by a wider range of institutional investors, including those that are limited to investment grade assets. Mimicking the practices of multilateral lenders, BNDES itself could invest in subordinate or mezzanine debt with loss absorption capacity to reduce the risk profile for other investors, or provide guarantees against certain types of risk to complement incomplete insurance markets. A shift of focus from lending to these kinds of instruments, some of which have already been used by BNDES in the past, would make more effective use of BNDES’ balance sheet, which could in turn be substantially reduced to leave more space for private lenders. At the same time, BNDES could shift its lending towards specific areas that the private sector is struggling to cover and where market failures are particularly prevalent, for example the financing of small start-ups and innovation projects. In most OECD countries that have public development banks, their focus is on such specific areas.
BNDES could also take a leading role in the transition towards the project financing model, which limits creditor recourse to the assets and cash-flows of the project, capping the downside for equity investors. Currently, most BNDES loans require collateral from the sponsor companies, thus narrowing the range of equity investors to all but the largest industrial companies, utilities or construction firms. As many large construction firms have been weakened by corruption scandals, diversifying the equity investor base to include investment funds or pension funds has become more urgent.
Improving the business climate to enhance investment returns
Beyond difficulties in accessing finance, Brazil’s low investment reflects an unfavourable business climate that raises costs and curtails returns on investment. Reforms in several areas could lead a long way to improve this and provide a much-needed boost to investment in Brazil.
One key element of this is a fragmented consumption tax system that raises the cost of capital by failing to refund input tax paid on fixed assets and makes Brazil the country with the highest tax compliance costs (Figure 23). Brazil’s 6 consumption taxes are levied in part by the federal government and in part by the states, each of whom applies its own tax code, tax base and tax rates. Companies wishing to offer goods and services nationwide are required to comply with all states’ tax rules (CNI, 2014). Tax credits for intermediate inputs accrue only if they are embodied in the final good sold which results in extensive use of tax accountants and frequent lawsuits over disputes.
One solution would be to consolidate the different consumption taxes into one value-added tax with simple rules, following the recent example of India and as recommended in the 2015 OECD Economic Survey of Brazil (OECD, 2017c, OECD, 2015g). The federal government could lead the way by consolidating its own consumption taxes into a single value added tax with a broad base, full refund for input VAT paid and zero-rating for exports. Once such a tax was established, state-level taxes could be integrated into this system as state-specific surcharges on the same tax base. This could be done in a gradual manner and would not preclude different states from applying different rates as long as the tax base is uniform and the destination principle is applied consistently for interstate commerce. A temporary compensation via the federal government of some states that are likely to face revenue losses from moving to the destination principle may help to allow these states to adjust gradually and would make it easier to reach a consensus, as has been done in India (OECD, 2017d).
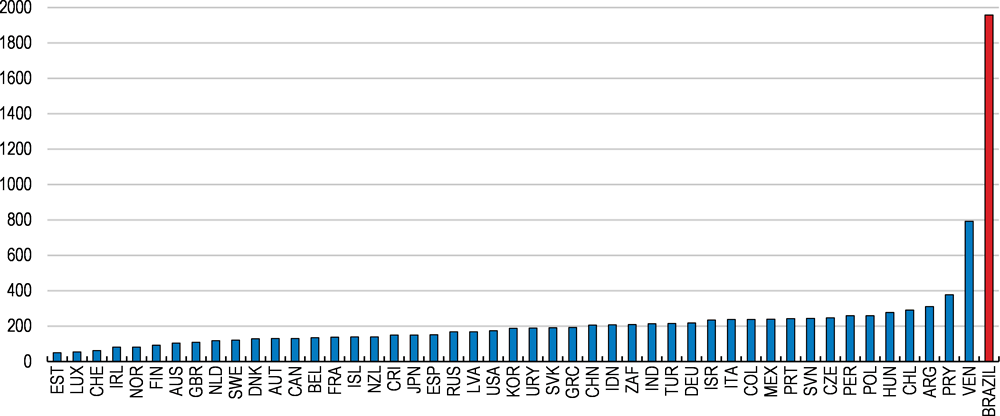
Source: World Bank (2017).
Many industries are characterised by low levels of competition, which tends to foster rigid industry structures in which strong performers find it more difficult to grow at the expense of low-productivity firms. This has trapped resources in low-productivity firms with fewer investment opportunities and curtailed incentives for innovation and technological upgrading (Pinheiro, 2013; IEDI, 2011; IEDI, 2014; World Bank, 2018).
Both domestic barriers to entry and a lack of foreign competition have contributed to this. Brazil has scope to reduce administrative burdens and streamline licensing procedures for new businesses, to make sure its regulations do not unnecessarily hinder competition (Figure 24). Portugal, for example, has made positive experiences with applying a silence-is-consent rule in areas without major safety or environmental concerns. More generally, the OECD’s Competition Assessment Toolkit (OECD, 2010a) can provide guidance not only for identifying but also for revising policies that unduly restrict competition. Empirical results suggest that high administrative burdens are linked to lower firm productivity (Arnold and Flach, 2018).
Finally, industrial policies should provide neutral treatment across incumbents and entrants, and across different sectors of activity. Many industrial policies of the past have tended to cement existing industry structures, but the exit of less productive firms releases the resources that more successful firms need to grow to an efficient scale (Andrews et al., 2017). In addition, environmental licensing could be streamlined and made more predictable, without opening the door to wholesale exemptions from licensing.
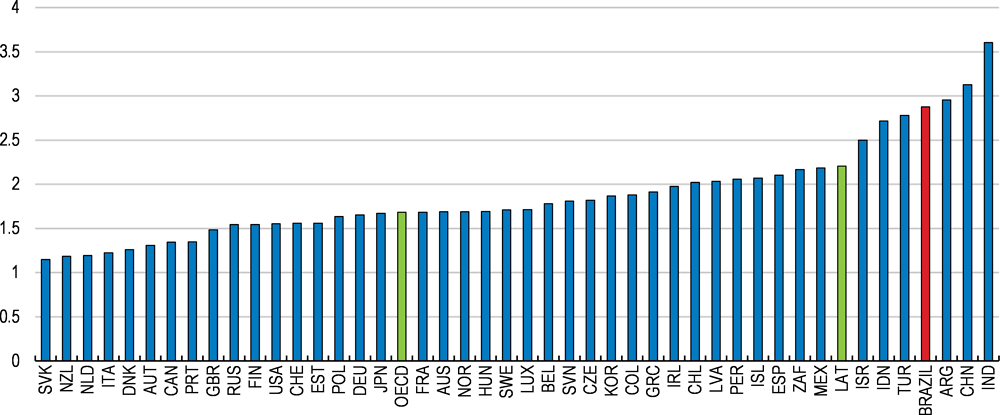
Note: LAT includes Argentina, Chile, Colombia and Mexico. Data for Argentina are for 2016.
Source: OECD Product Market Regulation Indicators, 2013, available at www.oecd.org/eco/pmr.
In infrastructure, reviewing some of the current regulations and practices, particularly in the structuring and preparation of projects before a tender call and at the subnational levels, could raise investment. Due to a lack of technical capacity, some projects have been structured by the same firms (or their subsidiaries) that later submit tenders. This reduces the number of bids received in the tender call, often down to one, and opens the door to anti-competitive behaviour (World Bank, 2016). The capacity for structuring infrastructure projects could be enhanced by providing more training to officials involved in infrastructure structuring. At the same time, the national development bank BNDES has built up substantial technical capacity in structuring projects and particularly state and municipal authorities could make wider use of its expertise.
While Brazil has 20 years of experience using concessions remunerated through user fees, public-private partnerships (PPPs) could serve as an additional tool where user fees are hard to implement. Despite a federal PPP law, there are only few cases so far, mostly involving subnational governments. Unifying policies and processes on how to prioritise, prepare, structure, and conduct bidding for PPPs across jurisdictions could reduce uncertainty and costs for investors (World Bank, 2016). However, in some countries, PPPs have been attractive in the past because the associated future liabilities were not properly recorded in the budget which shows the dangers of using PPPs without an appropriate and transparent accounting framework. As a lesson from these experiences, it is important to incorporate the full budget implications of PPPs over their whole life-cycle into the medium-term budget framework.
A new 2016 investment partnership law has created a new central entity attached directly to the presidency, tasked with selecting and prioritising projects and monitoring their implementation. The coordinating role of this central entity would be similar to the infrastructure planning done for the electricity network. The PPI Secretariat (Secretaria Executiva do Programa de Parcerias de Investimentos) is in line with international best practices and should remain well resourced, both financially and in terms of human resources. Environmental concerns should also be part of infrastructure planning.
Supporting the integration with the region and the world economy
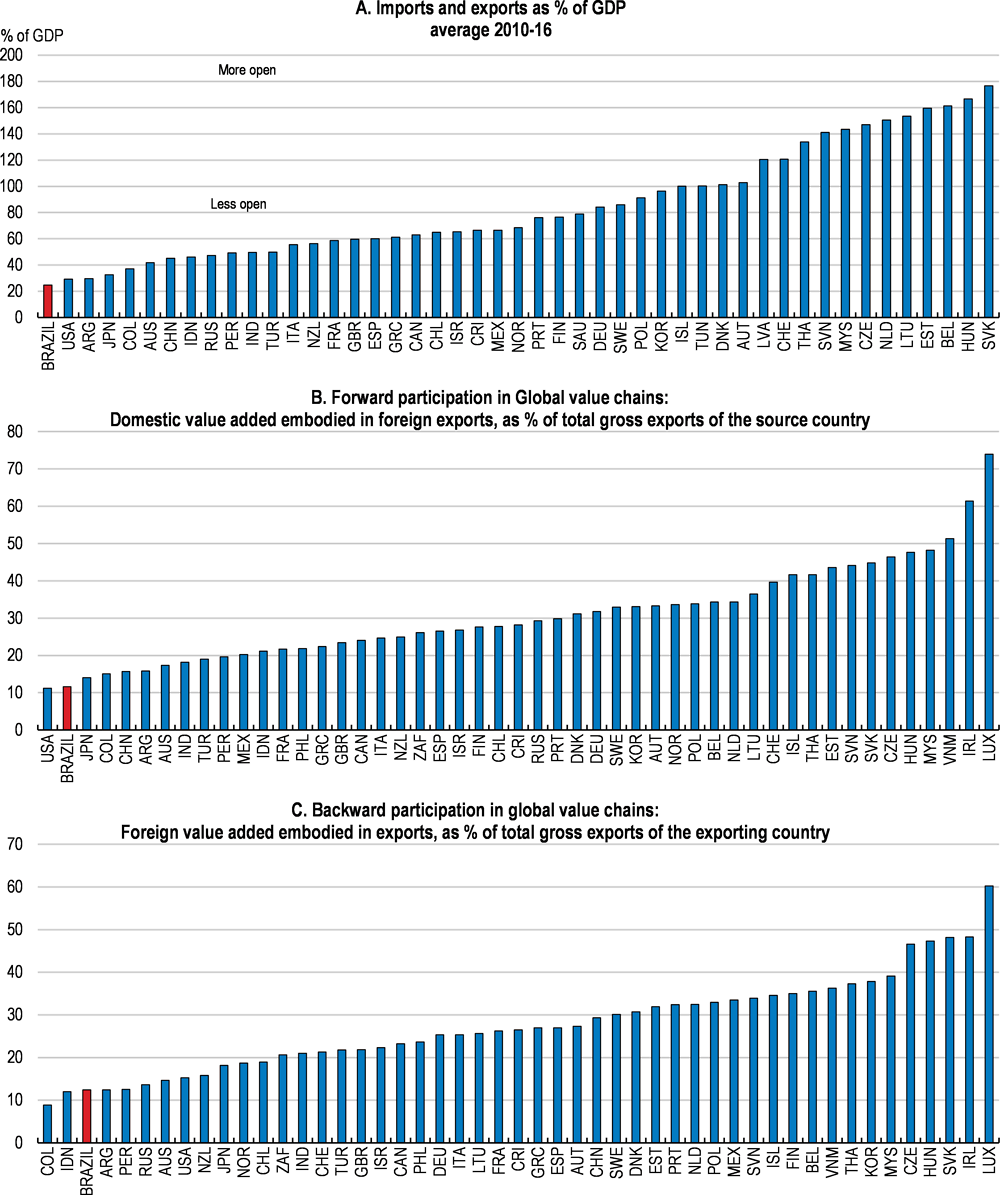
With exports and imports of less than a quarter of GDP, the economy is significantly less integrated into international trade than other emerging market economies of similar size (Figure 25). This reflects several decades of inward oriented policies including a strategy of industrialisation through import substitution. Trading little, Brazil has remained on the side lines of global value chains (GVC), as its exports contain mostly domestic value added and do not feed much into other countries’ exports. Brazil’s only discernible GVC link is with neighbouring Argentina, with no other significant trade link in the region, while many Asian economies are tightly intertwined through their trade relationships, both among themselves and with advanced economies (Figure 26).
The economy is shielded from global opportunities and foreign competition
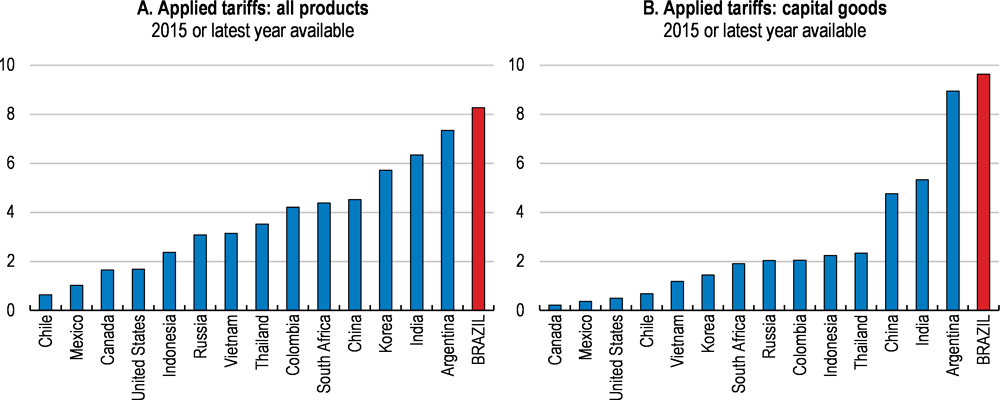
This situation reflects trade barriers of various forms. Average tariffs levels weighted by imports are almost twice as high as in neighbouring Colombia and more than 8 times higher than in Mexico or Chile (Figure 27). Brazil’s most frequently applied tariff rate is 14%, while around 450 tariff lines are at the maximum of 35%, including textiles, apparel and leather and motor vehicles. Effective protection levels due to the cascading effects of tariffs at different levels of the production chain are 26% on average, but range between 40% and 130% for textiles, apparel, and motor vehicles, in ascending order (Castilho and Miranda, 2017). Brazil is the country with the highest number of tariff lines above 10%. In addition to tariffs, various forms of local content requirements are probably adding to the protection of domestic producers and model simulations suggest that they are at the root of significant reductions in imports and exports (Stone et al, 2015).
The high trade barriers preclude Brazil from many of the benefits of an increasingly integrated global economy. Both consumers and companies purchasing intermediate or capital goods are paying markedly higher prices than in other countries. Trade barriers on capital goods tend to be even higher than average tariffs and this may be a good starting point for tariff reductions as the benefits of lower-cost capital goods would spread across the entire economy. A special tax regime is in place to reduce import tariffs on capital goods, but it is applicable only if no equivalent domestic product exists, and Brazil has a sizeable capital goods industry. Brazilian firms use the least of imported inputs among Latin American and emerging market economies, which contributes to low productivity at the firm level (Brambilla et al., 2016).
Source: OECD Economic Outlook database, OECD, TiVA Nowcast Estimates.
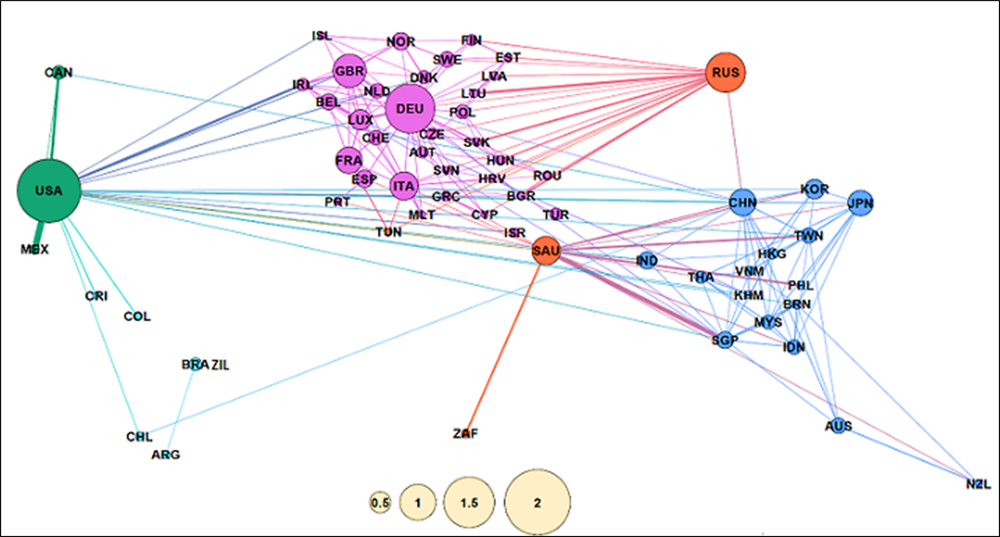
Note: A larger circle reflects an economy that is more connected within global production networks. A line reflects input flows exceeding 2% of total inputs used in the importing or exporting economy.
Source: Criscuolo and Timmins (2017).
Source: World Integrated Trade Solution database (WITS).
Moreover, providing a boost to competition will foster growth and job creation. Opening up would probably be the most effective way to strengthen competitive pressures in many industries. This would also support Brazil’s export performance which has declined by almost 25% over the past 15 years, while Mexico’s export performance has increased by 25%. Given their poor trade integration in general, Brazilian companies have also shown only scant participation in global value chains. In Latin America, Mexico and Chile exemplify how trade and the integration in global value chains can contribute to economic growth and resilience (OECD, 2017b, OECD, 2015c).
A stronger integration into international trade would support growth and social progress
Raising productivity, which has been largely stagnant over the last 15 years, will require embracing global opportunities more fully. The most evident and immediate effects of lower trade barriers are falling import prices for consumers. Estimates suggest that Brazilian consumers could see their purchasing power increase by 8% without trade barriers (Figure 28). Moreover, these benefits are highly progressive as lower income households spend larger shares of their incomes on tradable goods such as food, home appliances, furniture and clothing. A detailed analysis of reducing trade protection, taking into account differences in the consumption basket across households, suggests that the lowest-income decile could gain as much as 15% in terms of additional purchasing power, compared to 6% for the top decile (Arnold et al., 2018). Lower tariffs would therefore bring particular benefits to poor consumers, including women in their role as family providers (UN-IANWGE, 2011). Lowering tariffs would not result in significant fiscal losses as they currently amount to around 0.5% of GDP and the productivity effects of better integration would likely lead to an expansion of activity and additional tax revenues.
With respect to companies and employment, the effects of lowering trade barriers generally combine medium-term benefits with short-term adjustment costs as it triggers resource allocations between sectors and firms, including job losses in some areas and job creation in others. On one hand, firms –just like consumers– gain improved access to intermediate and capital inputs from imports, but also via the reaction of domestic producers to rising competition. Tariff reductions in the 1990s triggered substantial productivity benefits (Lisboa et al., 2010; World Bank, 2018). A recent study concluded that a 1% reduction in tariffs of inputs would increase productivity by around 2% (Gazzoli and Messa, 2017). Similar effects have been found for other countries (Amiti and Konings, 2007; Grossman and Helpman, 1991).
On the other hand, lower trade barriers intensify the competitive pressures that domestic companies face in their own market. As a result, some low-performing firms will lose market share and may eventually be squeezed out of the market. It is precisely this reallocation process that will allow capital and labour to flow to more productive sectors or firms where new and better-paying jobs can be created (Criscuolo et al., 2014). A significant share of productivity growth in advances economies can be attributed to these reallocation effects (Hsieh and Klenow, 2009). For Brazil, estimates suggest potential productivity gains on the order of 40% (Busso et al, 2013).
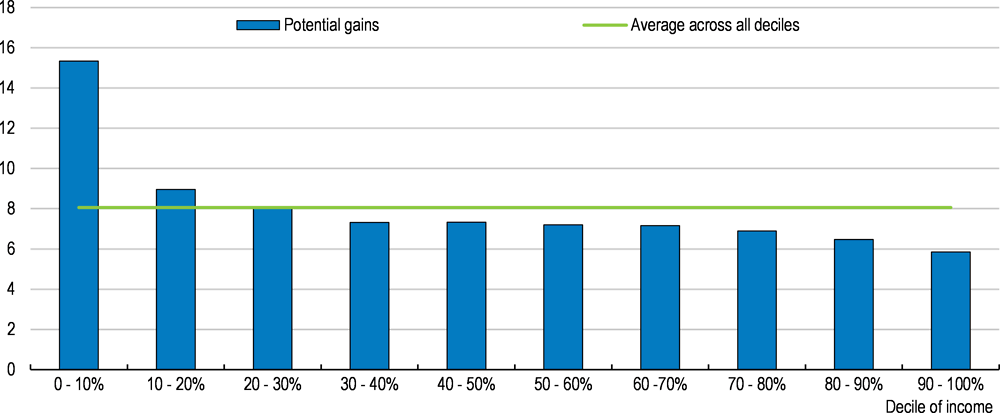
Source: Arnold et al. (2018).
Just as some firms lose domestic market share in the face of stronger integration, others seize newly arising export opportunities, expand and hire new workers. Brazil’s export performance has been weak over the last decade and promoting stronger exports would be a key reason to reduce trade protection (Figure 29). In terms of overall employment, the export effect is likely to dominate, with analytical work suggesting overall employment gains exceeding 1% (Araújo and Flaig, 2017). Moreover, the demand for low-skilled labour would likely rise much more than the return on capital, suggesting that newly arising job opportunities in a more open Brazilian economy would disproportionately help the poor (Harrison et al., 2004). Previous reductions in trade protection were associated with an increase in female employment (Gaddis and Pieters, 2012), in line with international evidence suggesting that women benefit particularly from job opportunities arising in the context of stronger integration (UNCTAD, 2009). Jobs created in exporting firms are also more likely to be formal and to pay better, as Brazilian exporters pay 51% higher wages than non-exporters (Brambilla et al., 2016).
Opening up to the world economy tends to have pro-poor effects in emerging market economies (Artuc et al, 2017; Porto, 2006). However, for some workers, reallocations will involve the need to search for a new job. Brazil has high job turnover rates with a third of manufacturing employees changing jobs within one year (Assunção et al., 2017; DIEESE, 2014). This is partly due to incentives arising from the FGTS unemployment insurance scheme. Hence, more firm turnover in the adjustment period is probably a manageable burden for those who find new employment in the same sector. However, when entire sectors contract and workers have to learn new skills, the adjustment costs may be more substantial. Empirical analysis using exogenous variation in exchange rates to proxy changes in effective trade protection suggests that this would only affect a very limited number of sectors, including clothing and textiles, machinery and metal products, while all other sectors are likely to hold up well to more cost-competitive foreign competitors (Arnold et al., 2018). Model-based simulations by Messa (2017) also point to contractionary effects only for the clothing and leather sectors. For other sectors, the effect is either small or positive.
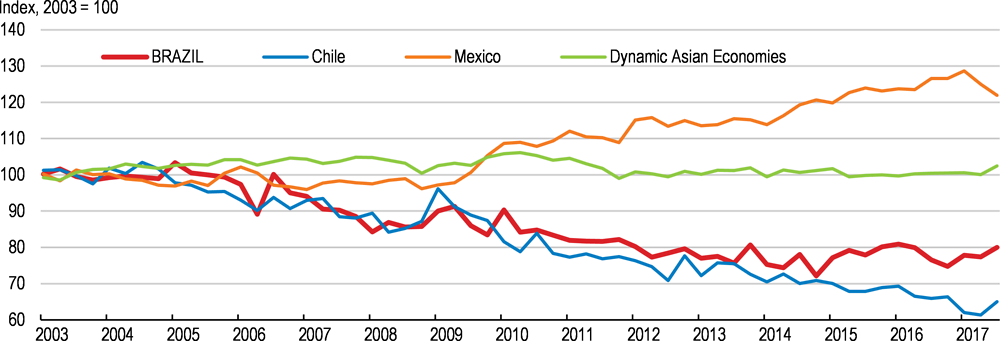
Note: Export performance is measured as actual growth in exports relative to the growth of the country’s export market, which represents the potential export growth for a country assuming that its market shares remain unchanged.
Source: OECD Economic Outlook database.
For affected workers, active labour market policies can go a long way to reduce the burden of adjustment. Such policies, whose focus should be on protecting workers rather than on protecting jobs, economic sectors or firms, can help workers move across sectors through training, job search assistance and activation measures (World Bank, 2013; Flanagan and Khor, 2012). While overall spending on active labour market policies is close to the OECD average, the composition of this spending is very much focused on supporting self-employment and employment subsidies (Figure 30). These programmes are often less effective in increasing the future employability of participants (Brown and Koettl, 2015). In the same vein, the effect of employment subsidies tends to be short-lived. Thus, shifting spending towards those schemes that support the acquisition of new skills, such as training, would better support that Brazilians get ready for the new jobs that will be created. Training can help workers to get ready for new jobs in expanding sectors, and even enhance their chances of accessing better paying jobs. Programmes to retrain workers so that they get new skills and ready for new jobs in other sectors are only starting to be deployed, but should become a priority. Parallel to this, a strong social safety net can protect incomes during unemployment spells (see discussion above).
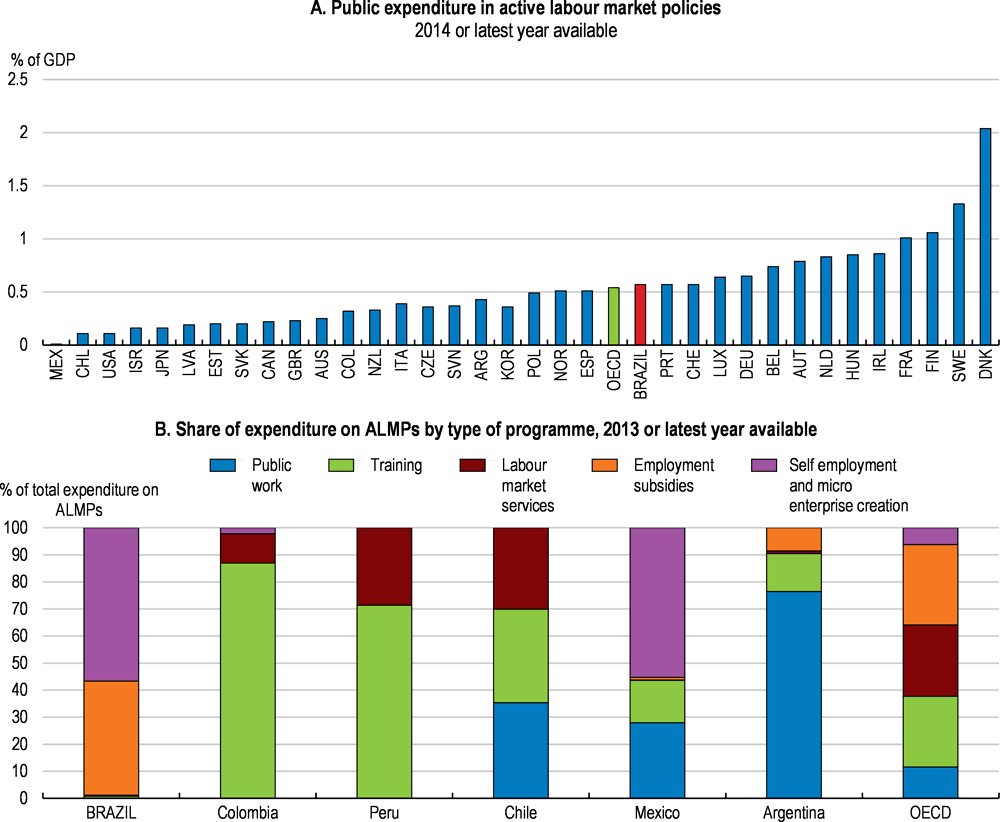
Source: OECD Public expenditure and participant stocks on LMP database; ILO; and ILO (2016) "What works. Active labour market policies in Latin America and the Caribbean."
Additional policy efforts on training will also help to ensure that the benefits from integration reach youths or women, both of which are characterised by below-average labour market attachment (Figure 31). Active labour market policies with a strong training component can be effective in reducing gender inequalities, as evidence suggests that women tend to benefit more from them (Bergemann and van den Berg, 2007). Brazil’s youth unemployment rate of 27% is high in international comparison, and keeping youths attached to the labour market is essential to avoid scarring effects and social exclusion later in life. Skill acquisition is a key factor determining the impact of trade on the economic opportunities of women and youths (UN-IANWGE, 2011).
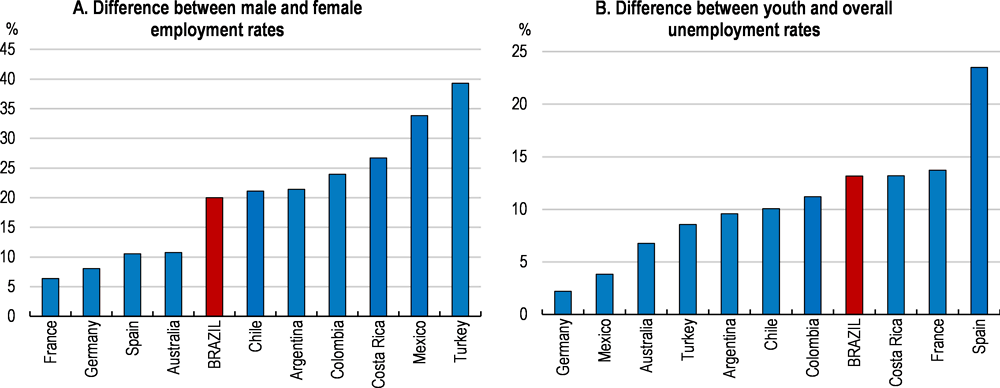
Note: Data in Panel A refer to 2015, data in Panel B to 2016.
Source: OECDstat, ILOStat.
Policy options for strengthening integration
Defining a concrete policy agenda for integration requires thinking about the right sequencing and the role of international trade negotiations. On the former, it is tempting to argue that domestic policy reforms to strengthen the competitiveness of Brazilian companies should precede stronger integration. Despite ample scope for improvements, in practice this argument is likely to block any progress in the nearer term. Given the low growth prospects in the absence of structural reforms, Brazil cannot afford to hold its breath for a political consensus on all domestic reform agendas to arise. Instead, a gradual but credible reduction of trade barriers should be announced without further ado, which would still give domestic companies time to adapt. Ongoing efforts to improve the business environment would also help in the transition to a more open economy.
A similar question arises with respect to leveraging trade opening to negotiate better market access with trading partners. Brazil is a member of the MERCOSUL customs union, which has helped to strengthen trade linkages with other members of the trade bloc, in particular Argentina. At the same time, the exchange of goods and services with the rest of the region is weak (IMF, 2017c). Regional integration could be supported by negotiations with other trade blocs and countries in the region such as the Pacific Alliance or Mexico. Besides lowering tariff barriers, which in the case of Brazil are on average significantly lower for vis-à-vis countries in the region than those outside, a convergence of trade rules and regulatory standards could also play a significant role. Finally, weak connectivity among countries due to geographic factors and low investment in infrastructure has been identified as key reasons behind Latin America’s relatively low intra-regional trade integration. This highlights the importance of progress on the quality of transport infrastructure, the efficiency of customs management and the quality of logistic services (IMF, 2017c).
Beyond South America, a tighter integration with large foreign markets would have strong potential to deliver a significant boost in competition and access to intermediate goods. At present, Brazil has bilateral agreements with only about 10% of world GDP, while Peru and Chile have trade agreements covering about 70-80% of world GDP. Negotiations such as those currently underway between Mercosul and the European Union/EFTA are important initiatives in which Brazil should play a leading role, taking advantage of the window of opportunity presented by recent policy efforts in Argentina to foster a greater integration into the global economy.
At the same time, the sometimes glacial pace of trade negotiations suggests to make unilateral advances alongside bilateral negotiations according to a gradual, pre-announced schedule on both tariffs and local content rules, which should be phased out without delay. Many Asian countries pursued a strategy of liberalising unilaterally in addition to regional and bilateral agreements, with tariffs often reduced for the purpose of attracting investment (Baldwin, 2006).
Green growth challenges
Brazil has made substantial progress in reducing its greenhouse gas emissions and is on track for meeting its reduction target by 2020, corresponding to a 40% reduction vis-à-vis a 1990 business as usual scenario. Most of this reduction has come from a decrease in deforestation of 82% in the decade leading up to 2014 (Figure 32). Reasons behind the progress include the fact that significant surfaces have been granted protection and stronger law enforcement following the implementation of the new 2012 forest code, enforced by satellite imagery.
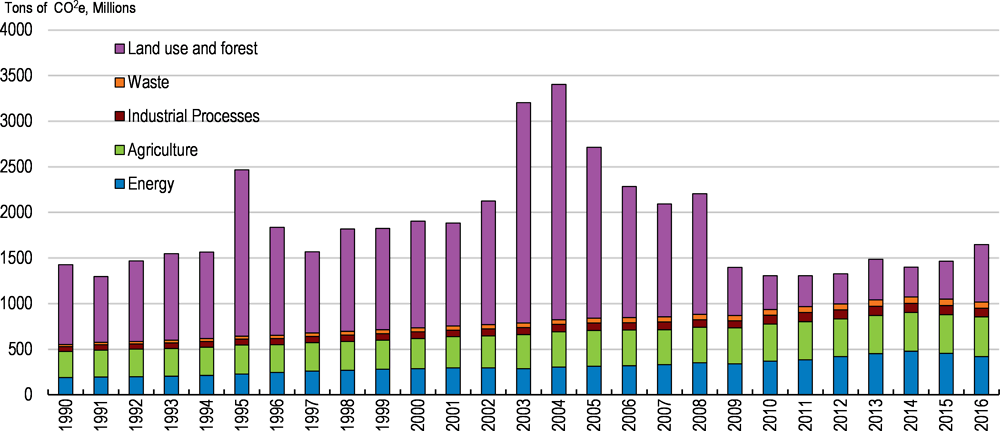
Source: Observatório do Clima (SEEG), http://plataforma.seeg.eco.br/total_emission.
Latest data, however, show annual increases of 24% and 29% in 2015 and 2016, respectively, which may be temporary as the enforcement budget has recently been restored (Figure 33). Nonetheless, a clearer definition of current environmental priorities would be useful. This should also include a clear commitment not to reduce those areas currently under environmental protection. The biodiversity of Brazil’s natural resources, including the Amazon rain forest, hold significant opportunities and potential to spur economic growth and social inclusion in what are currently economically lagging regions. A sustainable use of these natural assets is crucial for helping people in these regions to fulfil their productive potential. This includes people of indigenous origin who depend on the natural environment for their livelihoods and whose lifestyles are dependent on the preservation of Brazil’s natural habitats. Tapping more extensively into green finance could allow the financing of investments that generate environmental benefits.
Contrary to emissions from deforestation, energy-related and agricultural emissions have risen steadily as the economy, and particularly the agricultural sector, expanded. The composition of energy sources is favourable, however, with 44% of energy supply coming from renewable sources in 2015, compared to 9% in OECD countries (EPE, 2017). 62% of electricity comes from hydroelectric sources. Energy use from transport is on the rise in line with a growing vehicle fleet, but 17% of the fuel consumption consists of ethanol from sugar cane. This is the highest share of biofuel consumption worldwide and most passenger vehicles currently sold in Brazil can use either ethanol or gasoline (OECD, 2015d; OECD, 2015e). Taxes on fossil fuels have risen in line with previous OECD recommendations (Table 7). However, they are still low by international standards (Figure 34) and raising them further could strengthen incentives for biofuel use. Taxes on Diesel fuel should be raised at a minimum to the level of petrol as there is no environmental justification for lower taxes on Diesel (Harding, 2014). Higher fossil fuel taxes could help to reverse the recent increase in the CO2 intensity of the economy (Figure 35). Raising these taxes would also make growth more inclusive, as affluent households tend to consume more fossil fuels while the poor are most exposed to the negative health effects from air pollution.
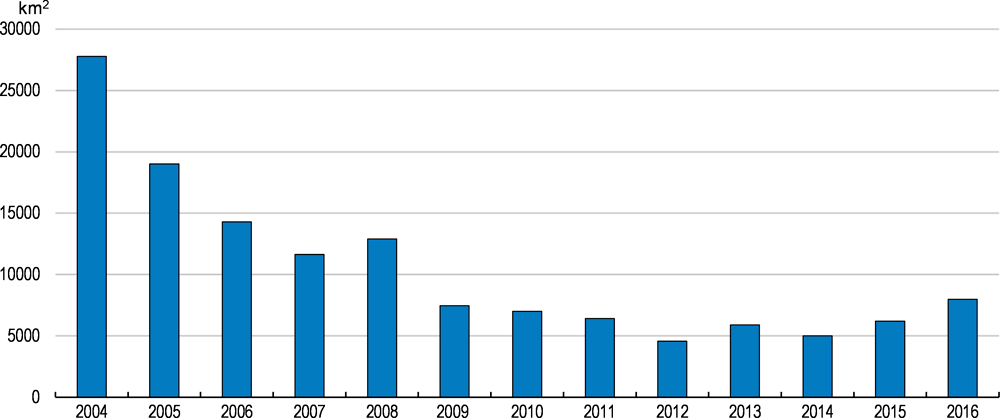
Source: Instituto Nacional de Pesquisas Espaciais, http://www.obt.inpe.br/prodes/index.php
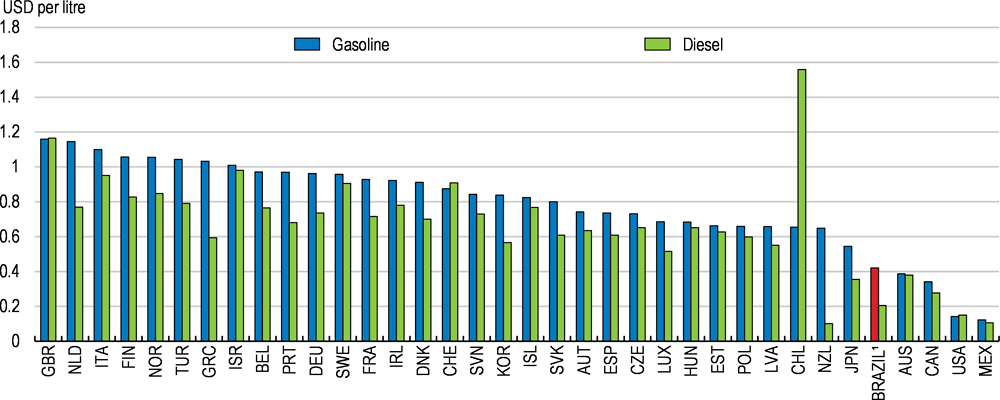
1. Brazil data pertain to 2016.
Source: OECD Tax Database, Petrobras.
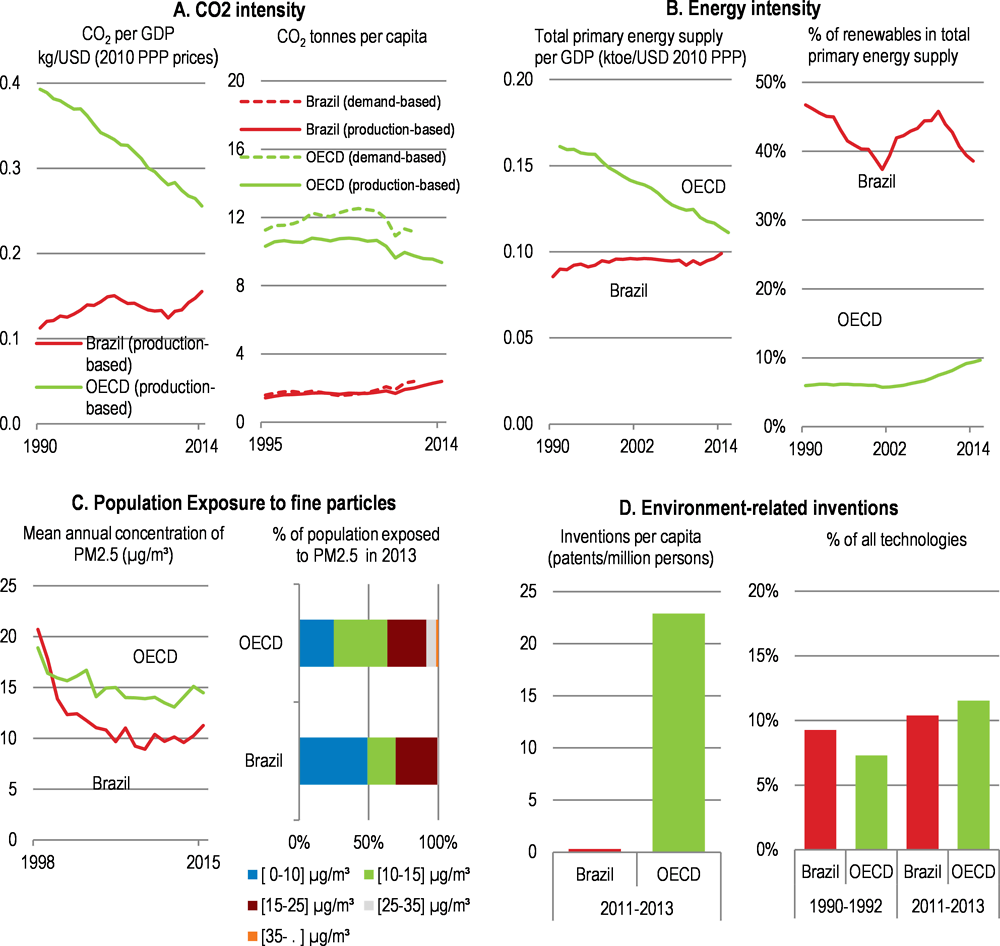
Source: OECD (2017), Green Growth Indicators, OECD Environment Statistics database; OECD National Accounts (database); IEA (2017), IEA World Energy Statistics and Balances database; OECD (2017) National Accounts database; OECD (2017), Exposure to air pollution, OECD Environment Statistics database; OECD (2017), Patents: Technology development, OECD Environment Statistics database.
Bibliography
Acemoglu, D., S. Johnson and J. Robinson (2005), "Institutions as a fundamental cause of long-run growth", Aghion, P. and S. Durlauf (eds.) Handbook of Economic Growth, Volume IA, Elsevier Publishing.
Amiti, M. and J. Konings ( 2007), "Trade Liberalization, Intermediate Inputs, and Productivity: Evidence from Indonesia," American Economic Review, 97(5).
Andrews, D., M. Adalet McGowan and V. Millot (2017), “The Walking Dead? Zombie Firms and Productivity Performance in OECD Countries”, OECD Economics Department Working Papers No 1372, OECD Publishing, Paris.
Araújo, S. and D. Flaig (2017), "Trade Restrictions in Brazil: Who Pays the Price?", Journal of Economic Integration 32(2).
Arnold, J., A. Gonzalez-Pandiella and M. Bueno (2018), "Much to gain and little pain: Evaluating economic effects of a stronger integration into the global economy in Brazil", OECD Economics Department Working Papers, forthcoming, OECD Publishing, Paris.
Arnold, J. and M. Bueno (2018), "Raising the effectiveness of social transfers in Brazil", OECD Economics Department Working Papers, forthcoming, OECD Publishing, Paris.
Arnold, J. and L. Flach (2018), "Structural reforms to boost productivity in Brazil: Empirical findings from firm-level data", OECD Economics Department Working Papers, forthcoming, OECD Publishing, Paris.
Artuc, E.,G. Porto and B. Rijkers (2017). “Trading-off the Income Gains and the Inequality Costs of Trade Policy," mimeo.
Assunção, J., R. Cayres Pinto and G. Gonzaga (2017), "Tenure-dependent firing costs and turnover in Brazil", mimeo, Department of Economics, PUC-RIO, Rio de Janeiro.
Azevedo Sodré, A., M. F. Colaço Alves (2010), "Relação entre Emendas Parlamentares e Corrupção Municipal no Brasil: Estudo dos Relatórios do Programa de Fiscalização da Controladoria-Geral da União", Revista de Administração Contemporânea 14 (3), pp. 414-433.
Baldwin, Richard, 2006, “Multilateralising Regionalism: Spaghetti Bowls as Building Blocs on the Path to Global Free Trade,” The World Economy 29(11), pp. 1451-1518.
BCB (2015), Relatório de Inclusão Financeira, Nº3–2015, Central Bank of Brazil, Brasília. Available at http://www.bcb.gov.br/Nor/relincfin/RIF2015EN.pdf.
BCB (2017), Financial Stability Report, Central Bank of Brazil, Bras;ilia, April 2017, Available at http://www.bcb.gov.br/?RELESTAB .
Bergemann, A. and G.van den Berg (2007), “Active Labour Market Policy Effects for Women in Europe - A Survey”, IZA Discussion Papers No. 2365, IZA - Institute of Labor Economics, Bonn, Germany.
Bersch, K., S. Praça and M. Taylor (2017) “State Capacity, Bureaucratic Politicization, and Corruption in the Brazilian State,” Governance 30(1), pp.105-124.
BNDES (2017), “A indústria, o PSI, o BNDES e algumas propostas”, Textos para discussão, No. 114, Rio de Janeiro, https://web.bndes.gov.br/bib/jspui/handle/1408/11534.
Boas, T., F. Hidalgo and N. Richardson (2014), "The Spoils of Victory: Campaign Donations and Government Contracts in Brazil", The Journal of Politics, Vol. 76, No. 2, April 2014, Pp. 415–429.
Bonomo, M., R. Brito and B. Martins (2014), “Macroeconomic and Financial Consequences of the After Crisis Government-Driven Credit Expansion in Brazil”, Working Paper Series, no. 378, Central Bank of Brazil, Brasilia.
Brambilla, I., N. Depetris Chauvin and G. Porto (2016), “Examining the Export Wage Premium in Developing Countries”, Review of International Economics, https://doi.org/10.1111/roie.12231.
Brown, A. J. G. and J. Koettl (2015), “Active labor market programs - employment gain or fiscal drain?”, IZA Journal of Labor Economics, 4(12).
Busso, M., L. Madrigal and C. Pagés (2013), "Productivity and resource misallocation in Latin America," The B.E. Journal of Macroeconomics, De Gruyter, 13(1), pp. 1-30.
Castilho, M. and P. Miranda (2017), "Tarifa aduaneira como instrumento de política industrial: A evolução da estrutura de proteção tarifária no Brasil no período 2004-2014", Messa A. and I. Machado (eds), Política Comercial Brasileira em Análise, IPEA, Brasilia.
Castro, F. A. (2014), “Imposto de Renda da Pessoa Física: comparações internacionais, medidas de progressividade e redistribuição”, Master Thesis, University of Brasilia, Brasilia.
CEMEC (2017), “Recuperar poupança do setor público para retomar o crescimento. Investimento e poupança na economia brasileira: 2000-2016” ", Centro de Estudos de Mercado de Capitais Nota, 6/2017, Instituto Brasileiro de Mercado de Capitais – IBMEC, Rio de Janeiro, http://ibmec.org.br/instituto/wp-content/uploads/2014/10/NOTA-CEMEC-03-DESAFIO-RECUPERAR-POUPAN%C3%87A-DO-SETOR-PUBLICO.pdf
CNI (2014), Custo tributário dos investimentos: as desvantagens do Brasil e as ações para mudar, Confederação Nacional da Indústria , Brasilia.
CNJ (2016), “Justicia em Numeros: ano-base 2015”, Conselho Nacional de Justiça, Brasília, www.cnj.jus.br/files/conteudo/arquivo/2016/10/b8f46be3dbbff344931a933579915488.pdf.
Criscuolo, C., P. N. Gal and C. Menon (2014), “The Dynamics of Employment Growth: New Evidence from 18 Countries”, OECD Science, Technology and Industry Policy Papers, No. 14, OECD Publishing, Paris, https://doi.org/10.1787/5jz417hj6hg6-en.
Criscuolo, C. and J. Timmis (2017), "The changing structure of GVCs: Are central hubs key for productivity?", 2017 Conference of the Global Forum on Productivity, Budapest, https://www.oecd.org/global-forum-productivity/events/Changing_structure_of_gvcs.pdf.
Da Ros, L. (2015), "O custo da Justiça no Brasil: uma análise comparativa exploratória", Observatório de Elites Políticas e Sociais do Brasil, Version 2, No. 9, Universidade Federal do Paraná and Núcleo de Pesquisa em Sociologia Política Brasileira, http://observatory-elites.org/wp-content/uploads/2012/06/newsletter-Observatorio-v.-2-n.-9.pdf.
DIEESE (2014), Os números da Rotatividade no Brasil: um olhar sobre os dados da RAIS 2002-2013, Departamento Intersindical de Estatística e Estudos Socioeconómicos São Paulo, http://www.dieese.org.br/notaaimprensa/2014/numerosRotatividadeBrasil.pdf.
Egert, B. (2017), “The quantification of structural reforms: extending the framework to emerging market economies”, March 2017, OECD Economics Department, No. 1442, , OECD Publishing, Paris. Available at: https://doi.org/10.1787/f0a6fdcb-en
EPE (2017), "Relatório Síntese do Balanço Energético Nacional", Empresa de Pesquisa Energética, http://ben.epe.gov.br/default.aspx.
Estevão, M. and I. de Carvalho Filho (2012), “Institutions, Informality, and Wage Flexibility: Evidence from Brazil”. IMF Working Paper. WP/12/84.
Flanagan, R. J. and N. Khor (2012), “Policy Priorities for International Trade and Jobs”, Policy Priorities for International Trade and Jobs, OECD, Lippoldt D. (ed.), OECD Publishing, Paris.
Gaddis, I and J. Pieters (2012), “Trade Liberalization and Female Labor Force Participation: Evidence from Brazil”, IZA Discussion Papers No. 6809, IZA - Institute of Labor Economics, Bonn, Germany.
Gazzoli, E.L. and A. Messa (2017), “Impacto das tarifas dos insumos sobre a produtividade das firmas brasileiras”, in: Messa, A. and T. Machado (eds.), A Política Comercial Brasileira em Análise, IPEA, Brasilia.
Gomez de Castro, P., E.A Fernandes and A. Carvalho Campos (2013), “The determinants of foreign direct investment in Brazil and Mexico: an empirical analysis”, Procedia Economics and Finance, 5, pp. 231-240.
Grossman, G. and E. Helpman (1991), Innovation and Growth in the Global Economy, Cambridge, MIT Press.
Hammond, G. (2012), "State of the art of inflation targeting", Handbook No. 29, Centre for Central Banking Studies, Bank of England, London.
Harding, M. (2014), “The Diesel Differential: Differences in the Tax Treatment of Gasoline and Diesel for Road Use”, OECD Taxation Working Papers, No. 21, OECD Publishing, Paris, https://doi.org/10.1787/5jz14cd7hk6b-en.
Harrison, G.W., T.F. Rutherford, D. Tarr, and A. Gurgel (2004), “Trade Policy and Poverty Reduction in Brazil”, The World Bank Economic Review, Vol. 18, No. 3, pp. 289-317.
Hsieh, C. and P. Klenow (2009), "Misallocation and Manufacturing TFP in China and India", The Quarterly Journal of Economics, 124(4).
IBGE (2017), Tabela 5947 - Pessoas de 14 anos ou mais de idade, ocupadas na semana de referência, por contribuição para instituto de previdência em qualquer trabalho, available at http://www.sidra.ibge.gov.br/tabela/5947
IEDI (2011), Uma Comparação Entre a Agenda de Inovação da China e do Brasil, Instituto de Estudos para o Desenvolvimento Industrial .
IEDI (2014), A Reorientação do Desenvolvimento Industrial, Instituto de Estudos para o Desenvolvimento Industrial.
IFI (2017a), Relatório de Acompanhamento Fiscal, Instituição Fiscal Independente, March 2017, https://www12.senado.leg.br/ifi/publicacoes-ifi.
IFI (2017b), Relatório de Acompanhamento Fiscal, Instituição Fiscal Independente May 2017, https://www12.senado.leg.br/ifi/publicacoes-ifi.
IFI (2017c), Relatório de Acompanhamento Fiscal, Instituição Fiscal Independente, July 2017, https://www12.senado.leg.br/ifi/publicacoes-ifi.
IFI (2017d), Relatório de Acompanhamento Fiscal, Instituição Fiscal Independente, December 2017, https://www12.senado.leg.br/ifi/publicacoes-ifi. ILO (2014), "Policies for the formalization of micro and small enterprises in Brazil", Notes on Policies for the Formalization of Micro and small enterprises, Regional Office for Latin America and the Caribbean, ILO.
IMF (2017a), "Brazil: 2017 Article IV Consultation-Press Release; Staff Report; and Statement by the Executive Director for Brazil", International Monetary Fund, IMF Country Report No. 17/215, Washington, DC.
IMF (2017b), "Brazil: Fiscal Transparency Evaluation", International Monetary Fund, IMF Country Report No. 17/104, Washington, DC.
IMF (2017c), “Cluster report - Trade integration in Latin America and the Caribbean”, IMF Country Report No. 17/66, Washington, DC.
Lisboa, M. B., N. A. Menezes Filhoz and A. Schor (2010), “The Effects of Trade Liberalization on Productivity Growth in Brazil: Competition or Technology?” Revista Brasileira de Economia 64(3), pp. 277–89, available at https://doi.org/10.1590/S0034-71402010000300004 .
Messa, A. (2017), “Impacto de Políticas de Exigência de Conteúdo Local: o Caso do Programa Inovar-Auto”, in: Messa, A. and T. Machado (eds.), A Política Comercial Brasileira em Análise, IPEA, Brasilia.
Mohallem, M. and C. Ragazzo, (2017), "Diagnóstico institucional: primeiros passos para um plano nacional anticorrupção", DIREITO RIO - CJUS: Livros, Fundação Getúlio Vargas, Rio de Janeiro, http://hdl.handle.net/10438/18167 .
Monteiro, J. and J. Assunção (2012), "Coming out of the shadows? Estimating the impact of bureaucracy simplification and tax cut on formality in Brazilian microenterprises", Journal of Development Economics 99(1).
OECD (2010a), Competition Assessment Toolkit, version 2, OECD Publishing, Paris, http://www.oecd.org/competition/assessment-toolkit.htm .
OECD (2010b), Collusion and Corruption in Public Procurement, OECD Publishing Paris.
OECD (2012a), Latin American Network on Corporate Governance of State-Owned Enterprises (SOEs), Background Note, 2012 meeting of the Latin American Network on Corporate Governance of State-Owned Enterprises.
OECD (2012b), Recommendation of the OECD Council on Fighting Bid Rigging in Public Procurement, http://www.oecd.org/daf/competition/RecommendationOnFightingBidRigging2012.pdf .
OECD (2012c)," Closing the gender gap: Brazil", OECD Publishing, Paris.
OECD (2014), Fighting corruption and promoting competition, OECD Publishing, Paris.
OECD (2015a), Pensions at a glance, OECD Publishing, Paris.
OECD (2015b), OECD Guidelines on Corporate Governance of State-Owned Enterprises, OECD Publishing, Paris.
OECD (2015c), Measuring Trade in Value Added: An OECD-WTO joint initiative, Database, oe.cd/tiva, last accessed July 2015.
OECD (2015d), OECD Environmental Performance Review: Brazil, OECD Publishing, Paris.
OECD (2015e), Taxing Energy Use in the OECD and Key Partner and Associate Countries, OECD Publishing, Paris.
OECD (2015f), PISA 2015 Results (Volume I): Excellence and Equity in Education, OECD Publishing, Paris.
OECD (2015g), OECD Economic Survey of Brazil 2015, OECD Publishing, Paris.
OECD (2015h), National Strategies for Financial Education, OECD/INFE Policy Handbook, OECD Publishing, Paris.
OECD (2016a), Committing to Effective Whistleblower Protection, OECD Publishing, Paris.
OECD (2016b), Low-Performing Students: Why They Fall Behind and How To Help Them Succeed, OECD Publishing, Paris. https://doi.org/10.1787/9789264250246-en.
OECD (2016c), Committing to Effective Whistleblower Protection, OECD Publishing, Paris.
https://doi.org/10.1787/9789264252639-en.
OECD (2016d), Financing Democracy: Funding of Political Parties and Election Campaigns and the Risk of Policy Capture, OECD Publishing, Paris. https://doi.org/10.1787/9789264249455-en.
OECD (2016e), The Productivity-Inclusiveness Nexus: Preliminary version, OECD Publishing, Paris.
https://doi.org/10.1787/9789264258303-en .
OECD (2017a), "Pension Reform in Brazil, OECD Policy Memo", April 2017, https://www.oecd.org/brazil/reforming-brazil-pension-system-april-2017-oecd-policy-memo.pdf.
OECD (2017b), “How to make trade work for all”, OECD Economic Outlook, Volume 2017 Issue 1, OECD Publishing, Paris.
OECD (2017c)," International VAT/GST Guidelines", OECD Publishing, Paris. https://doi.org/10.1787/9789264271401-en.
OECD (2017d), OECD Economic Survey of India, OECD Publishing, Paris.
OECD (2017e)," Brazil: Follow-up to the Phase 3 report & recommendations", OECD Directorate for http://www.oecd.org/corruption/anti-bribery/Brazil-Phase-3-Written-Follow-Up-Report-ENG.pdf.
Penfold, M. et al., (2013), “Regulating Foreign Direct Investment in Latin America”, Development Bank of Lation America, World Bank, http://scioteca.caf.com/handle/123456789/701 .
Pinheiro, M. C. (2013), “Inovação no Brasil: panorama geral, diagnóstico e sugestões de política” in: F. A. A. Veloso, L.V. Pereira and Z. Bingwen (org.), Armadilha da renda média: visões do Brasil e da China, Vol. 1, p. 81-106, FGV, Rio de Janeiro.
Piza, C. (2016), "Revisiting the impact of the Brazilian SIMPLES program on firms' formalization rates", Policy Research working paper, no. WPS 7605, Impact Evaluation series, Washington, D.C., http://documents.worldbank.org/curated/en/901421467995383598/Revisiting-the-impact-of-the-Brazilian-SIMPLES-program-on-firms-formalization-rates.
Porto, G. G. (2006)," Using survey data to assess the distributional effects of trade policy", Journal of International Economics, 70(1), 140-160.
Ribeiro, E. (2016), "Brazil Financial Intermediation Costs and Credit Allocation", Discussion Paper (draft), Finance & Markets Global Practice, World Bank, Washington, DC.
Segura-Ubiergo, A. (2012)," The Puzzle of Brazil's High Interest Rates", IMF Working Paper No. 12/62, Washington, DC.
Silva, J.; R. Almeida and Victoria Strokova (2015), “Sustaining Employment and Wage Gains in Brazil - A Skills and Jobs Agenda”, Directions in Development, Washington, DC. Available at https://doi.org/10.1596/978-1-4648-0644-5
Stone, S., J. Messent and D. Flaig (2015), "Emerging Policy Issues: Localisation Barriers to Trade", OECD Trade Policy Papers, No. 180, OECD Publishing, Paris.
Transparency International (2016), Corruption Perception Index 2016, Transparency International, Berlin, Germany, www.transparency.org/cpi2016 .
UNCTAD (2009), Mainstreaming gender in trade policy, Note by the UNCTAD secretariat, http://www.unctad.org/en/docs/ciem2d2_en.pdf.
UN-IANWGE (2011), Gender Equality & Trade Policy, United Nations Inter-Agency Network on Women and Gender Equality , Resource Paper, www.un.org/womenwatch/feature/trade/ .
World Bank (2013), World Development Report 2013, World Bank, Washington, D.C.
World Bank (2014), Enterprise Surveys, World Bank Group, Washington D.C., http://www.enterprisesurveys.org/data/exploreeconomies/2009/brazil.
World Bank (2016), Brazil Systematic Country Diagnostic: Retaking the path to Inclusion, Growth and Sustainability, World Bank, Washington, D.C.
World Bank (2017), Um ajuste justo – Análise da eficiência e equidade do gasto público no Brasil, Volume I: Síntese, November 2017.
World Bank (2018)," Growth and jobs: Brazil’s productivity agenda", Forthcoming.
WTO (2017) "Brazil — Certain Measures Concerning Taxation and Charges", WTO Panel Reports DS472 and DS497, http://www.wto.org/english/tratop_e/dispu_e/472_497r_e.pdf.