Chapter 2. Making growth more inclusive in Argentina
Commodity-led growth and strengthened social policies reversed the sharp increase in poverty that took place in the aftermath of the 2001 economic crisis. Well-being and living conditions further improved during the first decade of the millennium. However, between 2011 and 2015, increasingly inconsistent economic policies led to zero growth and threatened gains in well-being as well as additional reductions in poverty and inequality. Poverty still affects one-third of the population and eliminating it remains the priority. Besides that, one out of five Argentinians have moved out of poverty but were unable to join the middle class. This emerging socio-economic group faces substantial vulnerabilities, such as low labour income, insufficient skills, informal employment and poor access to quality public services, which put them at risk of falling into poverty. The situation requires embarking on a second generation of social policies that combine long-term poverty alleviation programmes with further support for these citizens to sustain poverty reduction over time and develop human capital. This chapter discusses a comprehensive policy package that would rebuild the social contract in Argentina. This includes improving the efficiency, targeting and progressivity of transfers and taxes, strengthening public services across regions, increasing education quality and providing incentives to promote better quality jobs, particularly by lowering labour costs, to protect the vulnerable and contribute to sustainable inclusive growth.
Commodity-led economic growth and expanded social policies served as powerful instruments for reducing poverty, increasing equality and improving the quality of life in Argentina during 2003-11. As family earnings improved, the middle class surpassed the number of poor people, which had increased both in the 1990s and especially around the economic crisis of 2001. On average, these middle-class individuals are more educated than those less well off. They also are more likely to participate in the labour force, especially women, and work in formal sector jobs (Ferreira et al., 2013). These achievements came under threat after 2011 due to increasingly inconsistent economic policies that led to zero growth.
One third of Argentinians are poor, representing the country’s main social challenge. Additionally, between them and the middle class lies an emerging group of people who make enough not to be considered poor but who lack the middle class’ economic security. This group, making up one-fifth of the population, faces substantial vulnerabilities, such as low labour income, insufficient skills, informal employment and poor access to quality public services, which put them at risk of falling into poverty. Supporting this group of people at risk of falling into poverty through social policies, and especially through incentives, is essential for further consolidating the poverty reduction gains of the previous decade, ensuring that the middle class continues expanding, raising productivity, and ultimately promoting greater equality of income, wealth and well-being in the long term.
The chapter begins with an overview of income and poverty patterns in the past decades, before going on to examine the main drivers of inequality and poverty in Argentina. Particularly, it looks at the role of income redistribution, education and skills, and job quality with a focus on regional differences. Assessing these drivers is key to strong, sustainable and inclusive growth that improves the lives of all Argentinians.
Reducing poverty, improving equity and strengthening the middle class
Poverty and inequality have declined but remain high
Poverty has fallen considerably since 2003, experiencing as slight upturn since 2013 (Figure 2.1, Panel A). Estimates produced by the Centro de Estudios Distributivos Laborales y Sociales (CEDLAS) at the Universidad Nacional de La Plata based on the Encuesta Permanente de Hogares (EPH) and the national poverty line suggest that poverty (i.e. the share of people living on sufficient income to afford a set of basic goods) has been almost cut in half since 2003 to 30.3% of the population and to 21.5% of the households (CEDLAS, 2017a). This decline in poverty implies that almost 9 million Argentinians escaped poverty since 2003, returning to poverty levels similar to those in the early nineties. Likewise, extreme poverty (indigence) fell by one-third to 6.1%. Analysing only the extremes of the period 2003 to 2016 as well as not comparing it to other countries in the region does not provide a full picture of what happened (see Box 2.1). Building the foundations for a long and uninterrupted period of growth is a precondition for raising living standards and reducing inequality. However, the benefits for the population at large will depend crucially on the nature of this growth and how its fruits are shared.
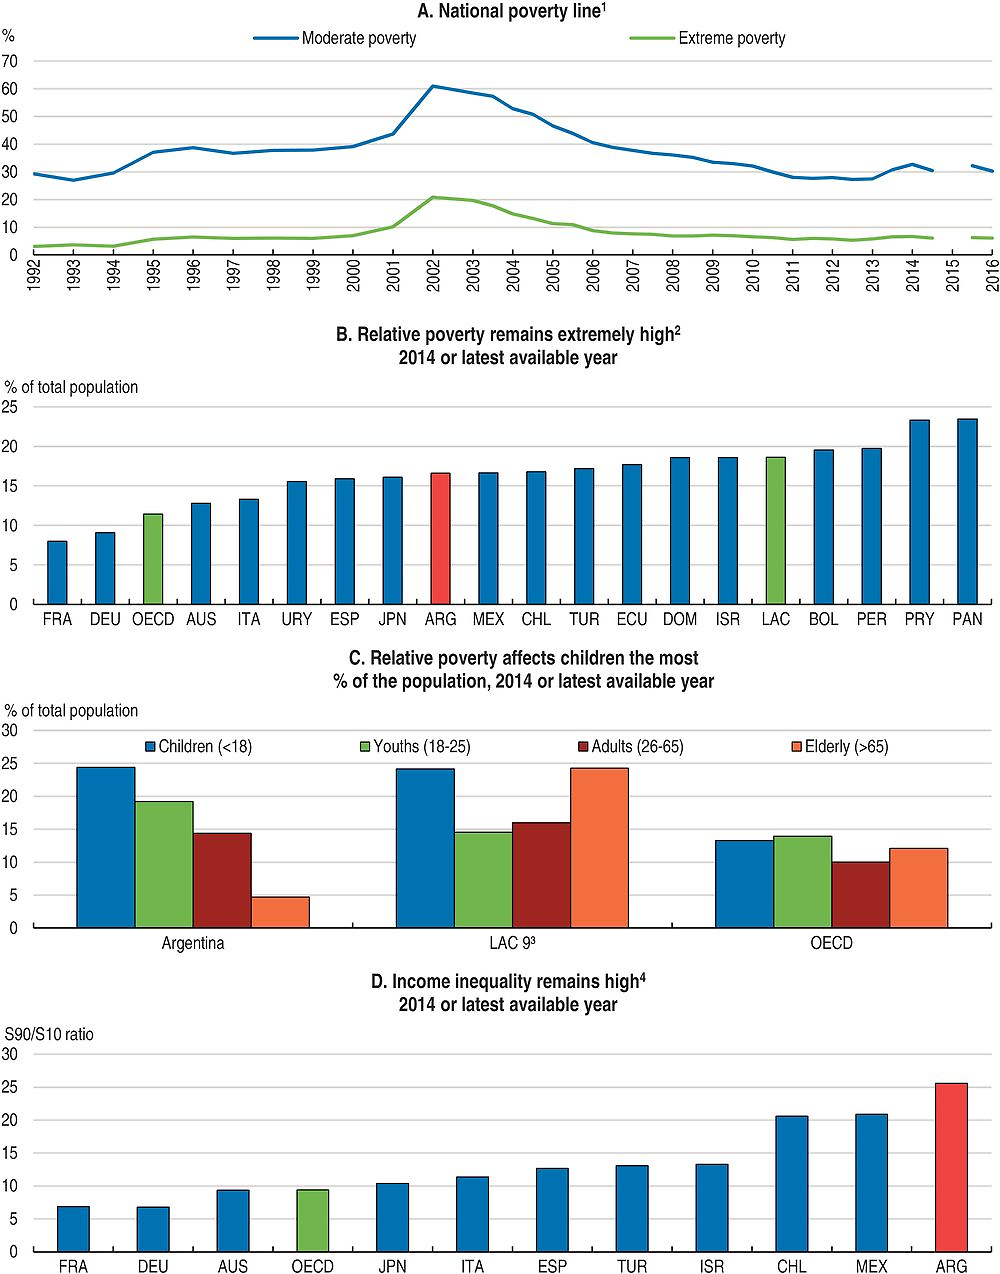
1. The series is estimated by CEDLAS using the Permanent Household Survey (EPH), the official price index till 2006 and the Buenos Aires City price index for 2007-15. Poverty lines are calculated on the basis of the current methodology used by the INDEC. The first semester of 2016 only includes the second quarter 2016. No data were collected for the second semester of 2015.
2. Relative poverty rates after taxes and transfers (threshold of 50% of the median income). Data for Argentina are from the third quarter of 2016 and are representative of urban centres of more than 100 000 inhabitants.
3. Data for Argentina are from the third quarter of 2016 and are representative of urban centres of more than 100 000 inhabitants. LAC 9: Argentina, Bolivia, Chile, Dominican Republic, Ecuador, Mexico, Peru, Paraguay and Panama.
4. The S90/S10 ratio is the ratio of disposable income of the 10% of people with highest disposable income to that of the poorest 10%.
Source: CEDLAS (2017a), Encuesta Permanente de Hogares (EPH) for the third quarter of 2016 (INDEC), OECD Income Distribution Database (2016), and OECD estimates based on CEDLAS country micro data.
International poverty lines are the standard for cross-country poverty comparisons due to their simplicity and despite their technical limitations. Although crucial for harmonising data across countries and time as well as adjusting poverty lines locally, international poverty lines are overly sensitive to measurements of PPP exchange rates and domestic consumer price indexes. This is especially true for countries with high inflation and a volatile exchange rate such as Argentina. Moreover, PPP exchange rates are calculated based on average national prices and might be unsuitable for assessing the income levels of the most poor (Deaton, 2006 and Deaton and Dupriez, 2011).
Given these caveats, poverty in Argentina -both defined as the share of the population living on less than USD 4 PPP a day (World Bank Latin America international threshold; Ferreira et al., 2013) and as the share of the population living on less than USD 9.8 PPP (international threshold for Argentina’s national poverty line; CEDLAC, 2017b) – declined dramatically between 2003 and 2006, after rising sharply with the 2001 crisis (Figure 2.2).

Note: Data for Argentina are from 2016 and are representative of urban centres of more than 100 000 inhabitants.
Source: CEDLAS (2017b)
Overall, the reduction of the share of population living on less than 9.8 USD PPP a day in Argentina followed a slower pace than the regional average during the last decade. While in Argentina the share of this population dropped by 9.3 percentage points, the share fell by an average of 12.7 points across Latin American countries and 17.2 points across South America countries. Only El Salvador, Guatemala, Honduras and Mexico experienced slower performance than Argentina during this period (CEDLAS, 2017b).
Yet, two clearly distinct stages can be identified in Argentina’s poverty reduction path from 2006 to 2015, with the turning point in 2011 (Figure 2.2). First, from 2006 to 2011, the share of the population living on less than 9.8 USD PPP a day declined on par with regional levels. In fact, the share of this population dropped by 11.5 percentage points in Argentina, similar to the South American country average of 12.7 percentage points and the Latin American country average of 8.2 percentage points. Second, from 2011 to 2015, social progress decelerated in Argentina but was sustained across most countries in the region. Whereas in Argentina the share of the population living on less than USD 9.8 PPP dropped by only 2.2 percentage points from 2011 to 2015, the share of this population shrank by about 4.5 percentage points on average in both Latin American and South America countries. The only country performing worse than Argentina during this period was Honduras (CEDLAS, 2017b).
The less well-off households benefited the most from Argentina’s recent period of growth (2003-11). Poverty can decline as a result of growth: if growth affects all people equally, then relative poverty would remain stable while absolute poverty decreases. Poverty can also decline as a result of changes in the distribution of income amongst people. In Argentina’s case, both phenomena happened at the same time. As the country experienced a period of growth, the income of the households at the bottom of the income distribution grew significantly faster than those at the top of the income distribution between 2003 and 2008, albeit starting from low income levels, contributing to the reduction of poverty and inequality (Figure 2.3). However, as of 2009, annual average per capita household income growth was negative for households above the 5th percentile of the income distribution threatening the gains of the previous period.

1. Data are representative of urban centres of more than 100 000 inhabitants.
Source: Encuesta Permanente de Hogares (EPH) for the third quarter of 2016, and EPH for the third quarter of 2008 and EPH for the third quarter of 2003 (INDEC).
Relative poverty (i.e. households with incomes less than half of median incomes) in Argentina decreased by almost 7 percentage points between 2000 and 2016, placing the country below the average of the region but still above OECD countries (Figure 2.1, Panel B). Almost 17% of Argentinians are poor as defined by the OECD definition relative poverty, with children among the most affected, rather than the elderly as in the case in most Latin American countries (Figure 2.1, Panel C).The gap between the trends in absolute and relative poverty measures can be clarified by untangling the effects of growth and distribution on poverty. While the income of the poor grew faster than that of the richer, it is still significantly lower than the median of the population.
Despite these advances, income inequality remains high. The Gini coefficient of disposable income inequality in Argentina was 0.46 in 2016 (Figure 2.4) (World Bank, 2017). Income inequality in Argentina increased both in the 1990s and after the debt crisis in 2001, and then subsequently declined. The Gini coefficient has dropped 7.5 percentage points since 2003. This decrease is around the average for Latin American countries (Tsounta and Osueke, 2014). Still, the ratio of disposable income of the 10% of people with highest disposable income to that of the poorest 10% places Argentina slightly above other Latin American countries and significantly above OECD countries (Figure 2.1, Panel D).
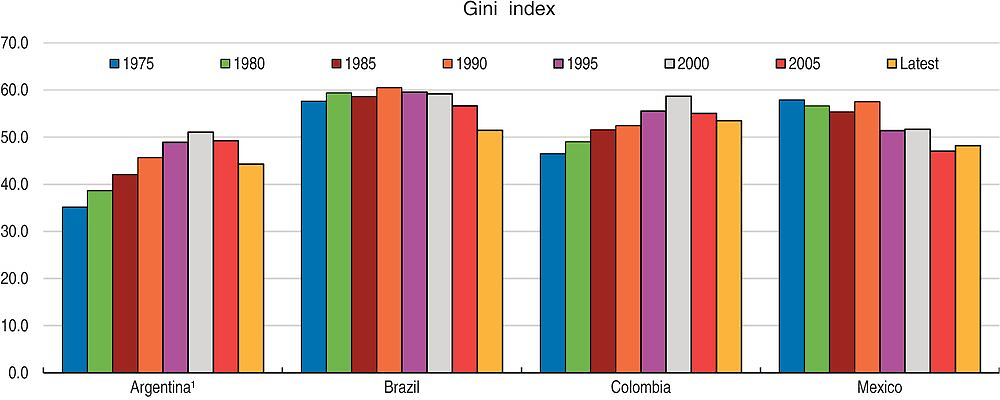
1. Latest data for Argentina are for 2016 and are representative of urban centres of more than 100.000 inhabitants. Latest data for Brazil, Colombia and Mexico are for 2014.
Source: Encuesta Permanente de Hogares (EPH) for the third quarter of 2016 (INDEC) and World Bank World Development Indicators database.
As household incomes increased, especially for poor families, and inequality edged downward, Argentina’s middle class grew from less than 2 out of ten Argentinians in 2003 to more than four out of ten Argentinians in 2016 (INDEC, 2003; INDEC, 2016). The middle class is defined as the population living in households with a daily per capita income between USD 15 PPP and USD 50 PPP. This definition is based on the notion of economic security (i.e. having enough income to absolve socks and formal job). Today, 19 million people live in middle-class households (Figure 2.5). As a result, Argentina is third to Chile and Uruguay in the size of its middle class and among the few countries of the Latin American region where most people belong to the middle class (CEDLAS and the World Bank, 2014).

Note: Data are representative of urban centres of more than 100 000 inhabitants. Socio-economic classes are defined using the following classification: “Poor” = individuals with a daily per capita income of USD 9.8 or lower. “Population at risk of falling into poverty” = individuals with a daily per capita income of USD 9.8-15. “Middle class” = individuals with a daily per capita income of USD 15-50. “Affluent”: individuals with a daily per capita income higher than USD 50. Poverty lines and incomes are expressed in 2011 USD PPP per day (PPP = purchasing power parity).
Source: Encuesta Permanente de Hogares (EPH) for the second and third quarter of 2016.
Still, most of the poor who moved up did not join the middle class but rather joined a group in between the poor and the middle class (“vulnerable” according to Ferreira et al., 2013). These are individuals living in households with a daily per capita income between USD 9.8 PPP (equivalent to Argentina’s national poverty line – CEDLAS, 2017b) and USD 15 PPP, which exposes them to a relative probability of experiencing spells of poverty in the future. This report will call them “at risk of falling into poverty”. One out of five people in Argentina stand right above the poverty line, but are at risk of falling into poverty owing to substantial vulnerabilities, such as low labour income, insufficient skills, informal employment and poor access to quality public services. Supporting this vulnerable population is key for the welfare and growth of the country as a whole. Any risk of changes in income may constrain households and decrease their investments in productive assets and in human capital. Such risk could also force households to diversify their income sources even at the cost of lower returns.
Territorial inequalities challenge inclusive growth
Improvements in living standards and reductions in inequality and poverty levels over the past decade have not benefited all provinces equally. Regional disparities are high, with poverty rates above 40% in the Northern provinces (Figure 2.6, Panel A). Disparities within and among provinces and cities are large (OECD, 2016a), particularly in the City of Buenos Aires and its metropolitan area (Gran Buenos Aires) (Figure 2.6, Panel B). The causes are complex. High inequalities among provinces and cities relate to high informality rates, lack of quality jobs, low skills and poor public services.

1. Data correspond to the amplified version of the Human Development Index (HDI).
Source: Encuesta Permanente de Hogares (EPH) for the third quarter of 2016 (INDEC) and UNDP (2014), Argentina National Development Report 2013.
In terms of well-being, and particularly material and living conditions, a great divergence is observed between provinces. The performance of the City of Buenos Aires on the Human Development Index is far above the national average, while provinces such as San Juan, Catamarca, Chaco, Corrientes, Santiago del Estero and Formosa do not perform so well (UNDP, 2014) (Figure 2.6, Panel C). Likewise, almost a quarter of the population of Santiago del Estero, Chaco, Salta and Formosa had unmet basic needs (UBN Index) compared with only 6% in the province of La Pampa and 7% in the City of Buenos Aires (INDEC, 2010a).
Access to public infrastructure and public service provision of water, sanitation, electricity, education and health care differ substantially across provinces, contributing to discrepancies in well-being. For example, people living in the Northern provinces have a larger risk of not having access to drinkable water in their dwellings than people living in the southern provinces or the City of Buenos Aires. The most recently available data from the 2010 census show that in the provinces of Misiones and Chaco only 19% and 26% of households, respectively, had access to improved sanitation facilities, compared to 98% in the City of Buenos Aires (INDEC, 2010b).
Taxes and transfers reduce inequalities
Taxes and transfers play a significant role in shaping the income distribution in Argentina. Income inequality and poverty would be higher without redistribution through taxes and transfers. The Commitment to Equity Institute (CEQ) analysis shows that the impact of direct taxes and direct transfers combined has an equalising income effect and reduces poverty. Under a scenario where contributory pensions are considered direct government transfers, direct taxes and transfers reduce the Gini index by 15.4 percentage points. This reduction is higher than in other Latin American countries with similar pre-tax levels of inequality and similar the OECD average (Figure 2.7).
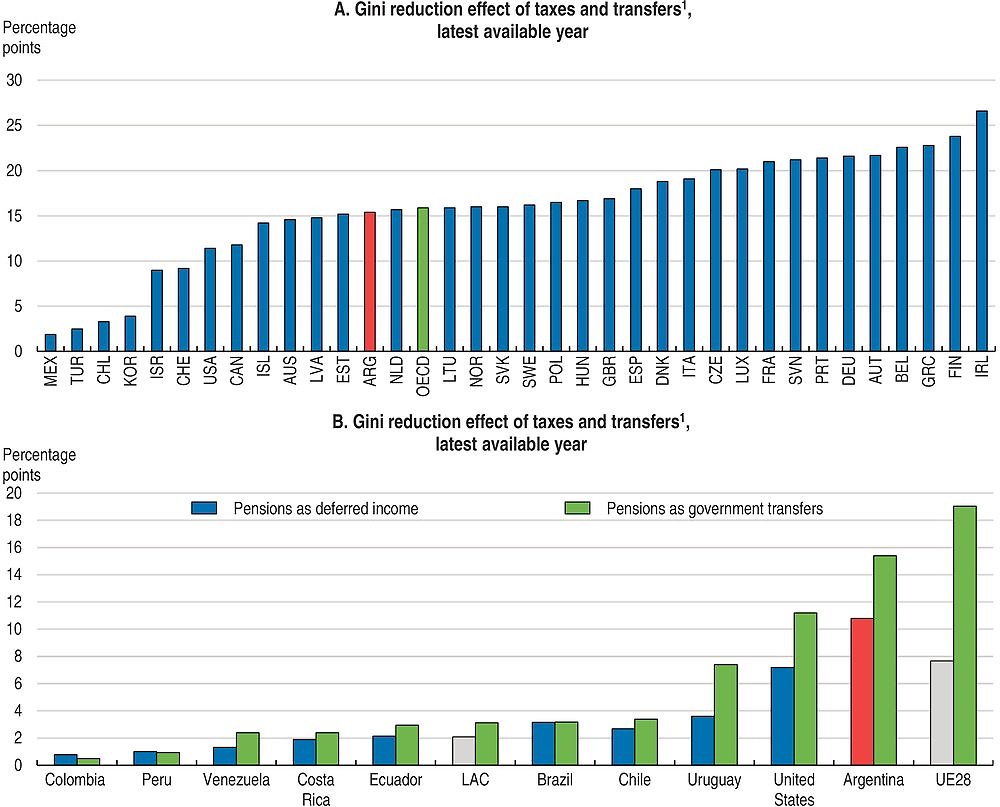
1. Data for Argentina are representative of urban centres of more than 100.000 inhabitants.
Source: OECD Income Distribution Database, OECD calculations based on the Encuesta Permanente de Hogares (EPH) for the third quarter of 2016 (INDEC), and Lustig (2017).
Most of this impact on inequality is explained by transfers rather than taxes. More than two thirds of the Gini reduction can be attributed to direct transfers. Most direct cash transfers are progressive in absolute terms, since they benefit the less well-off households. After direct transfers, the income Gini declines 10.8 percentage points. A large share of this reduction comes from the contributory pension and the effectively non-contributory pension introduced by the Moratoria Previsional (Social Security Moratorium) (Annex: Table 1). Likewise, direct taxes are progressive, especially the Personal Income Tax that is only paid by the richest 10% of the population, as are social security contributions if they are borne by the employee. Direct taxes decrease the Gini coefficient by 4.6 percentage points.
The redistributive effect of taxes and transfers is highly concentrated amongst the lowest and highest deciles, and not on the population at risk of falling into poverty. The highest decile of the market income distribution is the one that bears the highest proportion of direct taxes. Conversely, the lowest market income deciles receive the highest proportion of transfers. The effect is exceptionally high for the lowest deciles of income distribution when pensions are considered a government transfer. This impact is markedly higher than if pensions are considered differed market income (Annex: Table 2). As a result, after government intervention, the first decile receives a net government transfer of 7.4% of total disposable income (they concentrated no income before the intervention), and the richest decile concentrates 25.7% of total disposable income (compared to 39.1% before the intervention). In contrast, the effects of taxes and transfers amount to between 1 and 5 percentage points of total disposable income in the lower-middle part of the income distribution (i.e. the 2nd to 5th lowest deciles). In other words, redistributive effects are very large for the lowest income decile, but relatively small for households at risk of falling into poverty.
The redistributive effects of transfers are much milder when pensions are treated as deferred market income. After direct transfers, the income Gini declines 6.4 percentage points, while direct taxes decrease the Gini coefficient by 4.4 percentage points. Moreover, although the lowest market income deciles receive the highest proportion of transfers, after government intervention, the first decile only concentrates 3.2% of total disposable income (compared to 0.4% before the intervention), and the richest decile concentrates 27.1% of total disposable income (compared to 35.3% before the intervention) (Annex: Table 2). The effects of taxes and transfers amount to between 0.7 and 1.6 percentage points of total disposable income in the lower-middle part of the income distribution (i.e. the 2nd to 5th lowest deciles). Although the redistributive effects of transfers are much milder when pensions are treated as deferred market income, the overall results are similar to the scenario where pensions are considered a government transfer: redistribution is large for the lowest income decile, but relatively small for households at risk of falling into poverty.
Conversely, indirect taxes tend to increase moderate poverty. Transfers received compensate the effect of indirect taxes paid only for the lowest decile, while the opposite is the case for all other deciles. The CEQ analysis of indirect taxes shows that the three lowest market income deciles pay a higher proportion of their market income in taxes than the rest deciles. Moreover, low-income consumers, except for the first decile, pay more in indirect taxes than what they receive in direct subsidies other than pensions (Rossignolo, 2016).
Improving the sustainability of redistribution policies
The sustainability of social policies (both social assistance and insurance programs) is key for continuing poverty and inequality reduction in Argentina. Public spending increased from 27% of GDP in 2007 to almost 41% in 2015 (IMF, 2017). A large portion of the spending increase was the result of three policies: the Moratoria Previsional (Social Security Moratorium) adopted in 2005 to promote a special pension subsidy regime designed to include workers who had insufficient years of contributions into the pension system; the Educational Financing Law adopted in 2006 that increased education spending to 6% of GDP, and the creation of the Asignación Universal por Hijo (AUH) in 2009 that extended the family benefits allowance to the children of non-registered workers and the unemployed. Moreover, in 2016 the AUH was extended, pensions were adjusted to current prices through the Reparación Histórica a Jubilados y Pensionados law sanctioned in June and the Pensión Universal para el Adulto Mayor (social pension) was created, all of them expanding Argentina’s social public spending. Additionally, strengthening active labour market policies, and possibly unemployment benefits, may require further increases in social spending.
Social protection programmes, subsidies and transfers can be rendered more efficient by creating a true social protection system with shared tools and registries. Social protection in Argentina has a large number of policies and programmes offered both at national and provincial levels by the Administración Nacional de la Seguridad Social (ANSES – National Social Security Agency), Ministry of Education, Ministry of Social Development, Ministry of Labour, Employment and Social Security, and Ministry of Health. Integrating and co-ordinating the provision of services could significantly increase the effectiveness of social protection and the efficiency of social spending (World Bank, 2015). The creation of shared targeting instruments for multiple programmes, such as a unique social registry and one-stop processing centres for social benefits, should make Argentina’s social protection system more efficient by reducing programme duplicity, lowering administrative costs, and simplifying the bureaucracy burden and payments.
Likewise, room for improvement exists in targeting indirect subsidies on transportation, electricity, water and gas. With a few exceptions, transportation, electricity, water and gas subsidies benefit the most affluent since spending is evenly distributed among poor and rich households. As a result, the richest households receive a higher benefit in absolute terms than low-income individuals transferring a significant portion of fiscal resources to the non-poor (Puig and Salinardi, 2015). As such, room remains to reduce subsidies, while protecting the poor and those at risk of falling into poverty that rely heavily on these subsidies.
Additionally, a pension reform is needed to increase pension adequacy and fiscal sustainability. The pension system, which combines contributory and non-contributory elements, significantly reduces inequality and poverty. Even before the introduction of the non-contribution pension (PUAM) for all people aged 65 and above, whose benefits are set at 80% of the minimum contributory pension benefit in 2016, the pension system was effective in reducing old-age poverty by around 35 percentage points, to a level of 5% (Rofman and Apella, 2014). In the contributory system, 70% of beneficiaries get the minimum pension of approximately 80% of the minimum wage and 54% of the average wage. Benefits are capped at around six times the minimum wage. Replacement rates, which link benefits to the last wage, are about 72% for an average wage, compared with an OECD average of 53%. The effective retirement age is 66 years for men and 63 years for women, which is broadly in line with current practice in OECD countries. Pension expenditures currently amount to around 8% of GDP, which is high for a country with Argentina’s age profile. They are expected to rise to around 12% of GDP by 2050 (OECD, 2015c).
In terms of coverage, the starting point is relatively solid with high coverage rates both in the active (contributors) and passive (pensioners) sides. Policies to protect old-age vulnerability compensate for extensive informality, especially among women. In combination with the PUAM, Argentina’s pension system has achieved almost universal coverage.
However, demographic developments, combined with high informality rates, will raise long-term sustainability issues for the pension system. A package revising the level of benefits and retirement age, incorporating incentives for formality especially for the middle and lower-middle classes, and reinforcing the institutions and rules governing the recently implemented non-contributory pensions would be a step forward.
Pension benefits are comparatively high relative to working age earnings. Adjustments to the highly complex formula by which pension benefits are calculated (called movilidad) will be necessary to ensure the sustainability of the system in the longer run, as the current formula effectively passes on all productivity gains of current working generations to retirees (IMF, 2016). OECD countries typically adjust pension benefits by consumer prices, wages or a mixture of the two. In light of demographic developments and high replacement rates, a prudent choice for Argentina would be to adjust pension benefits by consumer prices, preserving the real purchasing power of pensioners. Aligning the retirement age of women, currently at 60, with that of men, at 65, would also lead to savings and is in line with current trends among OECD countries. Estimates suggest that a combination of indexing to consumer prices and raising women’s retirement age to 65 would be sufficient to close the actuarial deficit of 40% of GDP expected over the next 50 years (IMF, 2016).
Potential for cost savings without parametric changes to the system as a whole could be found in a set of special pension regimes (cajas especiales). These regimes cover pensions for around 10-30% of beneficiaries, including the justice system, some public banks and provincial health services. They accord lower retirement ages and higher benefits. For those beneficiaries of the special pension regimes who are sufficiently far away from retirement, the conditions could be brought in line with the general pension system.
Creating better jobs to improve productivity and equity
Many working-age Argentinians encounter labour-market difficulties. Employability barriers are related to insufficient work-related capabilities, lack of financial incentives to look for a job (such as low potential pay and bad quality jobs) and scarce job opportunities.
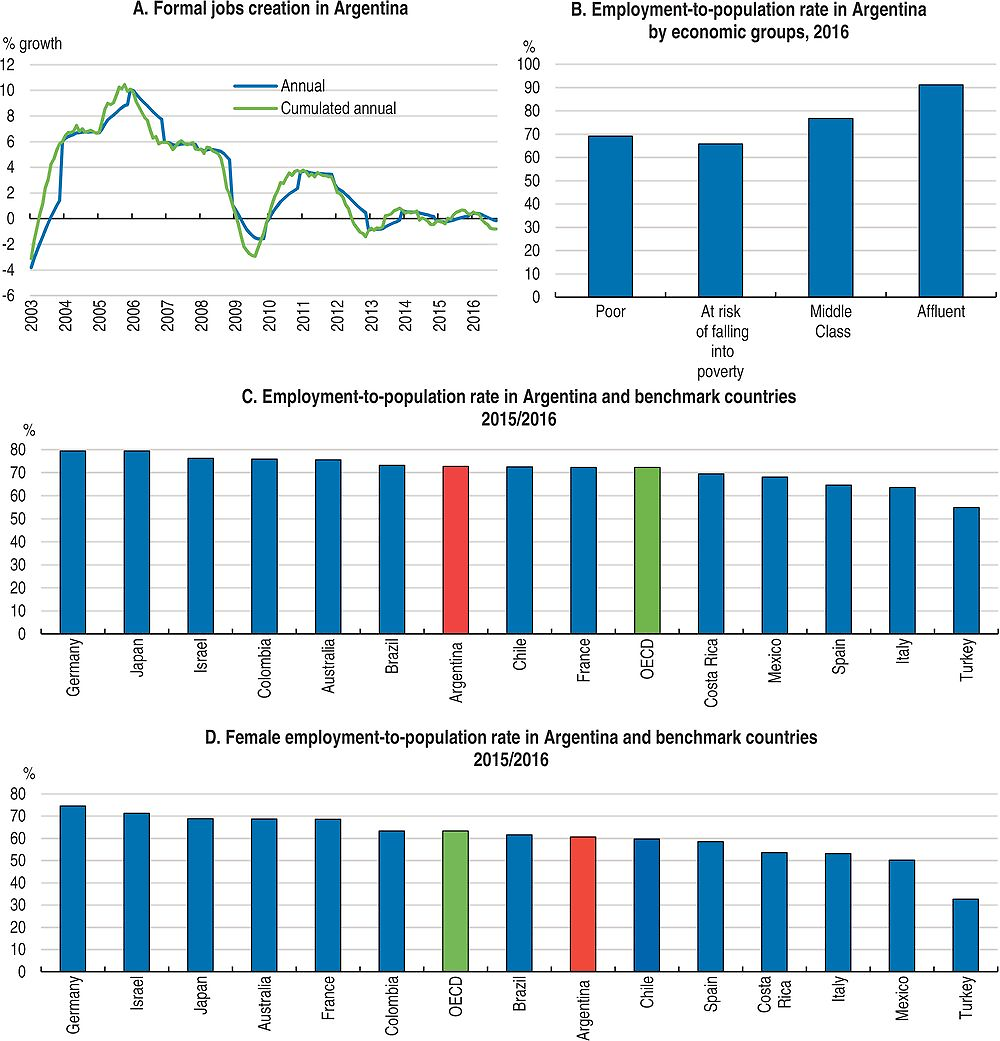
Note: In Panel C and Panel D data for Argentina are for 2016 and for Brazil are for 2014. Data for Argentina are representative of urban centres of more than 100 000 inhabitants.
Source: Ministry of Labour, Employment and Social Security 2016), OECD (LFS - Sex and Age Indicators), Encuesta Permanente de Hogares (EPH) for the third quarter of 2016 (INDEC) for Argentina.
Improving job quality, reducing informality and increasing employment levels, especially for women and youth, remain key challenges (Battistón et al., 2014). Additionally, a recurrent problem is the lack of appropriate educational and professional skills. More than half of the out-of-work have not completed secondary education (compared with 35% of the working population), highlighting the need for skills upgrading (CEDLAS, 2016).
The economic slowdown cut short the period of rising formal employment creation which began in 2004 and continued, with the exception of 2009, until 2012. Argentina’s employment rate slightly decreased from 2013 to 2016, down to 72.7% from 73.7% (population aged 25 to 64) as a result of weakening labour demand and the subsequent drop in the number of new, salaried jobs created (Ministry of Labour, Employment and Social Security, 2016; ECLAC/ILO, 2016). Since 2012, the low job creation (Figure 2.8, Panel A) has been driven mainly by the public sector where employment grew on average by 4.2% per year compared with the formal private sector where it only grew by 0.5% annually (Ministry of Labour, Employment and Social Security, 2016). This slowdown is also reflected in the rising unemployment rate (9.2% in the first quarter of 2017).Yet employment has been rising since mid-2016 and is expected to improve further.
Argentina needs a comprehensive policy package to make its labour market more inclusive. First, it should put in place policies to facilitate the acquisition of skills for the large share of low-skilled workers. Second, it should implement policies supporting youth and women to participate in the labour market. And third, it should improve incentives for employers and workers to stay in or move to the formal economy. Although informality serves as an important source of jobs and livelihood for many, it hampers productivity, growth and equity (Binell, 2016; Amarante and Arim, 2015a; Maurizio, 2014; Gasparini et al., 2014).
Participation rates are low, especially for youth and women
The scarcity of employment opportunities is one of the obstacles to making the labour market more inclusive, displaying significant variations across income levels and regions. Labour market participation gaps across different socio-economic groups are large (Figure 2.8, Panel B). 53% of those in the bottom decile are employed compared with 93% in the highest decile of the income distribution (INDEC, 2016), while only 63% of the population at risk of falling into poverty are employed. Furthermore, employment varies across provinces, with several northern cities among the ones with the lowest share of employed population. In the city of Buenos Aires, the richest in the country, 82% of the population aged 25 to 64 are employed, while 65% or less are employed in Gran San Juan, Gran Resistencia, Formosa, San Nicolás and Villa Constitución. Regional labour marked differences mainly reflect the experience of youth and women. The differential in participation rates between socio-economic groups, workers with different skills level and youth is higher in Argentina than in other countries in the region, which highlights the need to put in place targeted policies to make the labour market more inclusive (Figure 2.9).
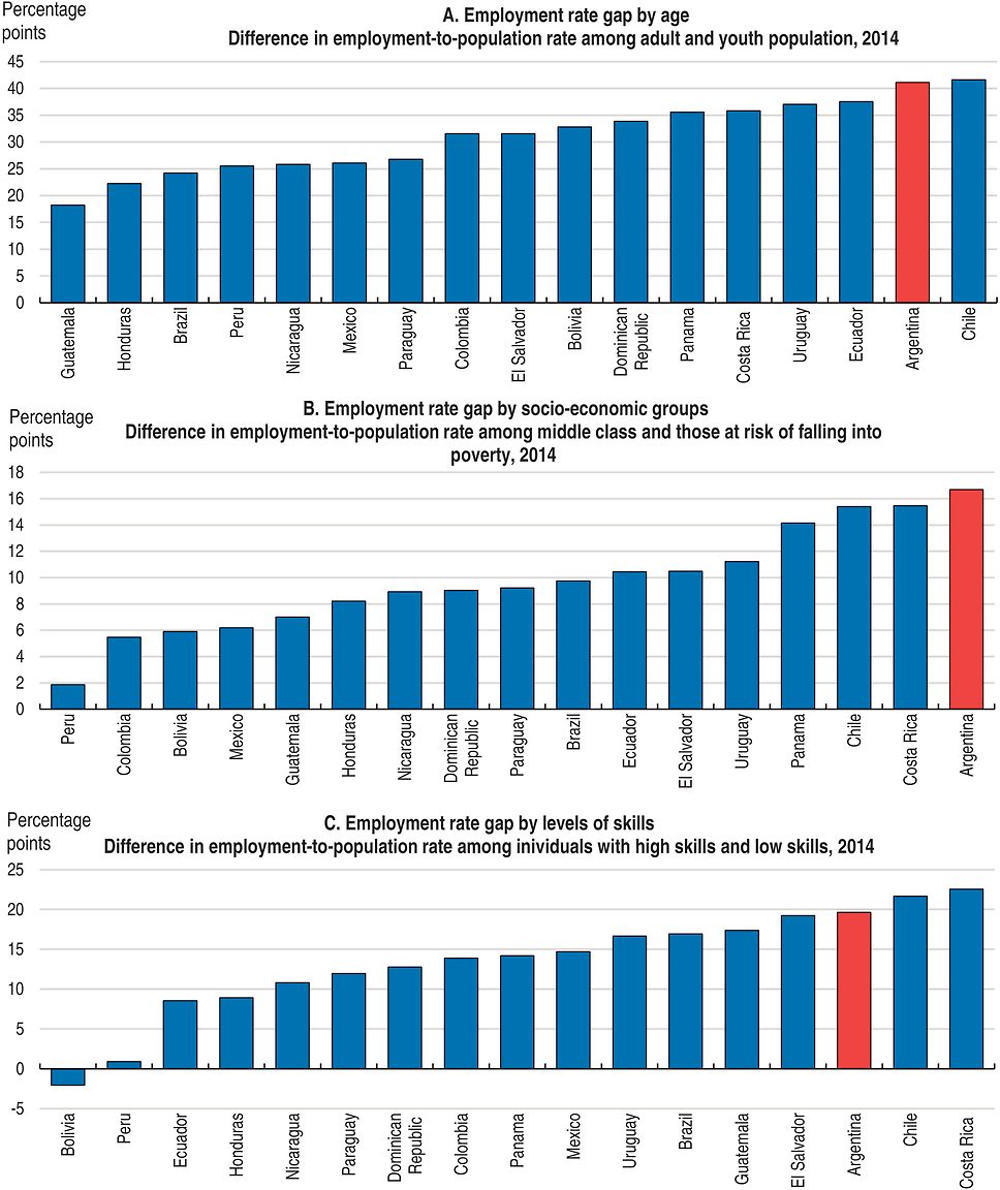
Notes: Employment rate for population of 30 to 64. Youth is defined by the population aged 15-29. An individuals have “low skill level” if have completed 8 years of education or less, and “high skilled level” if completed 13 years of education or more. Data for Argentina are representative of urban centres of more than 100 000 inhabitants.
Source: SEDLAS (2016) and OECD and World Bank tabulations of SEDLAC (2016).
Only two out of ten young Argentinians participate in the formal labour market. Youth labour force participation has slightly decreased from 48% in 2003 to 39% in 2016 (SEDLAC, 2016; INDEC, 2016). Lower employment may translate into better employment opportunities in the future if lower participation is reflected in higher school enrolments or training. Unfortunately, only a small part of the fall in participation rates reflects higher enrolments in education and training. One-fifth of youth aged 15 to 29 years old living in Argentine urban areas are not engaged in employment, education or training (NEET) (Figure 2.10, Panel C) and almost 15% are employed in informal jobs. On the other hand, 18% of Argentinian youth are formal workers and almost 50% are students. These poor employment opportunities, which are even worse for young women, the poor and those at risk of falling into poverty, result in lower well-being and reinforce the belief of many youth that they can never get ahead of a pattern of self-reinforcing aspiration gaps (OECD/CAF/ECLAC 2016).
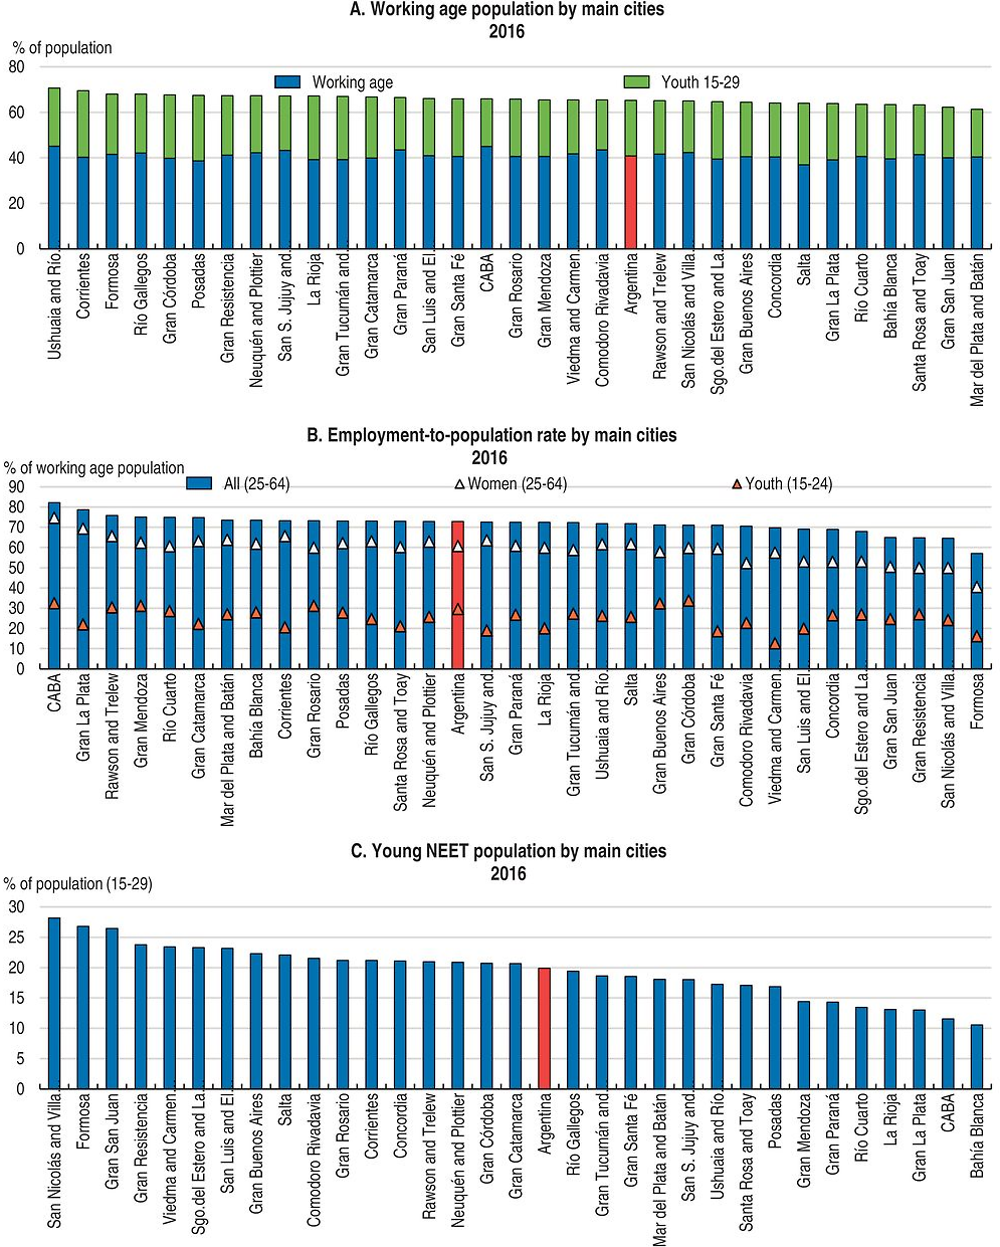
Source: Encuesta Permanente de Hogares (EPH) for the third quarter of 2016 (INDEC).
Youth inactivity is a problem since it contributes to the intergenerational persistence of inequality, and it prevents Argentina from exploiting an emerging demographic window of opportunity. All 25 Argentine provinces and the City of Buenos Aires will benefit from the “demographic dividend” until around 2040 (De Hoyos, Halsey and Székely, 2016). Although fertility rates have declined, children under age 15 still account for almost 20% of the population in 2016, and young people aged 15 to 29 account for almost 25% (Figure 2.10, Panel A). Supporting a successful start to a professional life is crucial for youth, since their later careers depend highly on the first steps (IDB, 2015). Lack of good employment opportunities is one of the most significant factors hindering the inclusion of youth in Argentina.
The challenge of NEETs is concentrated among young adults, while most teens in Argentina attend school. NEET rates increase between the ages of 20 and 29. A substantial part of it is explained by young women choosing not to combine raising a family with paid work. In fact, there is a 13 percentage points gender gap in the NEET rate in Argentina. Almost three out of ten young women (aged 15-29) are NEET, and two of them are engaged in unpaid domestic work and caregiving. Youth who left secondary school before completion and are neither working nor improving their skills are of particular concern. More than one‐half of NEETs aged 15-29 years are early school leavers and likely to face limited career prospects (OECD/CAF/ECLAC 2016).
Participation rates for Argentinian women are low compared with OECD economies (Figure 2.8, Panel D), being especially low in the smallest cities and the Greater Buenos Aires area where non-participation rates are higher than 40% (Figure 2.10, Panel B). Most affected are the most vulnerable women; i.e. those with low education, living in small cities, with children or married to low-earning spouses (Gasparini and Marchionni, 2015). This trend suggests the emergence of a dual scenario. On the one hand, skilled higher-income women living in large cities have labour participation levels similar to those of developed countries; and, on the other, low-skilled vulnerable women living in smaller cities with poorer services have substantially lower levels, leading to increasing inequality and poverty cycles (Gasparini and Marchionni, 2015; OECD/CAF/ECLAC, 2016).
Although progress in female participation has been made over the past decades, advances have slowed recently. From 2012 to 2015, the gender gap remained constant at around 28% (OECD, 2015b). Unless Argentina implements policies to promote the participation of women in the labour force, the country will not reduce the gender labour force participation gap by the G20 commitment of 25% by 2025.
The availability of affordable, high-quality childcare is a key factor explaining cross-country differences in women’s labour market participation (OECD, 2012a). Only 36% of Argentine three year-olds are enrolled in formal childcare, lower than in Mexico (40%), Brazil (49%) and Chile (54%), and significantly lower than the OECD average of 68% (CAF, 2016; OECD, 2015a) and advanced economies such as France (99%), Germany (93%) and Israel (97%). Moreover, only 25% of 3-year-olds from households in the lowest decile of the income distribution attend school, while 81% of their peers in the highest decile do so (SEDLAC, 2016).
Active labour market policies, quality of education, job flexibility and affordable childcare facilities are needed to support further increases of women labour force participation. Designing employment initiatives for groups with less attractive job prospects and more predisposed to exit are needed, given the significant slowdown of labour participation among vulnerable women. Active labour market policies (ALPMs) interventions such as training, employment services and incentives to small business development, protected employment and direct employment generation through public employment programmes can improve employment prospects for women and better prepare them for the world of work. Closing the gender gaps in education, starting from childhood, is essential to better integrate women in the world of work. According to the OECD Programme for International Student Assessment (PISA) 2015 data, the City of Buenos Aires ranks among the territories with the largest gender performance gap in mathematics (boys’ average score exceeds girls’ by more than 15 points, although they have similar performance in science). Additionally, reducing the time-burden women face related to family responsibilities by offering free childcare, free elderly care and job flexibility can help women pursuing a career. Lastly, policy advocacy regarding female stereotypes could help to pursue changes in social attitudes and norms.
Unemployment mainly affects the young, less educated and those living in low-income households (Figure 2.11). Unemployment rates are four times higher for youth than for adults with nearly 24% of the economically active young population being unemployed in 2016 (INDEC, 2016). Low- skilled workers are also hit hard; the rate of unemployment among those with tertiary education is three times lower than that for individuals with incomplete secondary education. Territorial differences are also significant. The unemployment rate of cities with more than 500 000 inhabitants is higher than the national average and twice as high (9.3%) as the unemployment rate in smaller cities (4.6%). Still, spells of unemployment in Argentina are short. On average unemployed workers spend nine-and-a-half months looking for a job and only 20% take more than one year (SEDLAC, 2016).

1. Data are representative of urban centres of more than 100 000 inhabitants.
Source: SEDLAC (2016), EPH for the third quarter of 2016 (INDEC), Ministry of Labour, Employment and Social Security based on Encuesta Permanente de Hogares (EPH).
Besides the problems associated with informality, labour earnings are very unequal (Figure 2.12). This is the principal reason why job quality, a multi-dimensional concept capturing several job characteristics that contribute to the well-being of workers, is low in Argentina, even though average hourly wages at purchasing power parity are above those in other Latin American countries (OECD, 2015b).
The OECD Job Quality Framework is structured around three dimensions that are closely related to people’s employment situation: earnings quality (a combination of average earnings and inequality); labour market security (capturing the risk of unemployment and extreme low pay); and the quality of the working environment (measured as the incidence of job strain or very long working hours).
These three dimensions jointly define job quality and should be considered simultaneously, together with job quantity, when assessing labour market performance. The OECD (2015a) has adapted the job quality framework to emerging economies by taking into account their labour market specificities, such as the weakness of social protection (inadequacy of benefits and low coverage of social insurance schemes) and high rates of working poverty, and, at the same time, the more limited data available for these countries.
As in other emerging countries analysed, Argentina’s job quality is much lower than the OECD average in all three dimensions. The results show special concern on the incidence of informality and risk of entering extreme low-pay status (OECD, 2015a). More than a fifth of the workers earn less than the minimum wage (INDEC, 2016). Earnings quality is low and inequality large. As in most emerging economies, the levels of earnings inequality are more than twice as high as in OECD countries (Figure 2.12) (OECD, 2015a).
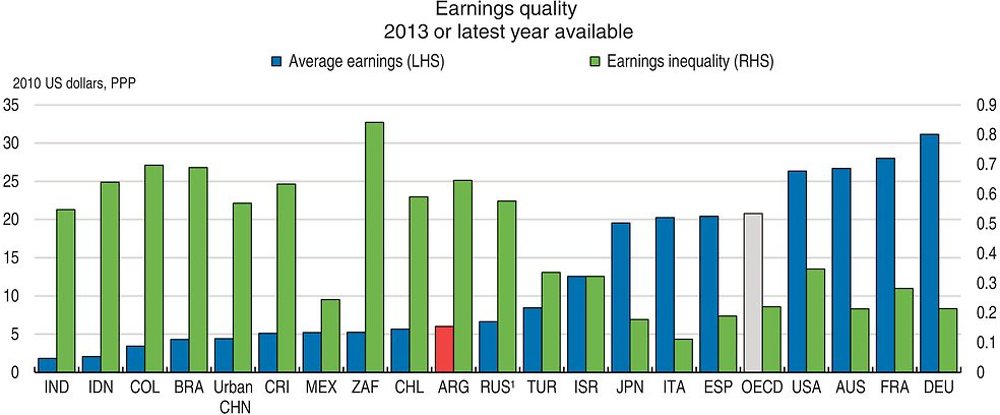
1. The figures for Russia are based on imputed data on households’ disposable income from information on income brackets, and therefore include the effect of net transfers. Individual hourly income for two-earner households was calculated using available information on partners’ employment status and working hours.
Calculations are based on net hourly earnings and concern 2013 values, except for Brazil (2009), Chile (2009), China (2009), Argentina (2010) and India (2011). The OECD average is a simple cross-country average of earnings quality. Data for Argentina are representative of urban centres of more than 100 000 inhabitants.
Source: OECD (2015a).
Although the risk of falling into extreme low pay is low compared to other emerging economies such as India, Mexico and Colombia, social transfers are not fully able to reduce this risk which translates into higher levels of overall labour market insecurity than in most OECD countries. Moreover, although unemployment risk1 is lower than that of the OECD average, the very limited unemployment insurance coverage causes labour market insecurity from unemployment in Argentina to be higher than that in a typical OECD country. The low unemployment risk is likely to reflect unaffordability of unemployment: many workers may need to accept very low quality jobs when better jobs are not available due to lack of social insurance benefits (OECD, 2015a).
← 1. Unemployment risk denotes the (scaled transformation of the) probability of becoming unemployed times the expected duration of unemployment, which may be interpreted as the average expected earnings loss associated with unemployment as a share of previous earnings. Unemployment insurance captures the average effective net individual replacement rate of unemployment and social assistance benefits in terms of previous earnings, for the median earner. Labour market insecurity is calculated as unemployment risk times one minus unemployment insurance and may be interpreted as the expected earnings loss associated with unemployment as a share of previous earnings. The risk of unemployment is approximated by the unemployment rate, owing to the lack of satisfactory data to calculate flows into and out of unemployment in the countries analysed. In a steady-state economy with a relatively low level of unemployment, the two approaches yield very similar results. The OECD average is a simple cross-country average of labour market security as calculated in the Employment Outlook 2014 (OECD, 2015a).
Source: OECD Employment Outlook 2015.
High labour market duality and inequality
Another obstacle to making the labour market more inclusive is informality. The informal sector in Argentina is smaller than in most Latin America countries, but large by OECD standards. The stringent employment protection for permanent formal jobs and the large share of unprotected informal jobs have resulted in a dual labour market (Canavire-Bacarreza and Lima, 2007). Informal work, by definition, leaves workers without the social protection and general entitlements of the formal sectors. Like in many other Latin American countries, informality has declined in the past decade (Figure 2.13). In 2016 informal employment accounted for 33.5% of total wage workers, affecting those in the lowest quintiles of the income distribution and especially those at risk of falling into poverty, and thus contributing to inequality. Additionally, informality especially affects youth, the less educated and women. Almost 60% of the working young population do so in the informal sector. Half of the working population with just primary education are employed in unregistered jobs, compared with only 8% of those who attained a tertiary education degree. And a larger share of women hold informal jobs compared with men (Figure 2.13).

Notes: A worker is considered informal if not contributing to the pension system. Data for Argentina are for 2016, all other countries for 2014. Data for Argentina are representative of urban centres of more than 100 000 inhabitants and only accounts for wage workers.
Source: World Bank, Ministry of Labour, Employment and Social Security of Argentina Based on EPH (INDEC), and INCED (2016)
Informality increases wage dispersion, negatively affecting equity. Although earnings inequality is similar among formal and informal workers, formal workers earn, on average, significantly more (Figure 2.14 Panel A, see Box 2.3). In fact, the provinces with the highest median and mean wages are those with lower levels of informality (Figure 2.14, Panel D). Argentina is among the emerging economies with the largest wage gap between formal and informal workers (OECD, 2015a). Lower average earnings for informal workers are consistent with the consensus view that informal jobs are less productive.

Notes: A worker is considered informal if s/he is a wage worker and is not contributing to the pension system. Data are representative of urban centres of more than 100 000 inhabitants.
Source: Ministry of Labour, Employment and Social Security based on Encuesta Permanente de Hogares (EPH), INDEC (2016) and EPH for the third quarter of 2016 (INDEC).
Recent household data from 2016 make it possible to estimate the determinants of wages in Argentina, accounting for a number of specific characteristics of the job, including characteristics of the worker, the employer and also regional differences. Such wage estimations also allow an approximation of the wage differentials that informal workers and women face on labour markets, conditional on other factors. These estimations are presented below.
The estimated coefficient for the indicator variable representing a formal worker, defined by contributing to the social security system, suggests a wage premium of 3 880 ARS (approximately 260 USD at that time). Comparing this with the average wage of workers in the sample suggests that formal workers earn 35% more than informal workers, all else being equal. Similarly, male workers earn a wage premium of 2 614 ARS, equivalent to 24% of average wages. In other words, women with equal personal and job characteristics are paid 24% less on average than men.
Individual characteristics that the estimations account for include age, approximated by three age groups. Relative to those aged between 25 and 50, youths earn less while older workers earn more. Educational attainments of the individual are accounted for in the estimations through four different categories. Predictably, wages are rising with higher educational attainments. Being born in a foreign country, by contrast, reduces earnings prospects. Public sector jobs appear to be paying less than the private sector, while workers who have been with their current employer for more than five years and those working for large companies earn more. By contrast, domestic employees fetch lower wages, all else being equal.
Argentina’s labour market exhibits frequent flows between formal “good” jobs and informal “bad” jobs (Bosch, Melguizo and Pages, 2017). Flows out of informal jobs are more common than those out of formal jobs, but a considerable share of informal workers make the transition into formal jobs every year. Panel data capturing the dynamics of how workers aged 30 to 55 move in and out of informal employment in Argentina show that on average 34% of female workers and 30% of male workers who are currently in the informal sector will not remain there for a year (Figure 2.15). Almost 11% of women informal workers will move into formal jobs, and 22% of male will do so. Frequent flows of workers suggest that policies to tackle informality should focus on strengthening the incentives to become formal.

Note: Results show yearly transition rates into and out of informality. This analysis is limited to urban populations in four countries (Argentina, Brazil, Mexico, Chile) owing to data limitations. Data for Argentina are representative of urban centres of more than 100 000 inhabitants.
Source: OECD and World Bank tabulations of LABLAC (CEDLAS and the World Bank).
Flows out of the formal sector and into the informal sector are sizeable, stressing the need to place better incentives in the former. On average, 15% of workers who are currently in the formal sector will not be so within a year. Almost 10% will be informal workers a year later (80% of males who exit formal wage work and 50% of the women), compared with 2% who will be unemployed. This raises three labour policy issues in Argentina. First, formal jobs are scarce, and more quality jobs are needed. Second, unemployment benefit might not be generous enough to support the unemployed while they look for quality jobs, forcing them to take lower quality jobs instead. And third, the high cost of formalisation for workers might encourage some of them to prefer informal types of employment.
This pattern of entering and leaving the formal sector is also evidence that those informal jobs are more unstable owing to higher risk of job loss. Informal jobs appear to be associated with a higher probability of making the transition into unemployment or inactivity, particularly among women. Transitions into unemployment do not seem much higher for women than men, while transitions from informality to inactivity are quite high for women: 56% of those women make the transition out of informality compared with 11% for men. Certainly, this can also result from personal choice. Women who are planning to leave the labour force soon for family reasons, for example, may be more likely to look for more flexible work, and thus self-select into informal work (OECD/CAF/ECLAC, 2016). As explained earlier, active labour market policies, quality of education, job flexibility and affordable child care facilities are needed to facilitate the participation of women in formal employment.
Overall, informal jobs seem to be a trap for most workers, particularly for youth, women and low-skilled workers, having long-term adverse effects on equity. While holding an informal job might be a “springboard” for some, it can have scarring effects for workers’ employment prospects and future wages. Bosch and Maloney (2010), and Cunningham and Bustos (2011) found that informal salaried work in Argentina may actually act as a preliminary step towards the formal sector. In fact, it might be a standard queue towards formal work, especially for younger workers, which can serve as training time and not necessarily harm an individual’s career path. However, Cruces, Ham and Viollaz (2012) found strong and significant scarring effects in Argentina: people exposed to higher levels of unemployment and informality in their youth fare systematically worse in labour markets as adults (OECD/CAF/ECLAC, 2016). Additionally, informal firms generally provide workers with fewer opportunities for human capital accumulation and are less productive (La Porta and Schleifer, 2014). All of this might thus pose an additional burden to the most vulnerable earnings and career advancement (OECD/CAF/ECLAC, 2016).
Reducing informality entails policy action on the supply and on the demand of labour. Expanding training programmes to upgrade the skills of informal workers, increasing their productivity, as well as alternative skills certifications that can provide information on the capacities that are developed during informal jobs could increase formality prospects. Tackling business informality and promoting enterprises’ registration are equally important since most informal workers are employed by informal firms.
Youth inclusion is a pending challenge
In Argentina many young people struggle to integrate into the labour market. Starting in a low-paying job, or being mismatched early on with the wrong type of employment, would not have severe consequences if youth could move to more productive opportunities. Unfortunately, this does not seem to be the case in Argentina; young people seem to face particular barriers to entering the labour market (Figure 2.16), as can be seen in their lower participation rates, high unemployment rates, precarious jobs, informality rates (Figure 2.14, Panel C) and low income. Argentine youth hold fewer and worse jobs than adults. These difficulties can persist and be costly to mitigate, which is why it is crucial to ensure youth are off to a good start (OECD/CAF/ECLAC, 2016).
Youth entering the labour market in Argentina may have to wait a long time before getting a good quality job. The link between education and employment is one of the keys to social inclusion at this stage of life. Leaving school too early is costly for later productivity. The forgone earnings and the lack of skills accumulation can make it much more difficult to escape poverty as an adult. Figure 2.16 Panel A presents results of yearly transition rates out of school for the pooled period 2005-15 for youth who were enrolled in school in year t-1 and were not in school in year t. In Argentina, while about half of female movers first enter inactivity, this percentage is much lower for men. A high percentage of young men manage to enter into employment, but more than half of them find an informal job. Additionally, around 20% for both men and women ends up in unemployment (OECD/CAF/ECLAC, 2016).

Note: Results show yearly transition rates out of school for the pooled period 2005-15. Transitions rates are calculated as the ratio between flow of people moving that transitioned from Condition 1 (school) to Condition 2 between time 0 and time 1, over the total stock of people in the population in Condition 1 in time 0 (i.e. in school: only in school and in school and working). The transitions are year to year (from year t to year t+1). This analysis is limited to urban populations due to data limitations. Data for Argentina are representative of urban centres of more than 100.000 inhabitants.
Source: OECD and World Bank tabulations of Labour Database for Latin America and The Caribbean – LABLAC (CEDLAS and the World Bank) and Encuesta Permanente de Hogares (EPH) for the second and third quarter of 2016.
The challenges that young Argentinians face in their path to work are particularly severe among those from disadvantaged socio-economic backgrounds. The transition from school to work explains the poor labour market outcomes experienced by young people in Argentina, especially those from poorer and more vulnerable households. Youth from these households leave school earlier than their peers in better-off households, and when employed they work mainly in informal jobs (Figure 2.17). At age 15, nine out of ten youth living in poor households are in school; at age 29, however, almost three out of ten youth are NEET, four of them work in the informal sector, and only three works in the formal sector. In households at risk of falling into poverty, six out of ten young people aged 29 are working in the informal sector or are NEET. In contrast, remarkable differences are observed among consolidated middle-class households: around 96% of youth are in school at age 15, while 60% are studying or have a job in the formal sector at age 29.

Note: Data are representative of urban centres of more than 100.000 inhabitants. Socio-economic classes are defined using the following classification: “Poor” = individuals with a daily per capita income of USD 9.8 or lower. “Population at risk of falling into poverty” = individuals with a daily per capita income of USD 9.8-15. “Middle class” = individuals with a daily per capita income of USD 15-50.
Source: Encuesta Permanente de Hogares (EPH) for the second and third quarter of 2016.
Boosting formal jobs
Reducing informality requires a comprehensive strategy, including actions on education, labour and business regulation, taxation, social protection policies and productive policies. Simplifying some labour market policies, improving training and education, lowering non-wage labour costs, and adapting business registrations procedures to the needs of micro and small firms would help to boost formal employment (Bosch et al., 2017).
Activation policies have the capacity of increasing the employability of workers in a cost-effective manner, making labour markets more inclusive. Argentina has a long history of poverty-targeted labour market and long life learning programmes. Except for youth training programmes, relatively few job seekers participate in ALMP. Job training and search measures need to support all jobseekers and informal workers as well as encourage the inactive by improving their employability and helping them find an appropriate job. These programmes should help ensure that those out of work return to employment in the most appropriate job; likewise, they should help informal workers become more productive and find jobs which are a better fit for their skills.
Labour market policies in Argentina should be strengthening financially, made more efficient and spread all across the territory. The first challenge is to raise labour market programmes spending. Argentina’s spending on labour market programmes is low compared with that of OECD countries, in particular, in terms of job intermediation and unemployment benefit (Figure 2.18). This partially reflects the limited fiscal space of Argentina. A second challenge is to improve the effectiveness of spending on active labour market policies (ALMPs). While fiscal space may remain limited for some time to come, past evidence suggests that improving the spending efficiency can significantly improve outcomes. However, Argentina lacks a practice of systematic assessment of the labour market impact of activation programmes. Evaluating programmes can be difficult given the multiplicity of programmes and that implementation is done at regional level. The third challenge is to implement high quality programmes across the country. To target the neediest, implementation is done at provincial and municipal level replicating the disparities across provincial borders.
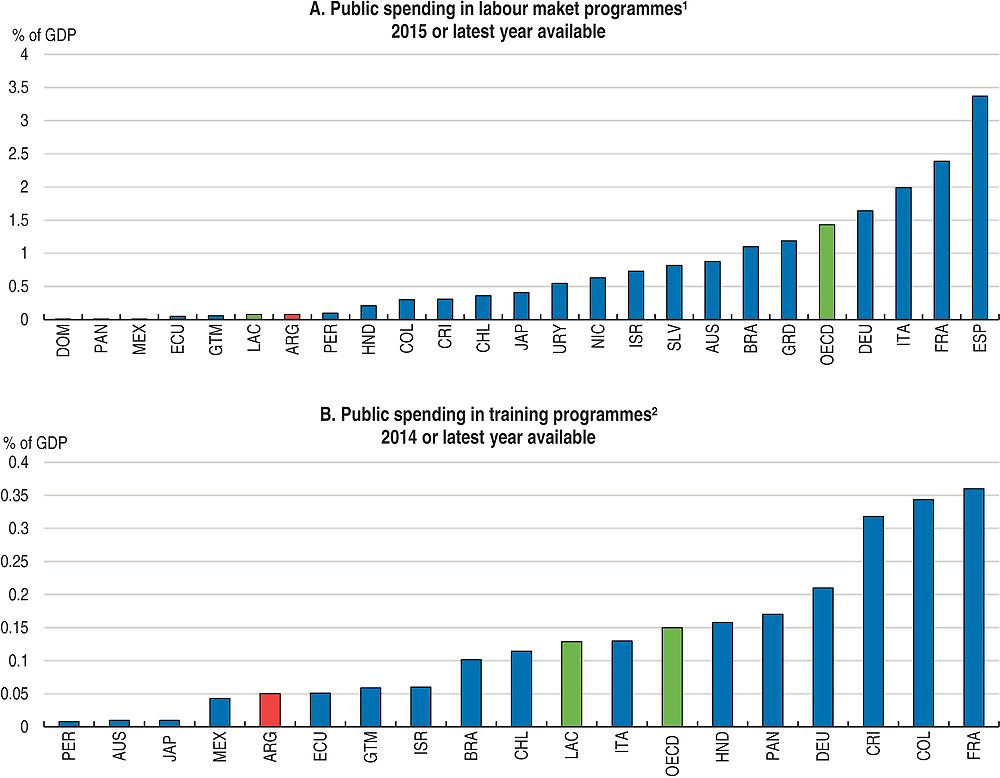
1. Includes active, intermediary and passive policies. Data for Costa Rica and Guatemala 2012; Nicaragua from 2013; Panama, and Honduras from 2014. The LAC average includes: Argentina, Bolivia, Brazil, Chile, Colombia, Costa Rica, Dominican Republic, Ecuador, El Salvador, Grenada, Guatemala, Honduras, Mexico, Nicaragua, Panama, Peru and Uruguay.
2. Year 2014 for Argentina, Brazil, OECD and Panama, 2013 for Costa Rica, Guatemala, Nicaragua and Peru, 2012 for Dominican Rep, Honduras and Mexico, 2011 for Chile and Ecuador, and 2010 for Colombia. The LAC average includes: Argentina, Brazil, Chile, Colombia, Costa Rica, Dominican Republic, Ecuador, Honduras, Mexico, Panama, and Peru.
Source: World Bank ASPIRE (2016) database and OECD Stats.
Skill-enhancing programmes could be complemented with temporarily lowering employer social security contributions to support employment, while increasing social security contributions ceilings to mitigate revenue losses. Labour supply and demand decisions are affected by taxation. Tax systems might deter employment by either diminishing the after-tax wage of employees, and/or increasing the employer’s labour costs (OECD, 2011a). From an employee’s perspective, larger net personal tax average rates (NPTA – defined as the tax/benefit proportion of the gross wage an employee pays/receives after taking into account all mandatory income taxes and social security liabilities and cash transfer benefits) and net personal marginal tax rates (NPTM – defined as the proportion of an additional unit of wage-earning income that is paid in respect of taxes and social security contributions net of additional benefits) provide greater incentives to reduce the worker’s labour supply and/or entry to the labour market. The latter is especially true for second earners, when the tax unit is the individual, as the loss of tax allowances and credits on the basis of family income can discourage second earners’ labour market participation incentives (OECD/IDB/CIAT, 2016).
In Argentina, the NPTA and NPTM rates an employee faces are 17% of an average wage for both indicators. These indicators are high relative to the regional LAC averages, 9.3% of an average wage for both indicators, but low relative to OECD averages (36% and 44.9% respectively). The figures for a secondary earner who enters the labour market are 17% in Argentina and 3% in Latin America and Caribbean (LAC) and 23% in OECD economies. Additional factors beyond marginal rates that might contribute to raise the costs of entering the labour market for secondary earners are in respect of childcare.
From an employer’s perspective, average and marginal social security contributions and payroll taxes rates raise labour costs and thus the worker’s required marginal productivity, discouraging labour creation, especially for very low-skilled workers. In Argentina, the average and marginal social security contributions employers pay are 21% of the average labour cost. These are significantly above the OECD and LAC averages, 14.3% and 13.6% of average labour costs respectively. Theory on taxation incidence on employers predicts high taxation will be passed in the form of lower wages to employees up to the point in which the minimum wage becomes binding (González-Páramo and Melguizo, 2012). This might explain the high proportion (35%) of the labour force earning wages at the minimum wage level or below in Argentina.
Strengthening education and skills to raise growth and equity
Argentina is one of the forerunners in free education, universal access to primary schooling and mandatory secondary instruction in Latin America. However, the gap in educational outcomes with respect to OECD countries is large and has persisted across time, directly impacting the well-being of the population (Figure 2.19). Education coverage has expanded through the last decade – especially at pre-primary and secondary level – and public investment in education has increased higher than average spending in OECD countries since 2006, at close to 6% of GDP.

1. Chile: year of reference 2014. Brazil and Italy: public institutions only.
Data for Argentina are representative of urban centres of more than 100 000 inhabitants.
Source: UNESCO (2016), Education (database); OECD Education at a Glance 2016 and EPH for the third quarter of 2016 (INDEC).
The educational attainment and skills of Argentina’s population are low in international comparison. Despite progress at all levels, only 60% of the population aged 25-64 has completed secondary education, in contrast with the OECD average of 80% (INDEC, 2016; OECD, 2016b). The results are not better for recent cohorts, which have lower education attainment than in OECD and other Latin American countries such as Chile, France, Germany, Israel and Italy (Figure 2.19). Moreover, only 21% of the population aged 25-64 has attained a higher education degree. Learning outcomes are also comparatively low according to OECD’s PISA tests. Results from the OECD PISA study are only available for the capital City of Buenos Aires (CABA), and results in major urban centres generally tend to be above the national average. Two-thirds of 15-year-old students in CABA do not have basic-level proficiency in reading, mathematics and science, facing significant disadvantages in their transition into higher education and the labour force (OECD, 2016d).
The main challenge is to spread educational benefits more fairly across the country. Argentina’s inequity is a cause and consequence of uneven access to and quality of education and – later in life – labour market participation. Argentina faces several education challenges that need to be addressed urgently. First, reduce high school dropout. Second, improve education quality and teacher training. Third, support disadvantaged students and low achievers. Fourth, expand higher education and technical and vocational education at all levels to better prepare students for the world of work.
Dropout prevents strong skill acquisition
Although inequities in the education system originate at early stages, they become most evident in high school level through high school dropout. Upper secondary dropouts have decreased in the past decade but are still high (Figure 2.20). The last year of high school is the most critical with 20% of students leaving school (DiNIECE, 2015). More than 1.5 million Argentinians aged 15-29 living in urban areas (equivalent to 25% of the urban youth population) have not completed secondary education and are not enrolled in school, with almost three out of five being men. By the age of 25 less than half of those who come from poor families or households at risk of falling into poverty will complete high school (OECD/CAF/ECLAC, 2016).
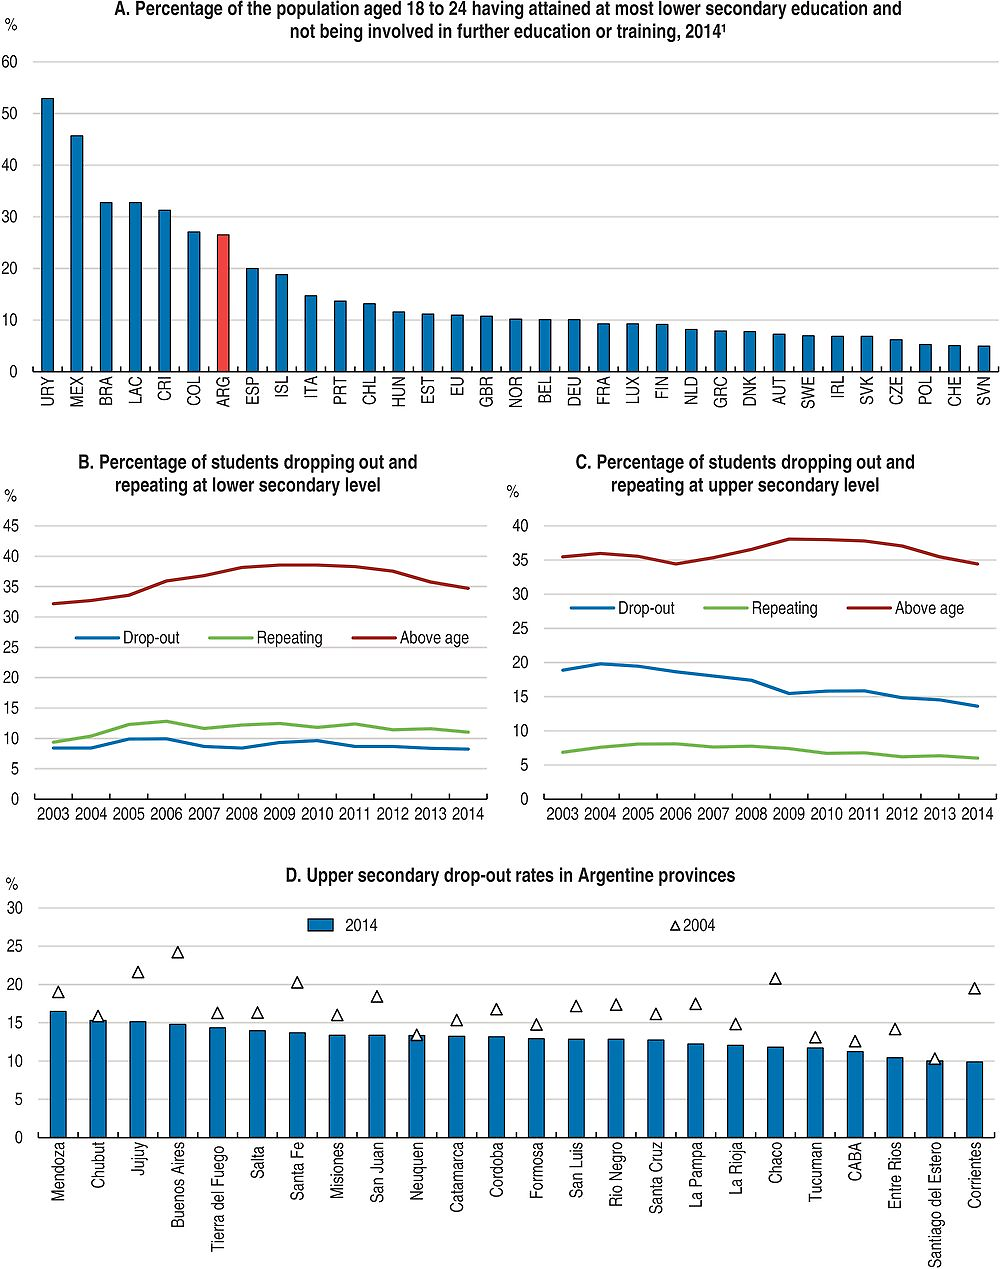
1. The early school leaving rate for Spain covers “school dropouts”. Data for Argentina are representative of urban centres of more than 100 000 inhabitants.
Source: Eurostat Database and European Commission (2014), EPH for the third quarter of 2016 (INDEC) and DiNIECE, Ministry of Education of Argentina (2015).
Leaving school before completing secondary education truncates students’ path towards higher education, exacerbates inequalities and narrows the skills base of the labour force. Besides improving the overall quality of education, improving school and teacher mechanisms to identify those who are struggling academically and providing them with individualised support should ensure that more students graduate from secondary school. ALMPs to promote employment opportunities and income support for dropouts may turn out to be more costly, more difficult to implement on a large scale and less effective than strengthening efforts to keep students in the education system.
Grade repetition amplifies social and economic disadvantages conducive to disengagement, dropout and school failure. On average, in Argentina disadvantaged students are 1.4 times more likely to repeat a grade than advantaged students who perform at the same level (OECD, 2012b). Grade repetition has not shown clear benefits for the students who were held back or for school systems as a whole (OECD, 2011b). Retained students stay longer in the school system, spend less time in the labour force, and are more likely to drop out. (Roderick, M., 1994; Ferrão, Beltrão and Santos, 2002, 2007; Ferrão, Beltrão and Fernandes, 2003; Lyche, 2010; Manacorda, 2012, OECD, 2013b). Moreover, school systems that extensively use repetition are associated with low levels of educational performance (OECD, 2010). Repetition rates in secondary education are high in Argentina; on average every year one in ten students has to repeat the grade they are enrolled in. The situation is even worse for provinces such as Neuquén, Río Negro, Salta, Santa Cruz and Santa Fe where repetition rates of the first two years of high school are almost 20%. As a result, only 79% of the students enrolled in high school at national level advance to the following year of education or graduate (DiNIECE, 2015).
Finding alternatives to grade repetition, such as extra tutoring time and learning support, should lead to better outcomes. Making a student repeat an educational year is costly both for students and for the school system and often ineffective in raising educational outcomes (OECD, 2013b). More could be done to identify students at risk early on by offer continuous and comprehensive assessment and tackle student underperformance during the school year by providing early, regular and timely individualised support. Likewise, automatic promotion with support and tutoring is often a better option than repetition. This entails supporting students, reinforcing teachers’ ability to teach classes with more diverse attainment levels, and extending and intensifying learning opportunities in the specific subjects in which students did not reach a satisfactory level.
Argentina has just started implementing the programme Asistiré (I will attend) in the Province of Buenos Aires which holds 25% of the public high school students. The programme aims at identifying students who are at risk of dropping out or who are out of the education system and offer them tailored multi-sector strategies to stay in school such as flexible school trajectories. Looking forward, the programme should be rigorously evaluated to assess its design and implementation strengths and deficiencies, and later scaled-up making the necessary changes.
Ensuring that all children have access to quality schooling can have large economic improvements at both national and individual levels. Achieving universal basic skills for every student in Argentina could have a large impact on long-run growth, higher than in some other Latin American countries such as Chile, Mexico or Uruguay (Figure 2.21). Universal basic skills refer to ensuring that every child not only has access to education but, through that education, acquires at least the baseline level of skills needed to participate fully in society. Improving the skills of low-skilled individuals could also improve the distribution of incomes. Making sure that all members of society have the ability to participate in the modern economy will raise the bottom of the income distribution (Hanushek et al., 2014). Hence, policy makers should focus on skills by improving the quality of schools and not just on the level of education (Hanushek et al., 2014).
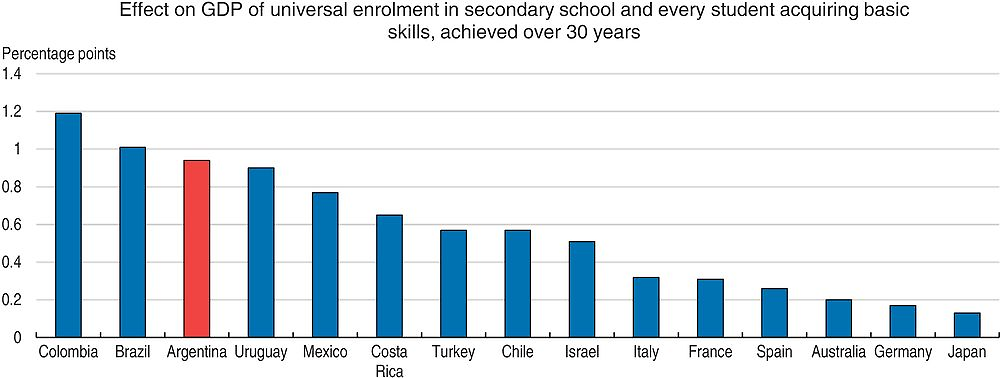
Note: “Long-run growth increase” refers to increase in annual growth rate (in percentage points) once the whole labour force has reached higher level of educational achievement.
Source: OECD/E. Hanushek /L. Woessmann (2015), Universal Basic Skills: What Countries Stand to Gain.
The different evolutions of the school-to-work transitions are driven by different household characteristics and the dissimilar interactions between economic shocks and institutions. Negative shocks to household income can increase the likelihood of dropping out impacting on future human capital development. Evidence shows that in a sample of Latin American countries youth from households whose main earner experienced a negative income shock are more likely to abandon school (Cerutti et al., forthcoming). In particular, in Argentina students belonging to households whose main earner experienced a negative income shock are more than 1 percentage point likely to drop out from school. This finding suggests the existence of real “income” effect, arising from the change in the resources available to the household for investing in schooling.
The effects of shocks are heterogeneous among gender, age and socio-economic groups. Results are stronger for young females who are the ones suffering the most from household income shocks. Likewise, household earnings and parental education are negatively correlated with school exit rates, suggesting youth from richer and more educated households have, on average, lower school exit rates. Moreover, the effect of income shocks tends to increase with age, but results are more significant between the ages of 18 and 20. These ages coincide not only with the end of secondary school, but also with the transition from secondary to tertiary education and with the first few years of tertiary.
Looking at what happens after dropping out, results confirm the detrimental effect of receiving negative income shock. The experience of a negative shock is associated to a higher probability of ending up not in education, employment, or training (NEET) or in an informal job rather than in a formal job.
Strengthening primary and general secondary education
Despite some improvement in recent years, learning outcomes are poor and young Argentinians perform poorly in reading, mathematics and science compared with OECD countries. While secondary and tertiary education attainments remain a challenge, low qualifications are not restricted to those who left the education system. The education system is the obvious tool for improving the skills of Argentine citizens. The effectiveness of Argentina’s education system has improved slightly over time. Performance in successive rounds of the PISA tests shows a moderate improvement over time in students’ learning outcomes. In both, the 2012 PISA evaluation of Argentina and the 2015 PISA evaluation of the City of Buenos Aires, performances were below the OECD average in science, mathematics and reading (Figure 2.22).1 For example, in mathematics, 15-year-old students in Argentina performed 106 points lower than OECD students (OECD, 2014a) and those in CABA 34 points lower than OECD students (OECD, 2016d). This is equivalent to approximately 2.4 years and 1 year of schooling, respectively.

1. Argentina results only reflect the results for the City of Buenos Aires. Argentina’s results in 2012 were 388 in Mathematics (OECD Average: 494), 396 in Reading (OECD Average: 496) and 406 in Science (OECD Average: 501).
Source: OECD, 2016d.
The high level of Argentine youth below a basic level of proficiency constitutes an obstacle to further development of more specific skills. According to PISA 2012 test, almost two-thirds of young Argentinians enrolled in school do not acquire basic-level proficiency in reading, mathematics and science (Figure 2.23). These students often face significant disadvantages in their transition into higher education and the labour force. In the case of OECD economies, this occurs for a quarter of 15-year-old students (OECD, 2014b).

Note: Countries and economies are ranked in descending order of the percentage of students at Levels 2, 3, 4, 5 and 6.
Source: OECD, PISA 2012 (database), www.oecd.org/pisa/pisaproducts/pisa2012database-downloadabledata.htm; OECD (2014b), PISA 2012 Results: What Students Know and Can Do (Volume I, Revised edition, February 2014).
At the same time, the small portion of top performers may hamper innovation and entrepreneurship, limiting productive transformation and upgrading (see Chapter 1). Knowledge-based and skills-based economies increasingly depend upon a broad base of technically skilled individuals, as well as a sizeable share of high performers who can produce new knowledge. Few Argentine students perform at the top levels. According to PISA 2012, less than 1% of Argentinian students perform in the highest two PISA proficiency levels – levels 5 or 6 – in mathematics, reading or science. In contrast, 12% of students in OECD countries perform in the top two levels in mathematics, and 8.5% reach these levels in reading and science.2 This is a common challenge to all Latin American countries participating in PISA.
Argentina’s improvements over time are only slightly visible at the bottom of the score distribution and the share of students with basic skills did not improve substantially. Remarkably, between 2006 and 2012 the share of low performers in mathematics, reading and science decreased as education expanded. However, given the low starting level of Argentine students, the improvements at the bottom of the PISA score distribution took place mainly as a flow of students from below level 1 to level 1. The share of students at level 2 – the level at which students acquire basic skills – did not rise substantially as in most of the LAC region’s countries (OECD, 2016d). Additionally the share of top performers decreased (i.e. the share of those students who reached Level 5 or 6 in PISA tests decreased). Ensuring that a large base of the population acquires core literacy and numeracy skills is fundamental for the diffusion of knowledge and innovation that sustains economic growth (Hanushek and Woessmann, 2007). An increase of one standard deviation in cognitive skills (measured using PISA-type exams) is associated with approximately a 2% increase in annual growth of per capita GDP (Hanushek and Woessmann, 2012).
Additionally, poor early basic skills acquisition is detrimental for the later acquisition of labour specific skills. Early performance in mathematics is correlated with job-relevant numeracy skills. The results from the 2012 Survey of Adult Skills (PIAAC) show that countries performing well in PISA tend to display a relatively high performance in PIAAC and vice versa. Students’ performance in PISA will be at least partly reflected in their acquisition of job-related skills later in life. Part of the effect will transit through the ability to pursue further education, the quality of post-secondary training in the different countries and the specialisation chosen.
Raising teachers’ skills to improve the quality of education
Teachers are an important determinant for education quality. Besides teacher attendance and punctuality, teachers’ knowledge of the subject they teach and the quality of the instruction time are important determinants of student performance, even stronger than their level of education, experience, qualifications, work status or salaries (Avendano et al., 2016; Hanushek Piopiunik and Wiederhold, 2014; Metzler and Woessmann, 2012; Hanushek and Rivkin, 2006; Palardy and Rumberger, 2008; Allison-Jones and Hirt, 2004). More than 85% of teachers in Argentina are fully certified by the appropriate authority; however, less than one-third of the teachers participate in professional development (OECD, 2016d). Just like practitioners in any other profession, teachers need to keep up-to-date with advances in their field (OECD, 2016e). Teachers’ professional development activities are one way in which teachers’ knowledge can be strengthened (OECD, 2016e).
In-house professional development activities, particularly those that promote teacher collaboration, can be effective. In countries that performed above the OECD average in PISA 2015’s science test, at least 80% of the students are in schools that invite specialists to conduct teacher training or organise in-service workshops for teachers or where teachers co‐operate with each other (OECD, 2016f). The Argentine government has recently launched the Plan Nacional de Formación Docente 2016-2021 (National Teacher Training Plan 2016-2021). The programme aims at providing teachers with periodic instruction in reading comprehension, writing, mathematics, and socio-emotional skills teaching methods, among other activities to improve teacher’s performance.
Improving teacher quality through better teacher training is a key challenge and requires a comprehensive policy plan. The country needs to strengthen its education centres, establish clear quality standards for their operation and provide incentives for teachers to participate in regular training sessions to improve the quality of instruction across all schools. Today, the country has more than 1 269 teacher training centres, with a generalised lack of nation-wide quality standards and evaluations. Some of these are administered by teachers’ unions and suffer from weak governance, insufficient accounting requirements and low transparency in the use of public funds. Separating the representation of workers’ interests from the administration of training centres would reduce conflicts of interest and allow a more professional management of these institutions, including a better use of scale economies. By comparison, France has 38 teacher training institutions for about twice the population. In the context of a forthcoming National Education Review on Argentina, these aspects will be studied with more detail.
The education system needs to do more to reach better outcomes for disadvantaged children
Argentina is subject to strong educational disparities among students of different household income and gender. Inequalities across different education and skills dimensions, related mainly to access and quality, are the remaining major challenges in Argentina. The socio-economic background of students and the geographical location of schools have a marked influence on access to education, performance and completion.
Inequities in education start early: 73% of the children between the ages of 3 and 5 in Argentina are enrolled in education, compared with 86% in OECD countries (INDEC, 2016; OECD, 2016b). While 87% of Argentinian children from households in the highest decile of the income distribution attend school, only 60% of those from the lowest decile do so. This is particularly relevant, as pre-primary education has a long-term impact on student performance: secondary-school performance improves by the equivalent of almost a full school year among those who had pre-primary education (OECD/CAF/ECLAC, 2014). Furthermore, disadvantaged students benefit the most since pre-primary education allows them to “catch up”, at least partly, with their peers. The government of Argentina has committed to build 3 000 new pre-primary institutions, or add additional classrooms to existing schools, by 2019, which would expand the number of schools by 15%.
Access to education and completion of secondary education is strongly linked to socio-economic background and geographical location. Although 80% of those in the lowest income quintile attend secondary school, only 18% graduate and continue into tertiary education, compared with 95% and 55%, respectively, for those in the highest income quintile (SEDLAC, 2016).
The socio-economic status of students and schools has a powerful influence on learning outcomes of students in Argentina. The socio-economic status of the student and the school can explain 27% of the performance variation in Argentina in PISA 2012 (Figure 2.24, Panel A) and 25% of the performance variation in the capital city of Buenos Aires in PISA 2015, compared with 13% for OECD economies in PISA 2015 (OECD, 2013a OECD, 2016d). The strength of the socio-economic gradient refers to how well socio-economic status predicts performance and serves as an indication of the extent to which education policies should target socio-economically disadvantaged students specifically. When the relationship is strong, as in Argentina, effective policies would be those aiming to raise the quality and equity of the education system (OECD, 2016d).
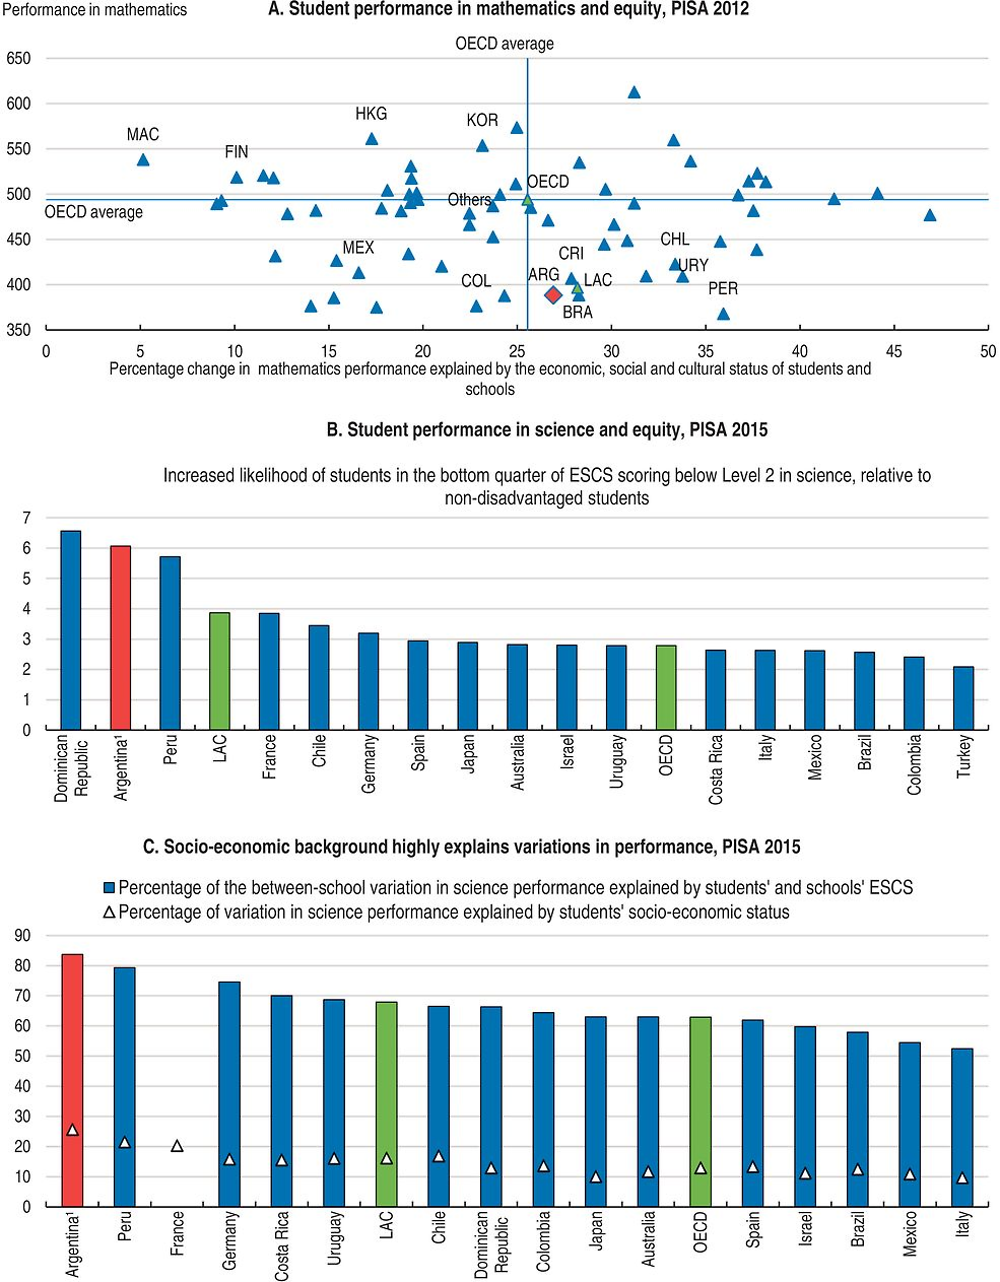
1. Data for Argentina represent the City of Buenos Aires.
The Programme for International Student Assessment (PISA) index of Economic, Social and Cultural Status (ESCS) was created on the basis of the following variables: the International Socio-Economic Index of Occupational Status (ISEI); the highest level of education of the student’s parents, converted into years of schooling; the PISA index of family wealth; the PISA index of home educational resources; and the PISA index of possessions related to “classical” culture in the family home.
Source: OECD, PISA 2015 Database.
Advantaged students generally perform better than disadvantaged students. On average, a one-unit increase in the PISA index of economic, social and cultural status of the student is associated with an increase of 37 score points in the science assessment in CABA regardless of their level of performance (equivalent of almost a full school year). Moreover, students with low socio-economic status are at greater risk of not attaining the baseline level of skills in science, the focus of PISA 2015 test. Students from disadvantaged socio-economic backgrounds are more than six times more likely than more advantaged students to not attain the baseline level of proficiency in science (Figure 2.24, Panel B). Similar results are obtained when looking at mathematics and reading performance.
Inequalities among schools are also large. Socio‐economic disparities are closely associated with performance differences among schools in the City of Buenos Aires. More than 80% of the between-school variation in performance in science – which in turn is above the OECD average as a share of the overall level of variation– is explained by the socio-economic profile of students and schools. How the variation in performance is distributed between and within schools is often related to the degree of socio-economic diversity across schools. In the City of Buenos Aires, 40% of the variation in students’ socio-economic status lies between schools, compared with 23.5% in OECD countries (Figure 2.24, Panel C). This implies that, on average, there tends to be less socio-economic diversity among students attending the same schools than between students attending different schools.
Like the large differences in performance among different groups, the distribution of educational resources appears to be linked to the socio-economic background of students. High-performing countries, such as Finland, Germany and Korea, tend to allocate resources more equitably across socio-economically advantaged and disadvantaged schools. This is not the case in Argentina where principals of disadvantaged schools reported more shortage or inadequacy of educational resources than principals of advantaged schools did (OECD, 2013b). In fact, the correlation between the school mean socio-economic background and the index of educational resources (including the share of certified teachers, books, instructional material and laboratories) in Argentina (0.32 in 2012) is considerably higher than in OECD economies (0.21 in 2012) (OECD/CAF/ECLAC, 2015). Moreover, principals of schools located in rural areas reported more shortages or inadequacy than did principals of schools in towns (OECD, 2013b). In the long run, improving the distribution of educational resources is an important challenge for improving both performance and equity in Argentina’s educational systems. While in the short run, educational resources need to be allocated for the purpose of reducing inequalities, by targeting students from poorer socio-economic backgrounds.
Argentina also stands out for its gender performance gap. Boys outperform girls in mathematics by 15 score points – placing Argentina among the countries with the largest gender performance gap in PISA 2015 – and the share of top performers in science is larger among boys than among girls (OECD, 2016b). Although a larger share of women graduate from both secondary and higher education, women represent 37% of the secondary graduates in applied science and technology (DiNIECE, 2015) and one- third of the engineering, manufacturing and construction tertiary education graduates (UNESCO, 2016). This bias of women towards the humanities and social sciences might lead into career paths with lower demand and lower pay than those in fields related to science, technology, engineering and mathematics (STEM).
The reduction of inequalities in the access to good quality education across different socioeconomic groups should be mainstreamed as part of a comprehensive education strategy. A good starting point is to promote the expansion of good quality pre-primary education, so as to ensure that all children have a strong start in their education cycle. This is particularly relevant in view of the strong impact of an additional year of pre-primary schooling in the performance of students in later stages of life. Likewise, ensuring better teacher training, including a teacher career with clear incentives, can be instrumental in improving the quality of learning all across students from different socioeconomic backgrounds. Improving school infrastructure and school resources can also have a pivotal role in reducing inequalities in levels of quality across schools. Finally, the curriculum can also be adapted to incorporate into teaching local idiosyncrasies and promote local capacities, in order to promote lagging school from rural areas or small cities (OECD/CAF/ ECLAC, 2014; OECD, 2016b). The scope and specificities of an education strategy to improve quality and reduce inequalities will be the subject of a forthcoming OECD National Education Review on Argentina.
Ensuring equal access to tertiary education
The potential for tertiary education remains unrealised in Argentina. Only 33% of the population aged 25-64 began tertiary education and 21% completed it. Argentina is proud to have a gross enrolment rate on a par with OECD countries; however, net enrolment rates are low and few students graduate from tertiary education. In more than one-third of all public universities drop-out rates are above 80% representing a challenge for the structural economic transformation of Argentina (Rabossi, 2013).
The strong marks of students’ socio-economic background are most evident in tertiary education, which is particularly unequal in Argentina. Only 17% of the young individuals in the poorest quintile of the income distribution are enrolled in tertiary education, compared with 55% of those from the highest quintile of the income distribution (SEDLAC, 2016). Likewise, only 4% of the population aged 25 to 64 in the poorest quintile of the income distribution attained a tertiary degree compared with 48% from the highest quintile of the income distribution.
Higher education inefficiencies are large, especially in the university system. There is in fact strong socio-economic selectivity evident in the progression from first to subsequent years of most university degree programmes (Rabossi, 2013). Poorly prepared students find it hard to advance; institutions offer little out-of-class support or tutoring, and almost no programme or degree change flexibility. As a result, tertiary education institutions (institutos terciarios) enrol 30% of the all post-secondary students, but produce almost the same number of graduates as the universities. University degree courses in Argentina are between four and eight years long, significantly longer than in most OECD countries. Additionally they have rigid curricula, which prevent students from changing programme or university. Beyond the need to better prepare students for post-secondary study at secondary level, tertiary institutes and especially universities must offer more flexibility, a wider range of programme options, shorter programmes and work on the complementarity among entities, helping less prepared students to make a smooth transition from secondary to tertiary education.
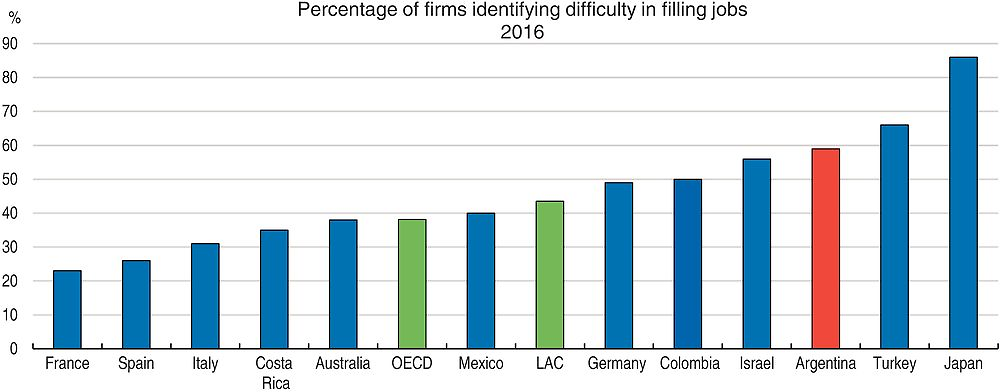
Notes: OEDC average includes Australia, Austria, Belgium, Canada, Czech Republic, Finland, France, Germany, Greece, Hungary, Ireland, Israel, Italy, Japan, Netherlands, New Zealand, Norway, Poland, Portugal, Slovakia, Slovenia, Spain, Sweden, Switzerland, Turkey, United Kingdom and United States; LAC average includes Argentina, Brazil, Colombia, Costa Rica, Guatemala, Mexico, Panama and Peru.
Source: Manpower Group (2016).
Matching qualifications to labour market needs
In Argentina the gap between the available pool of skills and those skills that the economy requires is wide: 59% of formal firms report having difficulties hiring workers with the skills they need (Manpower Group, 2016; OECD/CAF/ECLAC, 2014) (Figure 2.25). A scarcity of technicians, engineers and skilled trades is a recurrent complaint of employers, while the sectors most affected are the metal and machinery; the software, telecommunications and multimedia; and energy and mining industries. In fact, half of the formal companies that looked for employers with technical skills encountered difficulties filling the opening mainly due to lack of cognitive skills and work experience (INET, 2016). Both the secondary and the tertiary education systems are heavily biased towards social science and humanities, producing few STEM graduates. Two out of three secondary graduates attain a humanities degree (DiNIECE, 2015) and only one out of ten tertiary education graduates hold a degree in science, technology, engineering or mathematics (UNESCO, 2016). This is not likely to change in the near future since 13% of the 15-year-old students who participated in PISA 2015 in CABA expect to work as science and engineering professionals and in technical occupations when they are 30 (OECD, 2016d). Current skills mismatches could be aggravated in a context where technological change, globalisation and trade are responsible for job destruction and new types of job creation (INET, 2016). The capacity of countries to improve the skills of their population and adjust to these changes will partially determine labour markets’ outcomes, economic growth, productivity and competitiveness (OECD/CAF/ECLAC, 2015).
Reducing skill mismatches entails comprehensive policy action. Effective and well-informed career guidance at the end of lower secondary education plays an important role in achieving a good match between students’ preferences and labour market needs (OECD, 2014c). This bias towards the humanities might lead into career paths with low demand. The lack of a career guidance system and information about labour market prospects might be one reason behind these decisions, which could be addressed by better career guidance. Providing reliable and free information on-line about employment options in the country, wage levels in different industries and labour market status by degree and university could help young students make better decisions regarding their professional future. Making this information available would help students better understand the relative value that qualifications have in the labour market and encourage students to enrol in those careers and institutions that offer the best employment and earnings prospects. This would also create greater competition between higher education institutions raising overall quality standards.
There is a need to improve the governance of the universities to make them more accountable, performance-based and responsive to Argentina’s skills needs. Usually humanity degrees are shorter and more accessible than STEM degrees owing to costs and low quality of secondary education. The current governance, evaluation and financing scheme does not favour a rapid response to labour market needs, to make technical and engineering degrees more attractive to students and to avoid an excess of supply of graduates in certain fields and shortages in others.
Systematically collecting data on skills demand could help better match the supply. Lack of data on both individual skills and those demanded by enterprises hinders governments’ capacity to solve the current skills mismatch. There is little knowledge on the population’s literacy, numeracy, problem solving and technical skills capacity in Argentina. Information is also lacking on what types of higher level technical and professional skills businesses require now and in future. This information is the building block for countries to identify skills shortages and gaps, and plan for future skills needs to become more productive and competitive (OECD/CAF/ECLAC, 2016) (see Chapter 1).
Strengthening technical vocational education and training (TVET)
In Argentina, as in LAC, technical and vocational education and training (TVET) serves an important equity function. It caters to the needs of different segments of the population: school-leavers, students looking for more practical education and older individuals seeking to deepen their professional skills, make a sideways career move or return to work after an absence (Quintini and Manfredi, 2009). Alternative training courses can provide high school and tertiary education dropouts with job skills to increase their employability. High-quality vocational education pathways, particularly in upper secondary education, can help those who have become disaffected with academic education to re-engage with the education system and improve graduation rates. And tertiary education vocational and technical programmes can provide those with no appetite for academic education with practical skills that respond to the needs of the job market.
TVET is crucial to develop a highly skilled labour force, with a range of mid-level trade, technical, professional and management skills alongside those high-level skills associated with university education (OECD, 2014c). In emerging and less developed countries, TVET is increasingly perceived as a tool to respond to changing labour market needs, while at the same time supporting social cohesion. As such, it is – and should be perceived – as a complement to those more academic programmes typically found in universities. Given that poor skills, and hence low productivity, are sometimes seen as one reason for low levels of development, investment in TVET has been argued as a means of promoting a bottom-up labour market transformation (Eichhorst et al., 2012).
Few students are enrolled in vocational and technical education programmes at secondary and tertiary level. Only 16% of secondary students in Argentina are enrolled in TVET programmes (DiNIECE, 2015), compared with 26% in OECD countries, with the Netherlands reaching 48% (UNESCO, 2016). Likewise, the share of schools offering TVET education is low and half of the technical schools are located in Buenos Aires, Córdoba and Santa Fe, which might constrain the country’s capacity to expand TVET education (Figure 2.26).
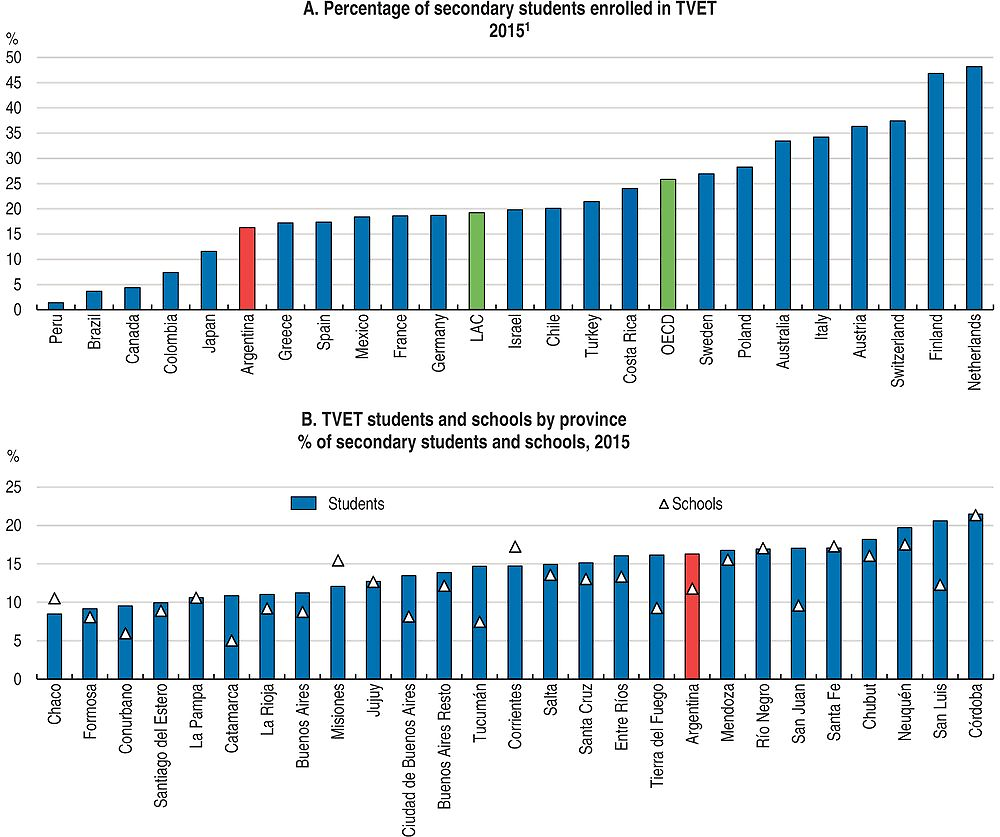
1. LAC average includes: Argentina, Bolivia (Plurinational State of), Brazil, Chile, Colombia, Costa Rica, Dominican Republic, Ecuador, El Salvador, Guatemala, Honduras, , Mexico, Nicaragua, Panama, Paraguay, Peru, and Uruguay. Data for Argentina, Bolivia, Chile, Colombia, Costa Rica, Domincan Republic are from 2015; for Australia, Austria, Canada, Finland, France, Germany, Greece, Israel, Italy, Japan, Netherlands, Peru, Poland, Spain, Sweden, Switzerland and Turkey are from 2014; for Brazil, Ecuador and Uruguay are from 2013; for Mexico, Panama and Paraguay from 2012; and for Nicaragua (2010).
Source: UNESCO (2016) and DiNIECE, Ministry of Education of Argentina (2015).
As TVET enhances job-related knowledge and prepares young individuals for the workplace, its importance continues beyond secondary education (OECD/CAF/ECLAC, 2014). In recent years Argentina has developed a relatively dynamic post-secondary TVET sector, which engages about 30% of all students enrolled in some form of education and training beyond secondary school (Rabossi, 2013). The nature, duration and quality of the post-secondary and tertiary TVET programmes in Argentina vary from institution to institution: high quality schools that are highly respected and generate positive returns for students and employers coexist with low quality ones, making it too difficult for employers to rely on them.
Vocational and technical programmes to provide youth with workplace skills and bolster lifelong learning have emerged as both an alternative and a complement to formal education in Argentina. Vocational training programmes in the form of dual training or apprenticeships play a prominent role in training vulnerable youth (i.e. high school dropouts from low-income households). However, programmes suffer from design and implementation problems, especially at local level, that could be improved. Programmes suffer from high rates of attrition and sometimes it is difficult for participants to secure a job when the programme is over given the low propensity of firms to hire apprentices because of costs (ILO/CINTERFOR, 2016).
Targeting adult education and lifelong learning towards the low-skilled has a long tradition in Argentina. Owing to the legacy of Argentina’s low educational attainments and given that most of the population has already left the formal education system, improving the skills of today’s adults is the most effective way of raising skills without waiting for a generation. Adult education has been a policy priority in the past with more than 1 million youth and adults enrolled each year in the formal education system, with two out of five of them engaged in TVET education (DiNIECE, 2015). Still, the offer falls short when it is noted that 40% of the adult population aged 24 to 64 – more than 8.5 million people – has not completed secondary education. Moreover, many of the training programmes offered by the Ministry of Labour, Employment and Social Security are targeted at the most vulnerable groups and should be expanded to other low-skilled categories of the population to help upgrade the country’s human capital given the low labour productivity.
There is little co-ordination between TVET programmes and the general education system. TVET is offered by the Ministry of Education, the Instituto Nacional de Educación Tecnológica (INET), the Ministry of Labour, Employment and Social Security and by private schools, companies and organisations. Institutions operate in silos, limiting students’ ability to advance academically and sometimes attain a higher degree. Additionally, skills acquired from TVET often go unrecognised by the traditional education system; many students are unable to proceed to higher levels of general education studies based on TVET certificates. Recently, the INET together with the Federal Council of Education worked on mechanisms to facilitate skills certification and offer short tertiary degrees with intermediate certifications. Strengthening co-ordination among all actors as well as implementing a National Qualifications Frameworks could align TVET education with general secondary and tertiary education. National Qualifications Frameworks, which classify qualifications by level based on learning outcomes, standardise qualifications in order to facilitate the evaluation and comparison of skills across systems. ChileValora and the Ministry of Education in Chile, and INFOTEP and the Ministry of Education in the Dominican Republic, for example, have implemented these frameworks (OECD/CAF/ECLAC, 2016).
TVET struggles with quality, prestige and status. Often, TVET is looked upon less favourably by employers and students than general tertiary education systems. Moreover, current TVET programmes may enhance inequality. Students enrolled in TVET are more likely to be from poor households or at risk of falling into poverty than those in general education (OECD/CAF/ECLAC, 2014). As a result, TVET can perpetuate inequality by amplifying the discrepancies in opportunity between those with higher and lower socio-economic status. Additionally, TVET can amplify gender disparities: many of the higher-paying, technical tracks in TVET are male dominated, while women tended to focus their studies on low-paying trades (UNESCO, 2010). All of this calls for improving TVET programmes in Argentina to help ease the associated stigma and to contribute towards a more equal education.
Finally, TVET is misaligned with the demands of the labour market. Linkages between the TVET system and employers are relatively weak, illustrated by the low level of involvement of employers in TVET policy development. Recently, the national government has made advances in better linking TVET with the skills demanded. In 2016, the national government of Argentina launched two nation-wide programmes to improve the skills in two critical areas, health and computer programing: the Programa Nacional de Formación de Enfermería (PRONAFE) that will train 50 000 new nurses by 2020 and the Programa 111 “Analistas de Conocimiento” that will train 80 000 people in computer coding by 2020. Additionally, the INET has signed more than 60 apprenticeship agreements with private businesses to train TVET secondary students with labour market relevant skills in banking, automobile and the food industry (INET, 2017).
Labour market incentives for upskilling should be stronger
Education and skills policy changes should be designed taking into account the employment structure of the country as well as the returns to education and other incentives individuals have for acquiring skills. Current changes in the occupation structure of the labour force in Argentina signal an increasing demand for workers with a technical degree and operational skills. The demand share of technicians and operational workers has increased over the past decade, with a reduction in the share of non-skilled and professional workers (Figure 2.27). Likewise, the median salary of workers with technical, operational and no skills has increased at a faster pace than that for those with jobs that require professional skills, narrowing the gap which is still wide (Ministry of Labour, Employment and Social Security, 2016).
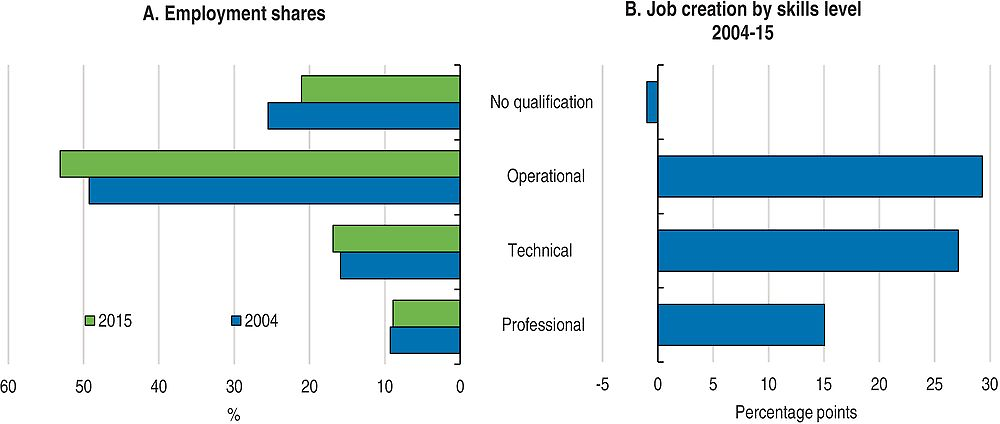
Note: Refers to population aged between 15 and older. Data for Argentina are representative of urban centres of more than 100.000 inhabitants.
Source: Ministry of Labour, Employment and Social Security based on Encuesta Permanente de Hogares (EPH).
Returns to education for male workers have declined in the past decade, especially for those with tertiary education; while the returns to education of women have stayed constant (SEDLAC, 2016). This trend can be partially attributed to the expansion of education, the recent boom in commodity prices that could favour unskilled workforce and other within-sector forces, such as technological diffusion or skill mismatches that may reduce the labour productivity of highly educated workers (Gasparini et al., 2011). Likewise, the wage gap between high-skilled workers, those with more than 13 years of education, and low-skilled workers, those with 8 years of education, has almost halved since 2003 (SEDLAC, 2016).
The incentives for acquiring skills should be actively reinforced given the relatively low levels of skills in the Argentinian workforce. Enabling more students to gain further skills can have high pay-offs for the country and individuals. In fact, increasing the available talent pool of the future generation is central to developing a knowledge-based economy and enhancing productivity (see Chapter 1). However, the observed differences in wages, which have fallen recently, do not seem to provide incentives for investing in skills as strong as in countries with similar education level. Education in Argentina plays a similar role in determining earnings among workers to that in OECD countries (Figure 2.28). Workers with tertiary education in Argentina make 48% more earnings than their counterparts with upper secondary education. This places Argentina on a par with OECD countries and well below Brazil, Chile, Colombia and Mexico where workers with higher education earn more than twice their counterparts with upper secondary education. Additionally, workers with less than upper secondary education make 14% less than workers with secondary education. Differences in earnings are both a reflection and a source of unequal distribution of income in Argentina; yet, attending tertiary education or even completing upper secondary degree has similar impacts on labour market outcomes and well-being to those in OECD countries, rather than to other countries with similar levels of education.

Note: Calculations based on earning of 25-64 year-olds workers with income from full time employment. Data for Argentina are from 2016 and are representative of urban centres of more than 100 000 inhabitants.
Source: Encuesta Permanente de Hogares (EPH) for the third quarter of 2016 (INDEC) and OECD, 2016b.
Key recommendations
-
Undertake a revenue-neutral tax reform, including
-
Lowering the income threshold where taxpayers start paying personal income taxes.
-
Introducing progressivity into social security contributions.
-
Lowering social security contributions temporarily for low-paid workers whose jobs are brought into the formal sector.
-
-
Enforce formalisation and compliance with more labour inspections.
-
Simplify administrative procedures and licensing requirements to start an activity.
-
Scale up training, employment services, and incentives for small business development.
-
Integrate existing social protection programmes and allow them to share registries and targeting tools.
-
Index pension benefits to consumer prices.
-
Align retirement ages for women to those for men.
-
Protect workers with unemployment insurance and training rather than strict labour regulations.
-
Expand early childhood education, promote flexible working time arrangements and extend paternity leave.
-
Strengthen mechanisms to identify and support students at risk of dropping out through tutoring and individualised support.
-
Merge teacher training institutions and strengthen their quality standards, governance, accounting requirements and transparency.
Other recommendations
-
Phase out energy subsidies while ensuring a string social safety net.
-
Further develop the technical and vocational education and training system by involving employers more.
-
Implement a National Qualifications Framework to align technical education with general secondary and tertiary education.
-
Strengthen the integration of planning between secondary and tertiary education systems and improve the coherence in their curricula.
-
Align tertiary curricula with labour market needs, offering better quality technical programmes and shorter university degrees.
-
Provide reliable and free information about employment options, wage levels in different industries, and labour market status by degree and university.
Bibliography
Allison-Jones, L.L. and J.B. Hirt (2004), “Comparing the teaching effectiveness of part-time and full-time clinical nurse faculty”, in Nursing Education: Perspectives, 25, 238-243.
Amarante, V. and R. Arim (2015a), Desarrollo Social, No. 133, UN symbol: LC/G.2637-P CEPAL/ECLAC.
Avendaño, R. et al. (2016), “Understanding student performance beyond traditional factors: Evidence from PISA”, in OECD Development Centre Working Papers, No. 331, OECD Publishing, Paris, https://doi.org/10.1787/5jlz7n7bxn0p-en.
Battistón, D. et al. (2014), “Exploring trends in labour informality in Latin America”, 1990-2010, in CEDLAS Working Papers 0159, CEDLAS, Universidad Nacional de La Plata.
Binell, C. (2016), “Wage inequality and informality: Evidence from Mexico”, IZA Journal of Labour and Development, 2016, Vol. 5, Issue 1, pp. 1-18.
Bernal, R., M. Eslava and M. Meléndez (2015), “Taxing where you should: Formal employment and corporate income vs payroll taxes in the Colombian 2012 Tax Reform”. Mimeo.
Bosch, M. and W.F. Maloney (2010), “Comparative analysis of labor market dynamics using Markov processes: An application to informality”, Labour Economics.
Bosch, M., A. Melguizo and C. Pagés (2017), “Better pensions, better jobs: Status and alternatives toward universal pension coverage in Latin America and the Caribbean”, Journal of Pension Economics and Finance, 16(2), pp. 121-143.
CAF (2016), Más Habilidades para el Trabajo y la Vida: Los Aportes de la Familia, la Escuela, el Entorno y el Mundo Laboral [More Skills for Work and Life: The Contributions of Family, School, Environment and Workplace], Development Bank of Latin America, Caracas.
Canavire-Bacarreza, G. and L. Lima (2007), “Unemployment duration and labor mobility in Argentina: A socioeconomic-based pre- and post-crisis analysis”, in CEDLAS Working Paper 54, Universidad Nacional de La Plata.
CEDLAS (2017a), “Poverty in Argentina: Recuperating comparability” [“La pobreza en Argentina: recuperando la comparabilidad”], Boletin CEDLAS, La Plata.
CEDLAS (2017b), “Poverty in Argentina: the regional context” [“La pobreza en Argentina: el contexto regional”], Boletin CEDLAS, La Plata.
CEDLAS and World Bank (2014), LAC Equity Lab tabulations of SEDLAC and World Development Indicators (database), www.worldbank.org/en/topic/poverty/lac-equity-lab1/overview (accessed 1 April 2017).
Cerutti, P. et al. (forthcoming), “Hit and run? Income shocks and school dropouts in Latin America”, OECD Publishing, Paris.
Cruces, G., A. Ham and M. Viollaz (2012), “Scarring effects of youth unemployment and informality: Evidence from Argentina and Brazil”, in Center for Redistributive, Labor and Social Studies, CEDLAS, La Plata.
Cunningham, W. and J. Bustos (2011), “Youth employment transitions in Latin America”, in The World Bank Policy Research Working Paper, World Bank, Washington, DC.
Deaton, A. (2006), “Measuring Poverty”, in Understanding Poverty, Banerjee, A., R. Benabou and D. Mookherjee (eds.), Oxford University Press.
Deaton, A. and O. Dupriez (2011), “Purchasing Power Parity Exchange Rates for the Global Poor,” American Economic Journal: Applied Economics, 3(2): 137-66.
De Hoyos, R., R. Halsey and M. Székely (2016), Out of School and Out of Work: Risk and Opportunities for Latin America’s Ninis, World Bank, Washington, DC.
DiNIECE, (2015), Education Statistics [Estadística de la Calidad Educativa] http://portales.educacion.gov.ar/diniece/ (database) (accessed 1 April 2017).
ECLAC (2016), Social Panorama of Latin America 2015, Economic Commission for Latin America and the Caribbean, Santiago, Chile.
ECLAC/ILO (2016), “Employment situation in Latin America and the Caribbean: Recent improvements and persistent gaps in rural employment”, in Employment Situation in Latin America and the Caribbean, No. 14, Economic Commission for Latin America and the Caribbean and International Labour Organization, Santiago, Chile.
Eichhorst, C. et al. (2012), “A roadmap to vocational and training systems around the world”, in IZA Discussion Paper 7110.
Eurostat Database and European Commission (2014), “Overview of Europe 2020 Targets” (database) http://ec.europa.eu/europe2020/targets/national-targets/index_en.htm (accessed 1 April 2017).
Fernández, C. and L. Villar (2016), “A taxonomy of Colombia’s informal labor market”, Working Paper No. 73 2016-11, Fedesarrollo, Bogotá, Colombia.
Ferrão, M.E., K. Beltrão and C. Fernandes (2003), “Aprendendo sobre a escola eficaz – evidências do SAEB-99, Brasília: INEP/MEC” (Disponível em www.dmat.ubi.pt/~meferrao).
Ferrão, M.E., K. Beltrão and D. Santos (2007), “O impacto da política de não-repetência na proficiência dos alunos da 4ªsérie: Um estudo sobre o Sudeste Brasileiro”, in Revista Brasileira de Estatística, 68, 229, 69-97.
Ferrão, M.E., K. Beltrão and D. Santos (2002), “Políticas de não-repetência e qualidade da educação: Evidências obtidas a partir da modelagem dos dados da 4a série do SAEB-99”, in Estudos em Avaliação Educacional.
Ferreira, F. et al. (2013), “Economic mobility and the rise of the Latin American middle class”, in Latin America and Caribbean Studies, World Bank, Washington, DC.
Gasparini, L. and M. Marchionni (2015), “Bridging gender gaps? The rise and deceleration of female labor force participation in Latin America: An overview”, in CEDLAS Working Papers 0185, CEDLAS, Universidad Nacional de La Plata.
Gasparini, L. et al. (2014), “Exploring trends in labor informality in Latin America, 1990-2010”, in CEDLAS Working Papers 0159, CEDLAS, Universidad Nacional de La Plata.
Gasparini, L. et al. (2011), “Educational upgrading and returns to skills in Latin America: Evidence from a supply-demand framework, 1990-2010”, in Policy Research Working Paper, No. 5921, World Bank Group, Washington, DC.
González-Páramo, J. and A. Melguizo (2012), “Who bears labour taxes and social contributions? A meta-analysis approach”, in Journal of the Spanish Economic Association, 4(3), 247-271.
Hanushek, E., M. Piopiunik and S. Wiederhold. (2014), “The value of smarter teachers: International evidence on teacher cognitive skills and student performance”, in NBER Working Paper, 20727, National Bureau of Economic Research, New York.
Hanushek, E. and S. Rivkin (2006), “Teacher Quality”, in Handbook of the Economics of Education, Volume 2, Elservier B.V.
Hanushek, E. and L. Woessmann (2012), “Do better schools lead to more growth? Cognitive skills, economic outcomes, and causation”, in Journal of Economic Growth, Springer, Vol. 17, No. 4, pp. 267-321.
Hanushek, E. and L. Woessmann (2007), Education Quality and Economic Growth, The World Bank, Washington, DC.INDEC (2017), “Socio-economic indicators report” [“Reporte de indicadores socioeconómicos”], INDEC, Buenos Aires.
IDB (2015a), Jobs for Growth, Inter-American Development Bank, Washington, DC.
ILO/CINTERFOR (2016), Programa Jóvenes con Más y Mejor Trabajo [More and Better Jobs for Youth Programme], Organización International del Trabajo/International Labour Organization, Centro Interamericano para el Desarrollo del Conocimiento en la Formación Profesional and Ministry of Labour, Employment and Social Security, Argentina (accessed 27 July 2016).
IMF (2017), World Economic Outlook Database (database), International Monetary Fund, Washington, DC, www.imf.org/external/pubs/ft/weo/2017/01/weodata/index.aspx (accessed on 15 April 2017).
IMF (2016), “Argentina 2016 Article IV Consultation”, Country Report No. 16/346, International Monetary Fund, Western Hemisphere Dept., Washington, DC.
INDEC (2016), National Household Survey [Encuesta Permanente de Hogares] (database), www.indec.gob.ar/bases-de-datos.asp Argentina (accessed 1 April 2017).
INDEC (2013), National Household Survey [Encuesta Permanente de Hogares] (database). www.indec.gob.ar/bases-de-datos.asp Argentina (accessed 1 April 2017).
INDEC (2010a), Unsatisfied Basic Needs Index [Indicador de Necesidades Básicas Insatisfechas], (indicator). Argentina (accessed 20 April 2017).
INDEC (2010b), National Census 2010 [Censo Nacional 2010], (database), www.indec.gob.ar/nivel3_default. asp?id_tema_1=2&id_tema_2=41 Argentina (accessed 1 April 2017).
INDEC (2003), National Household Survey [Encuesta Permanente de Hogares] (database), www.indec.gob.ar/bases-de-datos.asp Argentina (accessed 1 April 2017).
INET (2017), Instituto Nacional de Educación Tecnológica [National Institute of Technological Education], Argentina, website, www.inet.edu.ar (accessed 01 April 2017)
INET (2016), Demanda de capacidades 2020: análisis de la demanda de capacidades laborales en la Argentina [Demand for capacities 2020: Analysis of the demand for skills in Argentina], available at www.inet.edu.ar/index.php/estudios-investigaciones/informe-capacidades-2020 (accessed 05 May 2017).
La Porta, A. and A. Schleifer (2014), “Informality and development”, in Journal of Economic Perspectives, American Economic Association, Vol. 28(3), pp. 109-26.
Lyche, C. (2010), “Taking on the completion challenge: A literature review on policies to prevent dropout and early school leaving”, in OECD Education Working Paper, No. 53, OECD, Paris.
Lustig, N. (2017), “El Impacto del Sistema Tributario y el Gasto Social en la Distribución del Ingreso y la Pobreza en América Latina: Argentina, Bolivia, Brasil, Chile, Colombia, Costa Rica, Ecuador, El Salvador, Guatemala, Honduras, México, Nicaragua, Perú, República Dominicana, Uruguay y Venezuela”, in Commitment to Equity, WP 62.
Manacorda, M. (2012), “The cost of grade retention”, in Review of Economics and Statistics, May 2012, 94(2): 596-606.
Manpower Group (2016), Talent Shortage Survey Research Results, ManpowerGroup, Milwaukee, US.
Maurizio, R. (2014), Labour Formalization and Declining Inequality in Argentina and Brazil in the 2000s: A Dynamic Approach, International Labour Office, Geneva.
Medina C. and L. Morales (2016), “Assessing the effect of payroll taxes on formal employment: The case of the 2012 Tax reform in Colombia”, Borradores de economía No. 971/2016.
Metzler, J. and L. Woessmann (2012), “The impact of teacher subject knowledge on student achievement: Evidence from within-teacher within-student variation”, in Journal of Development Economics, 2012, Vol. 99, No. 2, pp. 486-496.
Ministry of Labour, Employment and Social Security (2016), Ministry of Labour, Employment and Social Security Labor Statistics [Estadisticas e Indicadores de Empleo] (database), www.trabajo.gob.ar/left/estadisticas/oede/estadisticas_nacionales.asp (accessed 1 April 2017).
OECD (2017a), Income inequality (indicator), https://doi.org/10.1787/459aa7f1-en (accessed on 21 April 2017).
OECD (2017b), LFS – Sex and Age Indicators, (database), OECD https://stats.oecd.org/Index.aspx?DataSet Code=LFS_D (accessed 1 April 2017).
OECD (2016a), Territorial Reviews: Córdoba, Argentina, OECD Publishing, Paris, https://doi.org/10.1787/9789264262201-en.
OECD (2016b), Education at a Glance 2016: OECD Indicators, OECD Publishing, Paris, https://doi.org/10.1787/eag-2016-en.
OECD (2016c), Income Distribution Database (IDD, www.oecd.org/social/income-distribution-database.htm (accessed on 1 March 2017).
OECD (2016d), PISA 2015 Results (Volume I): Excellence and Equity in Education, OECD Publishing, Paris, https://doi.org/10.1787/9789264266490-en.
OECD (2016e), Supporting Teacher Professionalism: Insights from TALIS 2013, TALIS, OECD Publishing, Paris, https://doi.org/10.1787/9789264248601-en.
OECD (2016f), PISA Products (database), www.oecd.org/pisa/pisaproducts/ (accessed 1 March 2017).
OECD (2015a), Family Database 2015 (database), OECD, www.oecd.org/els/family/database.htm, (accessed 1 April 2017).
OECD (2015b), Employment Outlook 2015, OECD Publishing, Paris, https://doi.org/10.1787/empl_outlook-2015-en.
OECD (2015c), Pensions at a Glance 2015: OECD and G20 indicators, OECD Publishing, Paris, https://doi.org/10.1787/pension_glance-2015-en.
OECD (2015d), PISA products (database), www.oecd.org/pisa/pisaproducts (accessed on 1 March 2016).
OECD (2014a), PISA 2012 Results: What Students Know and Can Do (Volume I, Revised edition, February 2014): Student Performance in Mathematics, Reading and Science, OECD Publishing, Paris, https://doi.org/10.1787/9789264208780-en.
OECD (2014b), Science, Technology and Industry Outlook 2014, OECD Publishing, Paris, https://doi.org/10.1787/sti_outlook-2014-en.
OECD (2014c), “Skills beyond school: Synthesis report”, in OECD Reviews of Vocational Education and Training, OECD Publishing, Paris, https://doi.org/10.1787/9789264214682-en.
OECD (2013a), PISA 2012 Results in Focus: What 15-year-olds know and what they can do with what they know: Key results from PISA 2012.
OECD (2013b), PISA 2012 Results: What Makes Schools Successful? Resources, Policies and Practices (Volume IV), PISA, OECD Publishing, Paris.
OECD (2012a), Closing the Gender Gap, OECD Publishing, Paris, https://doi.org/10.1787/9789264179370-en.
OECD (2012b), PISA 2012 Database, www.oecd.org/pisa/pisaproducts/pisa2012database-downloadabledata.htm.
OECD (2011a), “Taxation and Employment”, in OECD Tax Policy Studies, No. 21, OECD Publishing, Paris, https://doi.org/10.1787/9789264120808-en.
OECD (2011b), “When students repeat grades or are transferred out of school: What does it mean for education systems?” PISA in Focus No. 6, July, www.oecd.org/pisa/pisaproducts/pisainfocus/48363440.pdf.
OECD (2010), PISA 2009 Results: What Makes a School Successful?: Resources, Policies and Practices (Volume IV), PISA, OECD, Paris, www.oecd.org/pisa/pisaproducts/48852721.pdf.
OECD et al. (2016), Revenue Statistics in Latin America and the Caribbean 2016, OECD Publishing, Paris, https://doi.org/10.1787/rev_lat_car-2016-en-fr.
OECD/CAF/ECLAC (2016), Latin American Economic Outlook 2017: Youth, Skills and Entrepreneurship, OECD Publishing, Paris, https://doi.org/10.1787/leo-2017-en.
OECD/CAF/ECLAC (2015), Latin American Economic Outlook 2016: Towards a New Partnership with China, OECD Publishing, Paris, https://doi.org/10.1787/9789264246218-en.
OECD/CAF/ECLAC (2014), Latin American Economic Outlook 2015: Education, Skills and Innovation for Development, OECD Publishing, Paris, https://doi.org/10.1787/leo-2015-en.
OECD/IDB/CIAT (2016), Taxing Wages in Latin America and the Caribbean 2016, OECD Publishing, Paris, https://doi.org/10.1787/9789264262607-en.
OECD/E. Hanushek /L. Woessmann (2015), Universal Basic Skills: What Countries Stand to Gain, OECD Publishing, Paris, https://doi.org/10.1787/9789264234833-en.
Palardy, G. and R. Rumberger (2008), “Teacher effectiveness in first grade: The importance of background qualifications, attitudes, and instructional practices for student learning”, in Educational Evaluation and Policy Analysis, Vol. 30, No. 2, pp. 111-140.
Puig, J. and L. Salinardi (2015), “Argentina y los subsidios a los servicios públicos: un estudio de incidencia distributiva”, in CEDLAS Working Papers 0183, CEDLAS, Universidad Nacional de La Plata.
Quintini, G. and T. Manfredi (2009), “Going separate ways? School-to-work transitions in the United States and Europe”, in OECD Social, Employment and Migration Working Papers, No. 90, OECD Publishing, Paris, https://doi.org/10.1787/221717700447.
Rabossi, M. (2013), “The public university in Argentina: Both inefficient and ineffective?”, International Higher Education, No. 71 (Spring).
Roderick, M. (1994), “Grade retention and school dropout: Investigating the association”, in American Educational Research Journal, Vol. 31, No. 4, pp. 729-759.
Rofman, R. and I. Apella, (2014), Beyond Contributory Pensions: Fourteen Experiences with Coverage Expansion in Latin America, World Bank, Washington, DC.
Rossignolo, D. (2016), “Taxes, expenditures, poverty and income distribution in Argentina”, in Working Paper No. 45 Tulane University, Commitment to Equity.
SEDLAC (2016), Sedlac – Socio-Economic Database for Latin America and the Caribbean, (database), CEDLAS, La Plata, http://sedlac.econo.unlp.edu.ar/eng/ (accessed on 1 March 2017).
Tsounta, E. and A. Osueke (2014), “What is behind Latin America’s declining income inequality?”, in IMF Working Paper, No. WP/14/24, International Monetary Fund, Washington, DC.
UNDP (2014), Argentina National Development Report 2013 [Informe Nacional sobre Desarrollo Humano 2013. Argentina en un mundo incierto: Asegurar el desarrollo humano en el siglo XXI], United Nations Development Programme, Buenos Aires.
UNESCO (2016), Education (database), UNESCO Institute for Statistics, Montreal, http://en.unesco.org/themes/education-21st-century/databases (accessed on 1 March 2016).
UNESCO (2015), TERCE Results Report. Third Regional Comparative and Explanatory Study. Associated Factors [Informe de Resultados TERCE. Tercer Estudio Regional Comparativo y Explicativo. Factores Asociados], UNESCO, Santiago de Chile, http://unesdoc.unesco.org/images/0024/002435/243533s.pdf.
UNESCO (2010), “Gender Issues and TVET”, in TVETipedia, UNESCO-UNEVOC International Centre for Technical and Vocational Education and Training, www.unevoc.unesco.org/tvetipedia.0.html?&tx_ drwiki_pi1%5Bkeyword%5D=Gender%20issues%20and%20TVET (accessed 1 June 2016).
World Bank (2017), World Bank World Development Indicators (database), Washington, DC, http://data.worldbank.org/ (accessed on 1 March 2017).
World Bank (2015), Social Protection for the Harder Road Ahead: Containing the social costs of lower growth in Latin America and the Caribbean, Washington, DC.
World Bank (2013), “Shifting gears to accelerate shared prosperity in Latin America and the Caribbean”, in Latin America and the Caribbean Poverty and Labor Brief, World Bank, Washington, DC.
World Bank ASPIRE (2016), ASPIRE: The Atlas of Social Protection Indicators of Resilience and Equity (database), http://datatopics.worldbank.org/aspire/ (accessed on 1 March 2016).
WBES (2010), World Bank Enterprise Survey 2010 (database), World Bank, Washington, DC, www.enterprise surveys.org/data (accessed on 1 March 2016).
Notes
← 1. In 2015 PISA tests, performance in education was only available for the City of Buenos Aires and not in Argentina as in previous rounds of PISA tests.
← 2. Students at proficiency levels 5 or 6 are able to draw on and use information from multiple and indirect sources to solve complex problems in mathematics; critically evaluate texts and understand details the content or form of which is unfamiliar when reading; and identify thescientific components of many complex life situations and compare, select and evaluate appropriate scientific evidence for responding to these situations. They will be at the forefront of a competitive knowledge-based global economy (OECD, 2012b).