Statistical Annex

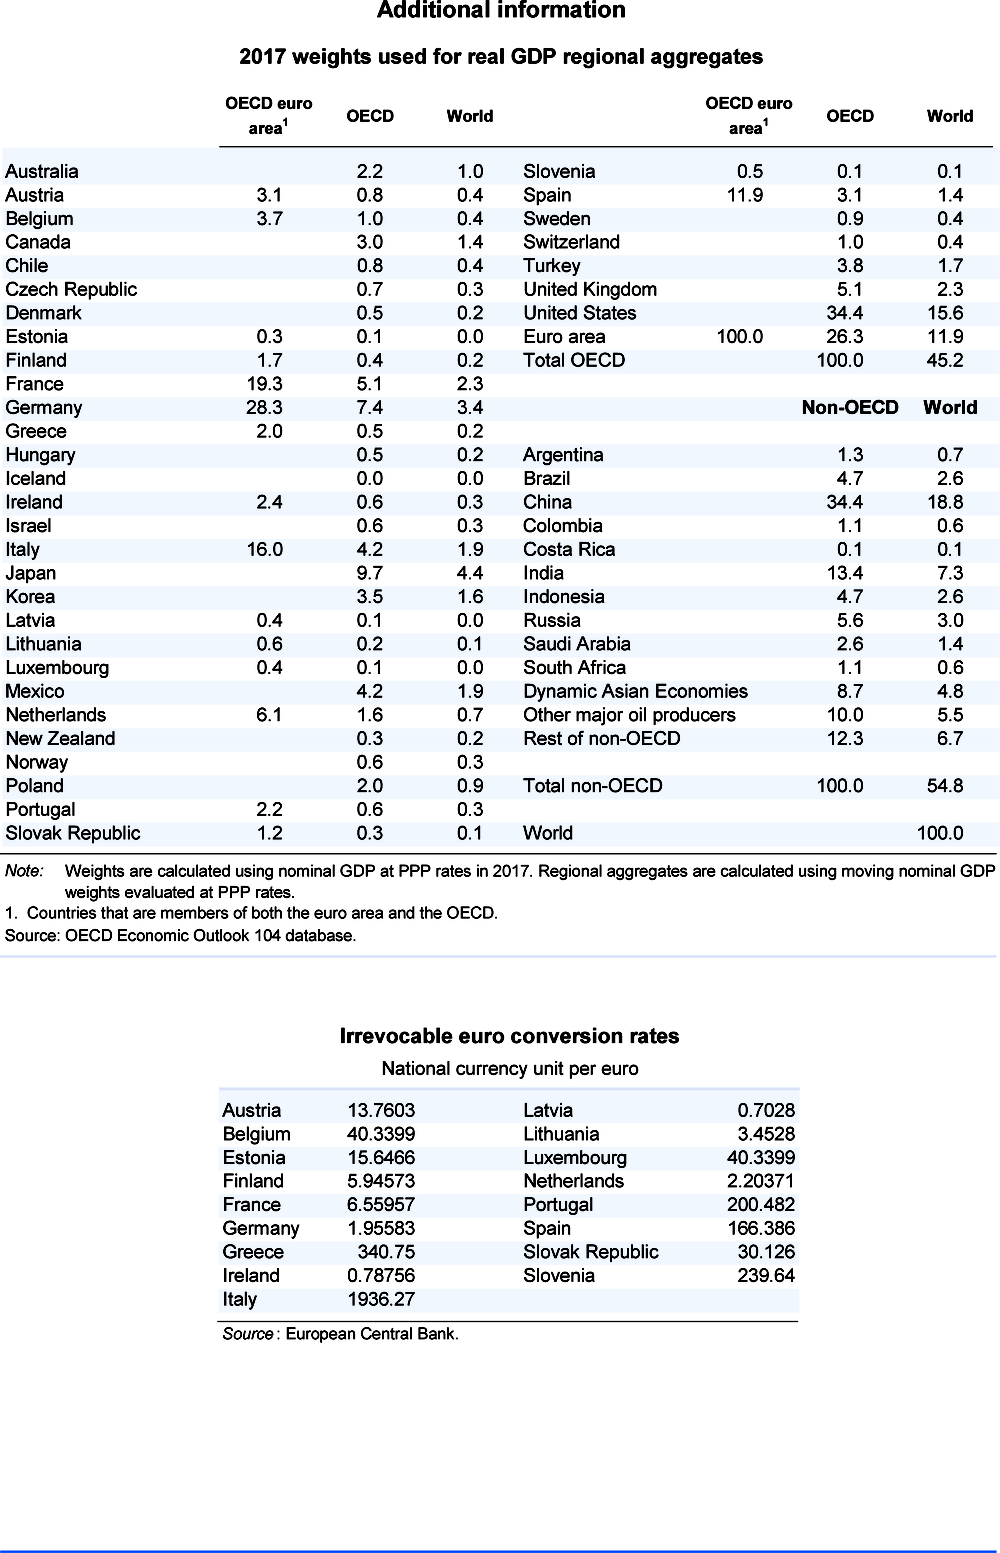
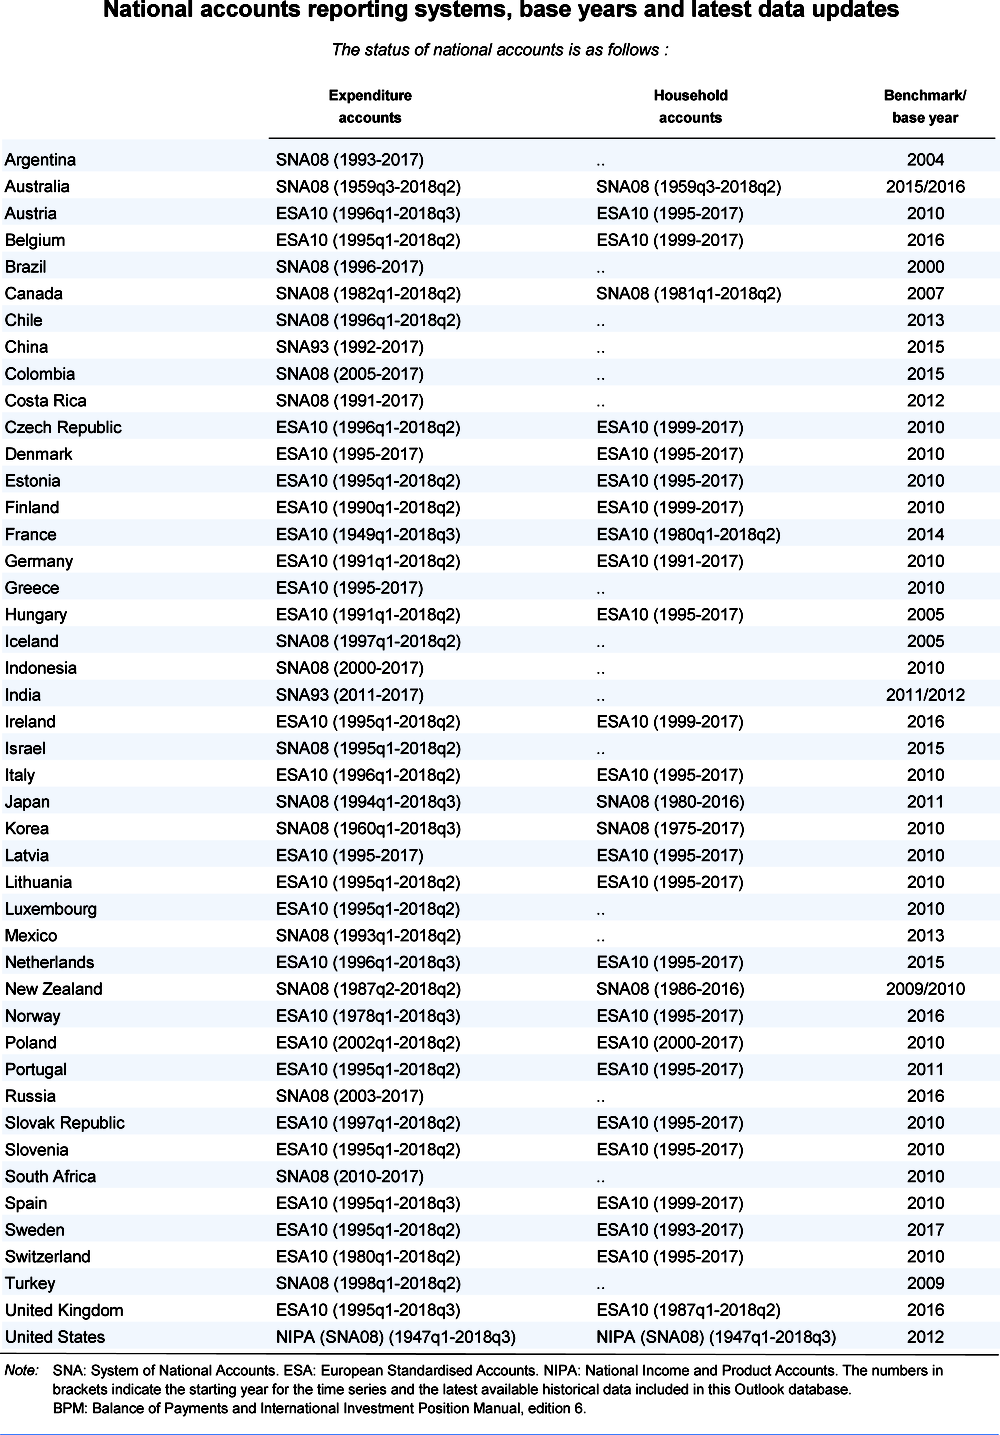
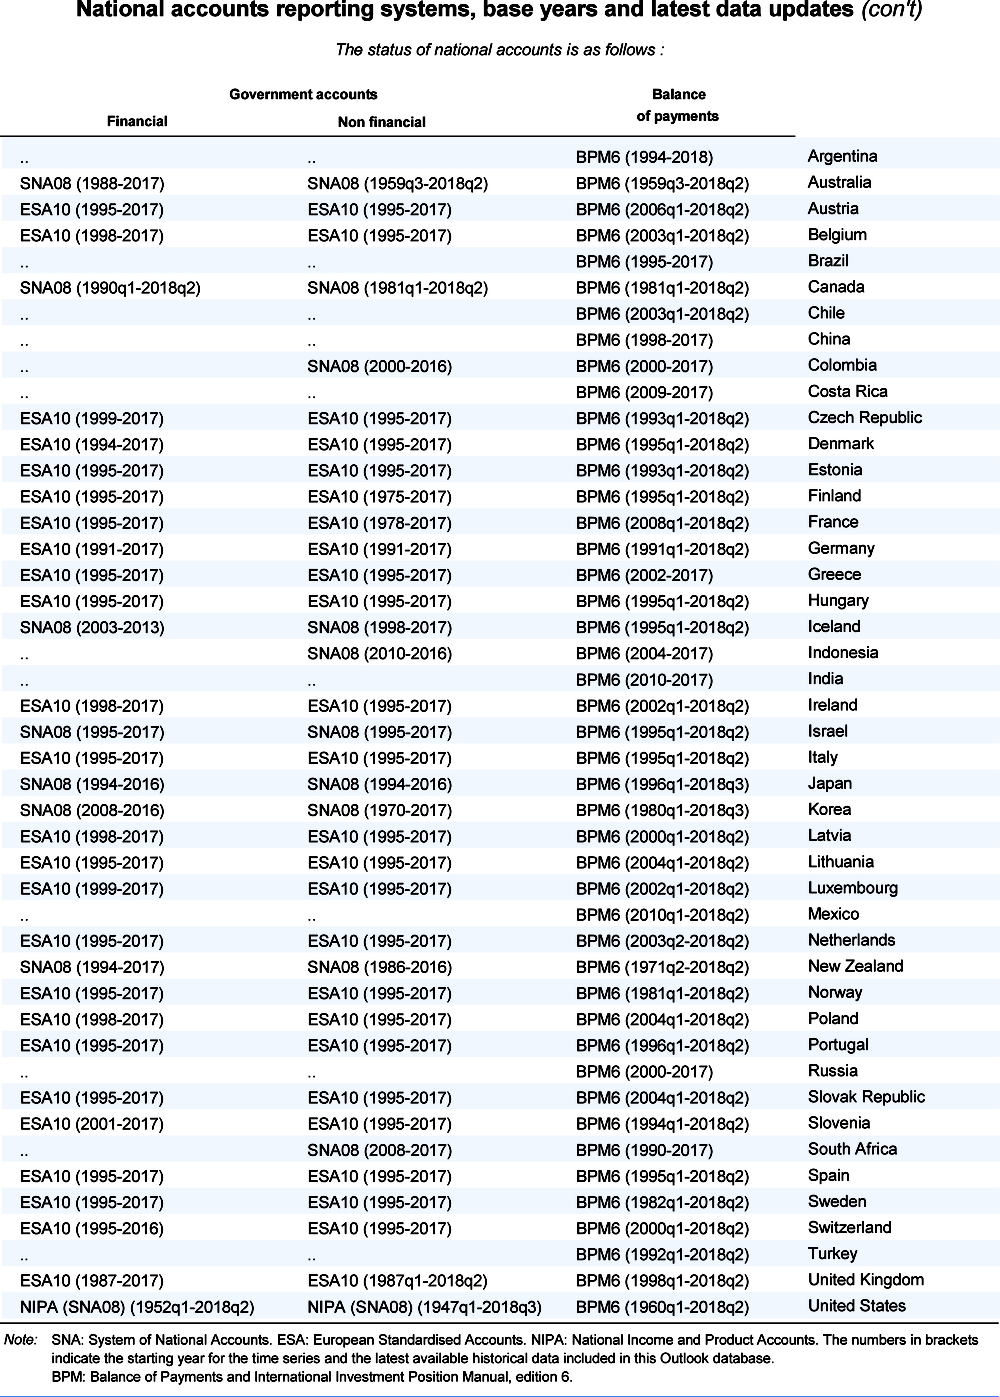
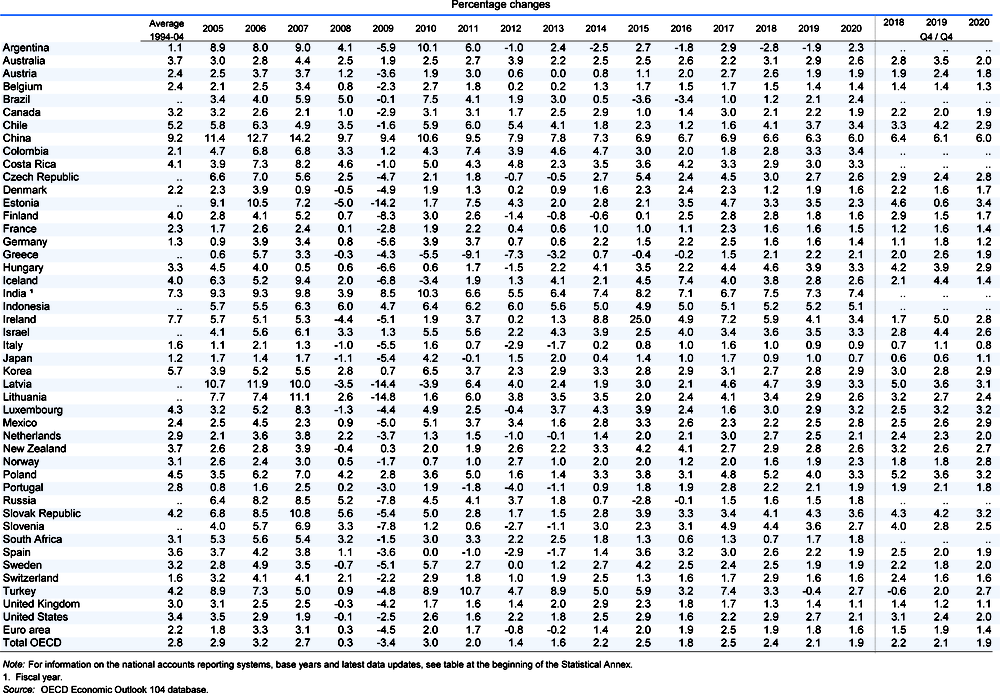
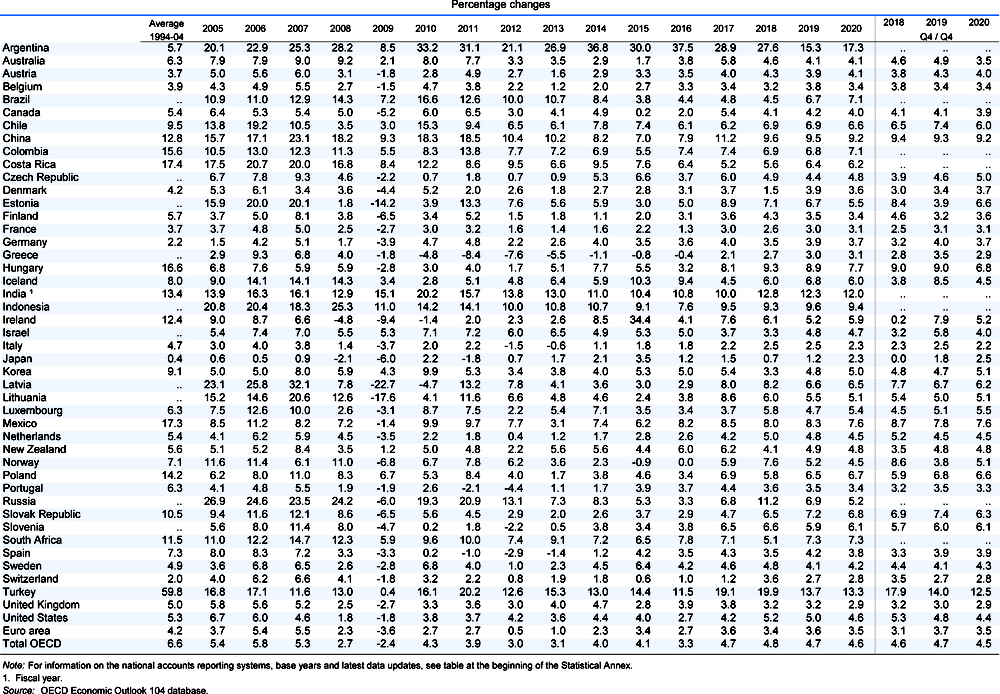
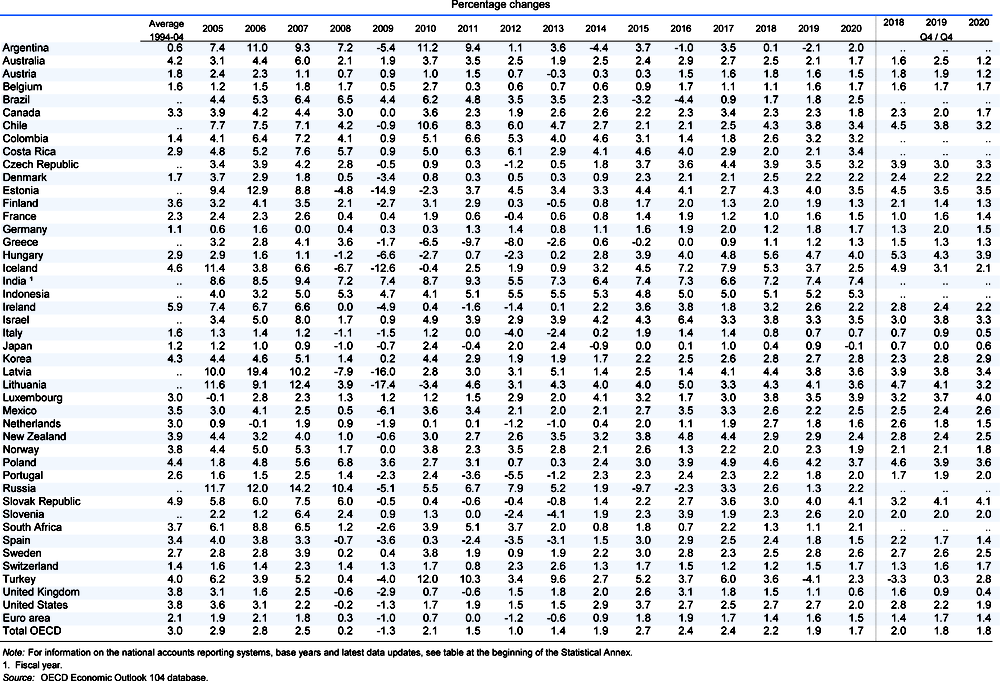
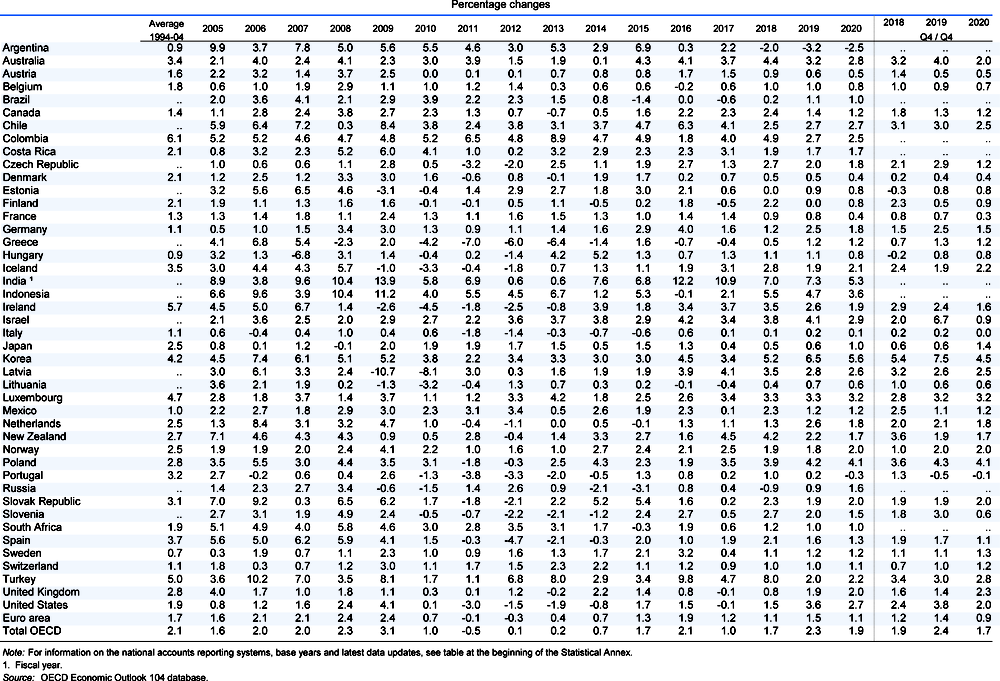
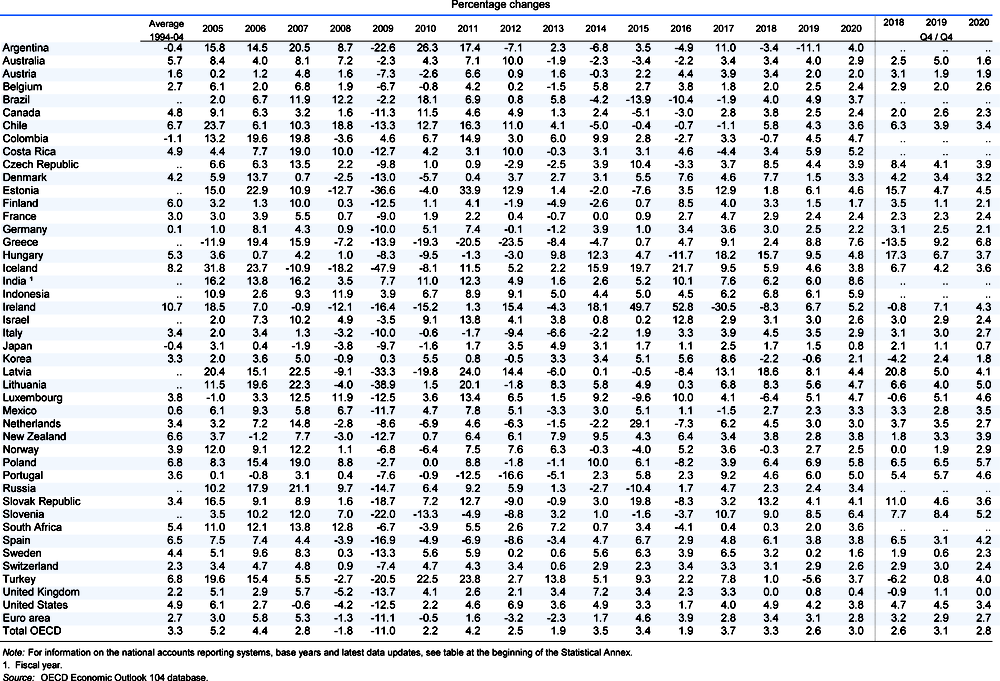
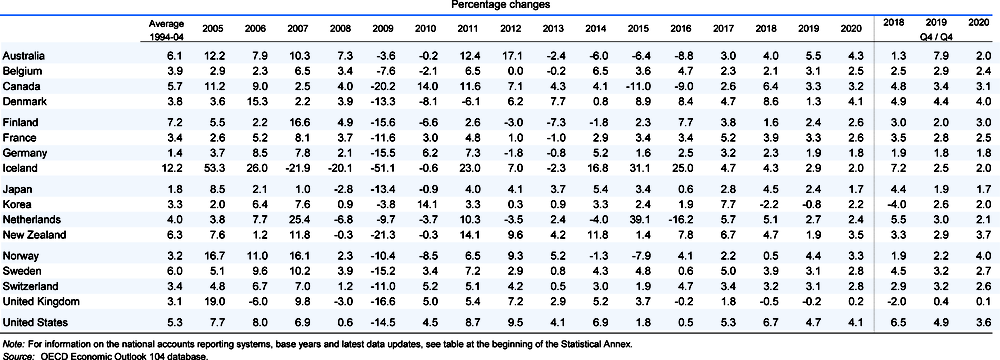
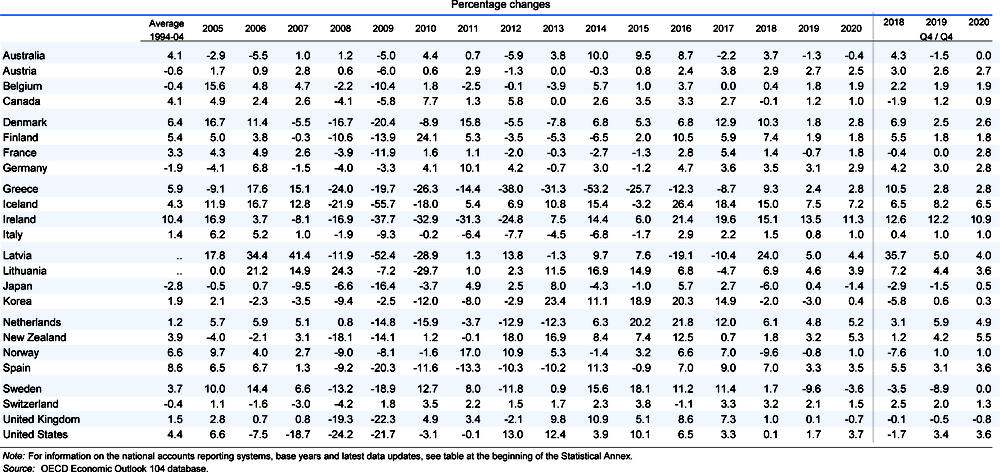
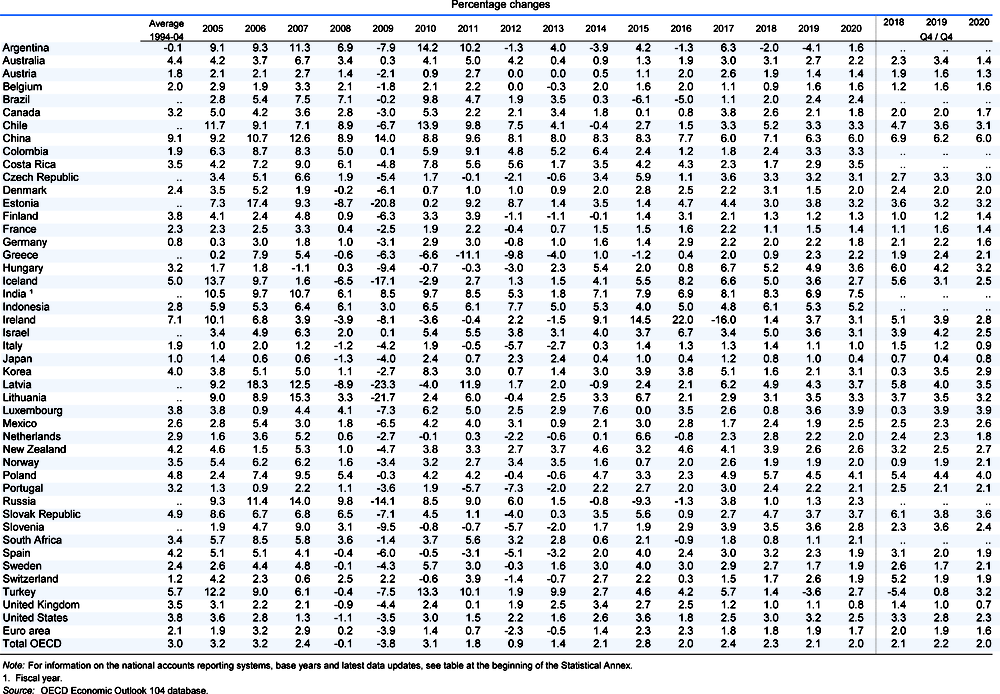
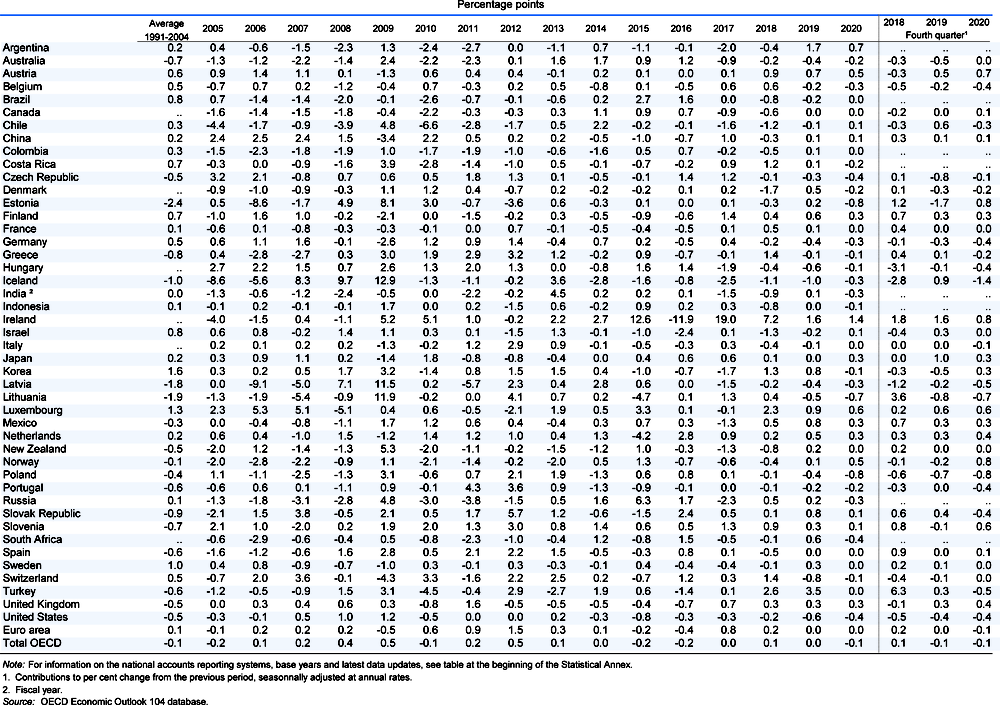
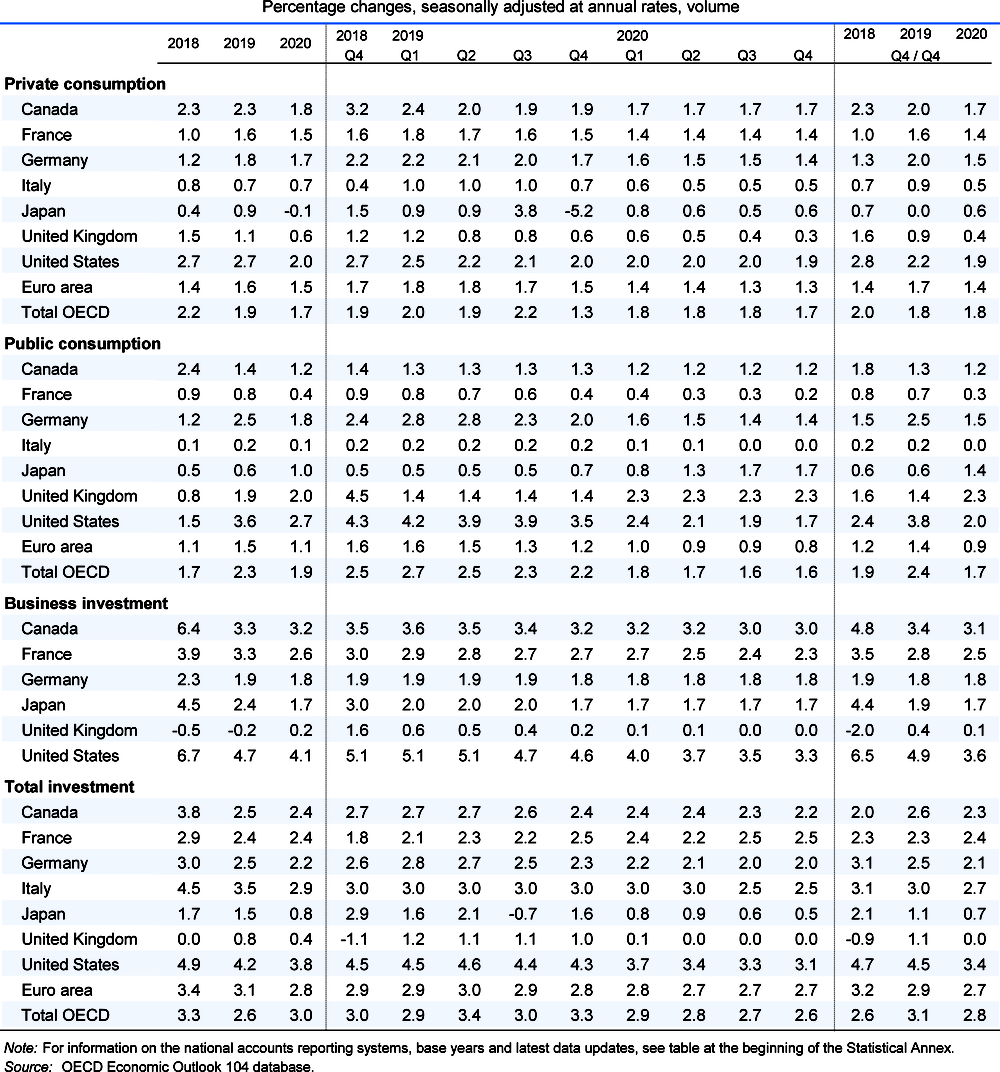
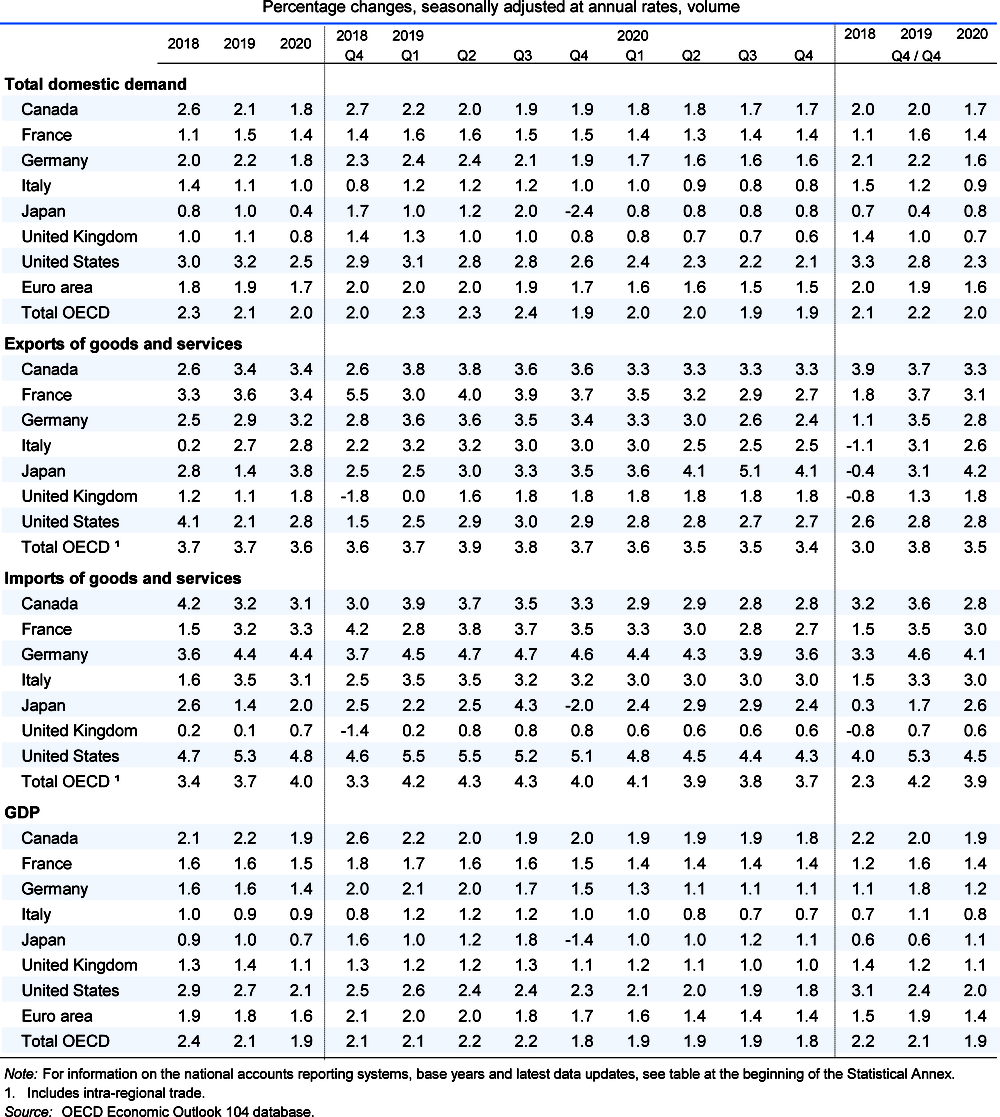
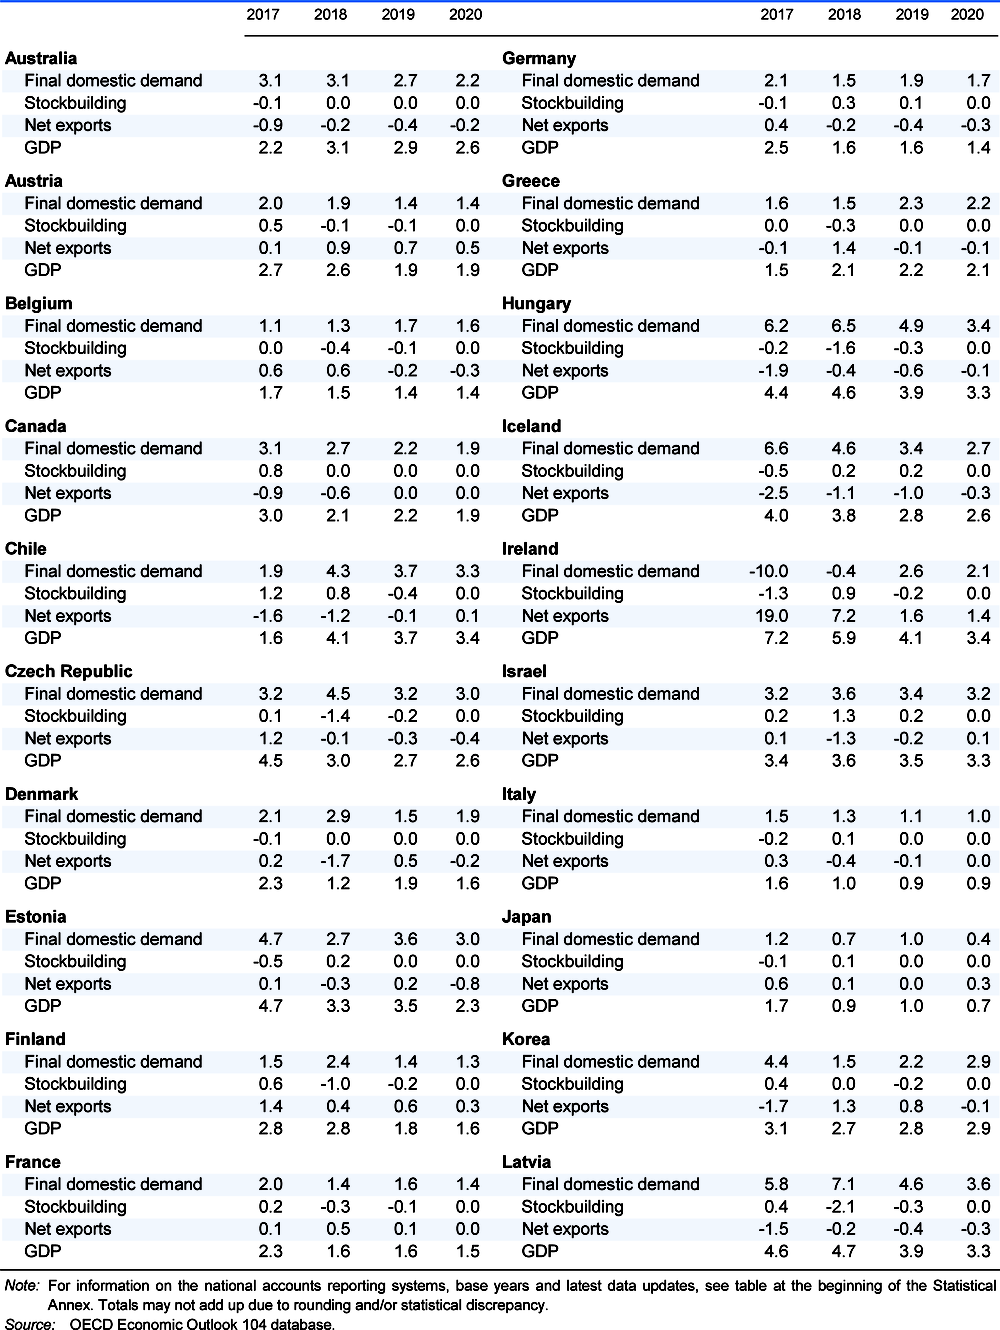
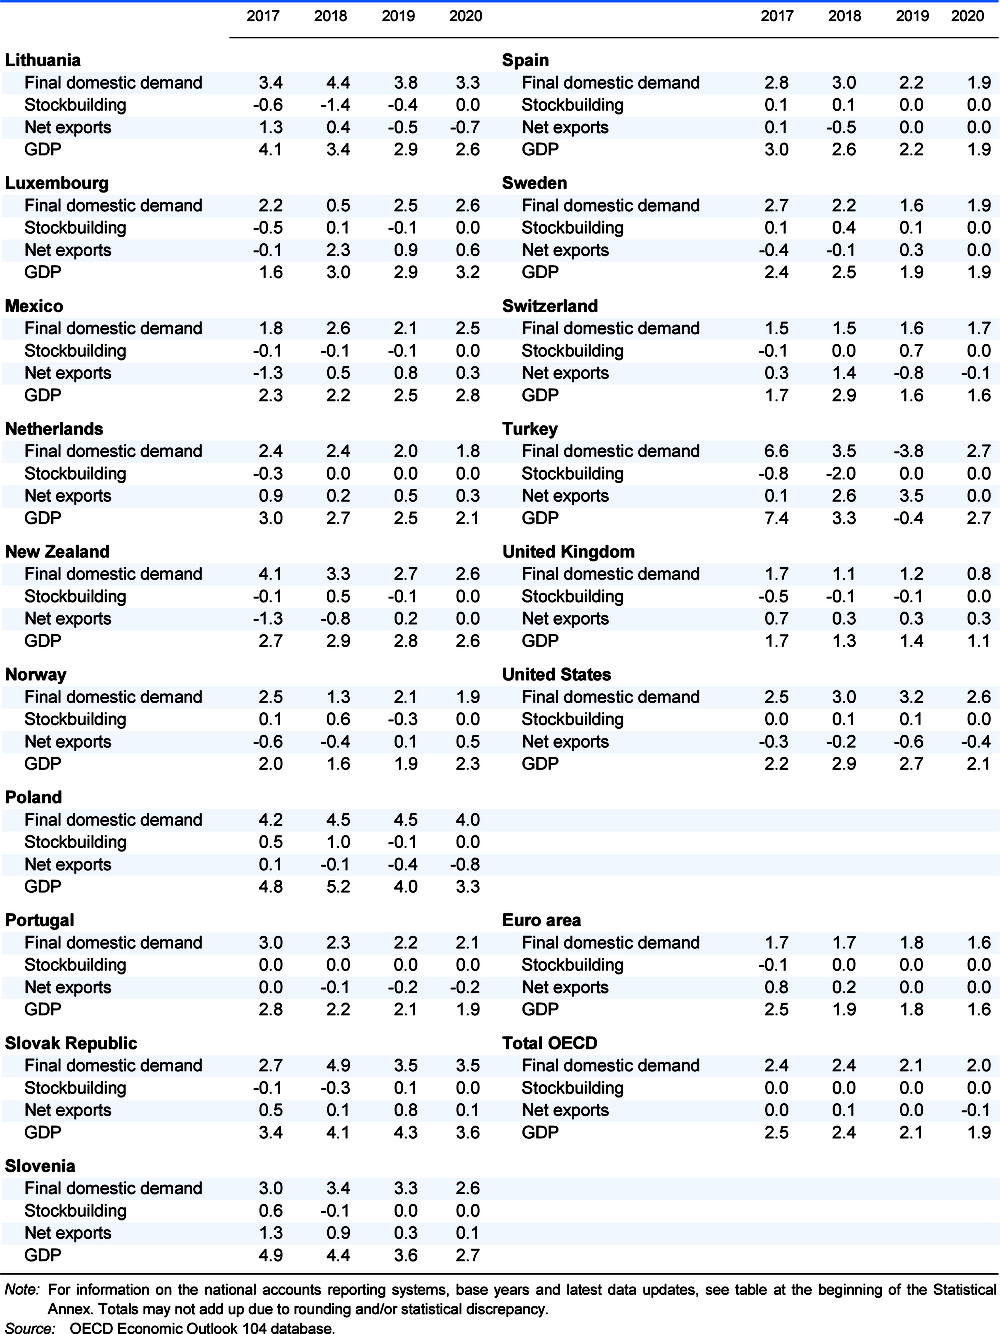
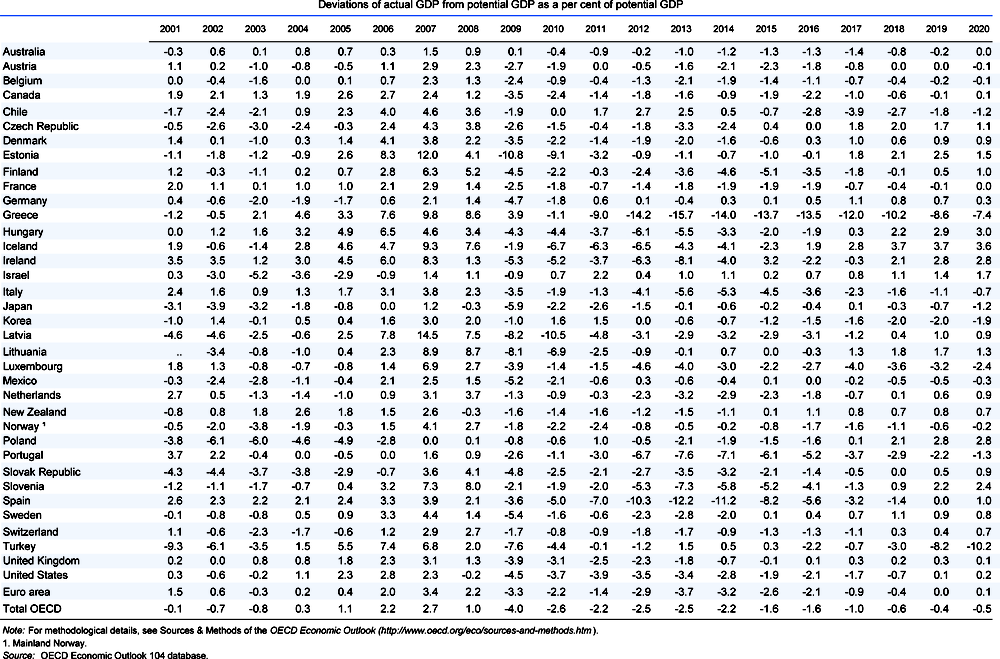
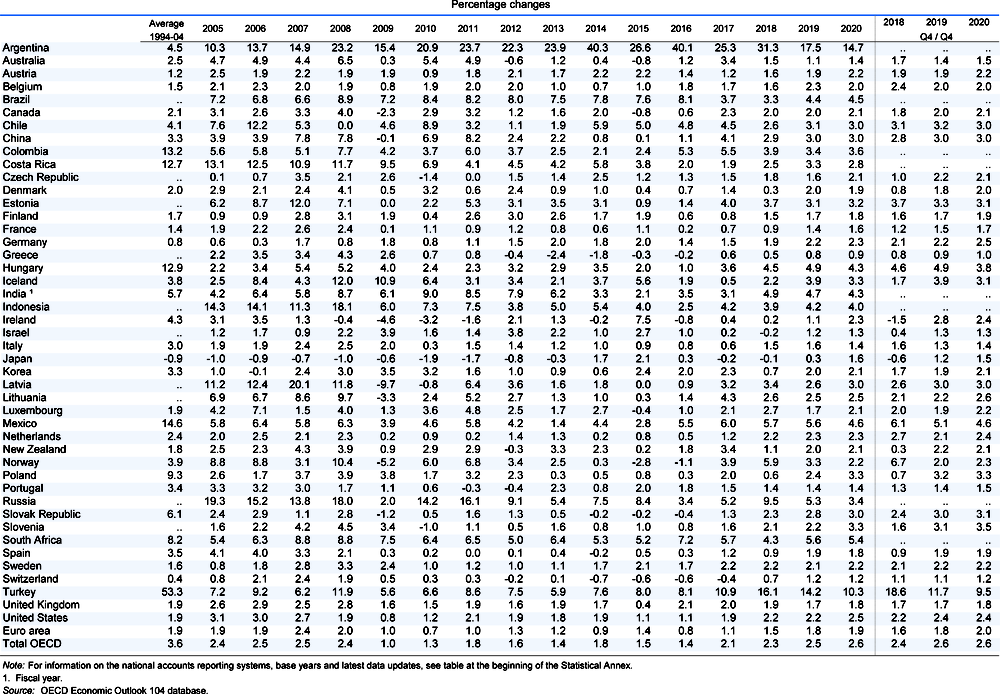
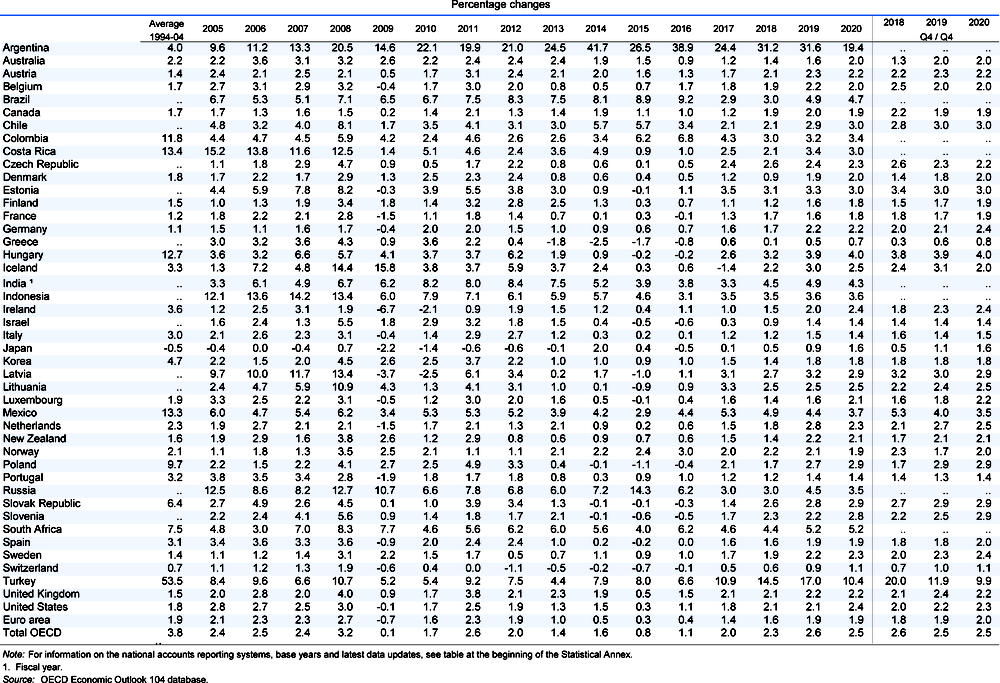
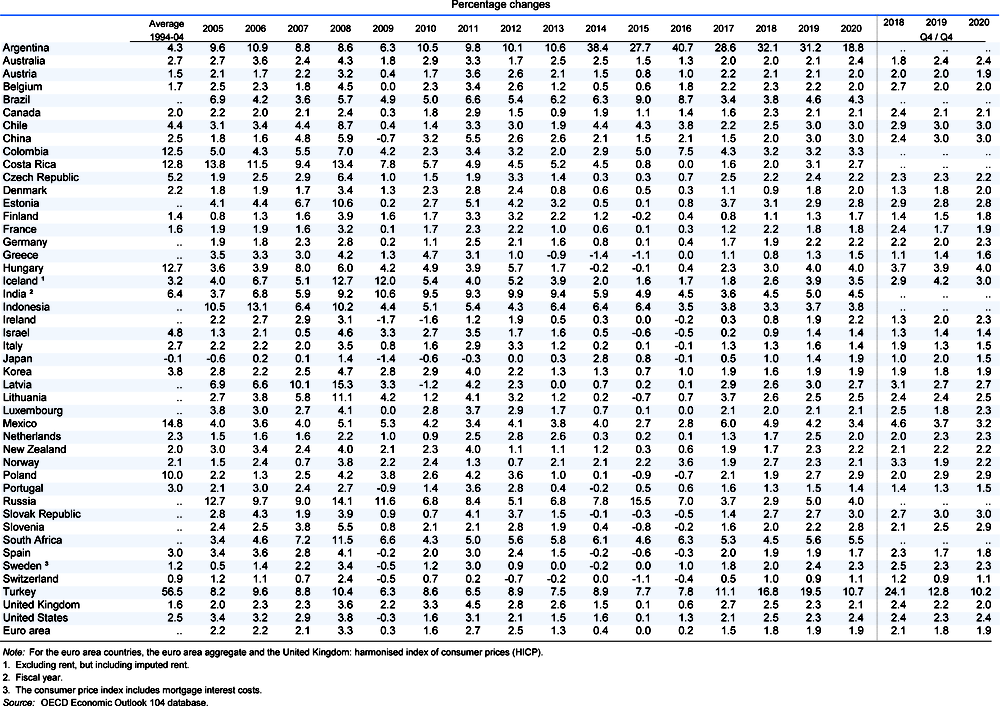
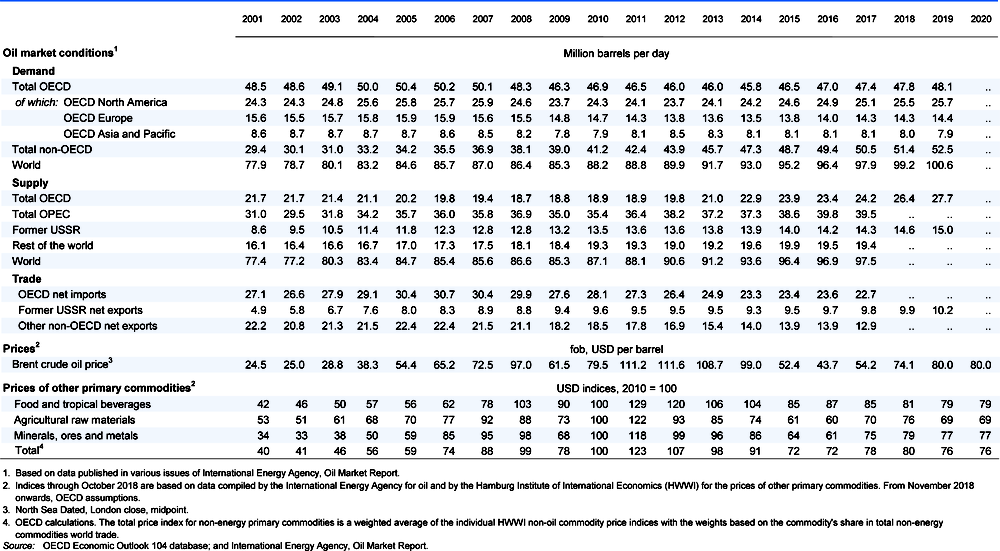
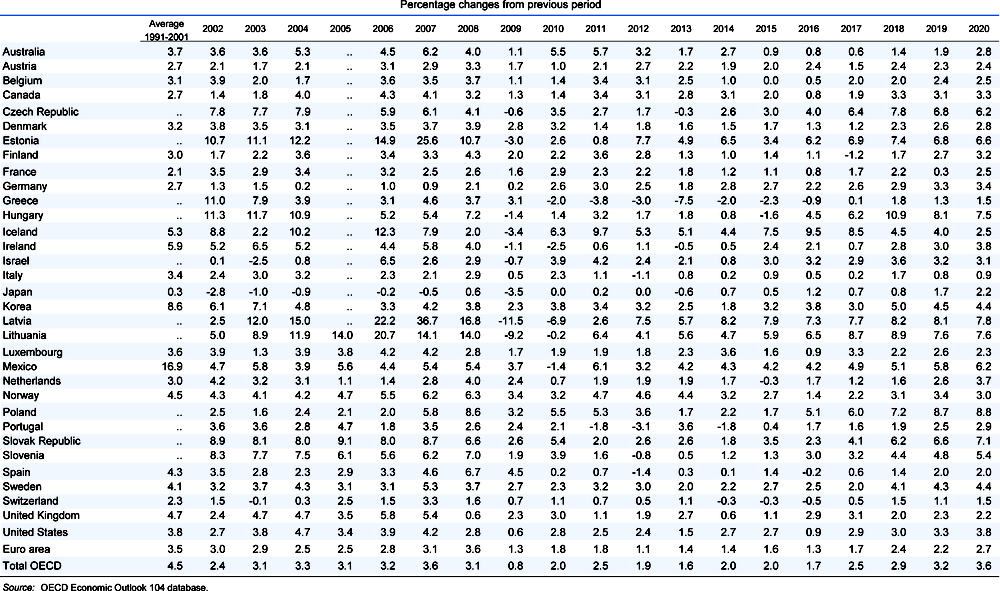
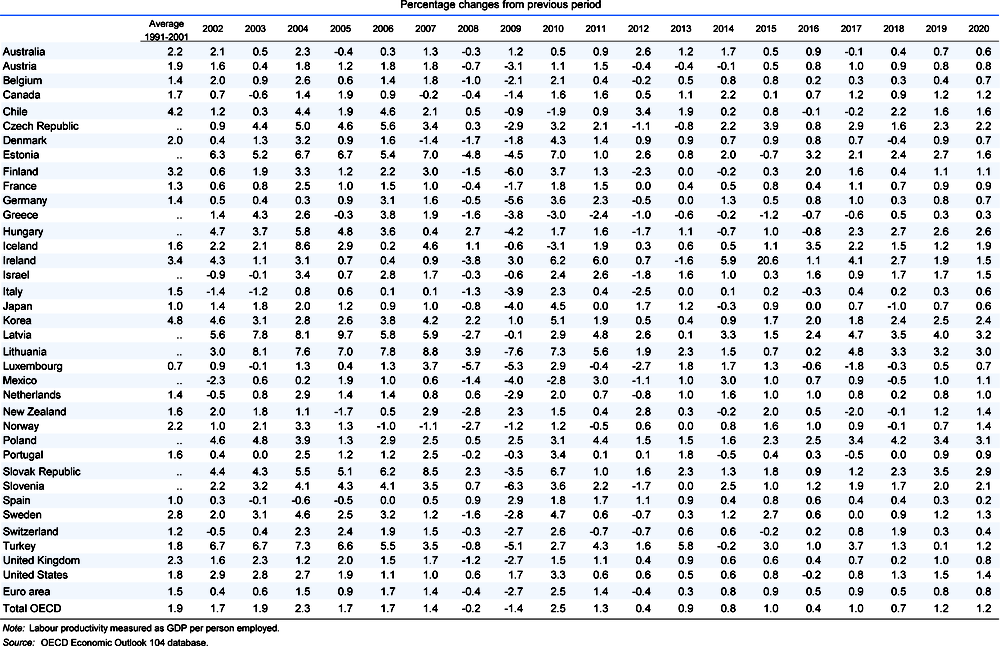
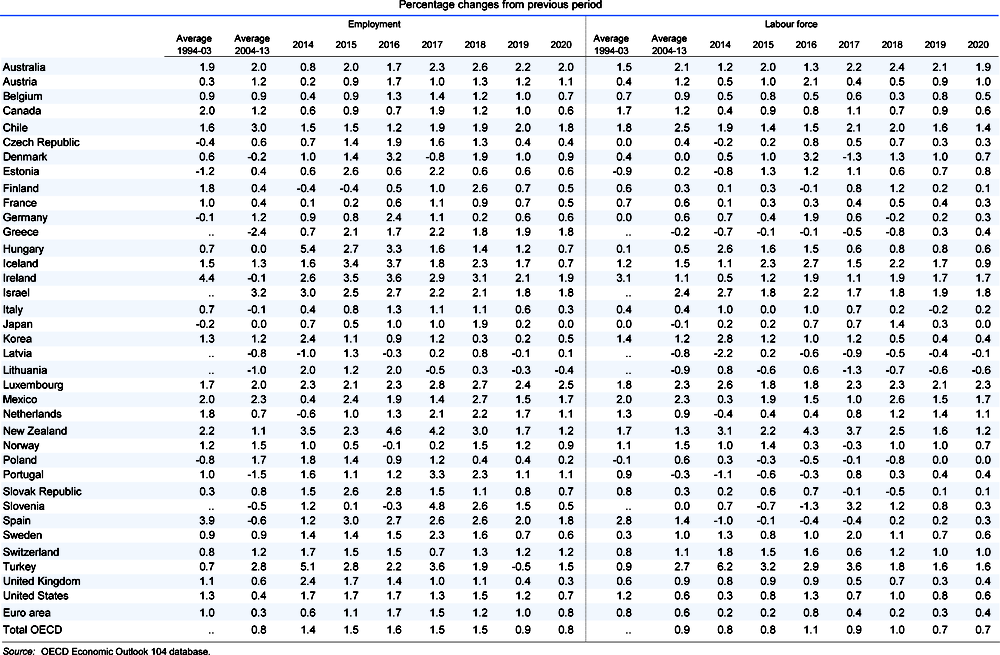
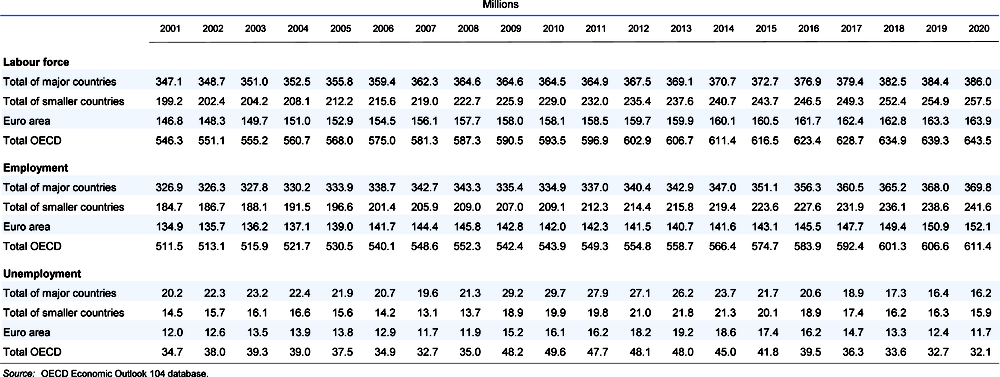
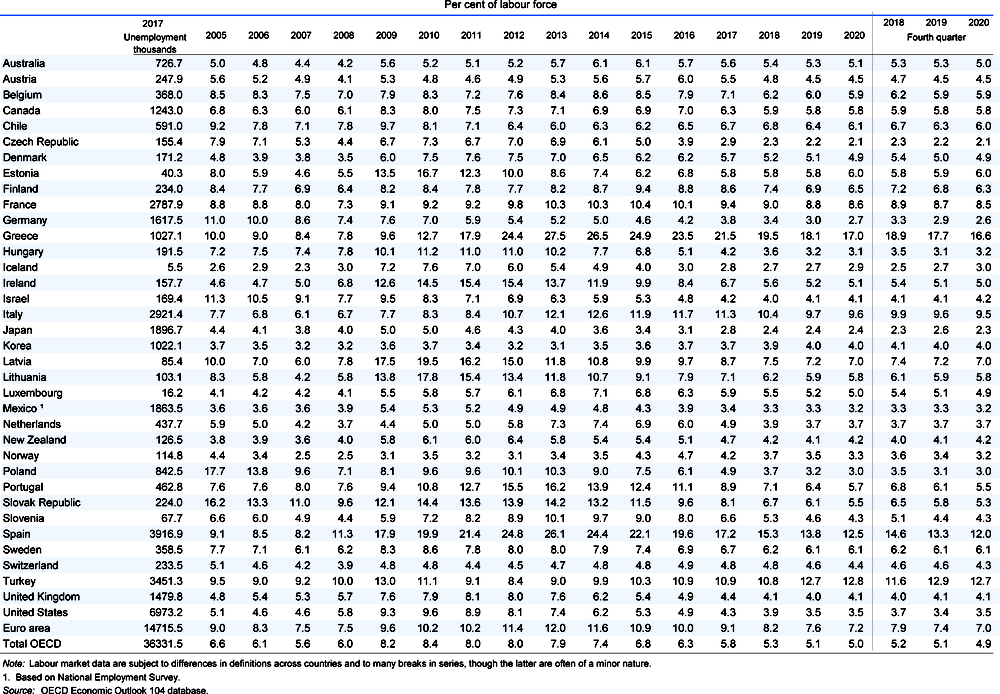
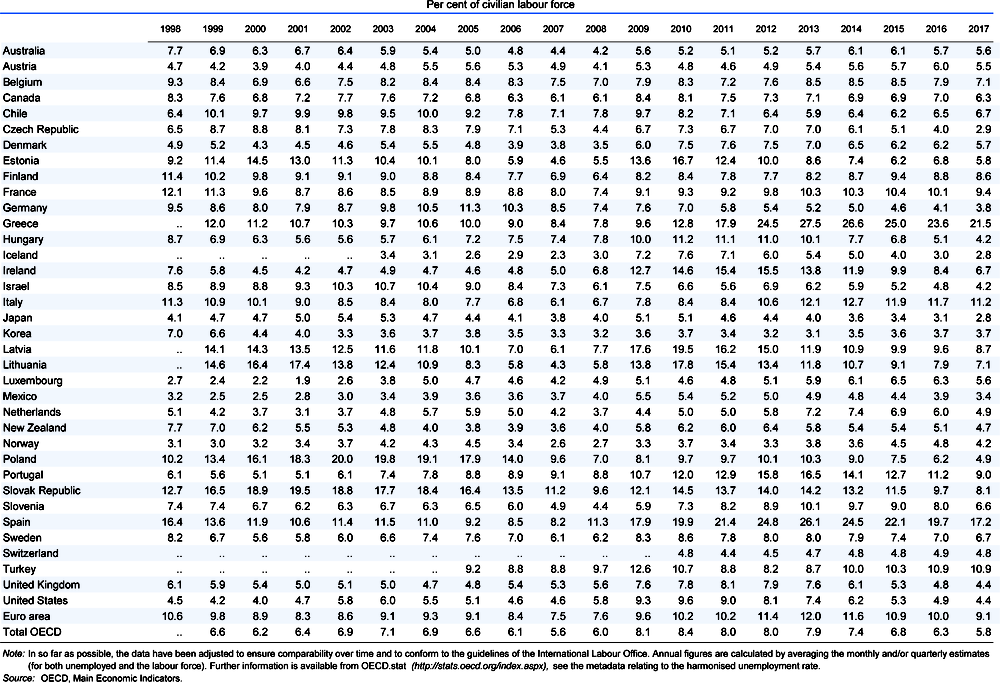
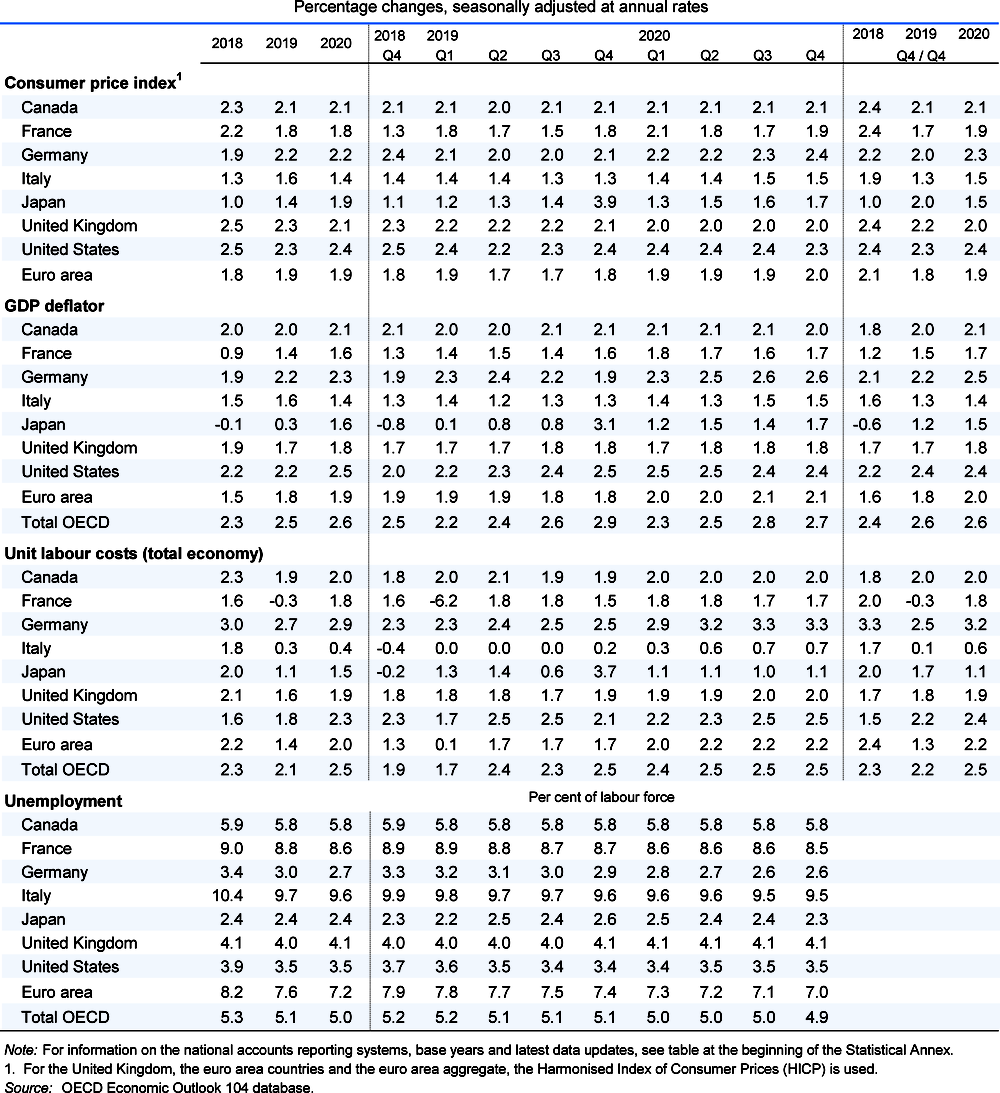
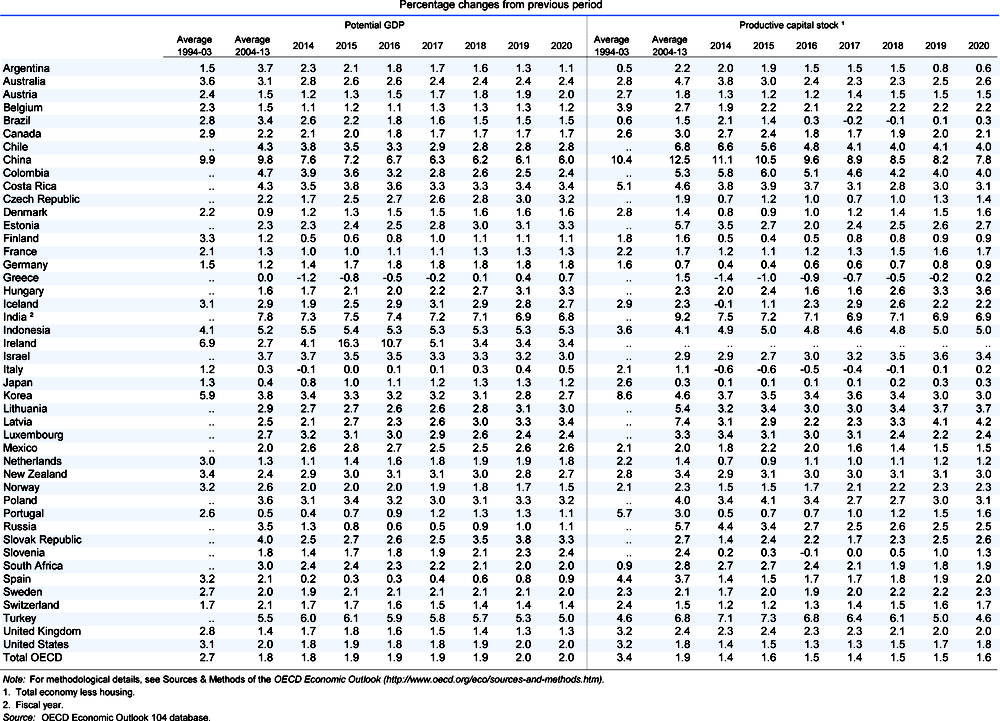
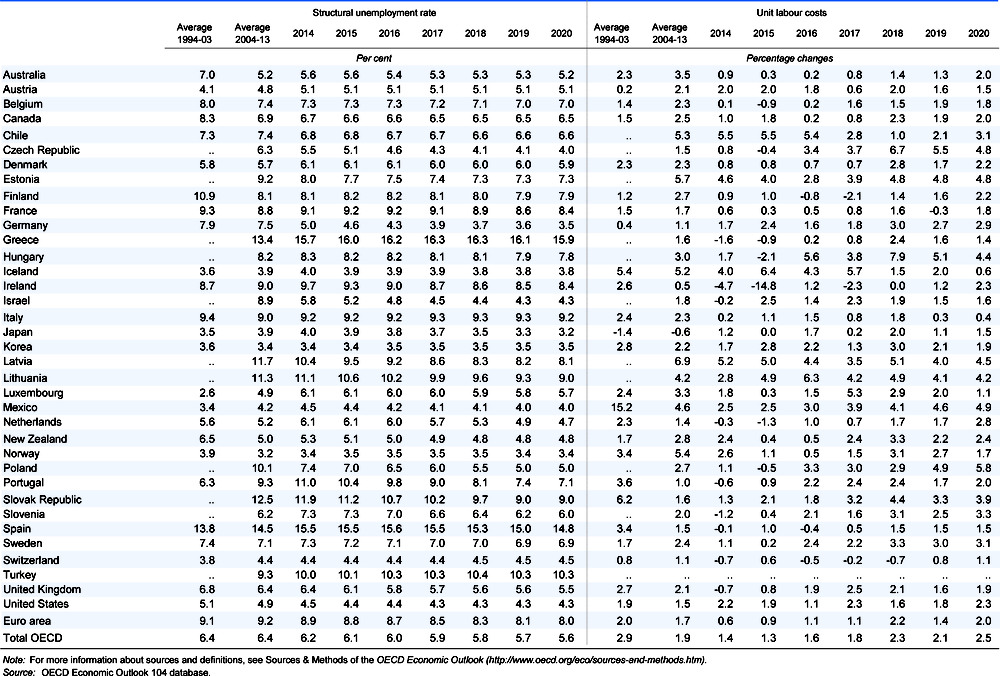
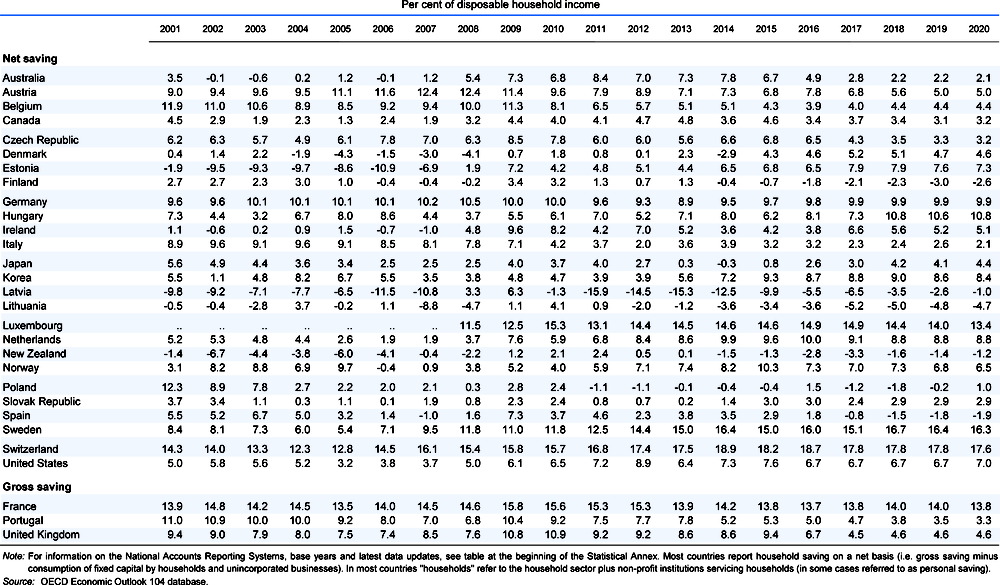
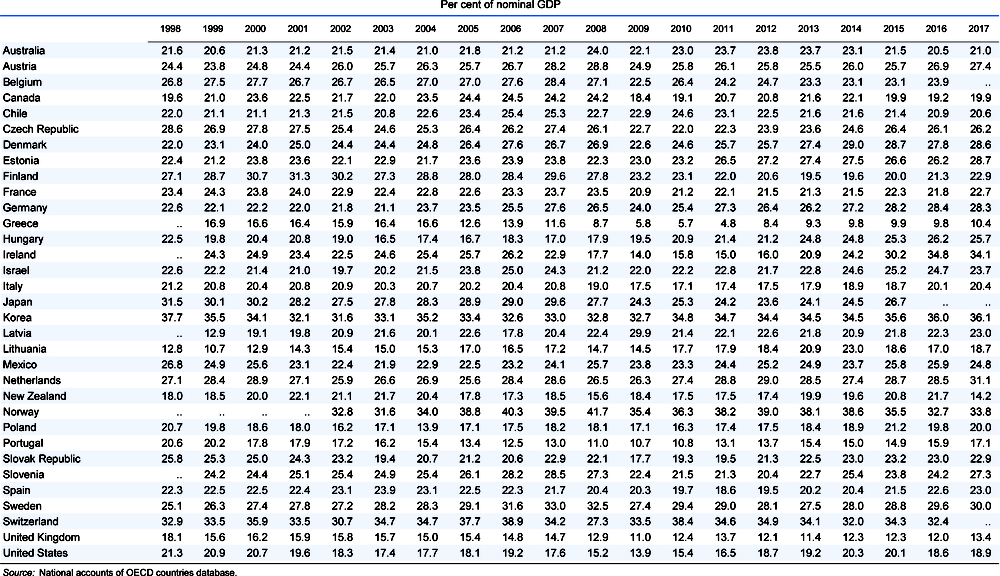
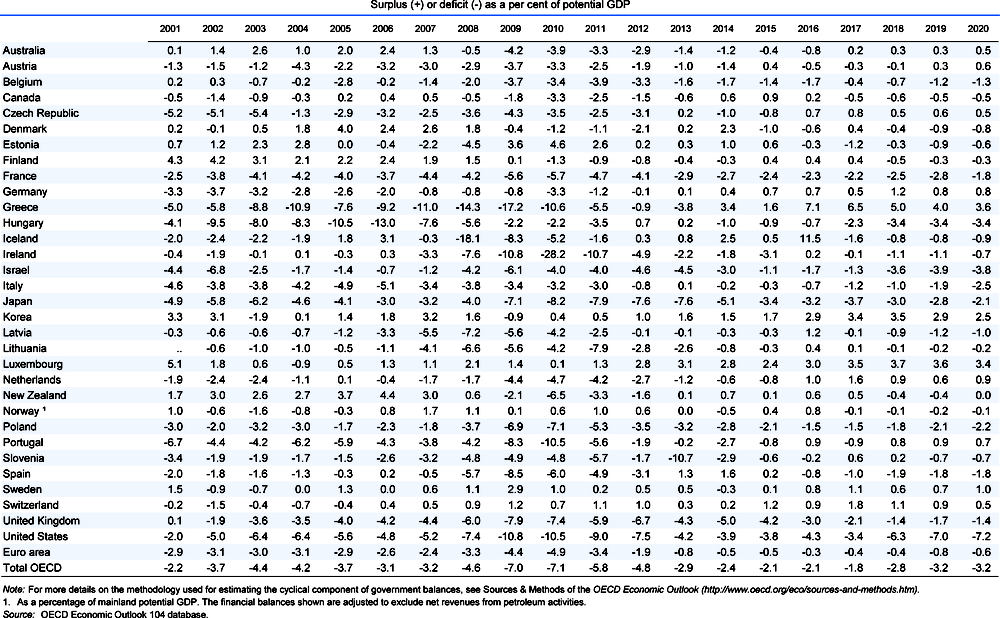
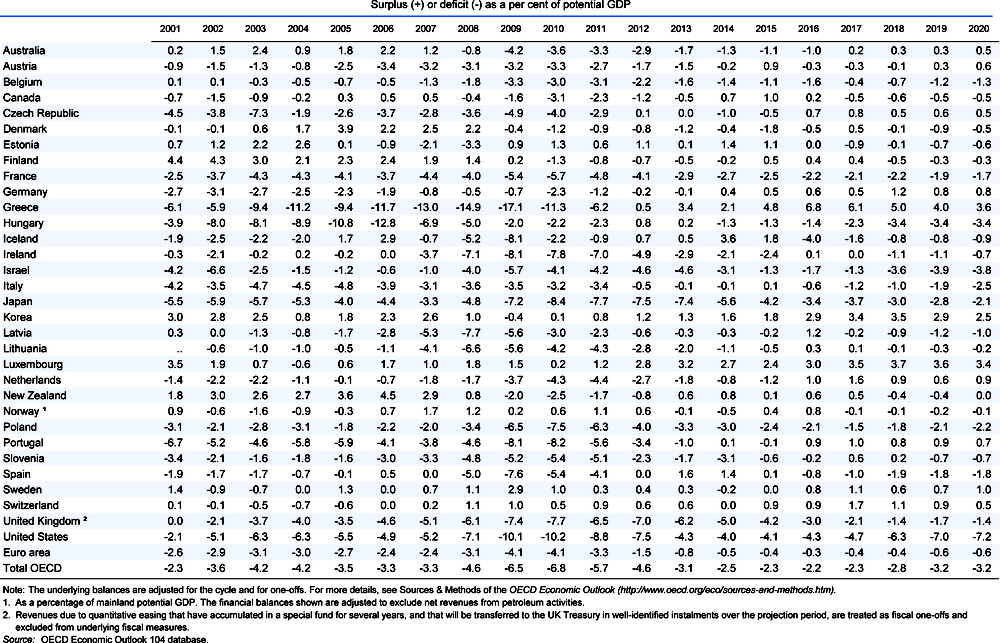
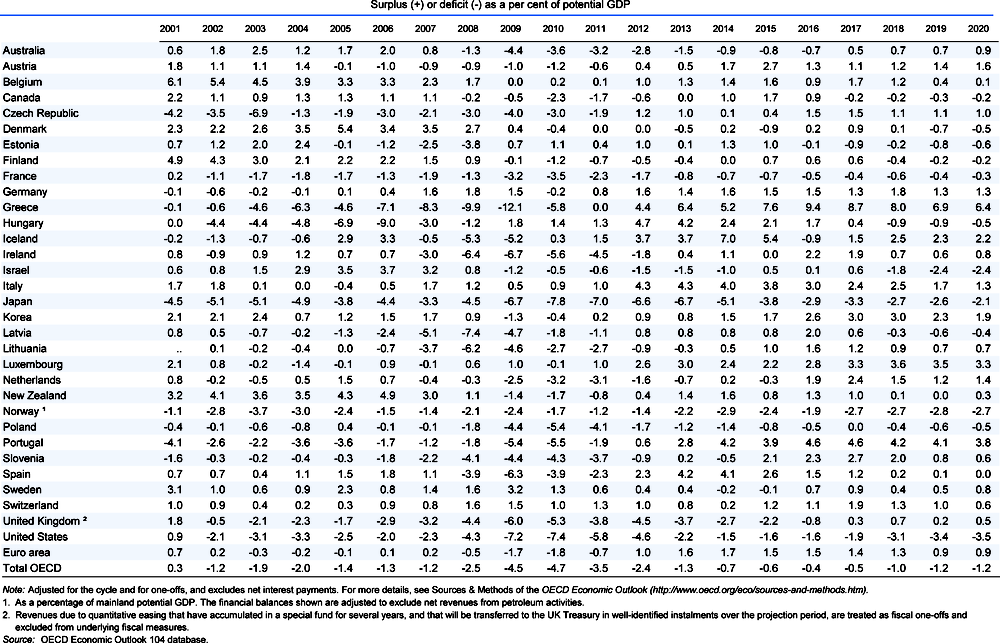
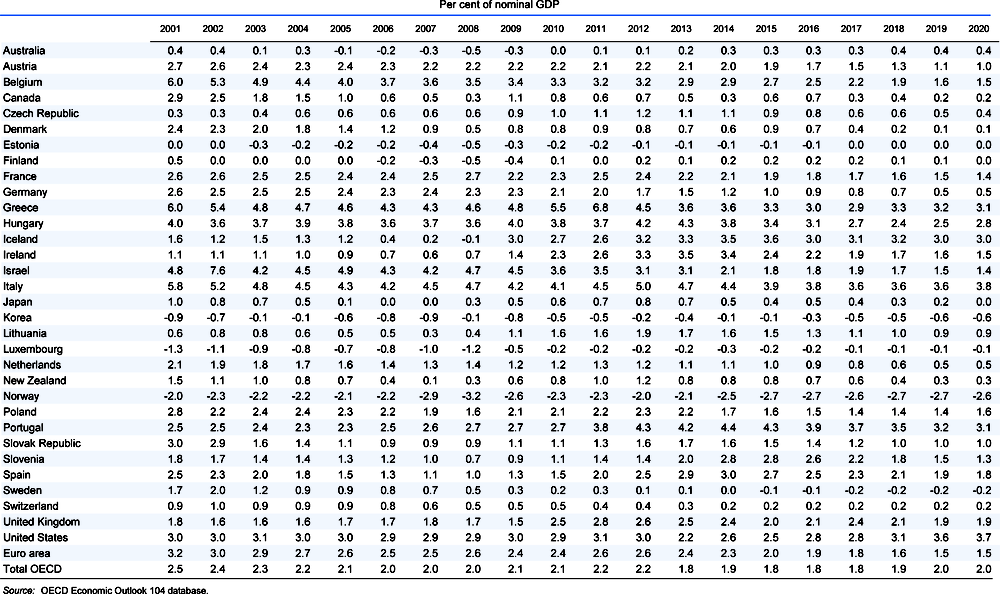
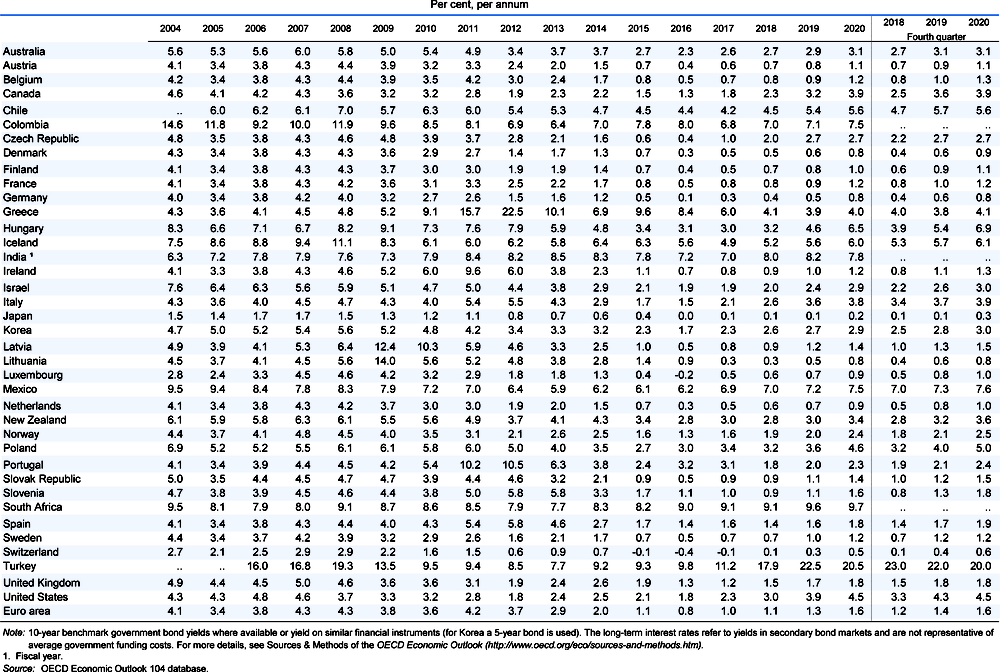
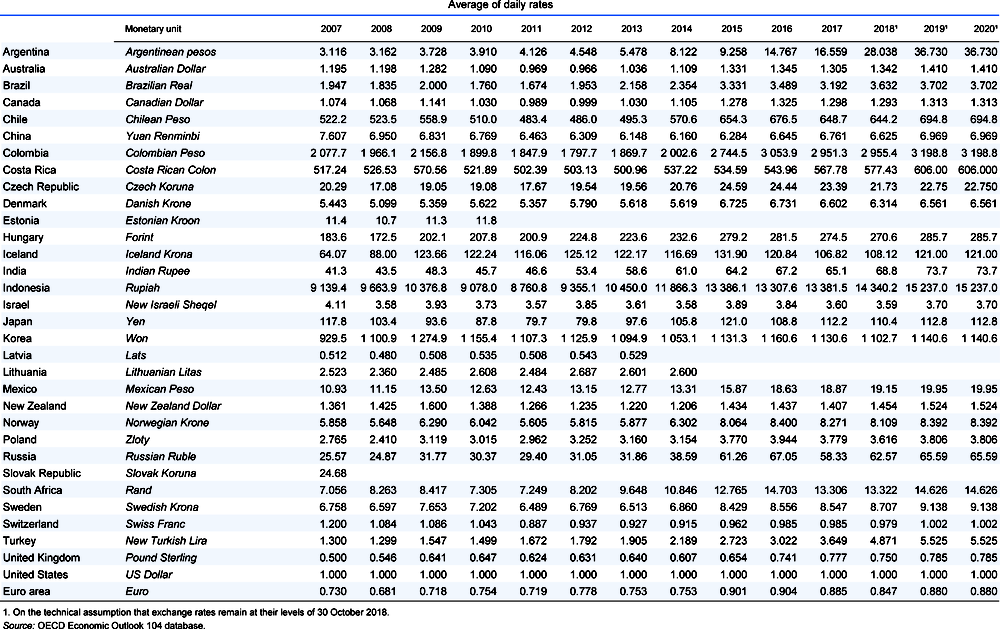
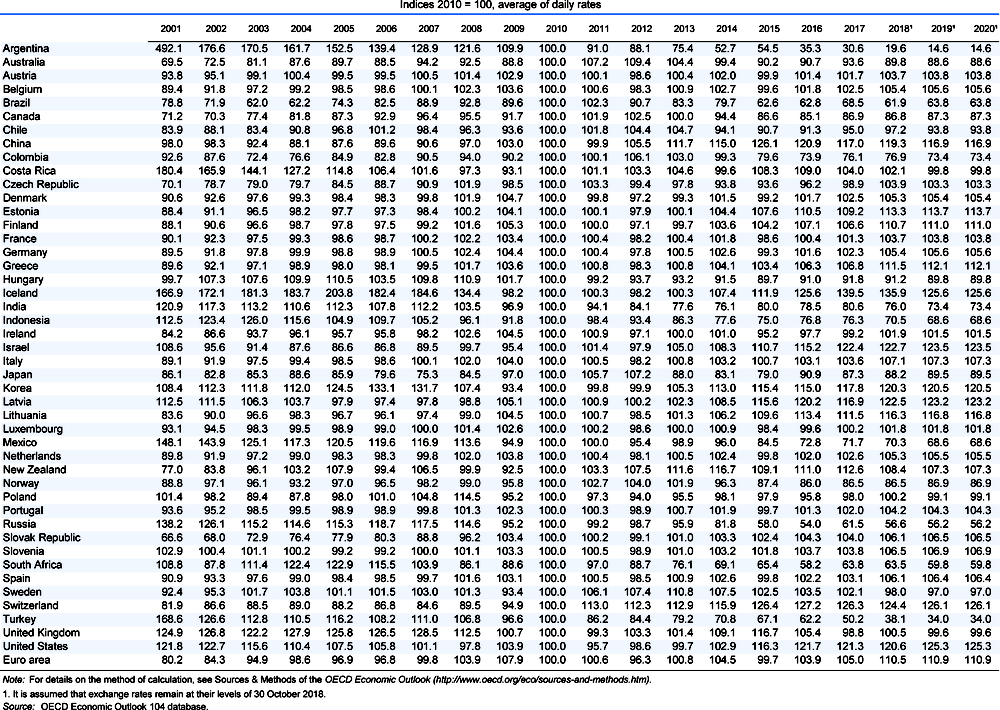
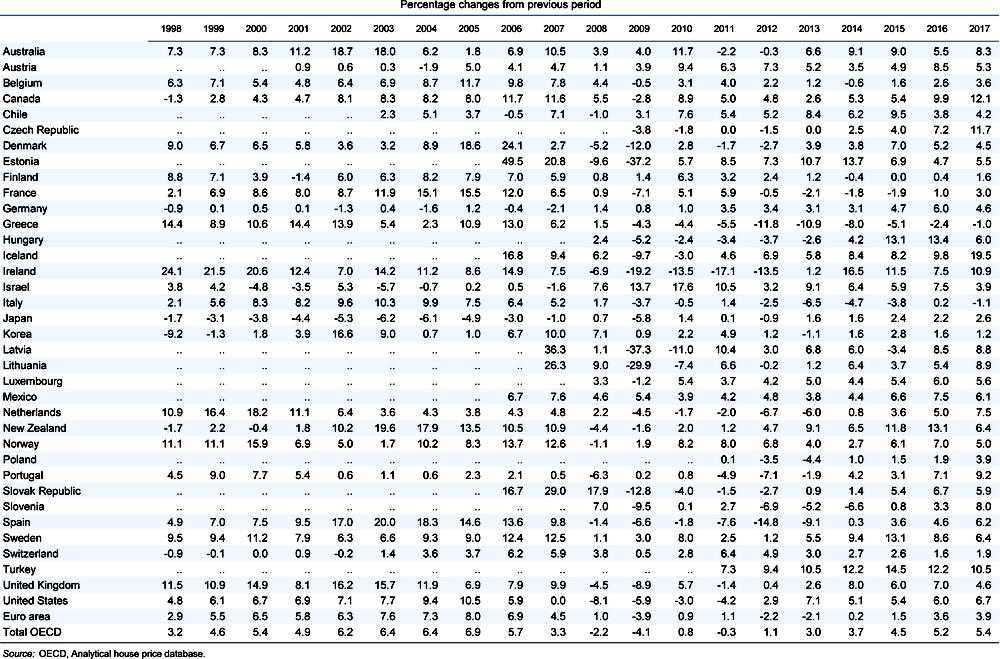
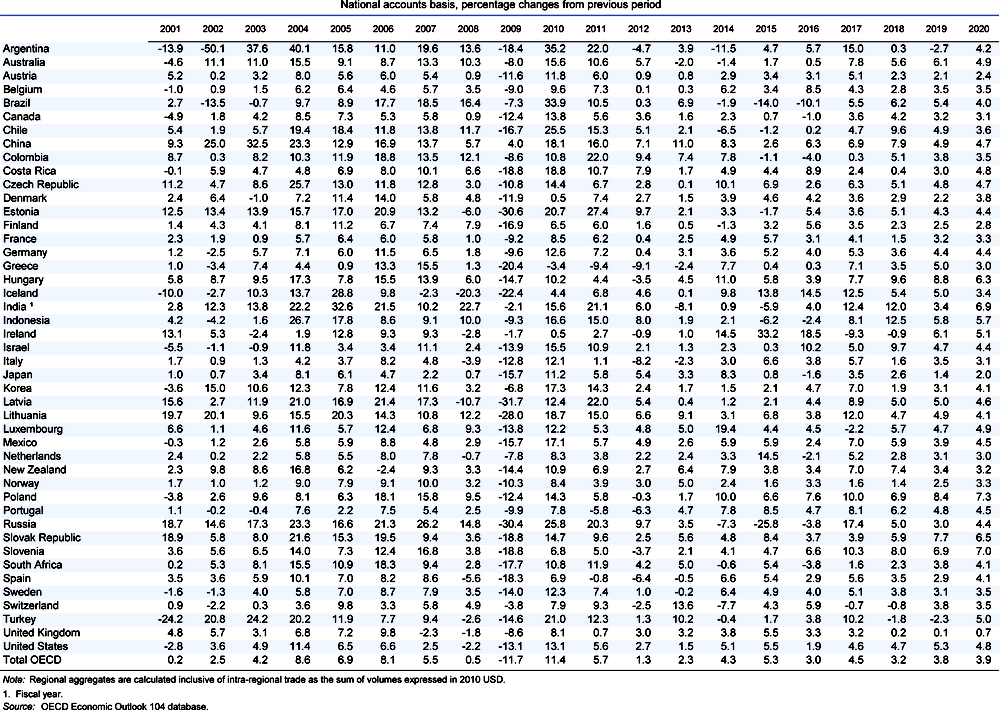
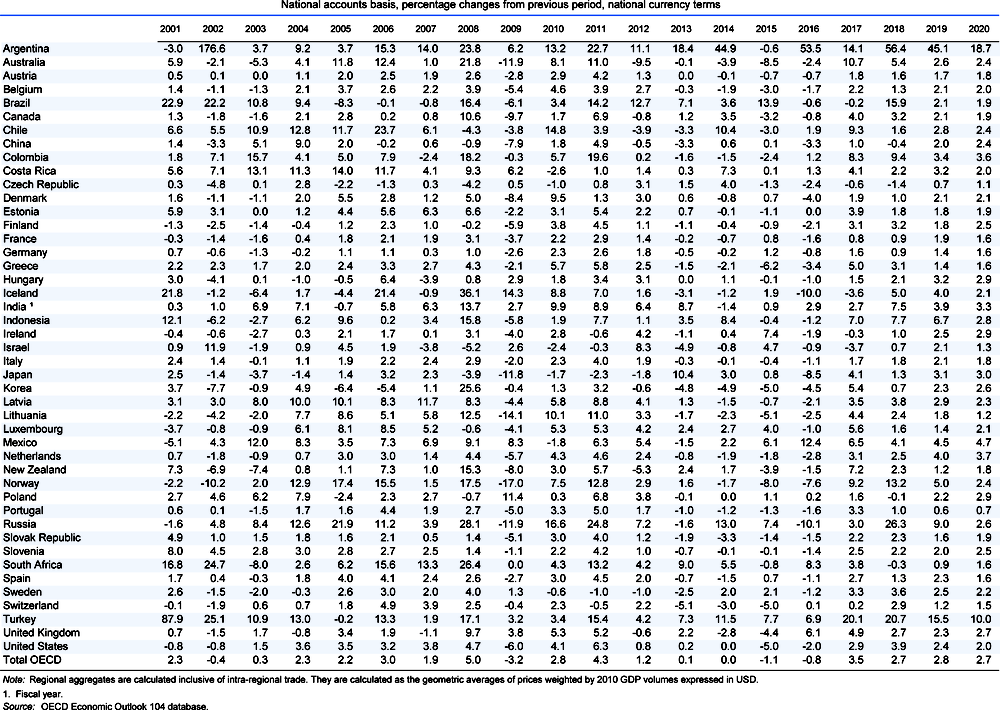
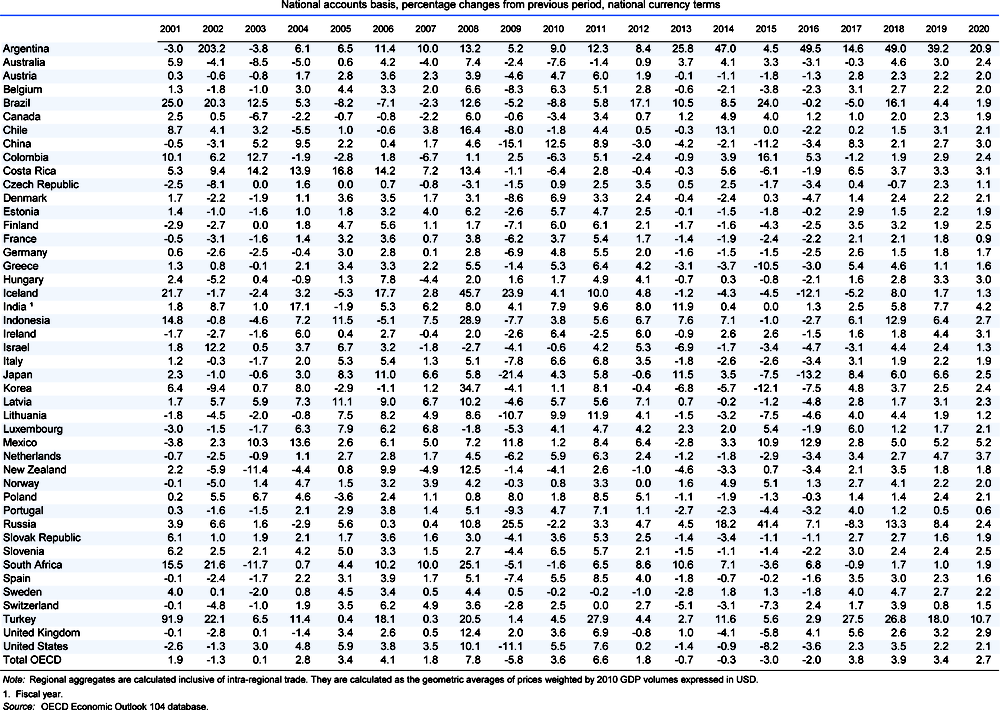
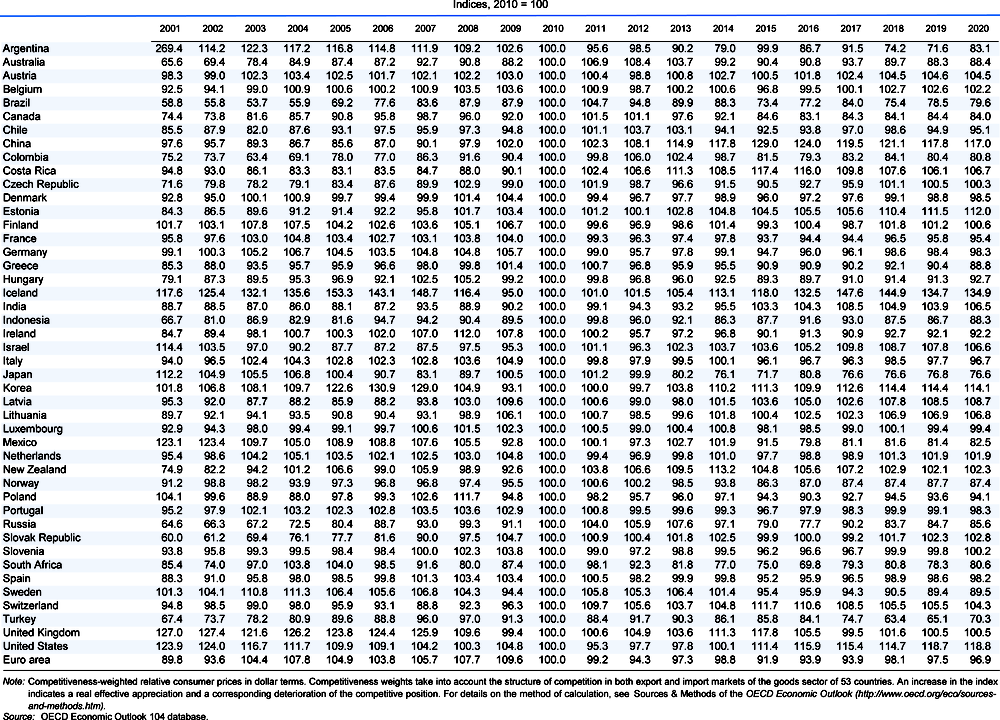
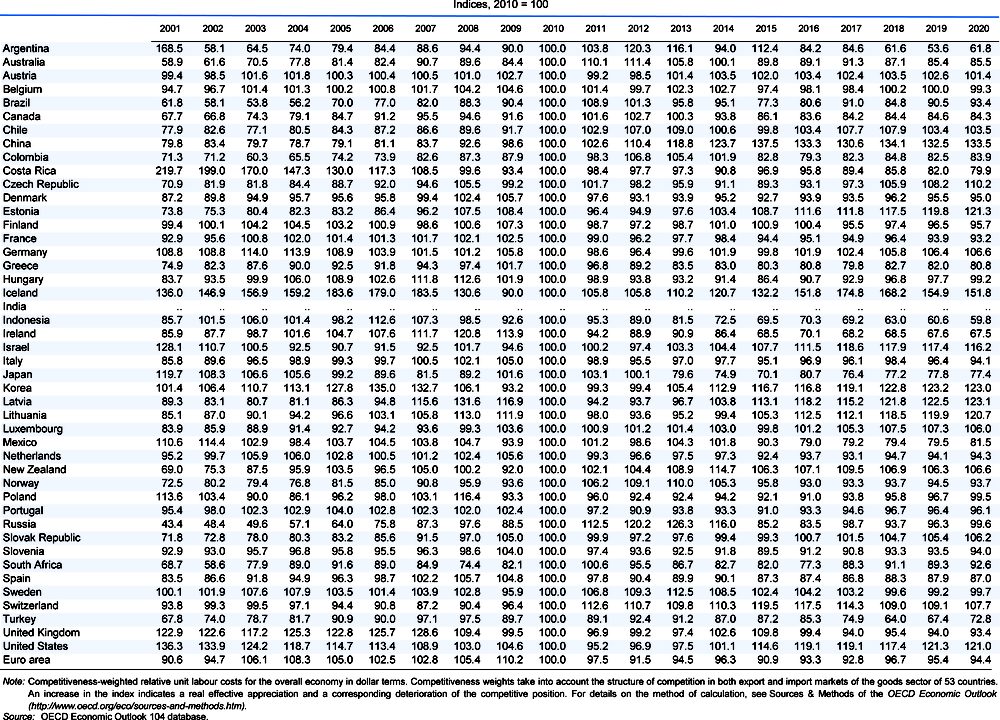
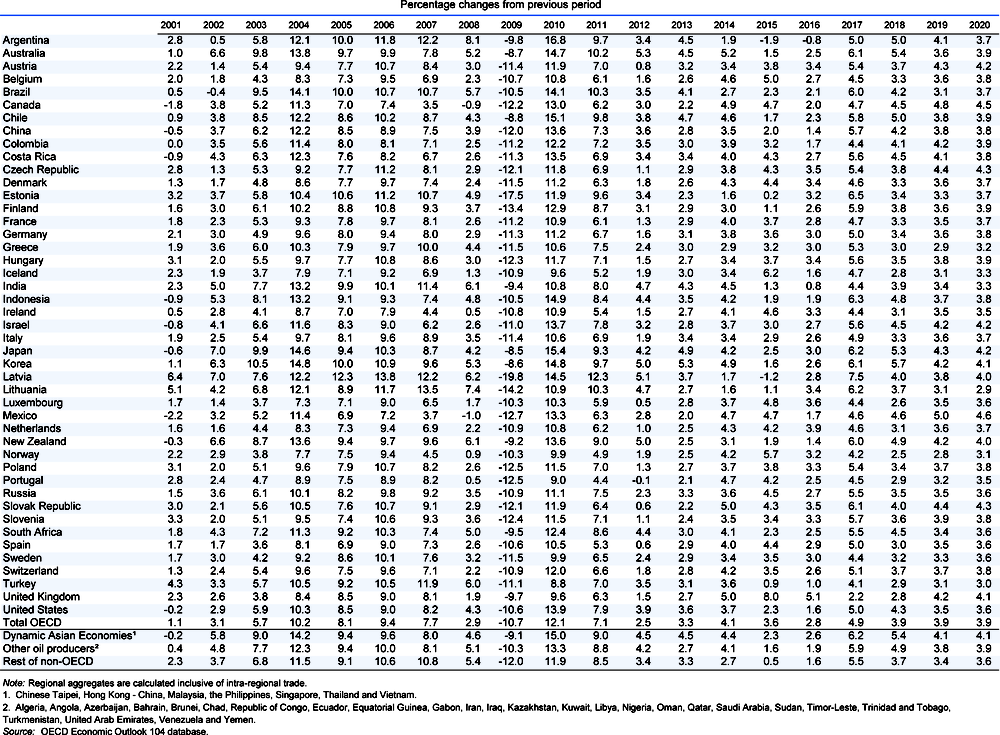
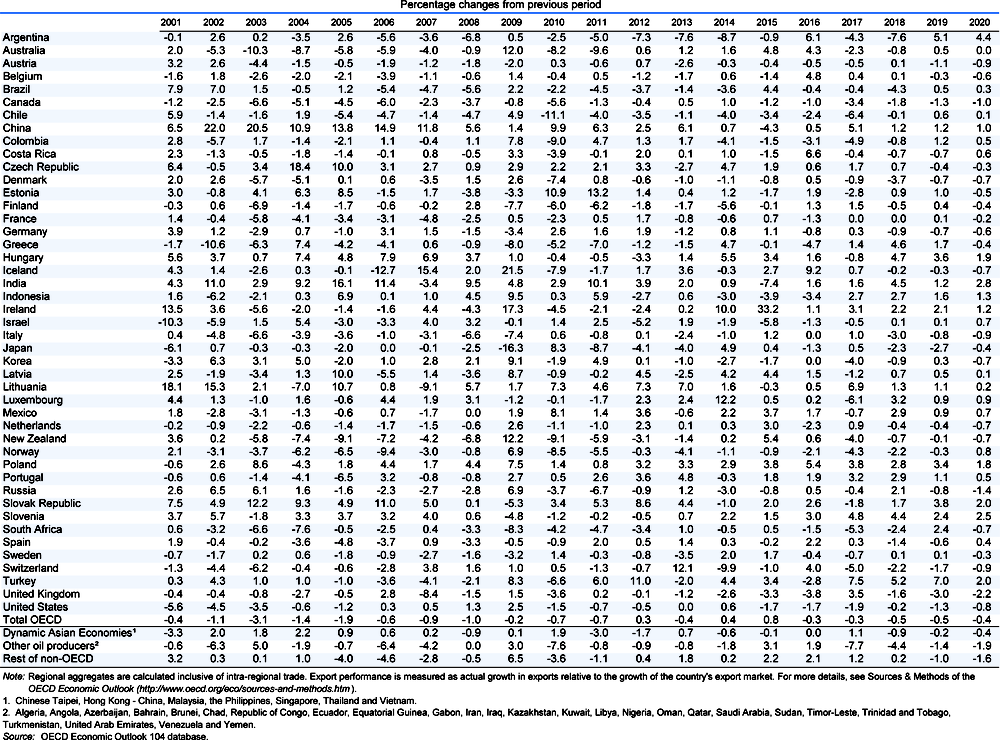
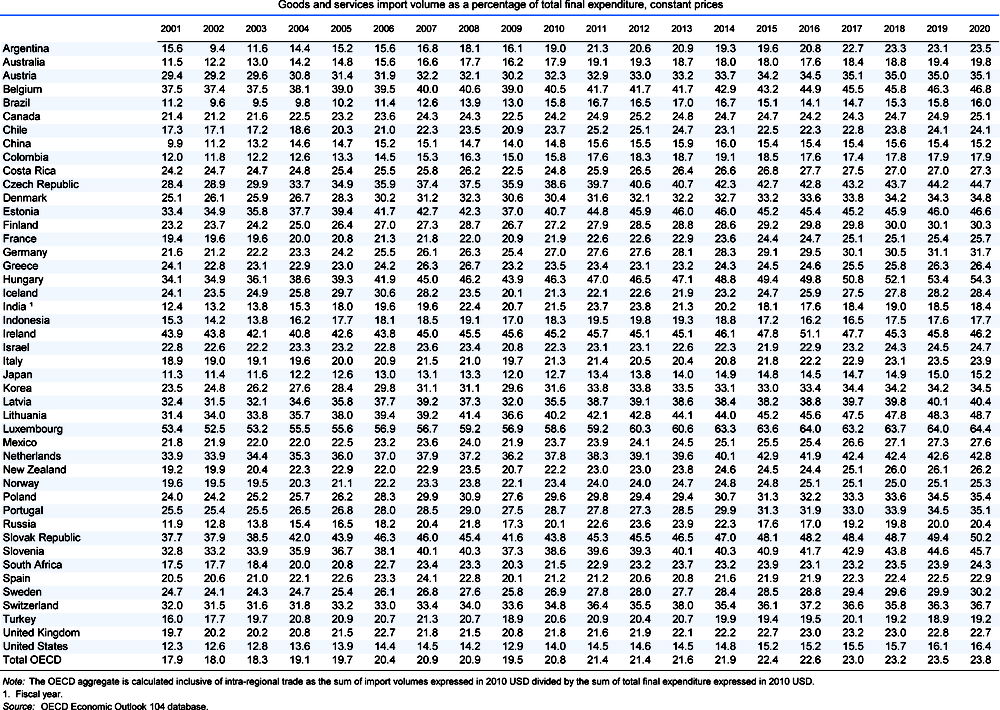
This annex contains data on key economic series which provide a background to the recent economic developments in the global economy described in the main body of this report. Data for 2018, 2019 and 2020 are OECD estimates and projections. Data in some of the tables have been adjusted to conform to internationally agreed concepts and definitions in order to make them more comparable across countries, as well as consistent with historical data shown in other OECD publications. Regional aggregates are based on time-varying weights. For details on aggregation, see OECD Economic Outlook Sources and Methods.

The OECD projection methods and underlying statistical concepts and sources are described in detail in OECD Economic Outlook Sources and Methods (www.oecd.org/eco/sources-and-methods.htm).

Corrigenda for the current and earlier issues, as applicable, can be found at www.oecd.org/about/publishing/corrigenda.htm.

The statistical data for Israel are supplied by and under the responsibility of the relevant Israeli authorities. The use of such data by the OECD is without prejudice to the status of the Golan Heights, East Jerusalem and Israeli settlements in the West Bank under the terms of international law.

NOTE ON QUARTERLY PROJECTIONS

OECD quarterly projections are on a seasonal and working-day-adjusted basis for selected key variables. This implies that differences between adjusted and unadjusted annual data may occur, though these in general are quite small. In some countries, official forecasts of annual figures do not include working-day adjustments. Even when official forecasts do adjust for working days, the size of the adjustment may in some cases differ from that used by the OECD.

picture
picture
picture
Annex Table 3. Real private consumption expenditure
Real private consumption expenditure

 StatLink https://doi.org/10.1787/888933878323

Annex Table 4. Real public consumption expenditure
Real public consumption expenditure

 StatLink https://doi.org/10.1787/888933878342

Annex Table 5. Real total gross fixed capital formation
Real total gross fixed capital formation

 StatLink https://doi.org/10.1787/888933878361

Annex Table 6. Real gross private non-residential fixed capital formation
Real gross private non-residential fixed capital formation

 StatLink https://doi.org/10.1787/888933878380

Annex Table 7. Real gross residential fixed capital formation
Real gross residential fixed capital formation

 StatLink https://doi.org/10.1787/888933878399

Annex Table 8. Real total domestic demand
Real total domestic demand

 StatLink https://doi.org/10.1787/888933878418

Annex Table 9. Foreign balance contributions to changes in real GDP
Foreign balance contributions to changes in real GDP

 StatLink https://doi.org/10.1787/888933878437

Annex Table 10. Quarterly demand and output projections
Quarterly demand and output projections

 StatLink https://doi.org/10.1787/888933878456

Annex Table 10. Quarterly demand and output projections (cont.)
Quarterly demand and output projections (cont.)

 StatLink https://doi.org/10.1787/888933878456

Annex Table 11. Contributions to changes in real GDP in OECD countries
Contributions to changes in real GDP in OECD countries

 StatLink https://doi.org/10.1787/888933878475

Annex Table 11. Contributions to changes in real GDP in OECD countries (cont.)
Contributions to changes in real GDP in OECD countries (cont.)

 StatLink https://doi.org/10.1787/888933878475

Annex Table 13. GDP deflators
GDP deflators

 StatLink https://doi.org/10.1787/888933878513

Annex Table 14. Private consumption deflators
Private consumption deflators

 StatLink https://doi.org/10.1787/888933878532

Annex Table 15. Consumer price indices
Consumer price indices

 StatLink https://doi.org/10.1787/888933878551

Annex Table 16. Oil and other primary commodity markets
Oil and other primary commodity markets

 StatLink https://doi.org/10.1787/888933878570

Annex Table 17. Compensation per employee
Compensation per employee

 StatLink https://doi.org/10.1787/888933878589

Annex Table 18. Labour productivity
Labour productivity

 StatLink https://doi.org/10.1787/888933878608

Annex Table 19. Employment and labour force
Employment and labour force

 StatLink https://doi.org/10.1787/888933878627

Annex Table 20. Labour force, employment and unemployment
Labour force, employment and unemployment

 StatLink https://doi.org/10.1787/888933878646

Annex Table 21. Unemployment rates: national definitions
Unemployment rates: national definitions

 StatLink https://doi.org/10.1787/888933878665

Annex Table 22. Harmonised unemployment rates
Harmonised unemployment rates

 StatLink https://doi.org/10.1787/888933878684

Annex Table 23. Quarterly price, cost and unemployment projections
Quarterly price, cost and unemployment projections

 StatLink https://doi.org/10.1787/888933878703

Annex Table 24. Potential GDP and productive capital stock
Potential GDP and productive capital stock

 StatLink https://doi.org/10.1787/888933878722

Annex Table 25. Structural unemployment and unit labour costs
Structural unemployment and unit labour costs

 StatLink https://doi.org/10.1787/888933878741

Annex Table 26. Household saving rates
Household saving rates

 StatLink https://doi.org/10.1787/888933878760

Annex Table 27. Gross national saving
Gross national saving

 StatLink https://doi.org/10.1787/888933878779

Annex Table 28. Household wealth and indebtedness
Household wealth and indebtedness

 StatLink https://doi.org/10.1787/888933878798

Annex Table 29. General government total outlays
General government total outlays

 StatLink https://doi.org/10.1787/888933878817

Annex Table 30. General government total tax and non-tax receipts
General government total tax and non-tax receipts

 StatLink https://doi.org/10.1787/888933878836

Annex Table 31. General government financial balances
General government financial balances

 StatLink https://doi.org/10.1787/888933878855

Annex Table 32. General government cyclically-adjusted balances
General government cyclically-adjusted balances

 StatLink https://doi.org/10.1787/888933878874

Annex Table 33. General government underlying balances
General government underlying balances

 StatLink https://doi.org/10.1787/888933878893

Annex Table 34. General government underlying primary balances
General government underlying primary balances

 StatLink https://doi.org/10.1787/888933878912

Annex Table 35. General government net debt interest payments
General government net debt interest payments

 StatLink https://doi.org/10.1787/888933878931

Annex Table 36. General government gross financial liabilities
General government gross financial liabilities

 StatLink https://doi.org/10.1787/888933878950

Annex Table 37. General government net financial liabilities
General government net financial liabilities

 StatLink https://doi.org/10.1787/888933878969

Annex Table 38. Maastricht definition of general government gross public debt
Maastricht definition of general government gross public debt

 StatLink https://doi.org/10.1787/888933878988

Annex Table 39. Short-term interest rates
Short-term interest rates

 StatLink https://doi.org/10.1787/888933879007

Annex Table 40. Long-term interest rates
Long-term interest rates

 StatLink https://doi.org/10.1787/888933879026

Annex Table 41. Nominal exchange rates (vis-à-vis the US dollar)
Nominal exchange rates (vis-à-vis the US dollar)

 StatLink https://doi.org/10.1787/888933879045

Annex Table 42. Effective exchange rates
Effective exchange rates

 StatLink https://doi.org/10.1787/888933879064

Annex Table 43. Nominal house prices
Nominal house prices

 StatLink https://doi.org/10.1787/888933879083

Annex Table 44. Real house prices
Real house prices

 StatLink https://doi.org/10.1787/888933879102

Annex Table 45. House price-to-rent ratio
House price-to-rent ratio

 StatLink https://doi.org/10.1787/888933879121

Annex Table 46. House price-to-income ratio
House price-to-income ratio

 StatLink https://doi.org/10.1787/888933879140

Annex Table 47. Export volumes of goods and services
Export volumes of goods and services

 StatLink https://doi.org/10.1787/888933879159

Annex Table 48. Import volumes of goods and services
Import volumes of goods and services

 StatLink https://doi.org/10.1787/888933879178

Annex Table 49. Export prices of goods and services
Export prices of goods and services

 StatLink https://doi.org/10.1787/888933879197

Annex Table 50. Import prices of goods and services
Import prices of goods and services

 StatLink https://doi.org/10.1787/888933879216

Annex Table 51. Indicators of competitiveness based on relative consumer prices
Indicators of competitiveness based on relative consumer prices

 StatLink https://doi.org/10.1787/888933879235

Annex Table 52. Indicators of competitiveness based on relative unit labour costs
Indicators of competitiveness based on relative unit labour costs

 StatLink https://doi.org/10.1787/888933879254

Annex Table 53. Export market growth in goods and services
Export market growth in goods and services

 StatLink https://doi.org/10.1787/888933879273

Annex Table 54. Export performance for total goods and services
Export performance for total goods and services

 StatLink https://doi.org/10.1787/888933879292

Annex Table 55. Import penetration
Import penetration

 StatLink https://doi.org/10.1787/888933879311

Annex Table 56. Shares in world exports and imports
Shares in world exports and imports

 StatLink https://doi.org/10.1787/888933879330

Annex Table 57. Geographical structure of world trade growth
Geographical structure of world trade growth

 StatLink https://doi.org/10.1787/888933879349

Annex Table 58. Trade balances for goods and services
Trade balances for goods and services

 StatLink https://doi.org/10.1787/888933879368

Annex Table 59. Balance of primary income
Balance of primary income

 StatLink https://doi.org/10.1787/888933879387

Annex Table 60. Balance of secondary income
Balance of secondary income

 StatLink https://doi.org/10.1787/888933879406

Annex Table 61. Current account balances
Current account balances

 StatLink https://doi.org/10.1787/888933879425

Annex Table 62. Current account balances as a percentage of GDP
Current account balances as a percentage of GDP

 StatLink https://doi.org/10.1787/888933879444

Annex Table 63. Structure of current account balances of major world regions
Structure of current account balances of major world regions

 StatLink https://doi.org/10.1787/888933879463

End of the section – Back to iLibrary publication page