Chapter 2. Policy challenges from closer international trade and financial integration: dealing with economic shocks and spillovers
Introduction and summary
Global economic integration has been a powerful driver of increased economic efficiency and improved living standards around the world, and has contributed to sizeable economic gains in emerging market economies (EMEs). In spite of these gains, enhanced integration has also raised concerns about the costs it has imposed on vulnerable groups and its potential impact on inequality in advanced economies. These issues have been analysed extensively by the OECD, with a comprehensive review provided in the Key Issues Paper for the 2018 Ministerial Council Meeting (OECD, 2018e). This chapter focuses on particular consequences of deeper global economic integration: the impact of closer trade and financial linkages on the propagation of economic shocks and on the transmission channels and effectiveness of macroeconomic policies.
The main findings reported in the chapter can be summarised as follows:
-
Closer trade and financial integration since the mid-1990s has made economies more dependent on developments abroad. Trade intensity has increased, helped by the expansion of global value chains (GVCs), and cross-border asset and liabilities have risen considerably relative to GDP. Integration is particularly apparent in financial markets, with a common global factor increasingly determining domestic equity and government bond prices. Global factors tend to have a smaller impact on economic growth and inflation than on financial variables. Large economies or regions remain relatively closed, despite increased openness in recent decades.
-
Increased international integration has changed the strength and transmission channels of external shocks and macroeconomic policies. The impact of external shocks, especially from EMEs, has become stronger with increased openness. Single country fiscal policy multipliers have become marginally smaller, all else equal, as the leakage through imports has risen. Correspondingly, the additional gains from collective fiscal actions have risen. The transmission channels of monetary policy to demand via exchange rate movements have changed: the impact on trade volumes appears to have lessened with the expansion of global value chains (GVCs), while the impact on profit margins and from currency-induced revaluation changes to large cross-border financial assets and liabilities, and hence wealth, have become more important. The global transmission of shocks from the United States has arguably strengthened, reflecting the large extent of US dollar invoicing of international trade and the dominance of US-dollar-denominated assets and liabilities in international portfolios.
-
Increased economic integration raises challenges for domestic and international policy given the need to adjust to new sources of spillovers, and because policy choices affect other economies more strongly in a more interconnected world. While collective and more effective policy co-ordination could mitigate some of the trade-offs and result in better global outcomes, especially if there are large common shocks or common objectives, it is often difficult to achieve in practice. Thus, establishing and fostering global standards and rules of conduct, along with continued multilateral dialogue, including via the G20, is essential. Resilience to potential adverse shocks from abroad needs to be strengthened and the build-up of vulnerabilities needs to be avoided. Structural reforms and improved social safety nets are necessary to help countries to adjust to global changes and ensure that the benefits of globalisation are widely shared.
The global economy has become more integrated
Aggregate trade and financial linkages are now stronger and more complex than in the mid-1990s, but are expanding more slowly than prior to the global financial crisis.1 The geographical composition of trade flows has changed substantially, with EMEs becoming more important compared with advanced economies (Figure 2.1). Global trade intensity has also risen significantly (Figure 2.2, Panel A). Trade linkages between the main trading regions have expanded, but these regions still remain relatively closed, with the ratio of extra-regional trade to GDP in the European Union, NAFTA and Asia below 15% of GDP. The home bias in the financial asset holdings of the private sector has declined (Figure 2.2, Panel B), but financial integration of EMEs has lagged behind their trade integration.
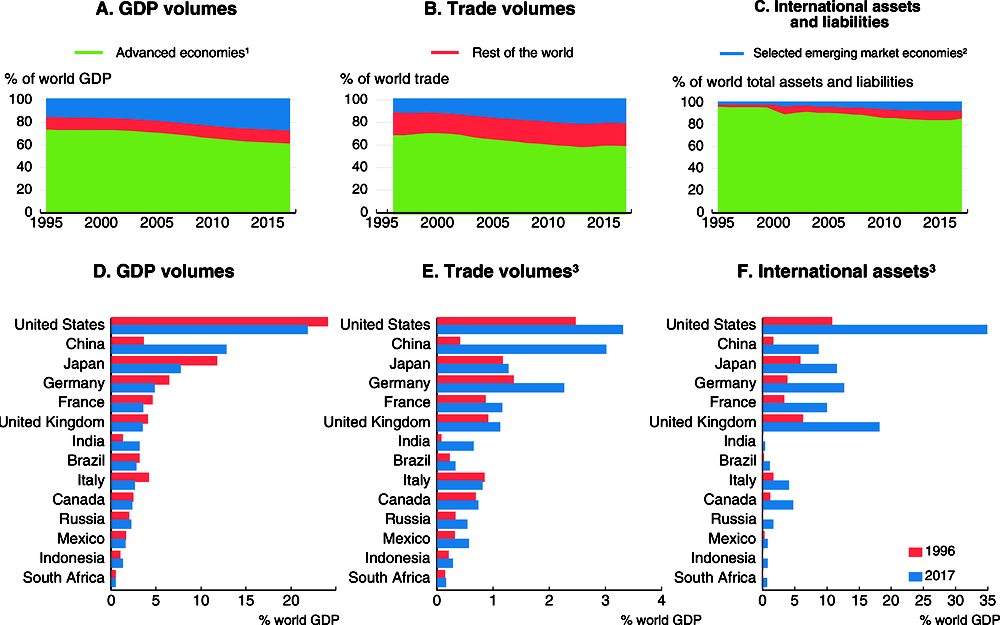
Note: GDP and trade shares in world GDP are based on volumes at market exchange rates. Trade volumes refer to the average of imports and exports.
1. Advanced economies include Australia, Austria, Belgium, Canada, the Czech Republic, Denmark, Estonia, Finland, France, Germany, Greece, Iceland, Ireland, Israel, Italy, Japan, Korea, Latvia, Lithuania, Luxembourg, the Netherlands, New Zealand, Norway, Portugal, the Slovak Republic, Slovenia, Spain, Sweden, Switzerland, the United Kingdom and the United States.
2. Selected emerging market economies include Argentina, Brazil, China, Chile, Colombia, Hungary, India, Indonesia, Mexico, Poland, Russia, South Africa and Turkey.
3. In panel E, data for 1996 refer to 2001 for India. In panel F, data for 1996 refer to 2001 for Brazil, India and Mexico, and 2004 for China; data for 2017 refer to 2016 for Finland, Indonesia and Sweden.
Source: OECD Economic Outlook 103 database; IMF World Economic Outlook; IMF Balance of Payments Statistics; and OECD calculations.
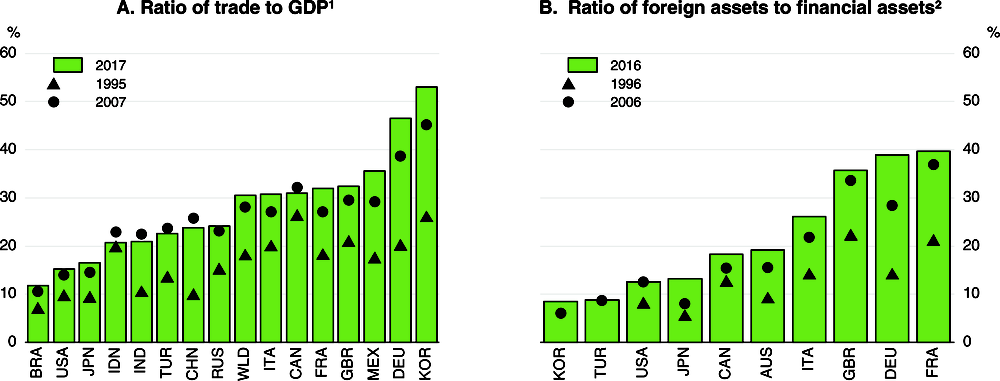
1. The 1995 data refer to 1996 for Brazil and 1997 for India. Trade is the average of exports and imports in a given year. Both trade and GDP are measured in volumes in US dollars at market exchange rates.
2. The ratio of foreign assets excluding reserves to total financial assets of the private sector. The 2006 data refer to 2008 for Korea and to 2010 for Turkey.
Source: IMF Balance of Payments Statistics; OECD Economic Outlook 103 database; OECD National Accounts database; and OECD calculations.
Trade linkages have increased
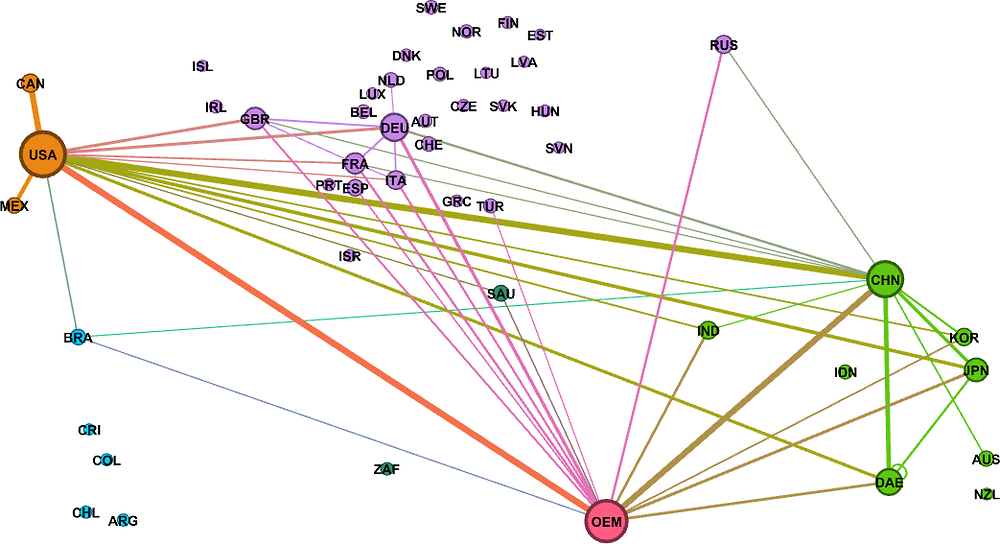
Trade policy liberalisation, advances in technology and the increased participation of EMEs in the international division of production and labour have brought about large structural changes in global trade over the past 20 years (Figure 2.3). Advances in communication technologies and the reduction of trade barriers have facilitated the expansion of GVCs, with large shares of manufacturing being moved from the G7 economies to selected EMEs, notably China and South East Asia, Mexico, and Central and Eastern Europe (Amador and Cabral, 2016; Baldwin, 2016). The relative importance of the G7 countries in global trade, and bilateral trade flows between them, has declined, while the relative weight of China has increased markedly (Figure 2.2). Non-OECD economies now account for roughly two-fifths of world trade, from less than one-third in the decade after 1995.
GVC expansion and the integration of EMEs have also changed the composition of trade. Trade in goods is increasingly dominated by intermediates, raising the share of value added that originates in other economies in exports. Rapid industrialisation in China and other EMEs has helped to boost demand for raw materials, increasing the share of primary commodities in world trade. At the same time, a rising share of advanced economies' total trade is in services, which increases effective trade protection, since services trade policies are less liberalised than those for goods.
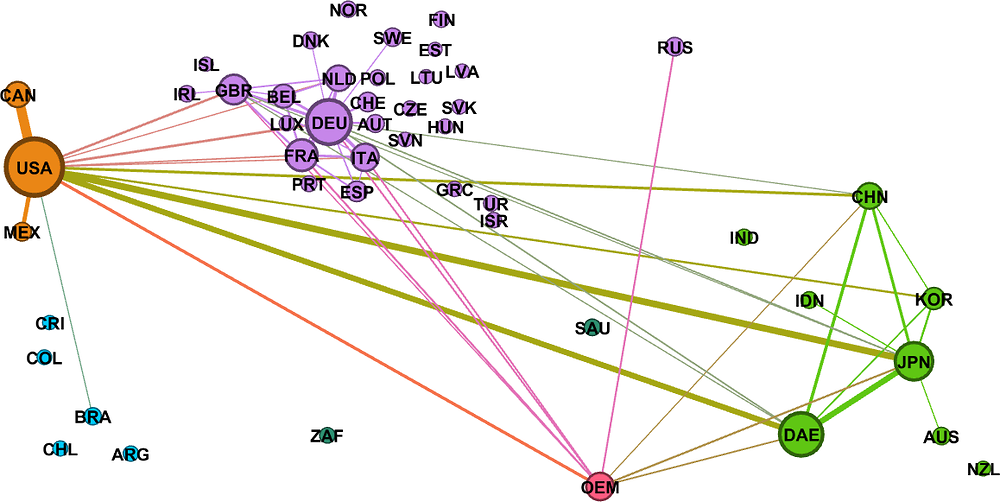
Note: The size of the bubbles and their labels represents the share of world trade (exports plus imports) of that country or economic area. The thickness and colour intensity of the lines between two bubbles measures the amount of bilateral trade (exports plus imports) between two trading partners. The relative size of bubbles is determined by share of world trade in that year so they can be compared across countries within a year (1995 and 2013), but the bubble of a country cannot be compared across the two years shown. There are bilateral trade flows between all countries shown but those below approximately 0.2% of total world trade flows are not shown. Dynamic Asian Economies (DAE) comprise Chinese Taipei, Hong Kong China, Indonesia, Malaysia, the Philippines, Singapore and Thailand. Other emerging markets (OEM) are the group of the remaining 129 countries in the world that account for around 10% of world trade. The figure is produced using “Gephi: An Open Source Software for Exploring and Manipulating Networks”.
Source: IMF Direction of Trade Statistics; OECD Economic Outlook 103 database; OECD calculations.
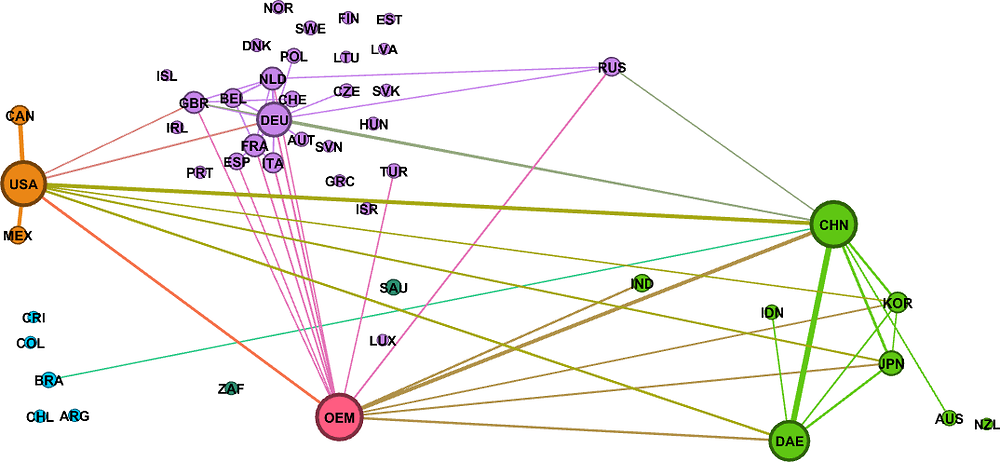
While gross trade flows give a strong indication of physical trading activity, trade in value added (Figure 2.4) gives a better picture of the income flows associated with trade. The two metrics can differ. For instance, total merchandise trade flows between China and the Dynamic Asian Economies are smaller when measured in value-added terms than in gross terms due to strong GVC linkages and sizeable trade in intermediates (Figures 2.3 and 2.4). In contrast, trade flows for Japan and Korea are relatively larger in value-added terms, as are flows between the United States and China.
Note: The size of a bubble represents the share of world trade in value-added terms (exports plus imports of value added) of that country or economic area. The thickness of the lines between two bubbles measures the amount of bilateral trade of value added in final demand between two trading partners. There are bilateral trade flows between all countries shown but those below approximately 0.2% of total world trade flows are not shown. Dynamic Asian Economies (DAE) comprise Chinese Taipei; Hong Kong China; Indonesia; Malaysia; the Philippines; Singapore and Thailand. Other emerging markets (OEM) are the group of the remaining 129 countries in the world that account for around 10% of world trade. The figure is produced using “Gephi: An Open Source Software for Exploring and Manipulating Networks”.
Source: IMF Direction of Trade Statistics database; OECD Economic Outlook 103 database; and OECD calculations.
There is still substantial room to reduce barriers to trade (Box 2.1) and stimulate trade integration, but there is also a possibility that technological advances could reduce trade intensities, at least for goods, and change trade patterns in the future. International trade is now starting to be affected by developing digital technologies, including the internet of things, big data, the cloud, autonomous robotics and 3D printing, all of which may act as a brake on GVC expansion (Baldwin, 2016). Such technologies will facilitate higher-quality, more bespoke and lower-cost production in advanced economies, making labour costs less important, and hence offshoring less attractive. At the same time, the ongoing digitalisation of economies, and the enhanced flows of data across borders this enables, may facilitate stronger international trade in services. OECD analysis suggests that digitalisation has the largest potential impact among the many forces that affect GVCs, and that it could reduce the ratio of world trade to GDP by a similar amount to the increase that took place in the 2000s, when GVCs were booming (De Backer and Flaig, 2017). However, empirical evidence suggests that so far this has only slowed offshoring to a limited extent. The effect on reshoring to the OECD is even smaller, and confined to boosting investment rather than employment (De Backer et al., 2016). Indeed, the largest robot investments in absolute terms are occurring in China (International Federation of Robotics, 2016).
Progress in trade liberalisation since the 1947 General Agreement on Tariffs and Trade (GATT) has been impressive, particularly in reducing tariffs. While advanced countries made much progress in the early years of GATT, substantial reductions in tariff levels and in tariff dispersion occurred in emerging market and developing economies after the GATT Uruguay Round was completed in 1995, which led to the creation of the World Trade Organisation (WTO) (Caliendo et al., 2017).
Despite this progress, there is still substantial room to reduce trade barriers to boost economic growth and employment. Applied tariffs on industrial products have approximately halved since the mid-1990s to a simple average of 5.5% across all countries (table below). However, the average WTO Most Favoured Nation (MFN) bound rate, i.e. the negotiated maximum tariff a country can levy on a non-discriminatory basis on imports from another WTO member, is roughly five times as high. This is both a risk and opportunity. Countries still have substantial room to raise their tariffs considerably from their applied rates to the bound rates, although that distance is smaller in OECD countries. It also implies that a significant amount of “water” between bound and applied rates could be squeezed out without impacting actual market access.
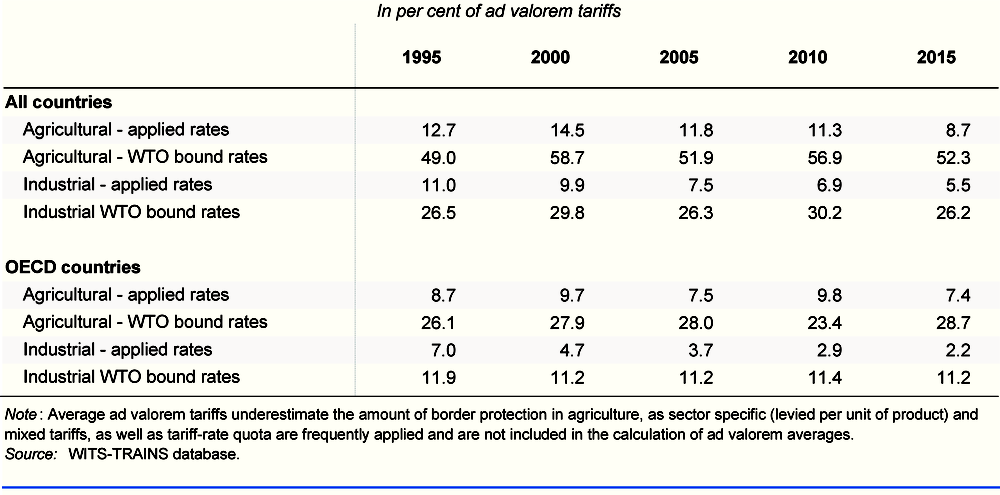
A return to broader-based trade agreements would also help to lower tariffs. The implementation period of the Uruguay Round Agreement ended in 2004 and since then the role of multilateral discipline in reducing tariffs has been limited, with more tariff reductions being implemented through preferential and regional trade agreements. Preferential trade agreements, by design, enhance trade between members and tend to inefficiently divert trade away from non-members. Thus, even though average tariffs have been reduced considerably over the past decades, there still exists considerable variation in tariffs across countries and industries, and tariff spikes persist on some products. Indeed, simulations of multilateral and regional trade agreements with the OECD METRO model show that positive effects are higher when more countries participate in trade integration because it broadens market opportunities, widens the range of products at lower prices, and reduces trade diversion (OECD, 2018b). Smaller economies benefit especially.
With lower tariffs globally, the so-called non-tariff measures (NTMs) have become a relatively more important source of trade barriers. They comprise all policy measures other than tariffs and tariff-rate quotas that have an effect on international trade by influencing the price of traded products, the quantity traded, or both. Generally, such measures relate to regulations that aim to achieve other policy goals, such as reducing the risks for human, animal or plant health, or information asymmetries. However, they also tend to increase production costs and trade barriers and can affect, positively or negatively, the development of new technologies or production methods. NTMs can also lead to various fixed and variable trade barriers that disproportionally hamper the participation of small and medium-sized enterprises in international trade. Estimates of the effects of NTMs on import prices and import volumes suggest that they impose significant trade barriers in many cases (OECD, 2018a).
Unlike tariffs, however, an abolition of such measures is not generally optimal, as they can help achieve other desirable outcomes and their economic effects differ in many respects from those of tariffs. Regulatory impact assessments to quantify the costs and benefits of such regulations rarely take into account the associated trade costs. While such quantification is notoriously difficult, it remains vital that international regulatory co-operation efforts take into account the level of actionable trade barriers in each case and how regulations differ between trade partners. A greater similarity in measures put in place reduces the trade barriers from NTMs, with OECD countries showing relatively more similarity between them, and hence lower trade barriers, than non-OECD countries (OECD, 2018a).
The reduction of services trade barriers also remains relatively neglected. Services generate more than two-thirds of GDP in advanced economies and account for an increasing share of their trade, but impediments to global services trade remain pervasive. There is a substantial scope to reduce trade costs in major services sectors by scaling back measures that discriminate against foreign services providers (OECD, 2017c). Many services trade barriers restrict the movement of people or commercial presence, and result from regulatory differences across countries. Regulatory co-operation accordingly makes doing business easier for exporters of services and goods (OECD, 2017d).
International financial linkages have expanded rapidly since the mid-1990s
Cross-border financial positions expanded rapidly between the mid-1990s and the global financial crisis, more than tripling as a share of world GDP (Figure 2.5). Subsequently, they have slipped back slightly, but remain close to their historical peak. The pre-crisis wave of financial globalisation was driven by a progressive removal of capital and exchange controls, improvements to cross-border payment and settlement systems, financial deregulation and falling communications costs.
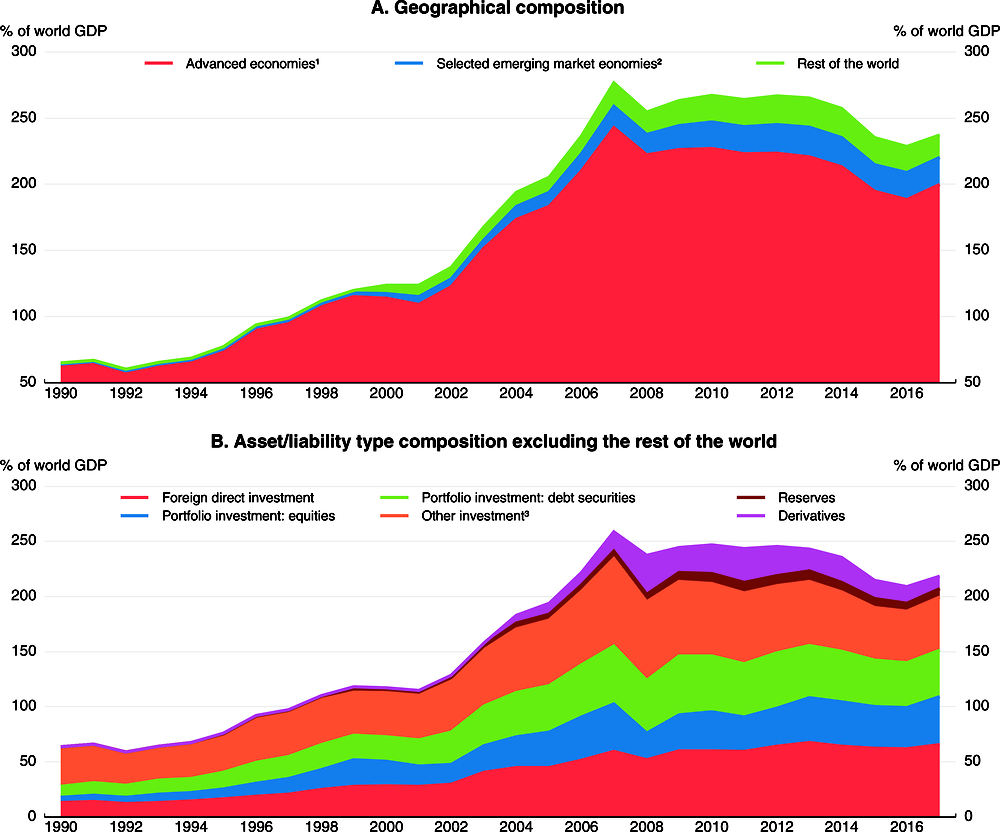
Note: Both panels refer to the sum of external assets and liabilities. Country coverage within each group may vary over time reflecting the availability of series for individual economies.
1. Advanced economies include Australia, Austria, Belgium, Canada, the Czech Republic, Denmark, Estonia, Finland, France, Germany, Greece, Iceland, Ireland, Israel, Italy, Japan, Korea, Latvia, Lithuania, Luxembourg, the Netherlands, New Zealand, Norway, Portugal, the Slovak Republic, Slovenia, Spain, Sweden, Switzerland, the United Kingdom and the United States.
2. Selected emerging market economies include Argentina, Brazil, China, Colombia, Hungary, India, Indonesia, Malaysia, Mexico, Poland, Russia, South Africa and Turkey.
3. Other investment contains primarily loans, in addition to trade credits and advances.
Source: IMF Balance of Payments Statistics; OECD Economic Outlook 103 database; and OECD calculations.
In the run-up to the global financial crisis, the expansion of cross-border positions was led by the advanced economies, reflecting their generally-low level of restrictions on capital flows and deeper domestic financial markets (Figure 2.5, Panel A). However, EMEs have become more important in international financial markets over the past decade or so. This reflects less restrictive financial regulation, improved macroeconomic fundamentals (including robust growth, and lower inflation and external imbalances), better institutions, and, in the aftermath of the global financial crisis, higher risk-taking given low interest rates in advanced economies ( Fratzscher, 2012; Ghosh et al., 2014; Hannan, 2017).
The nature of international financial linkages has changed over time (Figure 2.5, Panel B):
-
An expansion of international portfolio assets and liabilities has contributed significantly to the increase in cross-border financial positions. In the run-up to the global financial crisis, international portfolio investment positions surged, helped by the development of financial markets that brought about a significant rise in securitisation. After the global financial crisis, low interest rates in advanced economies and investors’ search for yield favoured the development of market-based finance (Cerutti and Hong, 2018). These developments increased the importance of non-financial corporations in international financial intermediation, impacting on financial conditions and credit growth, especially in EMEs (Bruno and Shin, 2017; Caballero et al., 2016; OECD, 2017h). Valuation effects from price gains have become a significant factor behind the increase in the US dollar value of portfolio equity stocks in several large economies (Figure 2.6).
-
The banking sector of advanced economies contributed to the pre-crisis wave of financial globalisation via operations through foreign affiliates and cross-border lending (Figure 2.7).2 However, international bank activities have retrenched in the aftermath of the global financial crisis, especially for European banks, reflecting a large reduction in intra-euro area positions (Bouvatier and Delatte, 2015; McCauley et al., 2017; Gori, 2018).3 This stems from greater risk aversion and the need to boost capital positions due to tighter banking regulation and financial losses.
-
The importance of direct investment has increased steadily in the last two decades.4 The acceleration of direct investment flows in the early 2000s is partly explained by the rise in cross-border mergers and acquisitions (M&A).5 Global M&A activity slowed after 2008 but has resumed in recent years. Its regional composition has also changed. The EU countries have shifted from being net outward investors to becoming the world’s largest net recipient of cross-border M&A, and Asia – in particular China – has become one of the main net outward investors in the world (OECD, 2017b), as well as a key location for inward FDI investment (OECD, 2018d).
-
The increase in the outstanding stock of gross financial derivatives reflects financial innovation and increasingly complex financial products. Such products could magnify financial spillovers and volatility. Due to the netting of gross positions, which is permitted by prevailing reporting conventions,6 they may also hide significantly larger exposures (Blundell-Wignall and Atkinson, 2011; Borio et al., 2017).
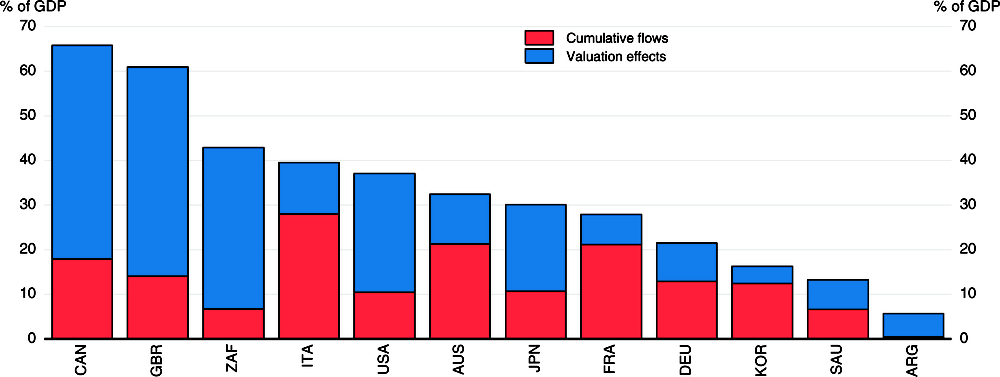
Note: Valuation effects are calculated as the difference between the overall change in the stocks and the cumulative sum of flows. They are expressed as a per cent of 2017 nominal GDP.
Source: IMF Balance of Payments Statistics; OECD Economic Outlook 103 database; and OECD calculations.
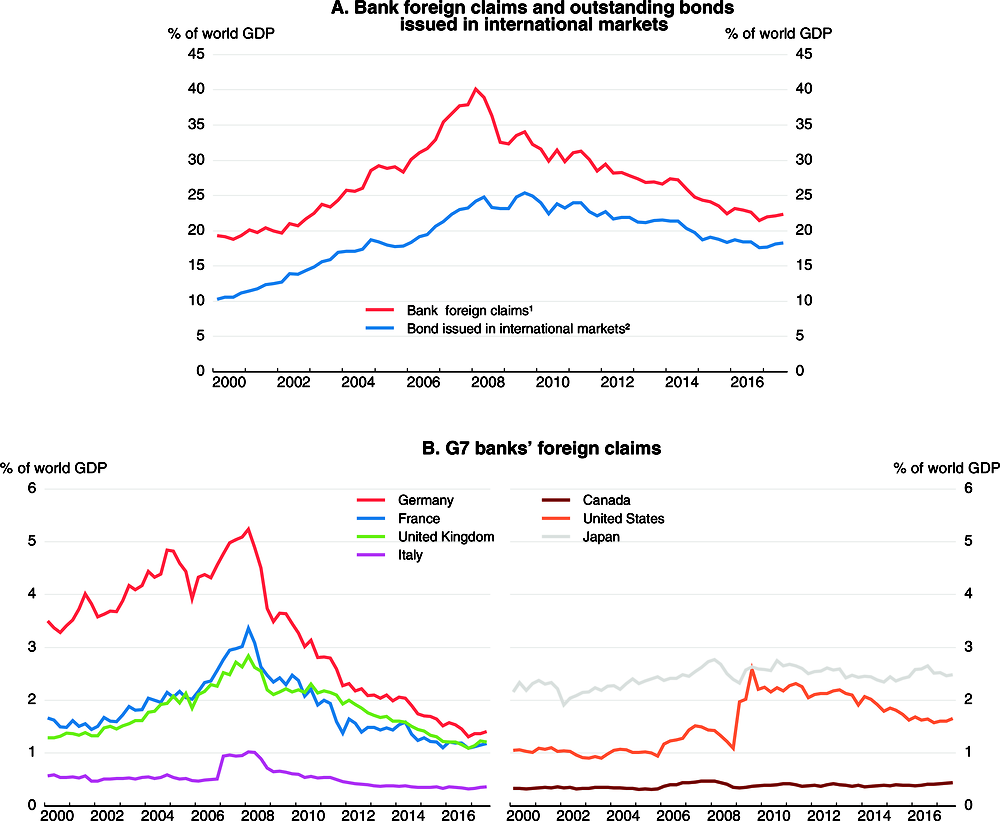
Note: Banks’ foreign claims are on an immediate counterparty basis excluding domestic positions. They are not adjusted for changes in exchange rates and breaks in the series.
1. Total foreign claims for all BIS reporting countries.
2. Bonds issued in international markets are debt securities issued in any market by a non-resident.
Source: Bank for International Settlements Banking Statistics and Debt Securities database.
Financial centres have become more important intermediaries for cross-border capital flows, facilitating international financial transactions and improving access to finance for firms and investors in developing and emerging market economies (Lane and Milesi-Ferretti, 2011).7 However, growing gross asset and liability positions make financial centres vulnerable to shocks, and complicate the identification of ultimate international exposures. International and offshore financial centres, due to their size, reputation and connectedness, may also facilitate base erosion and profit shifting (Box 2.3 below) and are exposed to the risk of illicit financial flows – such as money-laundering, tax evasion and international bribery – issues at the forefront of the international agenda (OECD, 2013a; OECD, 2013b; OECD, 2014b).
Increased linkages through production abroad
Cross-border investment has also enhanced the exposure of companies to the global economy. In the majority of OECD economies, fixed tangible capital investments by foreign-owned firms now represent between 1 and 2½ per cent of domestic GDP, and considerably more in some small open economies (OECD, 2015a). A growing number of listed companies engage in foreign sales through operations in foreign countries, with the median share of foreign sales in total sales rising over the past two decades in Europe, Japan and the United States (Figure 2.8). Increasingly, this is an important channel for the transmission of economic shocks across borders. Moreover, in the largest advanced and emerging market economies, the stock of foreign direct investment (FDI) assets and investment income from FDI in relation to GDP have doubled or tripled over the past two decades, though they remain smaller in EMEs than in advanced economies (Figure 2.9).
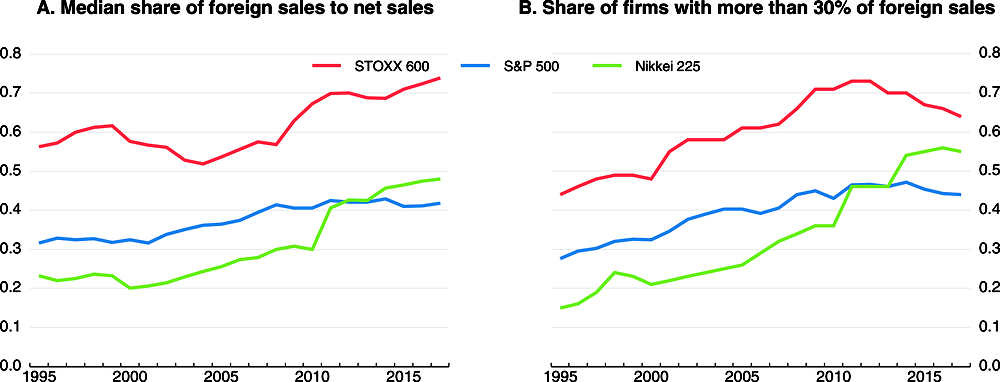
Note: The shares are based on changing constituencies of the stock indices. For Nikkei 225 (Japan) the constituents from 2011 are used for the period 1995 to 2011 and for STOXX 600 (Europe), the constituents from 1999 are used for the period 1995 to 1999. For the firms considered as national within the euro area, foreign sales are sales outside the national area.
Source: Thomson Reuters Worldscope; and OECD calculations.
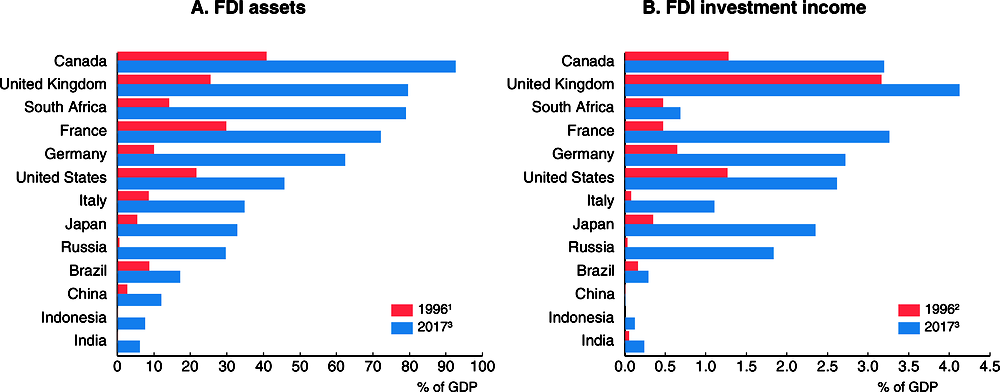
1. 2001 for Brazil and Indonesia, and 2004 for China.
2. 2001 for China and Indonesia, and 2004 for India.
3. Or latest available year for emerging market economies.
Source: IMF Balance of Payments Statistics; and OECD Economic Outlook 103 database.
This geographical diversification helps expand markets and diversify risks, allowing companies to grow, undertake investment where the rate of return is highest, and mitigate negative domestic shocks. However, it also strengthens the risk of negative spillovers from abroad. Corporate earnings, and in turn domestic investment and employment decisions, may have become more susceptible to changes in economic conditions abroad. Consequently, domestic economic policies may now have less influence on companies' domestic investment and employment decisions. Greater geographical diversification could be one of the explanations for the important role of global factors in equity price developments (see below).
Other measures of global integration
Besides flows of goods, services and capital, global integration has been strengthened over the past two decades by many other developments, including increasing flows of people and data across borders (Figure 2.10). These change the structure of national economies and strengthen trade and financial linkages across borders.
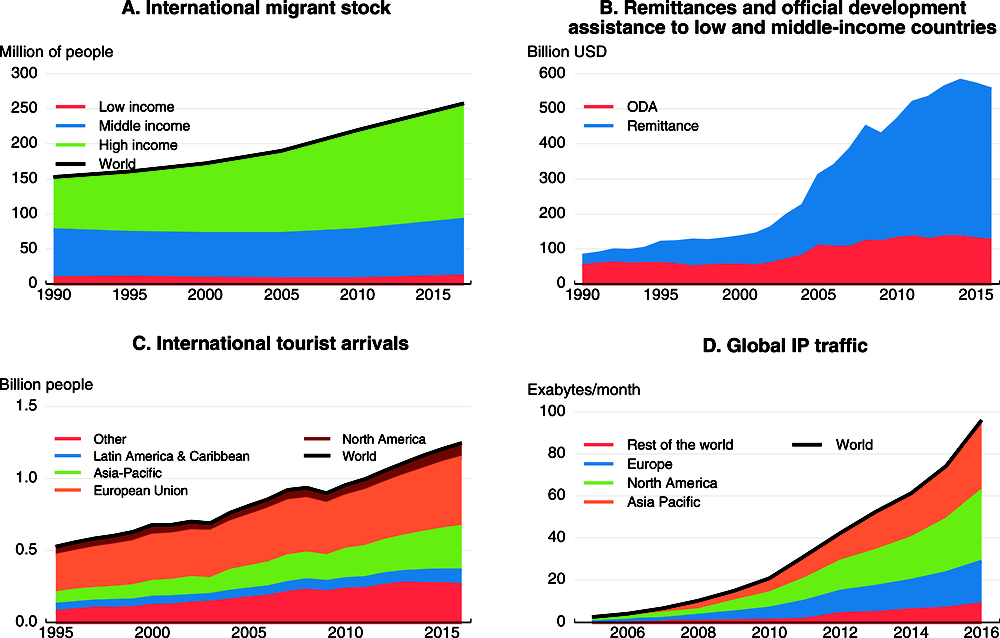
Note: High-income, middle-income and low-income are as classified by the World Bank. Russia is included in the data for Europe in Panel D.
Source: United Nations; World Bank, World Development Indicators; Cisco; OECD (2015c), Digital Economy Outlook; and OECD calculations.
Between 1990 and 2017, the number of international migrants worldwide rose by over 100 million, reflecting in part demographic developments and persistent differences in living standards and opportunities (Figure 2.10, Panel A). The migrant stock remains small as a share of the world population, at under 3½ per cent in 2017, but it has become increasingly important in OECD economies. On average, the foreign-born population accounted for 13% of the population in OECD countries in 2015, up from 9½ per cent in 2000 (OECD, 2017f).8 Sizeable migration can create adjustment challenges, but also helps to strengthen medium-term labour force growth in host economies and can also facilitate new trade opportunities between host and home countries (Ottaviano et al., 2018). Remittances from migrants to their home countries are also an important source of income for many low and middle-income countries (Figure 2.10, Panel B). In addition to long-term migration, trade and knowledge flows can also be affected by rising flows of international students (OECD, 2017f) and growing international tourist traffic (Figure 2.10, Panel C).9 Data flows provide a particularly striking example of rising interconnectedness. The rapid spread and increased usage of new digital technologies around the world are reflected in the rapid growth of global internet traffic (Figure 2.10, Panel D).10 Such technologies have the potential to create new economic opportunities, allow firms to access new markets, and offer consumers a wider choice of goods and services (OECD, 2017g).
Economic implications of greater global interconnectedness
Greater interconnectedness changes the strength of financial and business cycle linkages and creates externalities: what happens in one country, including policy choices, can have much larger effects on what happens in other countries. It raises questions about the extent to which economic and financial developments can differ across countries and how shocks from abroad affect the domestic economy. It also has implications for the effectiveness and transmission channels of domestic macroeconomic policy instruments and exchange rates.
The importance of global factors for domestic economic and financial developments
The increasing interconnectedness of the global economy raises issues about the extent to which economic and financial developments across countries are linked and driven by common factors. A priori, stronger trade and financial integration has an ambiguous impact on business cycle synchronisation. Trade linkages can strengthen output co-movements if traded goods are complements, or connected through GVCs, while the opposite can happen when they are substitutes (Ng, 2010). A higher level of openness to trade, and the growing role of multinational enterprises in national economies, also raises the potential exposure to foreign shocks, all else equal. At the same time, a higher degree of trade specialisation could increase the role of country and industry-specific shocks. Financial integration can weaken business cycle synchronisation if it improves risk sharing and countries are affected by idiosyncratic real shocks. It could, however, also strengthen synchronisation when it leads to heightened financial contagion.
New OECD analysis assesses the role of global factors in domestic financial and macroeconomic conditions by using dynamic factor models to identify the contributions of country-specific and global/regional factors to fluctuations of particular variables (Maravalle and Rawdanowicz, forthcoming).11 The estimated factors capture all unobservable features driving the co-movements of a given variable across a group of countries. A global factor affects all countries, a regional factor affects only a subset of countries within a region, and a country-specific factor captures everything not accounted by global and regional factors. Given data limitations, models identifying all three factors are estimated only since 1995 for a group of 42 countries using annual data. To get more insights about variation over time, a model with only global and country-specific factors is also estimated for a group of 15 advanced economies over a longer sample starting in 1980.12
The OECD analysis confirms that the contribution of global factors to fluctuations in equity prices and long-term government bond yields has risen since the 1980s to high levels for the group of 15 advanced economies, with a corresponding decline in the country-specific factor (Figure 2.11). High contributions from non-country-specific (i.e. global and regional factors) are also observed for the wider group of 42 advanced and emerging market economies in the past decade.
-
The rising importance of global factors for equity prices likely reflects common shocks related to risk aversion and the increasing role of foreign investors (Figure 2.12) and investment funds, including exchange-traded funds. The drop in the contribution of country-specific factors over the past decade, especially for the advanced economies, seems to be partly related to the global financial crisis – it is smaller for a subsample excluding the crisis years.
-
Greater monetary policy synchronisation, including from the creation of the euro area, and a rising non-resident ownership of government bonds can help explain the rising contribution of the global factor for government bond yields for the group of 15 advanced countries before the global financial crisis. Afterwards, the increase in the importance of country-specific factors is likely due to the euro area crisis, as government bond yields increased substantially in a number of vulnerable euro area countries, in contrast to safe-haven countries. In addition, quantitative easing has been undertaken at different times and to differing extents in the major economies.
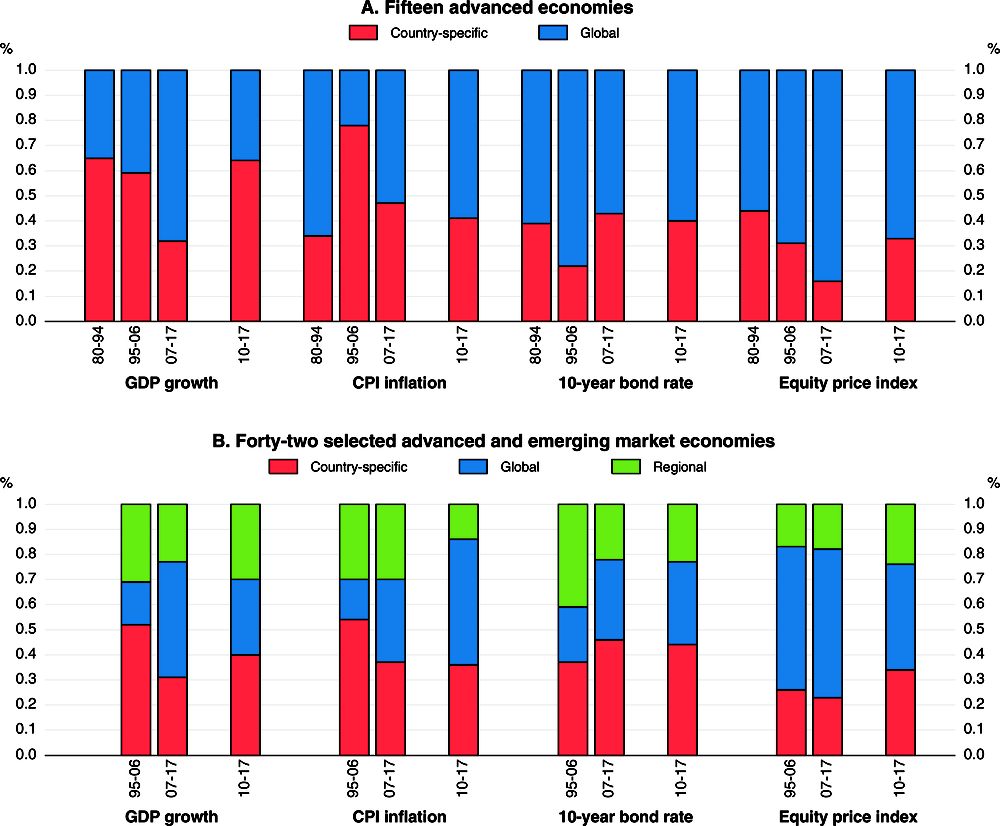
Note: Factors are estimated in dynamic one-factor (global – panel A) and two-factor (global and regional – panel B) models at annual frequency. All variables are transformed to ensure stationarity: annual growth is computed for real GDP and for consumer and equity prices, while 10-year bond yields are first differenced. In panel A, the 15 advanced economies include: Australia, Austria, Belgium, Canada, Denmark, France, Germany, Ireland, Italy, Japan, the Netherlands, Norway, Switzerland, the United Kingdom and the United States. In panel B, the 42 countries (the 5 regions) include: Canada, Chile, Mexico and the United States (Americas); Austria, Belgium, the Czech Republic, Denmark, Estonia, Finland, France, Germany, Greece, Hungary, Iceland, Ireland, Israel, Italy, Latvia, Lithuania, Luxembourg, the Netherlands, Norway, Poland, Portugal, the Slovak Republic, Slovenia, Spain, Sweden, Turkey, Switzerland and the United Kingdom (Europe); Japan and South Korea (Asia); Australia and New Zealand (Oceania); and Brazil, China, India, Indonesia, Russia and South Africa (BRIICS). For technical details, see Maravalle and Rawdanowicz (forthcoming).
Source: OECD Economic Outlook 103 database; and OECD calculations.
The contribution of global and regional factors to fluctuations in equity prices is slightly higher than the contribution to changes in government bond yields, for the group of 42 countries. This might be explained by a greater role of the “fear” factor for equity investors rather than by a generally higher participation of foreign investors. In some advanced economies, including the United States, foreign investors hold a greater share of outstanding domestic government debt securities than domestic equities (Figure 2.12).
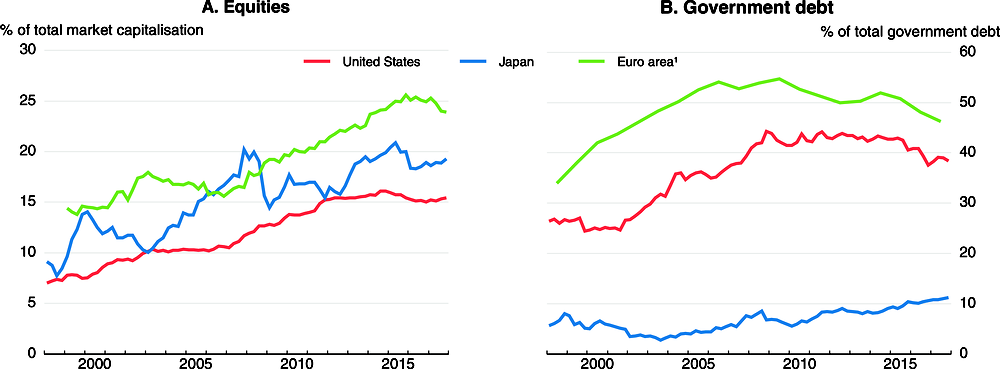
1. In Panel B, non-residents' holdings of government debt includes bonds held by residents of other euro area countries. The Maastricht definition of government debt is used in the denominator.
Source: Bank of Japan; European Central Bank; US Federal Reserve; and OECD calculations.
The findings on the importance of global factors for domestic financial variables are in line with other evidence on the global financial cycle, suggesting that a common global factor (the time-varying risk aversion of investors) can account for a substantial share of the variance of asset prices and capital flows across economies (Rey, 2015). This common factor is typically found to be correlated with widely-used indicators of risk aversion, such as the VIX index, and also with US monetary conditions (Forbes and Warnock, 2012; Miranda-Agrippino and Rey, 2017; Barrot and Serven, 2018). Common regional factors can also affect financial conditions. One example is the influence of banking sector conditions in Europe on cross-border bank flows, reflecting the importance of European banks in global banking prior to the global financial crisis (Cerutti et al., 2017a). Some studies suggest, however, that there has been little change in the role of global factors since the global financial crisis (Arregui et al., 2018) or that their importance has actually declined (Barrot and Serven, 2018). A possible explanation of the latter finding is that it reflects the decline in the cross-border banking sector flows in recent years, as discussed above.
The OECD analysis suggests that the role of global and regional factors in GDP fluctuations is generally weaker than for financial variables, although it has risen somewhat since the 1980s. It increased significantly during the global financial crisis (Figure 2.11), though this seems to be a temporary effect, largely related to the common recession in advanced economies.13 The finding that the role of common global factors in GDP fluctuations has increased over time is in line with many empirical studies, suggesting that trade integration strengthens business cycle synchronisation.14 Similar patterns are observed for fluctuations in inflation since 1995, with a higher contribution of global and regional factors in the 2007-17 period compared with the previous decade, possibly reflecting large swings in energy prices as well as sizeable global economic slack. However, global factors also played an important role also in the 1980s, possibly also as a result of oil price shocks at that time.
Country-specific factors remain important, suggesting that economic and financial conditions in individual countries can still deviate from global trends. Financial variables are generally more affected by global factors than real GDP growth and inflation, though the importance of the global common factor varies across different studies; in many it accounts for between one-quarter and one-half of the overall variation in capital flows and financial conditions (Cerutti et al., 2017b; Arregui et al., 2018; Barrot and Serven, 2018). Taken with the new results set out above, this suggests that global financial linkages or/and common financial shocks are stronger than real ones.15
There are several reasons to expect that the role of global factors will differ across time and countries, especially on the financial side (Guichard, 2017). For instance, changes in the composition of capital flows can result in differences in the overall exposure to global factors across countries and over time. Banking and portfolio capital flows, particularly in foreign currency, are more heavily affected by global factors than FDI flows, with the latter more likely to reflect local “pull” factors (Rey, 2015; Hoggarth et al., 2016; Eichengreen et al., 2017). The composition of investors may also affect the overall sensitivity to global factors. In particular, the growth of exchange-traded funds has helped to raise the overall sensitivity of portfolio flows to global risk factors, especially for EMEs (Converse et al., 2018).
Changes in responsiveness to shocks
The strengthening of cross-border trade and financial linkages implies that macroeconomic shocks in a given country or region are likely to have a larger impact on other economies over time. Equally, the rising share of the EMEs in global activity implies that macroeconomic developments in the OECD economies are likely to be increasingly affected by those in the non-OECD economies.
Three scenarios are used to explore the importance of these issues, using simulations on the NiGEM macro-model, with the first two based on variants of shocks discussed in past OECD Economic Outlooks. The first simulation considers the impact of a 2-percentage point decline in Chinese domestic demand growth for two years, focusing in particular on how cross-border effects via trade evolve as the structure of trade changes and as trade integration rises (OECD, 2015b). The second considers a collective sustained expansion in public investment in the G7 economies and the extent to which spillover effects vary according to different macroeconomic policy settings (OECD, 2016). The third illustrates some of the implications of the increasing strength of the global common factor in equity markets over time (see above). Each simulation illustrates particular aspects of changes in global integration, but does not seek to cover all possible channels of interaction across countries. All the simulations incorporate monetary and fiscal policy reactions, based on the standard policy rules in NiGEM, unless otherwise stated.16
The global impact of weaker demand growth in China
The direct trade-related effects on other economies from a 2-percentage point decline in Chinese domestic demand growth for two years are generally modest (Figure 2.13, Panel A). Growth in the OECD economies would be reduced by 0.1-0.2 percentage point per annum, with a somewhat stronger impact in Japan, as well as in other economies in East Asia and commodity exporters, both of whom are relatively exposed to China via strong GVC linkages.17 Overall, global trade growth is reduced by around 0.7 percentage point per annum over the first two years of the simulation. Spillovers from the shock would be larger if monetary policy in other countries did not react. Policy interest rates are reduced by over 25 basis points by the second year of the shock in the major OECD economies, and by more in the most heavily exposed economies (Figure 2.13, Panel B), helping to limit the negative effects on domestic activity. A range of additional factors could broaden the spillover effects from the negative demand shock in China, including potential adverse reactions in financial markets and declines in commodity prices (OECD, 2015b; Dieppe et al., 2018). Although multinational enterprises are not separately identified within NiGEM, part of the adjustment to weaker demand in China is likely to occur through the impact on the sales of foreign affiliates in China, and the consequential impact on domestic equity markets in their home locations (Figure 2.8).
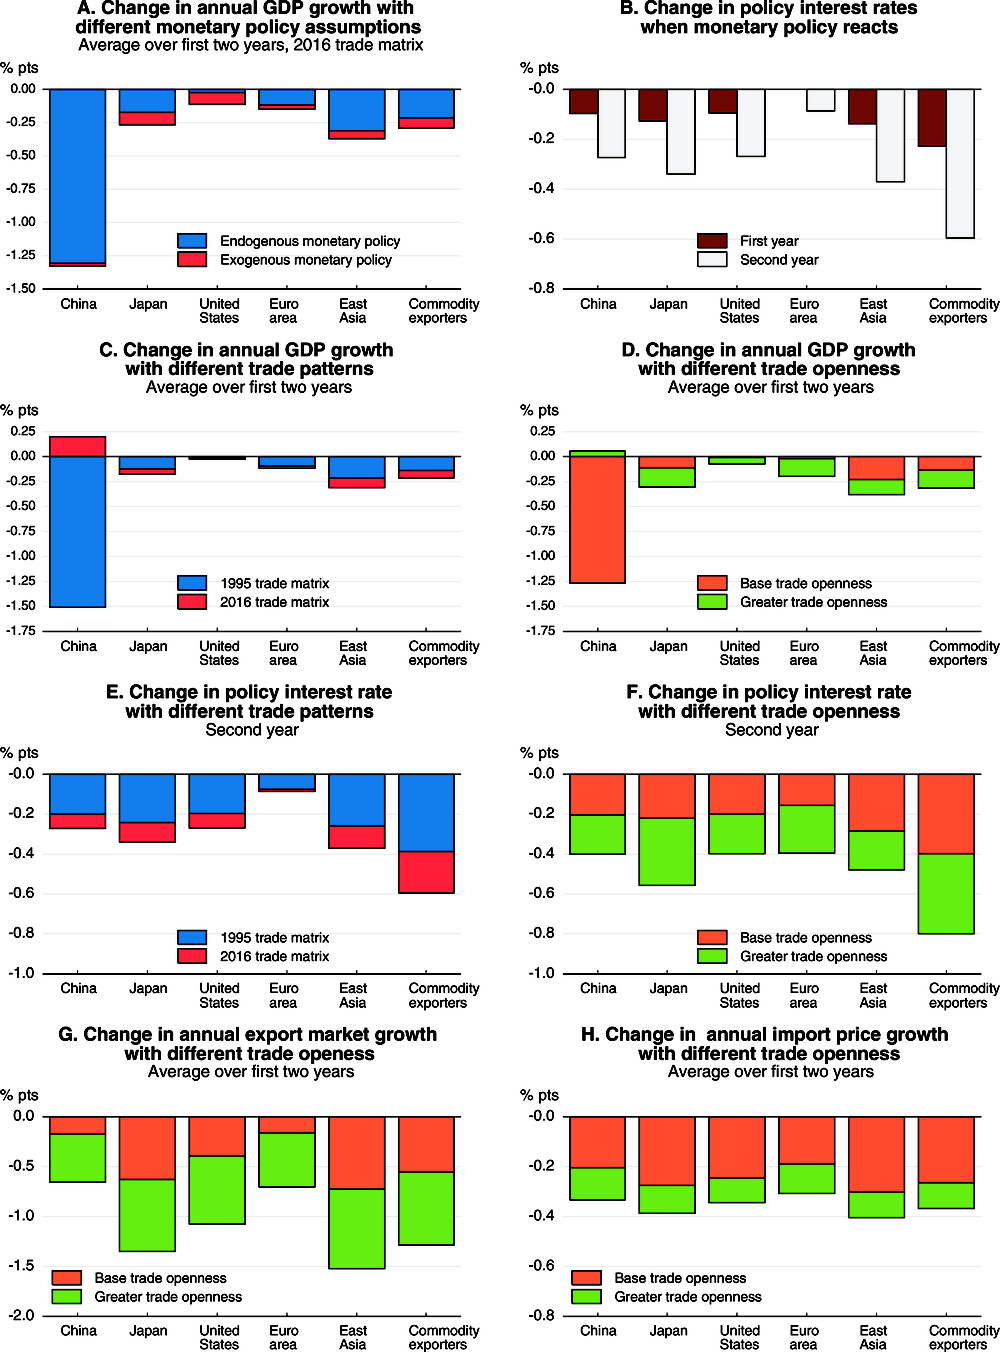
Note: Based on a decline of 2 percentage points in the growth rate of domestic demand in China for two years. Policy interest rates are endogenous in all areas, unless otherwise stated. The shocks with different trade matrices begin in 2018 and use 1995 or 2016 bilateral trade flows of goods and services. The shocks with different trade openness begin in 2009 (i.e. base trade openness) and 2031 (i.e. greater trade openness) respectively. East Asia comprises Korea, Singapore, Vietnam and the NiGEM bloc for East Asia. Commodity exporters comprise Australia, Brazil, Indonesia, Russia, South Africa and the NiGEM bloc for the Middle East.
Source: OECD calculations.
To assess how changes in trade patterns and trade intensities affect the size of spillovers, and the implications for the responsiveness of policy, two different versions of the basic simulation are undertaken. The first considers the impact of changes in the pattern and structure of trade by implementing the same shock to demand in China with an alternative version of the model using a bilateral goods plus services trade matrix based on 1995 data.18 This lowers the overall importance of China in global trade developments.19 The second considers the same shock to demand in China at two different points in time, using the same underlying bilateral trade matrix. This provides an indication of the importance of greater trade integration for the propagation of the shock to other countries.20
The overall pattern of results from changes to the trade matrix and from changes in trade integration remains broadly similar to the original results (Figure 2.13, Panels C and D). In both cases, the results shown are with endogenous monetary policy in all economies. The impact on GDP growth in China is smaller as China becomes more integrated into global markets, due to more of the initial shock being felt in other economies. Changes in the extent of trade integration have a slightly larger impact on the spillovers to other countries than changes in the structure of trade, at least in this particular example.21
-
The direct spillover effects to other countries via trade are offset by the greater responsiveness of monetary policy when using either the most recent trade matrix or when the economy is more open to trade (Figure 2.13, Panels E and F). In particular, the shock with greater trade integration is met with a more active monetary policy response to offset adverse spillovers.
-
Changes in trade volumes and trade prices both affect the size of spillovers from China. This is illustrated for the two scenarios with different degrees of trade integration (Figure 2.13, Panels G and H). Export market growth is hit more heavily in the scenario with higher trade integration, with the economies that trade most intensively with China again being most affected. However, all economies also benefit from lower import prices, reflecting their higher level of import penetration. In turn, the greater downward pressure on prices helps to prompt a larger reduction in policy interest rates.22
-
China also experiences spillback effects from the shock. Weaker demand in the rest of the world lowers the demand for Chinese exports and also lowers import prices into China.
The global impact of a sustained public investment stimulus in the G7 economies
The short-run domestic multiplier effects of a shock to public expenditure, and the spillover effects to other economies, depend on a variety of country-specific factors, such as the degree of openness, and the setting of monetary and fiscal policies. The simulation exercises shown here, building on those undertaken in OECD (2016), are all based on a permanent increase in public investment by the equivalent of ½ per cent of GDP in each of the G7 economies.23 Private sector agents and financial markets are both assumed to be forward-looking, so that expectations of a higher future public capital stock begin to boost private investment immediately, and monetary policies and exchange rates are endogenous in all economies.
For a single country shock, the first-year output multipliers are greater for countries that are less open to trade; multipliers are therefore higher in the United States and Japan, at around 0.8, compared with the major European countries (Figure 2.14, Panel A). A corollary of this is that fiscal multipliers in individual economies may have declined somewhat over time as economies have become more open, all else equal. With globalisation bringing tighter links between countries, collective action has become more powerful than taking individual actions. If all G7 economies implement the stimulus simultaneously, the first year GDP impact rises on average by over one-quarter, and by more in the countries which are more open to trade (Figure 2.14, Panels A and C).24
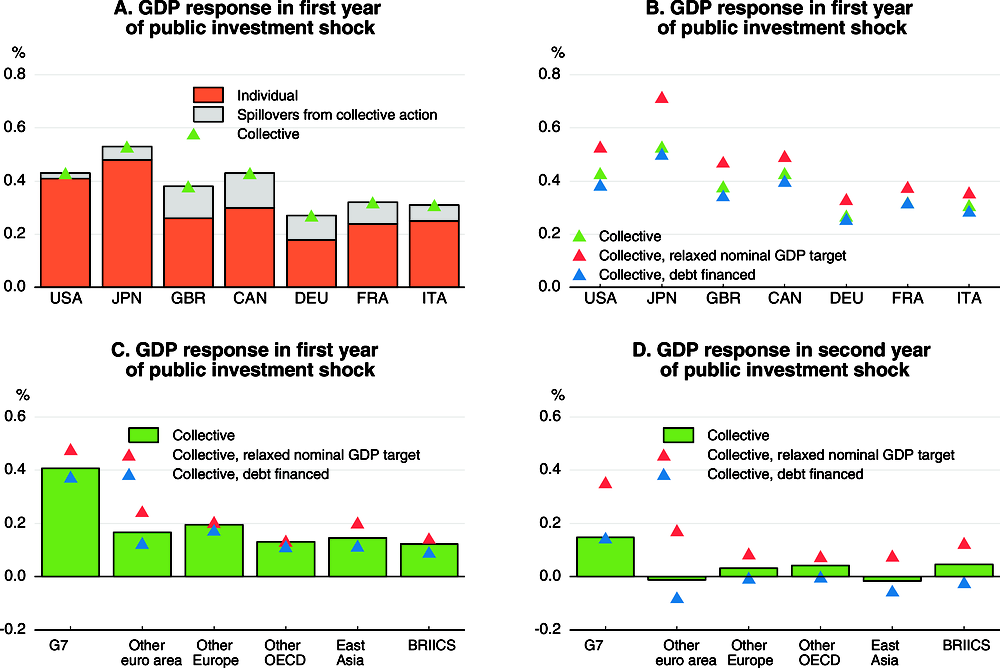
Note: Based on a permanent increase of 0.5% of GDP in public investment in the G7 economies. All countries and regions weighted together using purchasing power parities.
Source: OECD calculations.
The stimulus to demand in the G7 economies provides a boost to growth in other economies, particularly those in Europe that are strongly linked to demand in the major euro area economies, and also in East Asia, where exposure to trade is relatively high (Figure 2.14, Panel C). By the second year, these gains generally fade. In part, this fading reflects the reaction of monetary policy. Policy interest rates rise by around 30 basis points in the United States, Japan, the United Kingdom and Canada in the first 2-3 years of the collective simulation, reflecting the near-term stimulus to demand, before fading thereafter. Outside the G7 economies, policy interest rates generally rise by between 10 and 20 basis points. Higher interest rates contribute to the gradual crowding out of the short-term demand effects of the stimulus, but do not prevent the emergence of the longer-term supply-side benefits in the G7 economies of a higher public and private capital stock.
The policy rules being used in the countries from which the shocks originate (the G7 economies in this case) can have an important bearing on the size and persistence of short-term multipliers and spillovers to other countries.
-
If monetary policymakers perceive and react to the long-term improvement in supply from the higher public capital stock, policy interest rates (and accordingly long-term interest rates) rise by less than otherwise.25 This raises the first-year multipliers from the collective shock, especially outside the euro area countries (where policy is set for the euro area as a whole), and allows the demand benefits from the shock to persist for longer (Figure 2.14, Panels C to D).
-
Financing the fiscal stimulus by debt rather than by taxes leads to higher long-term interest rates and reduces the short and long-run benefits of the stimulus (Figure 2.14, Panels B to D).26 This results in the ratio of government debt to GDP rising by around 6-7 percentage points in each of the G7 economies over the medium term. Risk premia on government debt are higher, contributing to a permanent rise of around 25 basis points in long-term interest rates in the G7 economies. With integrated global financial markets, this persistent increase in long-term interest rates is reflected in other economies as well, reducing the spillover benefits of the stimulus.
The impact of a rise in the US equity risk premium
The scenarios below illustrate the short-term impact of a rise of 1 percentage point in the US equity risk premium for two years, using different assumptions about the strength of interlinkages between global stock markets.27 The rise in the risk premium reduces US equity prices by around 10%. The extent to which it is reflected in equity prices and risk premia in other countries will vary over time according to the importance of the (US-driven) global factor in national stock market developments (see above).
In a lower integration scenario, equity risk premia in other countries change in line with the strength of linkages prior to 1995, so that premia rise by around 60 basis points in the major advanced countries, and 40 basis points elsewhere. In a higher integration scenario, reflecting the strength of linkages over 2007-17, risk premia rise by around 80 basis points in the major advanced countries and 60 basis points elsewhere. Both scenarios are undertaken at a common point in time; in practice, the higher level of financial openness and development over time should also mean that any given shock to risk premia will have a larger economic impact now than in the past.
Stronger financial market integration increases the adverse spillovers from the US shock on output in all economies, but particularly so in Canada, the United Kingdom and Japan (Figure 2.15, Panel A). If there were no direct spillovers across equity markets at all, so that the equity risk premium rises only in the United States, the output effects would be much smaller in the other advanced economies, with the GDP level typically declining by only 0.1% by the second year of the shock.
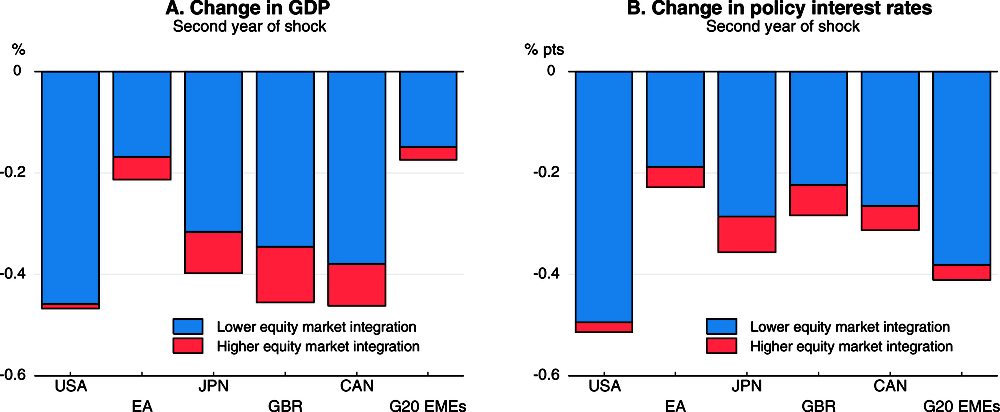
Note: Based on a rise of 1 percentage point in the US equity risk premium for two years. The strength of the associated spillover into equity risk premia in other countries changes over time according to the importance of global factors in equity markets. The scenario with lower equity market integration is based on linkages prior to 1995, and the scenario with higher equity market integration on linkages over the past decade. Policy interest rates are endogenous in all areas. All shocks begin in 2018. The G20 emerging market economies (EMEs) are weighted together using purchasing power parities.
Source: OECD calculations.
In both scenarios, the spillovers from the financial shock are cushioned by monetary policy easing, with interest rates declining by around ¼ percentage point in the major advanced economies by the second year and by ½ percentage point in the United States (Figure 2.15, Panel B). In practice, this could raise challenges for monetary policy if the shock were to occur at a time when policy interest rates are very low. If monetary policy did not respond to the shock at all, the GDP impact by the second year would be more negative, increasing by between one-quarter and one-half relative to that shown.
Changes in shock transmission mechanisms due to trade and financial market developments
Higher trade and financial integration and its changing nature are affecting the standard transmission mechanisms of shocks, by amplifying the impact of external shocks, raising the relative size of GDP effects of exchange rate changes working through financial channels compared with trade flow channels, and strengthening the role of bilateral US dollar exchange rates.
Aggregate demand and inflation effects of shocks with stronger and more complex trade linkages
Stronger trade integration has increased the importance of cross-border demand for domestic economic conditions. In particular, the growing importance of EMEs as a destination of advanced economies' production, and vice versa, has raised their mutual dependence. This stronger interdependence has occurred mostly within the three regional trading blocks, as discussed above.
Extensive GVCs bring well-known economic benefits28 but can also amplify downturns. During a crisis, uncertainty prompts producers to revise down their forecasts for future demand, leading to a cut in their production, and also inventories and orders to their intermediate suppliers (Gangnes et al., 2012). The amplification of the initial demand shock to upstream suppliers is stronger when production is fragmented across borders. This is because firms that rely on imported supplies typically hold higher inventories than those that rely on domestic supplies alone, and order less frequently (Escaith et al., 2010). However, outside a crisis period, there is only limited evidence of this effect.
Higher participation in GVCs can also increase the risk of cross-border supply disruptions. Experience shows that local events in one country (e.g. the Great East Japan Earthquake in 2011) can easily spill over via supply chains to other countries (OECD, 2011b). As GVCs have expanded, countries have become more vulnerable to supply disruptions, due to more complex, lengthy and inter-dependent supply chains. The increasing share of exports measured in value-added terms that passes via at least one third market before it reaches its final destination is a simple indicator of the growing complexity and vulnerability of supply chains (Figure 2.16). It often amounts to a third of the total value added exported from the source to the final destination. In some cases, for example Korean exports to Japan, this share has increased significantly from 1995 to 2014 (the latest available data). This indicates that Korean producers are exporting a greater share of their value added via third markets, including China, the United States and Indonesia, rather than directly to Japan. Consequently, Japanese and Korean trade has become exposed to local disruptions in these markets.
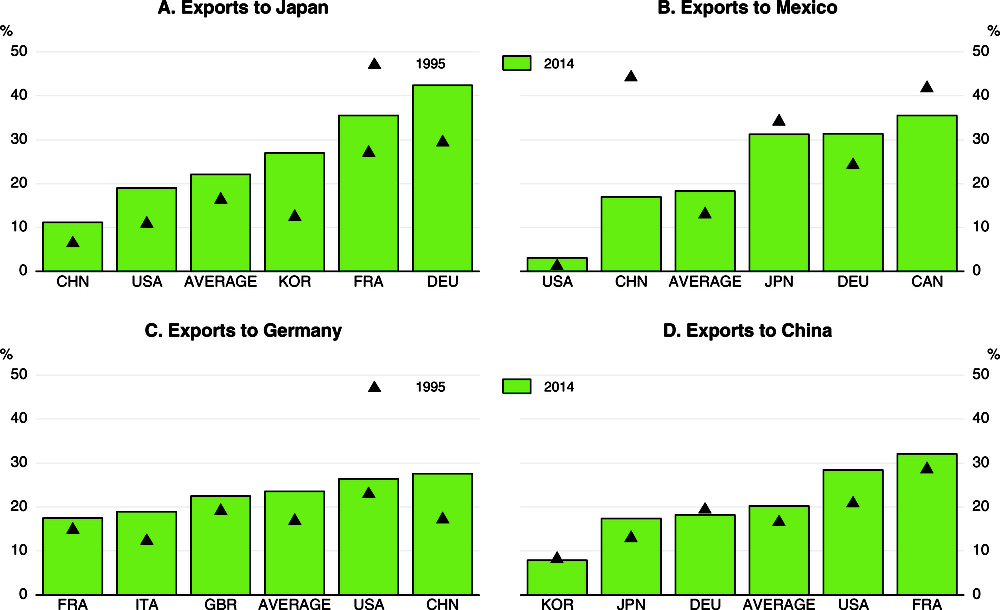
Note: The five largest sources of value added exports in rank order are shown for each of the four final destinations of Japan, Mexico, Germany and China. The average for the countries shown is weighted by value added exports in 2014.
Source: OECD TiVA Database; and OECD calculations.
Rising import penetration means that domestic prices are more strongly influenced by imported inflation than previously. With the ensuing rise in the share of domestic demand sourced from abroad, combined with a switch to imports from low-cost countries, globalisation has reduced consumer price inflation in the OECD countries (Pain et al., 2006; Borio and Filardo, 2007), although this is offset to some extent by the upward pressure on global commodity prices from moving production to more commodity-intensive economies. Participation in GVCs is also found to be associated with lower growth of value-added deflators and unit labour costs at the sectoral level, notably before the financial crisis (Andrews et al., 2018). The latter effect is particularly significant for GVC participation with low-wage countries.
The impact of exchange rate changes on trade flows may have weakened
The expansion of GVCs has made trade volumes less reactive to exchange rate changes, particularly in the aftermath of the global financial crisis (Ollivaud et al., 2015). With the expansion of GVCs, the increased cost-competitiveness of exports from exchange rate depreciation is increasingly offset by the rising cost of intermediate imports, and vice versa. Corroborating this, a comparison of the responsiveness of export and import volumes to a change in relative prices in the OECD's trade equations estimated in Pain et al. (2005) and Morin and Schwellnus (2014) shows a decline in the long-run relative price responsiveness of import volumes and, to a lesser extent, export volumes for the majority of OECD countries (Figure 2.17).29 Firms are still affected by exchange rate moves, but increasingly this may occur via the impact of currency fluctuations on profit margins, as pricing-to-market becomes more prevalent (see below).

Source: OECD calculations.
The US dollar remains an important invoicing currency in international trade, with the growing shares of merchandise trade involving EMEs and commodities tending to raise the share of trade invoiced in US dollars (Box 2.2). This has potential implications for trade responses to exchange rate changes. Euro invoicing has also risen over time, but this is mostly confined to regional trade within the euro area. The evidence also suggests that invoicing currency prices tend to be sticky with respect to changes in nominal exchange rates (Gopinath, 2015). The implications of these invoicing practices include:
-
Changes in the US exchange rate may have a stronger impact on non-US trade. One recent study suggests that a 1% US dollar appreciation against all other currencies might reduce the volume of total trade between countries in the rest of the world by 0.6-0.8% (Boz et al., 2017). This is because the appreciation makes the imports from all countries invoicing in US dollars more expensive, not just those from the United States, thereby reducing import demand for them all (Casas et al., 2016).
-
There may be cross-country differences in the impact of exchange rate fluctuations on inflation (Gopinath, 2015). In the United States and the euro area, the exchange rate pass-through to domestic prices increases as the local currency invoicing share falls, controlling for standard determinants of the pass-through (Gopinath, 2015; Özyurt, 2016). In the United States, where almost all of its imports are invoiced in US dollars, domestic inflation is more insulated from exchange rate shocks than other countries (Chahrour and Valchev, 2017). As a result, US monetary policy and associated exchange rate moves have stronger spillover effects on other countries' inflation than vice versa (Goldberg and Tille, 2008), although US monetary policy is only one of many influences on global financial conditions (Powell, 2018).
The US dollar has been the main international currency and the dominant currency in international transactions for many years (Auboin, 2012). Using a sample of countries representing around 60% of world trade, Gopinath (2015) estimates that the invoicing currency share of the US dollar is between four and five times higher than the United States’ share of world imports, and over three times higher than its share of exports. Some 90 countries in the world have a currency that is explicitly or implicitly pegged to the US dollar (Auboin, 2012). This further encourages the US dollar denomination of trade. Taking into account both pegs to the US dollar and market-driven co-movements, some estimates suggest that the US dollar zone may represent more than half of global GDP (Ito et al., 2015).
The US dollar is used extensively in the trade of emerging market economies (EMEs) and for exports from commodity producers (first figure below). Elsewhere, the US dollar is relatively more important for imports than for exports. The rising share of EMEs in global trade has tended to push up the role of the US dollar in international trade over time. However, this is not the case for all countries. In China, the share of exports invoiced in US dollars is estimated to have declined in recent years, from around 80% in 2014 to 72% in 2016.
The introduction of the euro increased the invoicing of trade in the common currency in the euro area at the expense of the US dollar (Kamps, 2006). However, over the past decade, the euro share of extra euro-area exports and imports of goods from the euro area has been largely stable (ECB, 2017). There are few countries outside the euro area that invoice their exports primarily in euros, with the exception of some small open EU member states with strong GVC trade linkages with euro area countries (first figure below).
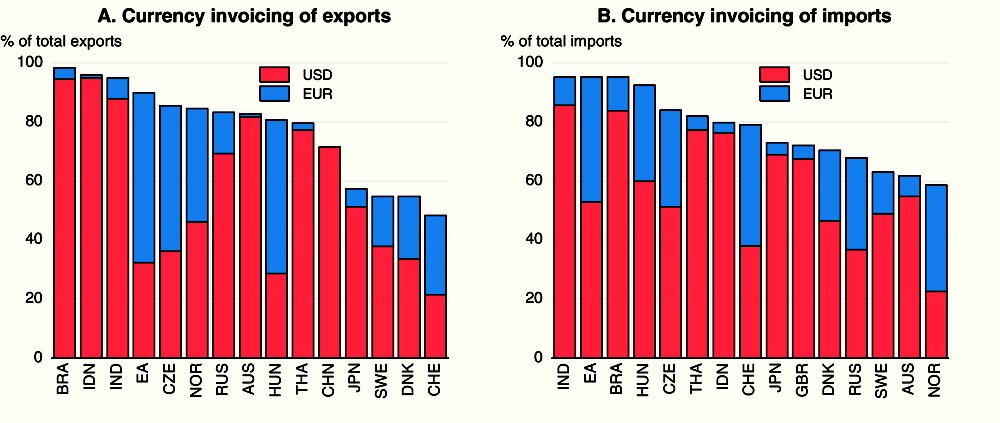
Note: The data refer to 2016 for all countries apart from Australia (2015-16), Indonesia (2010 to 2015), India (2012 to 2013) and Brazil (2011). Merchandise trade for all countries apart from Russia (goods plus services). Data for all EU member states are for extra-EU trade only.
Source: Australian Bureau of Statistics; Central Bank of Brazil; Central Bank of Russia; Eurostat; Japan Customs; Ministry of Finance of the Republic of Indonesia; Reserve Bank of India; and OECD calculations.
The US dollar has also continued to dominate international financial transactions, despite the introduction of the euro (figure below). Based on SWIFT data, the US dollar remains the predominant currency for international and domestic payments. Its use increased from 30% to 40% of transactions between 2012 and 2017. In comparison, despite strong growth in 2017, the share of the Chinese RMB remains less than 2% (SWIFT, 2018). The share of the euro in international debt securities and loans increased significantly prior the global financial crisis but declined afterwards, mainly driven by borrowers within the euro area. The euro has become more important in international financial transactions but its usage has been largely limited to euro area countries. In contrast, US-dollar-denominated international financing has increased due to borrowers outside the United States, especially EMEs in recent years.
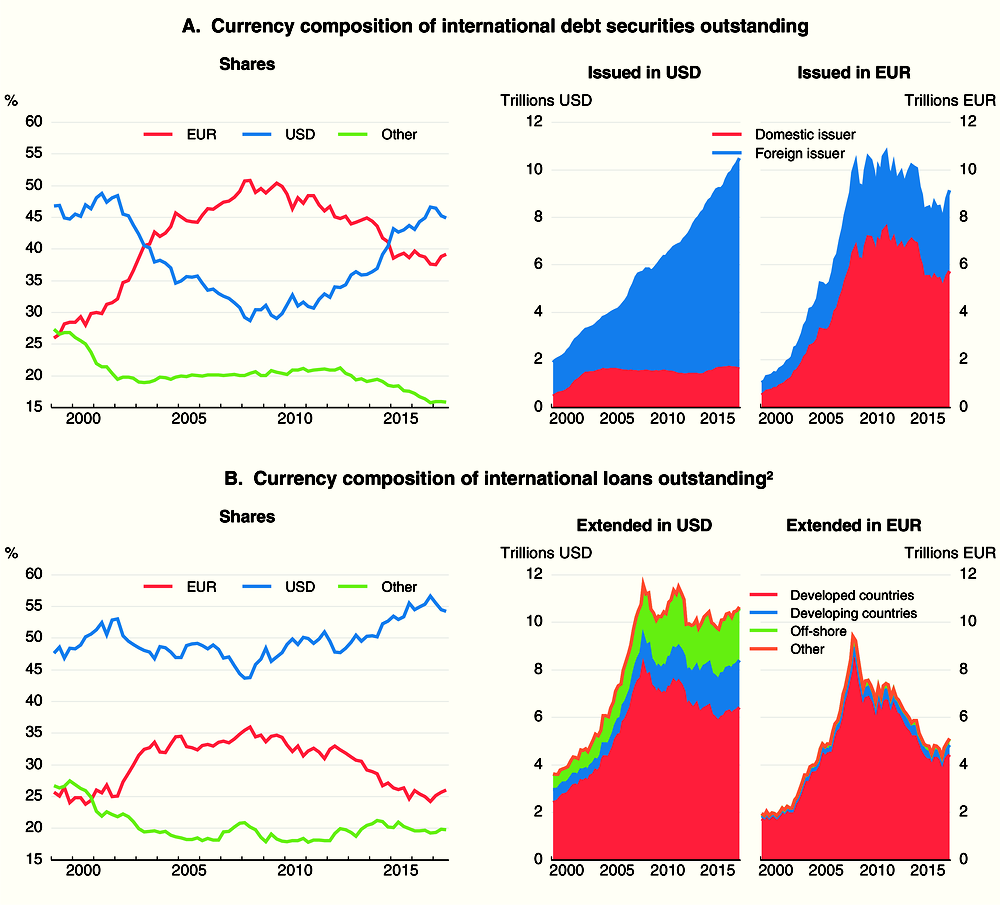
1. The latest observation is for 2017Q3.
2. Data on loans includes inter-bank loans.
Source: Bank for International Settlements; and OECD calculations.
Wealth and income effects from international investment positions have strengthened
Higher international asset and liability positions expose countries to stronger investment income flows and wealth effects from international investment positions, including from exchange rate moves, even if there are no active changes in investment portfolios:
-
Income streams from foreign assets and liabilities have been rising since the early 2000s and account for on average at least 3-4% of GDP in the G7 economies (Figure 2.18). Thus, changes in the returns on foreign financial assets (reflecting also exchange rate moves) are increasingly important for the income of investors in these economies. Given relatively high cross-country correlations in financial asset price fluctuations, common negative shocks could reduce the income streams from both domestic and foreign financial investments. This lowers the benefits of international investment diversification, unless moves in exchange rates offset income losses denominated in foreign currencies.
-
Similarly, changes in exchange rates can give rise to wealth effects on international investment positions (Bénétrix et al., 2015). For instance, based on asset and liability holdings in 2017, a 10% appreciation of the US dollar against all other currencies increases the value of net assets by around 7% of GDP in Canada and the United Kingdom, and by around 3% of GDP in Argentina, China, Japan and Korea (Figure 2.19). In contrast, the appreciation lowers net assets by around 6% of GDP in the United States. In many of these countries, the effects are between two and three times bigger than two decades ago. In other G20 economies, the effects on net assets are much smaller but gross effects on international assets and liabilities are still sizeable, implying potentially large fluctuations in net financial worth for individual investors.
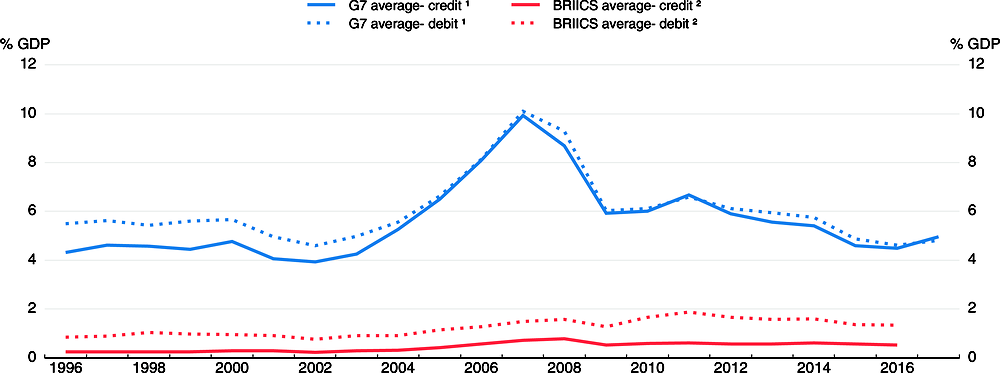
1. G7 countries include Canada, France, Germany, Italy, Japan, the United Kingdom and the United States.
2. BRIICS include Brazil, Russia, India, Indonesia, China and South Africa.
Source: IMF Balance of Payments Statistics; OECD Economic Outlook 103 database; and OECD calculations.
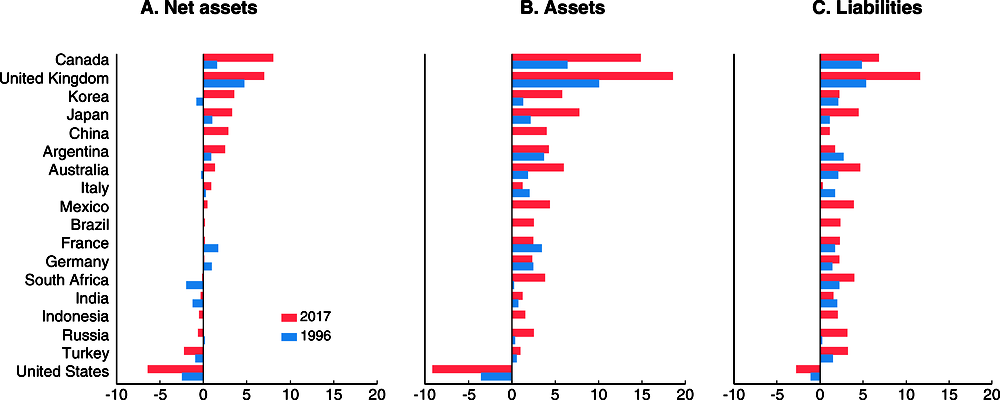
Note: The reported effects, due to 10% appreciation of the US dollar against all other currencies, are calculated with assets, liabilities and GDP expressed in US dollars, and thus account for changes in nominal GDP expressed in US dollars. They are based on international investment position data (excluding derivatives when the data are available) for 1996 and 2017 and the currency composition of assets and liabilities as of 1996 and 2012 estimated by Bénétrix et al. (2015).
Source: IMF Balance of Payments Statistics; Bénétrix et al. (2015), “International Currency Exposures, Valuation Effects and the Global Financial Crisis,” Journal of International Economics, 96(S1), 98-109; and OECD calculations.
While the above simulations use aggregate data for the whole economy, the macroeconomic implications of income and wealth effects stemming from international investment positions depend largely on the distribution of assets and liabilities within the economy. Negative shocks to the liability side (rising liabilities and payments on them) are likely to be more consequential in aggregate than positive shocks to the asset side of the same magnitude, if households and businesses with foreign debt do not hold any foreign assets, and vice versa. This is because the marginal propensity to consume from income and wealth is usually higher for debtors than savers. This may be relevant for EMEs, where net international assets of the private sector are smaller than overall net assets given large central bank reserves.
Policy implications of greater and changing interconnectedness
Closer global trade and financial integration can bring substantial benefits for economic growth and long-term living standards around the world. It also poses policy challenges by enhancing the risk of negative shocks and spillovers that can have adverse consequences for particular firms, workers and regions. Countries – individually and collectively – can deal with some of the consequences of such shocks through macroeconomic policy adjustment, putting in place framework conditions (such as exchange rate arrangements and prudential rules for the financial sector) that make them more stable and resilient to adverse spillovers, and making active use of structural reforms and improved social safety nets to help adjust to global changes and make the most of globalisation. But in many cases, common shocks and spillovers can be more effectively dealt with by collective policy co-ordination to help mitigate some of the trade-offs. While this can result in better global outcomes, it is often difficult to achieve in practice. Thus, it is essential to establish and foster global standards and rules of conduct, and continue multilateral dialogue, including via the G20.
Implications for domestic policy
Macroeconomic policy and exchange rate arrangements can help to buffer shocks
Whilst globalisation has altered the impact of domestic monetary policies in the OECD economies, and the effectiveness of different policy channels, it has not removed the capacity to eventually stabilise economies. As shown in the simulation analyses above, stronger trade and financial linkages across countries imply that shocks originating in one location have a larger impact on activity in other economies over time. This implies that national policymakers need to respond more promptly and more vigorously to foreign economic shocks in order to limit their impact on domestic policy objectives. The extent of these effects depends on the respective strength of cross-border linkages with the rest of the world. At the same time, policymakers may need to respond less to domestic country-specific shocks, since enhanced integration means that a greater share of the effects of such shocks is likely to be absorbed by other countries.
The extent to which domestic policy can adjust to an adverse shock from outside the country depends on the policy space available. Spillovers may be particularly difficult to deal with if they occur at a time when policy space is limited, as it is in many countries at present. In such cases, it may be easier for macroeconomic policy to respond when the negative shock is common to the majority of countries, most likely if it is a financial one (Figure 2.15). Trade spillovers may be more challenging to deal with, given the extent to which supply chains and final markets differ across countries. For instance, commodity-exporting economies may need to ease policy more vigorously following an adverse shock in China (Figure 2.13).
A floating or a flexible exchange rate remains the best arrangement to help limit external shocks affecting the domestic economy, even though its aggregate impact has changed over time, with wealth effects and changes in profit margins on traded products becoming more important relative to changes in trade volumes. Advanced economies, and the euro area as a whole, typically operate with freely floating currencies which help to buffer shocks from abroad. Flexible exchange rate arrangements are also found to reduce external shocks in EMEs. For example, domestic financial conditions in EMEs operating with flexible exchange rates seem to be less prone to respond to global financial conditions than EMEs pegging their exchange rate (Obstfeld et al., 2017). Although exchange rates should be allowed to adjust flexibly to changing fundamentals, transparent and temporary interventions may still be required on occasion to help reduce short-term currency volatility and financial instability. While considering interventions, their possible limited effectiveness should be taken into account.
Strengthening domestic resilience to adverse external shocks
Given strong international financial spillovers, countries also need to improve their resilience to external financial shocks (Caldera Sánchez et al., 2017). Authorities should ensure adequate regulation and supervision to secure sufficient capital and liquidity buffers of banks and other financial institutions. Prudential policies are particularly useful for helping to prevent a build-up of financial vulnerabilities in specific markets, in particular credit growth.30 Such measures remain important in the current environment of still low interest rates and abundant liquidity. Prudential measures could also focus on alleviating risks of currency and maturity mismatches and credit risks, though the evidence of their effectiveness is mixed. In this context, the expansion of macro-prudential policy and currency-based measures since the global financial crisis reflects increased efforts by regulators in advanced and emerging market economies to increase the resilience of the financial system (Figure 2.20).
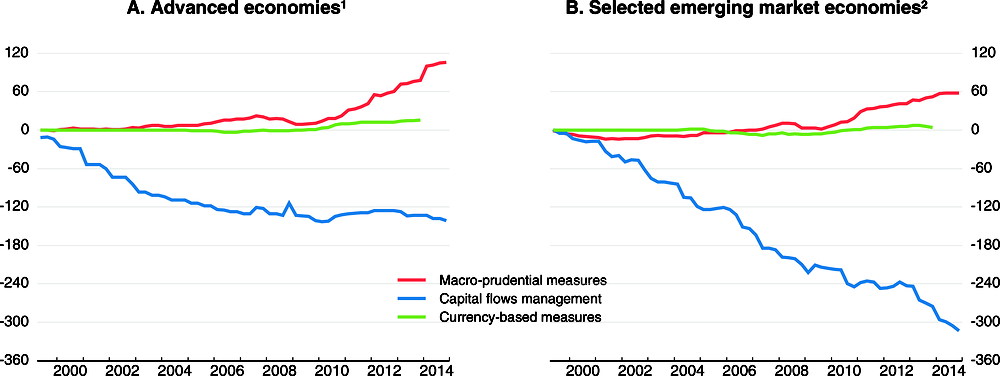
Note: The easing or the removal of a financial policy is coded as -1; the tightening or introduction of a financial policy is coded as +1.
1. Advanced economies include Australia, Austria, Belgium, Canada, the Czech Republic, Denmark, Estonia, Finland, France, Germany, Greece, Iceland, Ireland, Israel, Italy, Japan, Korea, Latvia, Luxembourg, the Netherlands, New Zealand, Norway, Portugal, the Slovak Republic, Slovenia, Spain, Sweden, Switzerland, the United Kingdom and the United States.
2. Selected emerging market economies include Argentina, Brazil, China, Colombia, Hungary, India, Indonesia, Malaysia, Mexico, Poland, Russia, South Africa and Turkey.
Source: OECD calculations based on the IMF AREAER for capital flow measures; Cerutti et al. (2016), “Changes in Prudential Policy Instruments – A New Cross-Country Database”, IMF Working Paper Series, No. WP/16/110; and Kuttner and Shim (2016), “Can Non-Interest Rate Policies Stabilize Housing Markets? Evidence from a Panel of 57 Economies”, Journal of Financial Stability, 26, 31-44, for macro-prudential measures; and de Crescenzio et al. (2015), “Currency-based Measures Targeting Banks - Balancing National Regulation of Risk and Financial Openness”, OECD Working Papers on International Investment, No. 2015/03, for the currency-based measures.
As inward FDI investments tend to be more stable than inward portfolio capital and debt-related investments, a safer structure of foreign liabilities and a reduction of the risk of volatile capital flows can be promoted by reducing regulatory burdens on foreign direct investment, easing strict product market regulation and removing tax incentives for debt over equity financing (Ahrend et al., 2012). Structural reforms to boost potential growth and help ensure fiscal sustainability, and thereby improve general macroeconomic fundamentals and investors’ confidence, should also strengthen resilience.
Integrated domestic policy packages are needed to make the effects of globalisation more inclusive
Increased trade intensity, GVCs and offshoring have all raised concerns about their potential impact on employment and inequality (OECD, 2017a). The evidence suggests, however, that increased trade has played a less prominent role in overall employment and inequality developments than other factors, particularly technology (OECD, 2011a; Lopez Gonzalez et al., 2015; OECD, 2017a). Even so, increased international competition can have significant adverse effects at the local level (Autor et al., 2013, 2016) and for lower-skilled workers.31
As stressed in the June 2017 OECD Economic Outlook, mitigating the negative effects on vulnerable regions and workers requires broad and integrated policy packages. Improving the capacity of regions to cope with the dislocation of economic activities requires increasing human capital, upgrading physical capital and raising industrial diversification at the local level and improving transport connections to other regions (OECD, 2017a). To help vulnerable workers adjust to new circumstances and move to expanding activities, active labour market measures to assist displaced workers should be enhanced, barriers to occupational and geographical mobility need to be lowered, including in housing markets, and workers should be provided with the opportunities to develop new skills needed in the labour market (see Chapter 1).
Collective global policy requirements
Although individual countries can take measures on their own to reduce the impact of external shocks, a collective response is more efficient in many cases and essential in some. Collective action is particularly important when countries are simultaneously hit by adverse common shocks or to strengthen financial safety nets to deal with potential crisis-related foreign currency shortages. An effective global rules-based system is indispensable to harness the efficiency-raising potential of international trade and finance. It is also needed to ensure that particular actions taken by individual countries to strengthen their own resilience to external shocks do not impose excessive cross-border costs or add to global imbalances, and to limit the scope to take advantage of free movement of products and finance to reduce domestic taxes and engage in illicit activities.
Macroeconomic policy co-ordination and global financial safety nets
International macroeconomic policy co-ordination has often been difficult to achieve outside crisis periods.32 This may reflect the statutory focus on domestic goals of national economic authorities, as well as differing assessments about the extent and direction of spillovers and hence the need for co-ordination. Views may also differ about the effectiveness and the appropriate use of particular macroeconomic policy instruments. In addition, there may be an inherent bias for large countries to act unilaterally, given that their trade and financial integration is still comparatively small.
In crisis periods, however, there has been stronger consensus about objectives and needs, and international co-ordination has been put in place swiftly. This was the case at the start of the global financial crisis, when G20 economies jointly implemented a massive fiscal stimulus, and monetary authorities provided emergency US dollar liquidity. Given the large economic and social costs of global recessions, such co-ordination, even if not formalised, is more urgent than during normal times. Besides, the multipliers of concerted fiscal stimulus during recessions tend to be higher than in normal times. With continuous monitoring of, and dialogue about, the health of the global economy in the context of the G20 since the onset of the global financial crisis, the institutional arrangements for rapid co-ordination of macroeconomic policies, if needed, have become stronger than before.
Global financial safety nets could be enhanced. Establishing international currency swap lines among monetary authorities could be useful to limit short-lived foreign currency liquidity problems and to mitigate their effects on economic conditions. The conversion of temporary bilateral liquidity swap arrangements among six key central banks to standing arrangements in October 2013 was a welcome development in the aftermath of the global financial crisis.33 Similar agreements could be considered between EMEs and advanced economies and between individual EMEs, though asymmetric information and moral hazard complicate reaching such agreements in practice.34 Regional financing arrangements, which have expanded strongly since the global financial crisis, can also provide further assistance.
The increased international activity and mobility of businesses, and the associated rise in opportunities for profit shifting and base erosion, call for common standards on corporate taxation to safeguard domestic tax bases and avoid fiscal imbalances. The OECD has contributed to developing and producing global standards in this domain, with its Base Erosion and Profit Shifting (BEPS) Project (Box 2.3). Currently, more than 110 countries and jurisdictions have joined the global fight against base erosion and profit shifting through their membership of the Inclusive Framework on BEPS. The OECD and partner organisations also provide technical assistance to developing countries to support the implementation of the BEPS package.35
Prior to the financial crisis, globalisation, with its increased levels of international economic activity, contributed to high corporate tax revenues in many jurisdictions. In the OECD, over the past 20 years, the peak for the median country was registered in 2007 with corporate tax revenue amounting to 3.6% of GDP (figure below).
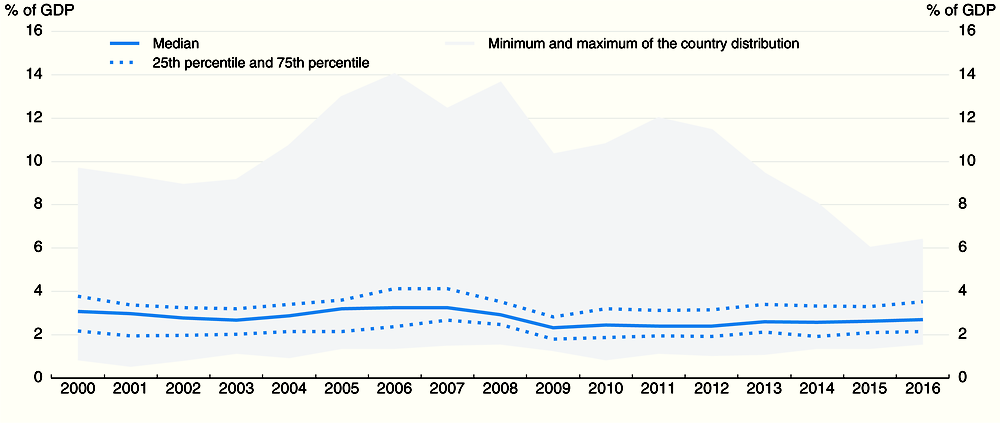
Source: OECD (2017), Revenue Statistics: 1965-2016.
Nonetheless, globalisation has also strained the functioning of the international tax system as it was conceived in the first half of the twentieth century. In particular, the growing importance of intangible assets and the interconnectedness of global value chains have allowed companies to shift profits from high to low or zero tax jurisdictions at negligible costs. The ease of moving income flows and intangible assets from one jurisdiction to another has allowed some firms to exploit mismatches in the international tax system and to achieve very low effective rates of taxation and to erode the tax bases of many countries. OECD analysis has estimated the global corporate income tax revenue losses to be in the range of 4% to 10% of corporate income tax revenues (i.e., USD 100 to 240 billion annually at 2014 levels).
Key features and participation
While tax sovereignty is a core feature of a sovereign state, the scale of interconnectedness and the extent of cross-border activity mean that when governments act alone, this sovereignty may be only nominal. With this in mind, the OECD/G20 Project to address Base Erosion and Profit Shifting (BEPS) was launched following a request by G20 Leaders in June 2012 to identify the key issues that lead to BEPS. It was followed by the 15-point BEPS package in October 2015. It was developed by 44 countries, including all OECD and G20 members participating on an equal footing, as well as through widespread consultations with more than 80 other jurisdictions and stakeholders including business, academics and civil society.
The package sets out a variety of measures: new minimum standards, the revision of existing standards, common approaches that will facilitate the convergence of national practices, and guidance drawing on best practices. In particular, the four minimum standards - fight harmful tax practices; prevent tax treaty abuse, including treaty shopping; improve transparency with country-by-country reporting; and enhance effectiveness of dispute resolution - were agreed to tackle cases where no action by some jurisdictions would have created negative spillovers (including adverse impacts of competitiveness) on others.
The Inclusive Framework on BEPS was created in 2016 to ensure the consistent implementation of the BEPS package across different countries. It now brings together over 110 countries and jurisdictions on an equal footing to collaborate on the implementation of BEPS measures.
Important steps were reached in June 2017 and in January 2018, on the occasion of the first and second signing ceremonies of the Multilateral Convention to Implement Tax Treaty Related Measures to Prevent BEPS, also known as the “BEPS Multilateral Instrument”. With 76 jurisdictions having joined to date, it already covers over 1,200 bilateral tax treaties that will be updated to implement several of the BEPS measures. With a sufficient number of countries having ratified it, the BEPS Multilateral Instrument will enter into force on 1 July 2018, with effect as from 1 January 2019. More jurisdictions are expected to sign and ratify the instrument in the coming period, with an overall objective to modify up to 2,500 existing bilateral treaties.
Implementation
The implementation of the BEPS package is now well underway. Countries are taking action on many fronts, including on BEPS actions that go beyond the four minimum standards. For example, the international provisions of the recent tax reform in the US include measures that implement BEPS actions on interest deductibility and anti-hybrid rules.
The peer review processes of the four BEPS minimum standards have started or will start shortly:
-
Fight harmful tax practices. In-depth evaluations have been completed to assess the implementation of this BEPS area. They cover the exchange of tax ruling information, with over 11,000 rulings already identified and now being exchanged. They also identify harmful preferential regimes. Over 160 regimes have already been reviewed, many of which have been amended or are in the process of being amended or abolished.
-
Improve transparency with country-by-country (CbC) reporting. Over 60 jurisdictions already have put in place a comprehensive domestic legal framework for CbC reporting, and around 55 jurisdictions required or permitted the filing of CbC reports in 2016. This included the headquarter jurisdictions of substantially all MNE groups with global revenue above EUR 750 million, implying that over 1,400 exchange relationships have been activated.
-
Enhance effectiveness of dispute resolution. This deals with the improvement of mutual agreement procedures (MAP) across jurisdictions taxing the same multinational groups. 21 jurisdictions have already been subject to peer reviews, eight are currently underway, and 43 more have been scheduled through December 2019.
-
Prevent tax treaty abuse, including treaty-shopping. This BEPS action point can be implemented by participating in the BEPS multilateral instrument or through bilateral treaties. As many jurisdictions will only ratify the BEPS multilateral instrument or bilateral treaties implementing the minimum standard in 2018, the review of the implementation of the minimum standard on treaty-shopping will only begin in 2018. The terms of reference and methodology for these reviews have already been agreed.
Collectively minimising negative spillovers from domestic policies to strengthen resilience and safety nets
The use of domestic prudential measures can lead to cross-border spillovers and regulatory arbitrage across jurisdictions. The spillovers could be positive, with improved stability in one country reducing risks of instability in other countries. They could be also negative, with tighter measures in one country generating credit leakage or reallocation effects (IMF/FSB/BIS, 2016). For instance, empirical evidence suggests that cross-border bank credit spillovers may arise from measures that aim to raise liquidity and target the composition of banks' funding, as well as from sectoral instruments that target indebtedness (Buch and Goldberg, 2017; Kang et al., 2017). Similarly, the adoption of capital flow control measures may generate spillovers by diverting the flow of capital to other countries acting as substitute destinations (Forbes et al., 2016). Such measures are often implemented on a temporary basis to curb surges of capital inflows that may generate financial fragilities or to limit the appreciation of overvalued currencies.
Steps to enhance resilience by building up buffers in one country can have adverse effects on other countries, or complicate necessary adjustments between groups of economies. For instance, steps to accumulate large-scale foreign exchange reserve buffers by EMEs, which provides one means of protecting themselves from adverse shocks from abroad, can sometimes lead to negative international spillovers. Some EMEs in Asia, notably China, have accumulated large foreign exchange reserve assets (Figure 2.21). These are predominantly invested in US assets and thus can affect prices of financial assets, in particular US government bonds.36 Global financial safety nets could help to reduce the incentives for reserve accumulation. Moreover, to the extent that reserve asset accumulation has reflected a policy of restraining domestic demand and limiting exchange rate appreciation, it has contributed to current account surpluses in these economies, with adverse effects on trading partners and global growth.
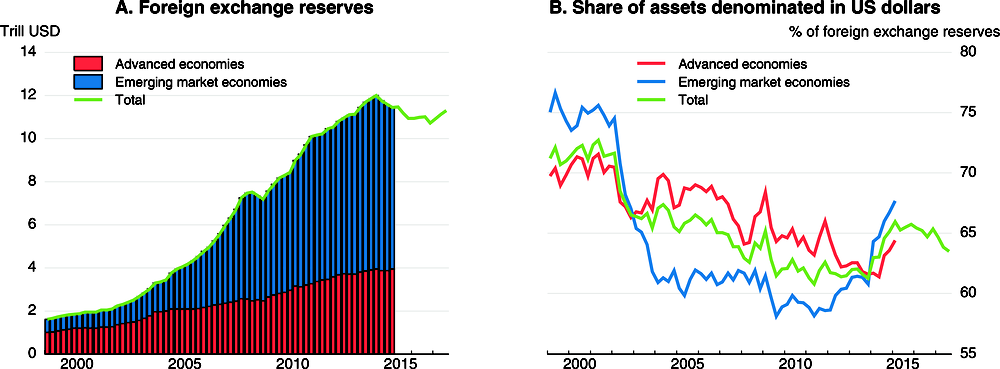
Note: Advanced and emerging market economies as defined by the IMF.
Source: IMF Currency Composition of Official Foreign Exchange Reserves (COFER) database.
To reduce the risk of adverse spillovers, the international community has put in place agreements that specify the appropriate use of instruments that influence capital flows. The OECD Code of Liberalisation of Capital Movements is an example of an established and tested process of transparent international dialogue and co-operation on capital flow management issues and policies (OECD, 2017e). The Code has provided a balanced framework for countries to progressively remove barriers to the movement of capital, while providing flexibility to cope with situations of economic and financial instability. As “beggar-thy-neighbour” approaches can have negative collective outcomes, the adherent countries have agreed under the Code to well-tested principles, such as transparency, non-discrimination, proportionality and accountability, to guide their recourse to controls. This agreement and continued discussion help to prevent welfare-reducing retaliation among countries and to ensure a fair and transparent response to capital flow volatility. The review of the Code and on-going adherence reviews of major non-OECD G20 members further raises opportunities for greater international co-operation.
Regulatory co-operation can help address global challenges
The international community needs to co-ordinate its efforts to develop global standards to ensure inclusive and sustainable growth and to address global challenges such as the protection of the environment, malicious cyber activity, illicit trade and corruption (OECD, 2018e). The OECD contributes to dealing with some of these challenges, in particular through the Oslo dialogue on fighting tax crimes and other financial crimes, the OECD Anti-Bribery Convention, the OECD Task Force on Countering Illicit Trade, the recently created Global Forum on Digital Security for Prosperity and its work on International Regulatory Co-operation. Regulatory co-operation is necessary to ensure effective regulations and prevent gaps or scope for arbitrage in these fields.
There is a long history of international regulatory co-operation to try and develop common and better rules and regulations in several specific domains (OECD, 2013c), and there has been a rapid expansion in trans-governmental networks of regulators (Figure 2.22; OECD, forthcoming). Countries have adopted various approaches in co-operating, including information exchange, soft law, joint standard setting through inter-governmental organisations and binding treaties. International co-operation has strengthened over time. As OECD work has shown, improved harmonisation of regulations can do much to bolster the prospects for cross-border trade and investment flows (Fournier, 2015), and thereby help strengthen the potential gains from enhanced cross-border integration.
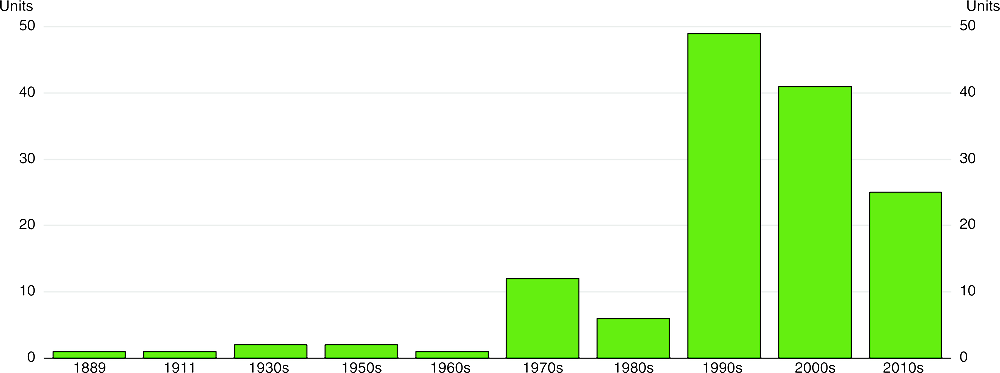
Note: The figure indicates the number of Trans-Governmental Networks (TGNs) from the sample of 140 TGNs.
Source: OECD (forthcoming), “The contribution of trans-governmental networks of regulators to international regulatory co-operation”.
Bibliography
Ahrend, R., A. Goujard and C. Schwellnus (2012), “International Capital Mobility: Which Structural Policies Reduce Financial Fragility?”, OECD Economic Policy Paper, No. 2, OECD Publishing, Paris.
Akinci, O. and J. Olmstead-Rumsey (2015), “How Effective are Macroprudential Policies? An Empirical Investigation”, International Finance Discussion Papers, No. 1136, Board of Governors of the Federal Reserve System.
Amador, J. and S. Cabral (2016), “Global Value Chains: A Survey of Drivers and Measures”, Journal of Economic Surveys, 30(2), 278–301.
Andrews, D., P. Gal and W. Witheridge (2018), “A Genie in a Bottle?: Globalisation, Competition and Inflation”, OECD Economics Department Working Papers, No. 1462, OECD Publishing, Paris.
Arregui, N., S. Elekdag, G. Gelos, R. Lafarguette and D. Seneviratne (2018), “Can Countries Manage Their Financial Conditions Amid Globalisation?”, IMF Working Papers, No. WP/18/15.
Arslanalp, S., W. Liao, S. Piao and D. Seneviratne (2016), “China’s Growing Influence on Asian Financial Markets”, IMF Working Papers, No. WP/16/173.
Auboin, M. (2012), “Use of Currencies in International Trade: Any Changes in the Picture”, World Trade Organisation Staff Working Paper, No. ERSD-2012-10.
Autor, D. H., D. Dorn and G. H. Hanson (2013), “The China Syndrome: Local Labor Market Effects of Import Competition in the United States”, American Economic Review, 103, 2121-2168.
Autor, D. H., D. Dorn and G. H. Hanson (2016), “The China Shock: Learning from Labor Market Adjustment to Large Changes in Trade”, Annual Review of Economics, 8(1), 205-240.
Baldwin, R. (2016), The Great Convergence: Information Technology and the New Globalisation, Harvard University Press.
Barrot, L-D. and L. Serven (2018), “Gross Capital Flows, Common Factors and the Global Financial Cycle”, World Bank Policy Research Working Paper, No. 8354.
Bastian, M., S. Heymann and M. Jacomy (2009), “Gephi: An Open Source Software for Exploring and Manipulating Networks”, International AAAI Conference on Web and Social Media.
Bénétrix, A. S., P.R. Lane and J. C. Shambaugh (2015), “International Currency Exposures, Valuation Effects and the Global Financial Crisis”, Journal of International Economics, 96(S1), 98-109.
Blundell-Wignall, A. and P. Atkinson (2011), “Global SIFIs, Derivatives and Financial Stability”, OECD Journal: Financial Market Trends, vol. 2011/1, OECD Publishing, Paris.
Borio, C. and A. Filardo (2007), “Globalisation and Inflation: New Cross-Country Evidence on the Global Determinants of Domestic Inflation”, BIS Working Papers, No. 227, May.
Borio, C., R. McCauley and P. McGuire (2017), “FX Swaps and Forwards: Missing Global Debt?”, BIS Quarterly Review, September, 37-54.
Bouvatier, V. and A-L. Delatte (2015), “Waves of International Banking Integration: A Tale of Regional Differences”, European Economic Review, 80(C), 354-373, Elsevier.
Boz, E., G. Gopinath and M. Plagborg-Møller (2017), “Global Trade and the Dollar”, IMF Working Papers, No. WP/17/239.
Bruno, V. and H. S. Shin (2017), “Global Dollar Credit and Carry Trades: A Firm-Level Analysis”, Review of Financial Studies, 30(3), 703–749.
Buch, C.M. and L.S. Goldberg (2017), “Cross-Border Prudential Policy Spillovers: How Much? How Important? Evidence from the International Banking Research Network”, International Journal of Central Banking, 13, March, 505-558.
Caballero, J., U. Panizza and A. Powell (2016), “The Second Wave of Global Liquidity: Why Are Firms Acting like Financial intermediaries?”, IDB Working Paper Series, No. IDB-WP-641, Inter-American Development Bank.
Cadestin, C., J. Gourdon and P. Kowalski (2016), “Participation in Global Value Chains in Latin America: Implications for Trade and Trade-Related Policy”, OECD Trade Policy Papers, No. 192, OECD Publishing, Paris.
Caldera-Sánchez, A., A. de Serres, F. Gori, M. Hermansen and O. Röhn (2017), “Strengthening Economic Resilience: Insights from the Post-1970 Record of Severe Recessions and Financial Crises”, OECD Economic Policy Papers, No. 20, OECD Publishing, Paris.
Caliendo, L., R.C. Feenstra, J. Romalis and A.M. Taylor (2017), “Tariff Reductions, Entry, and Welfare: Theory and Evidence for the Last Two Decades”, NBER Working Papers, No 21768.
Canzoneri, M. and D. Henderson (1991), Monetary Policy in Interdependent Economies: A Game Theoretic Approach, MIT Press.
Casas, C., F.J. Díez, G. Gopinath and P.-O. Gourinchas (2016), “Dominant Currency Paradigm”, NBER Working Papers, No. 22943.
Cerutti, E., and G. H. Hong (2018), “Portfolio Inflows Eclipsing Banking Inflows: Alternative Facts?”, IMF Working Paper Series, No. WP/18/29, International Monetary Fund.
Cerutti, E., S. Claessens and L. Ratnovski (2017a), “Global Liquidity and Cross-Border Bank Flows”, Economic Policy, 32(89), 81-125.
Cerutti, E., S. Claessens and A.K. Rose (2017b), “How Important is the Global Financial Cycle? Evidence from Capital Flows”, CEPR Discussion Papers, No. 12075.
Cerutti, E., S. Claessens and L. Laeven (2017c), “The Use and Effectiveness of Macroprudential Policies: New Evidence”, Journal of Financial Stability, 28, 203-224.
Cerutti, E., R. Correa, E. Fiorentino and E. Segalla (2016), “Changes in Prudential Policy Instruments – A New Cross-Country Database”, IMF Working Paper Series, No. WP/16/110, International Monetary Fund.
Chahrour, R., and R. Valchev (2017), “International Medium of Exchange: Privilege and Duty”, Boston College Working Papers in Economics, No. 934, Boston College Department of Economics.
Clark, T. and E. van Wincoop (2001), “Borders and Business Cycles”, Journal of International Economics, 55, 59–85.
Converse, N., E. Levy-Yeyati and T. Williams (2018), “How ETFs Amplify the Global Financial Cycle in Emerging Markets”, Institute for International Economic Policy Working Paper, 2018-1.
Criscuolo, C. and J. Timmis (2017), “The Relationship Between Global Value Chains and Productivity”, International Productivity Monitor, Centre for the Study of Living Standards, 32, 61-83.
Damodaran, A. (2018), Equity Risk Premiums (ERP): Determinants, Estimation and Implications – The 2018 Edition.
De Backer, K. and D. Flaig (2017), “The Future of Global Value Chains: Business As Usual or “A New Normal”?”, OECD Science, Technology and Industry Policy Papers, No. 41, OECD Publishing, Paris.
De Backer, K., C. Menon, I. Desnoyers-James and L. Moussiegt (2016), “Reshoring: Myth or Reality?”, OECD Science, Technology and Industry Policy Papers, No. 27, OECD Publishing, Paris.
de Crescenzio, A., M. Golin and A. Ott (2015), “Currency-based Measures Targeting Banks - Balancing National Regulation of Risk and Financial Openness”, OECD Working Papers on International Investment, No. 2015/03, OECD Publishing, Paris.
Dieppe, A., R. Gilhooly, J. Han, I. Korhonen and D. Lodge (editors) (2018), “The Transition of China to Sustainable Growth – Implications for the Global Economy and the Euro Area”, ECB Occasional Paper, No. 206.
Di Giovanni, J. and A. Levchenko (2010), “Putting the Parts Together: Trade, Vertical Linkages, and Business Cycle Comovement”, American Economic Journal: Macroeconomics, 2(2), 95-124.
Duval, R., L. Nan, R. Saraf and S. Dulani (2016), “Value-Added Trade and Business Cycle Synchronization”, Journal of International Economics, 99, 251-262.
ECB (2017), The International Role of the Euro, European Central Bank, July.
Eichengreen, B., P. Gupta and O. Masetti (2017), “Are Capital Flows Fickle? Increasingly? And Does the Answer Still Depend on Type?”, World Bank Policy Research Papers, No. 7972.
Escaith, H., N. Lindernberg and S. Miroudot (2010), “International Supply Chains and Trade Elasticity in Times of Global Crisis”, WTO Working Papers, No. ERSD-2010-08, February.
Federico, P., C. Vegh and G. Vuletin (2014), “Reserve Requirement Policy over the Business Cycle”, NBER Working Papers, No 20612.
Felettigh, A. and P. Monti (2008), “How to Interpret the CPIS Data on the Distribution of Foreign Portfolio Assets in the Presence of Sizeable Cross-border Positions in Mutual Funds - Evidence for Italy and the Main Euro-Area Countries”, Bank of Italy Occasional Papers, No. 16, Economic Research and International Relations Area.
Forbes, K., M. Fratzscher, T. Kostka and R. Straub (2016), “Bubble Thy Neighbour: Portfolio Effects and Externalities from Capital Controls”, Journal of International Economics, 99, 85-104.
Forbes, K.J. and F.E. Warnock (2012), “Capital Flow Waves: Surges, Stops, Flight, and Retrenchment”, Journal of International Economics, 88, 235-251.
Fournier, J.-M. (2015), “The Negative Effect of Regulatory Divergence on Foreign Direct Investment”, OECD Economics Department Working Papers, No. 1268, OECD Publishing, Paris.
Frankel, J. and A. Rose (1998), “The Endogeneity of the Optimum Currency Area Criteria”, Economic Journal, 108, 1009–1025.
Fratzscher, M. (2012), “Capital Flows, Push versus Pull Factors and the Global Financial Crisis”, Journal of International Economics, 88(2), 341-356.
Gangnes, B., A. C. Ma and A. Van Assche (2012), “Global Value Chains and the Transmission of Business Cycle Shocks”, ADB Economics Working Paper Series, 329, Asian Development Bank.
Ghosh, A. R., M. S. Qureshi, J. I. Kim and J. Zalduendo (2014), “Surges”, Journal of International Economics, 92(2), 266-285.
Goldberg, L. and C. Tille (2008), “Macroeconomic Interdependence and the International Role of the Dollar”, NBER Working Papers, No. 13820.
Gopinath, G. (2015), “The International Price System”, Federal Reserve Bank of Kansas City, Jackson Hole Symposium, August.
Gori, F. (2018), “Banking Integration and Monetary Policy Fragmentation in the Euro Zone”, International Economics and Economic Policy, 15(1), 131-157.
Guichard, S. (2017), “Findings of the Recent Literature on International Capital Flows: Implications and Suggestions for Further Research”, OECD Economics Department Working Papers, No. 1410, OECD Publishing, Paris.
Hamada, K. (1976), “A Strategic Analysis of Monetary Interdependence“, Journal of Political Economy, 84(4), 677–700.
Hamada, K. (1985), The Political Economy of International Monetary Independence, MIT Press.
Hannan, S. A. (2017), “The Drivers of Capital Flows in Emerging Markets Post Global Financial Crisis”, Journal of International Commerce, Economics and Policy, 8(2), 1-28.
Haugh, D., A. Kopoin, E. Rusticelli, D. Turner and R. Dutu (2016), “Cardiac Arrest or Dizzy Spell: Why is World Trade So Weak and What can Policy Do About It?”, OECD Economic Policy Papers, No. 18, OECD Publishing, Paris.
Heathcote, J. and F. Perri (2004), “Financial Globalization and Real Regionalization”, Journal of Economic Theory, 119 (1), 207-243.
Hoggarth, G., C. Jung and D. Reinhardt (2016), “Capital Inflows – The Good, The Bad and The Bubbly”, Bank of England Financial Stability Papers, No. 40.
Ilzetzki, E., C. M. Reinhart and K. S. Rogoff (2017), “Exchange Arrangements Entering the 21st Century: Which Anchor Will Hold?”, NBER Working Paper Series, No. 23134.
IMF/FSB/BIS (2016), “Elements of Effective Macroprudential Policies: Lessons from International Experience”, Report to the G20.
International Federation of Robotics (2016), Executive Summary World Robotics 2016 Industrial Robots.
Ito, H., R. N. McCauley and T. Chan (2015), “Currency Composition of Reserves, Trade Invoicing and Currency Movements”, Emerging Markets Review, 25, 16-29.
Kalemli-Ozcan, S., E. Papaioannou and J. Peydró (2013a), “Financial Regulation, Financial Globalization, and the Synchronization of Economic Activity”, Journal of Finance, 68, 1179-1228.
Kalemli-Ozcan, S., E. Papaioannou and F. Perri (2013b), “Global Banks and Crisis Transmission”, Journal of International Economics, 89, 495–510.
Kaminska, I. and G. Zinna (2014), “Official Demand for U.S. Debt; Implications for U.S. Real Interest Rates”, IMF Working Papers, No. 14/66, International Monetary Fund.
Kamps, A. (2006), “The Euro as Invoicing Currency in International Trade”, European Central Bank Working Papers, No. 665.
Kang, H., F. Vitek, R. Bhattacharya, P. Jeasakul, S. Mnoz, N. Wang and R. Zandvakil (2017), “Macroprudential Policy Spillovers: A Quantitative Analysis”, IMF Working Papers, No. WP/17/170, International Monetary Fund, July.
Karadimitropoulou, A. and M. León-Ledesma (2013), “World, Country, and Sector Factors in International Business Cycles”, Journal of Economic Dynamics and Control, 37(12), 2913-2927.
Klier, T. H. and J.M. Rubenstein(2017), “Mexico’s Growing Role in the Auto Industry Under NAFTA: Who Makes What and What Goes Where”, Economic Perspectives, Federal Reserve Bank of Chicago, 41(6), 1-29.
Kose, A., C. Otrok and E. Prasad (2012), “Global Business Cycles: Convergence Or Decoupling?”, International Economic Review, 53(2), 511-538.
Kose, A., C. Otrok and C.H. Whiteman (2003), “International Business Cycles: World, Region, and Country-Specific Factors”, American Economic Review, 93(4), 1216–1239.
Kuttner, K. N. and I. Shim (2016), “Can Non-Interest Rate Policies Stabilize Housing Markets? Evidence from a Panel of 57 Economies”, Journal of Financial Stability, 26, 31-44.
Lane, P. R., and G. M. Milesi-Ferretti (2011), “Cross-Border Investment in Small International Financial Centres”, International Finance, 14(2), 301-330.
Lopez Gonzalez, J., P. Kowalski and P. Achard (2015), “Trade, Global Value Chains and Wage-Income Inequality”, OECD Trade Policy Papers, No. 182, OECD Publishing, Paris.
Malgouyres, C. (2016), “The Impact of Chinese Import Competition on the Local Structure of Employment and Wages: Evidence from France”, Journal of Regional Science, 57(3), 1-31.
Maravalle, A. and L. Rawdanowicz (forthcoming), “Investigating Changes in Economic and Financial Synchronisation: A Global Factor Analysis”, OECD Economics Department Working Papers, forthcoming, OECD Publishing, Paris.
McCauley, R. N., A. S. Bénétrix, P. McGuireand G. von Peter (2017), “Financial Deglobalisation in Banking?”, BIS Working Papers, No 650, Bank for International Settlements.
MGI (2016), Digital Globalisation: The New Era of Global Flows, McKinsey Global Institute.
Miranda-Agrippino, S. and H. Rey (2017), “US Monetary Policy and the Global Financial Cycle”, NBER Working Paper, No. 21722. Revised in February 2018.
Morin, M. and C. Schwellnus (2014), “An Update of the OECD International Trade Equations”, OECD Economics Department Working Papers, No. 1129, OECD Publishing, Paris.
Ng, E. (2010), “Production Fragmentation and Business-Cycle Comovement”, Journal of International Economics, 82(1), 1-14.
Obstfeld, M., J. D. Ostry and M. S. Qureshi (2017), “A Tie That Binds: Revisiting the Trilemma in Emerging Market Economies”, IMF Working Papers, No. WP/17/130.
OECD (2005), “How Persistent are Regional Disparities in Employment”, OECD Employment Outlook, OECD Publishing, Paris.
OECD (2011a), Divided We Stand: Why Inequality Keeps Rising, OECD Publishing, Paris.
OECD (2011b), “Recent Developments in the Automobile Industry”, Economics Department Policy Notes, No. 7.
OECD (2013a), Addressing Base Erosion and Profit Shifting, OECD Publishing, Paris.
OECD (2013b), Action Plan on Base Erosion and Profit Shifting, OECD Publishing, Paris.
OECD (2013c), International Regulatory Co-operation: Adressing Global Challenges, OECD Publishing, Paris.
OECD (2014a), FDI in Figures, April 2014, OECD Publishing, Paris.
OECD (2014b), “Illicit Financial Flows from Developing Countries: Measuring OECD Responses”, OECD Publishing, Paris.
OECD (2015a), OECD Economic Outlook, Volume 2015 Issue 1, OECD Publishing, Paris.
OECD (2015b), OECD Economic Outlook, Volume 2015 Issue 2, OECD Publishing, Paris.
OECD (2015c), Digital Economy Outlook, OECD Publishing, Paris.
OECD (2016), “Using the Fiscal Levers to Escape the Low-Growth Trap”, in OECD Economic Outlook, Volume 2016 Issue 2, OECD Publishing, Paris.
OECD (2017a), “How to Make Trade Work for All”, in OECD Economic Outlook, Volume 2017 Issue 1, OECD Publishing, Paris.
OECD (2017b), OECD Business and Finance Outlook 2017, OECD Publishing, Paris.
OECD (2017c), Services Trade Policies and the Global Economy, OECD Publishing, Paris.
OECD (2017d), International Regulatory Co-Operation and Trade: Understanding the Trade Costs of Regulatory Divergence and the Remedies, OECD Publishing, Paris.
OECD (2017e), OECD Code of Liberalisation of Capital Movements, 2017, OECD Publishing, Paris.
OECD (2017f), International Migration Outlook 2017, OECD Publishing, Paris.
OECD (2017g), Going Digital: Making the Transformation Work for Growth and Well-Being, Meeting of the OECD Council at Ministerial Level, June.
OECD (2017h), “Resilience in a Time of High Debt”, in OECD Economic Outlook, Volume 2017 Issue 2, OECD Publishing, Paris.
OECD (2018a), “Estimating Ad-Valorem Equivalent of Non-Tariff Measures: Combining Price-Based and Quantity-Based Approaches”, OECD Trade Policy Papers, No. 215, OECD Publishing, Paris.
OECD (2018b), “Market Opening, Growth and Employment”, OECD Trade Policy Papers, No. 214, OECD Publishing, Paris.
OECD (2018c), OECD Business and Finance Outlook 2018, OECD Publishing, Paris.
OECD (2018d), FDI in Figures, April 2018, OECD Publishing, Paris.
OECD (2018e), Key Issues Paper, Meeting of the Council at Ministerial Level, 30-31 May 2018.
OECD (forthcoming), “The Contribution of Trans-Governmental Networks of Regulators to International Regulatory Co-operation”, OECD Publishing, Paris.
Ollivaud, P., E. Rusticelli and C. Schwellnus (2015), “The Changing Role of the Exchange Rate for Macroeconomic Adjustment”, OECD Economics Department Working Papers, No. 1190, OECD Publishing, Paris.
Otrok, C. and C.H. Whiteman (1998), “Bayesian Leading Indicators: Measuring and Predicting Economic Conditions in IOWA”, International Economic Review, 39(4), 997-1014.
Ottaviano, G.I.P., G. Peri and G.C. Wright (2018), “Immigration, Trade and Productivity: Evidence from UK Firms”, Journal of International Economics, 112, 88-108.
Özyurt, S. (2016), “Has the Exchange Rate Pass Through Recently Declined in the Euro Area?”, ECB Working Paper Series, No. 1955, European Central Bank.
Pain, N., I. Koske and M. Sollie (2006), “Globalisation and Inflation in the OECD Economies”, OECD Economics Department Working Papers, No. 524, OECD Publishing, Paris.
Pain, N., A. Mourougane, F. Sédillot and L. Le Fouler (2005), “The New OECD International Trade Model”, OECD Economics Department Working Papers, No. 440, OECD Publishing, Paris.
Powell, J.H. (2018), “Monetary Policy Influences on Global Financial Conditions and International Capital Flows”, speech at Eighth-High Level Conference on the International Monetary System, Zurich, May 2018.
Rey, H. (2015), “Dilemma not Trilemma: The Global Financial Cycle and Monetary Policy Independence”, NBER Working Paper Series, No. 21162, May, Revised February 2018.
Rusticelli, E., D. Haugh, A. Arquie and L. Demmou (forthcoming), “Going Local: A Regional Perspective on International Trade, Labour Markets and Inequality”, OECD Economics Department Working Papers, OECD Publishing, Paris.
SWIFT (2018), “RMB Internationalisation: Where we are and what we can expect in 2018”, RMB Tracker, January.
Timmer, M. P., B. Los, R. Stehrer and G. J. de Vries (2016), “An Anatomy of the Global Trade Slowdown based on the WIOD 2016 Release”, GGDC Research Memorandum, No. 162, University of Groningen.
UNCTAD (2017), World Investment Report 2017, United Nations Conference on Trade and Development, Geneva.
Warnock, F. E. and V. C. Warnock (2009), “International Capital Flows and U.S. Interest Rates”, Journal of International Money and Finance, 28, 903-919.
← 1. Developments over the past decade reflect both cyclical factors, due to the slow recovery from the global financial crisis, and structural changes. The latter include China's transition from export to domestic demand-led growth and the slowing of GVC expansion (Haugh et al., 2016; Timmer et al., 2016), as well as changes in trade policies and financial regulation.
← 2. Foreign loans are the main part of the other investment category in Figure 2.5, Panel B.
← 3. The retrenchment is also evident in the drop in the notional value of over-the-counter derivatives (an alternative indicator of bank cross-border financial linkages) from USD 586 trillion in the second half of 2007 to USD 542 trillion in the first half of 2017 (OECD, 2018c).
← 4. Global FDI flows in US dollars are provisionally estimated to have declined by 18% in 2017, to 1.8% of global GDP, compared to 2.3% in 2016 and 2.5% in 2015 (OECD, 2018d).
← 5. In 2005-07, the value of international mergers and acquisitions (M&A) is estimated to have been 80% of global FDI flows; this share declined to under 60% over 2008-14 (OECD, 2014a). More recently, the share has picked up, with some large individual cross-border deals (UNCTAD, 2017).
← 6. Both the US Generally Accepted Accounting Principles (GAAP) and the International Financial Reporting Standards (IFRS) allow balance sheet offsetting of derivative positions. Although both IFRS and US GAAP focus on similar criteria for offsetting to take place (primarily the existence of the legal right to offset), the detailed requirements of each set of guidance create significant differences in the amounts presented in balance sheets between US and European companies.
← 7. For example, one study found that a substantial fraction of Italian portfolio assets were reported as equity claims on Ireland and Luxembourg in the form of mutual fund shares, but they tended to be invested outside the euro area and in debt rather than equity instruments (Felettigh and Monti, 2008). In 2007 and 2008, the Cayman Islands were the largest foreign holder of private-label US mortgage-backed securities (Lane and Milesi-Ferretti, 2011).
← 8. Around 5 million people migrated permanently to OECD countries in 2016, well above the pre-crisis previous peak in 2007. There was also a surge in asylum applications in 2015-16.
← 9. Global international tourist arrivals rose by over 4% per annum on average in the two decades to 2016.
← 10. There is a lack of information about global cross-border data flows. Estimates based on cross-border bandwidth (a measure of capacity rather than of traffic) suggest that global cross-border data flows may have been 45 times larger in 2014 than in 2005 (MGI, 2016). Global IP traffic (Figure 2.10, Panel D) is estimated to have been 25 times larger in 2014 than in 2005.
← 11. Factors are unobservable and thus they are estimated using the “data augmentation” Bayesian methodology developed by Otrok and Whiteman (1998) and Kose et al. (2003, 2012).
← 12. The main findings about the direction of changes in the role of global and regional factors remain broadly unchanged if using quarterly data, though the contribution of the country-specific factors is higher when using annual data. This reflects more erratic movements and more acute measurement errors for quarterly data.
← 13. To test the impact of the global financial crisis on the results, the factor models were also estimated using a 2010-17 sample. The contribution of the global and regional factors to GDP growth fluctuations is lower than for the 2007-17 sample, especially for the group of 15 advanced economies (Figure 2.11). For inflation and financial variables, the results do not change much compared with the 2007-17 sample. However, given the shorter sample, these results are likely to be less reliable.
← 14. These include Frankel and Rose (1998), Clark and van Wincoop (2001), Duval et al. (2016), Di Giovanni and Levchenko (2010), and Karadimitropoulou and Léon-Ledesma (2013).
← 15. This is in line with evidence that business cycle synchronisation between the United States and other OECD countries decreased prior to the crisis despite stronger financial integration (Heathcote and Perri, 2004) and that banking integration can have a negative impact on output synchronisation (Kalemli-Ozcan et al., 2013a,b).
← 16. The monetary policy rule in NiGEM is a two-pillar rule, with policy interest rates responding to the deviation of inflation and nominal GDP from their target (baseline) levels. The fiscal rule is that the effective direct tax rate on households adjusts so as to bring the general government budget balance back to its target (baseline) level.
← 17. In China, imports fall sharply given the initial decline in domestic demand, reducing the overall impact of the shock on China to a decline of around 1¼ percentage point per annum in GDP growth. The Chinese current account surplus rises by around 1% of GDP by the second year of the shock, with a corresponding rise in net capital outflows.
← 18. The underlying bilateral trade matrix affects the weights on different economies in measures of export market size, import prices and the competitors’ prices facing exporters. The matrix used in the current version of NiGEM is based on data for 2016.
← 19. The sensitivity of Chinese import demand to changes in domestic demand was also lowered in the model, by around 20%, reflecting the less open and integrated nature of the Chinese economy in the mid-1990s. In principle, this adjustment would not be required if the simulation using the 1995 matrix could be undertaken from 1995. Technically this is not possible using the current version of NiGEM.
← 20. In the median economy in the NiGEM baseline, trade openness (the ratio of trade to GDP) rises by 11 percentage points between the two different starting points, broadly comparable with the increase experienced in the decade or so prior to the global financial crisis.
← 21. In the scenario with the higher degree of trade openness, global trade growth is reduced by around 1 percentage point per annum over the first two years of the simulation.
← 22. In NiGEM, import prices reflect a weighted average of costs in the exporting economies and domestic prices in the importing economy. If prices were set solely in US dollar terms, there would be a smaller reduction in prices than in these simulations and, most likely, slightly larger negative spillover effects on growth in the importing economies.
← 23. In practice, achieving a large immediate increase in public investment may be challenging, as for the typical OECD country it represents an increase in the volume of government investment by about 15%. The permanent shock to investment also implies a large long-term rise in the public sector capital stock, of between 10-20% in the typical G7 economy, though this takes many years to accumulate.
← 24. If interest rates are held exogenous for the first three years of the simulation, the first-year GDP impact would rise by over two-fifths on average compared to the individual action simulation.
← 25. The monetary policy rule in NiGEM is a two-pillar rule, with policy interest rates responding to the deviation of inflation and nominal GDP from their target (baseline) levels. The alternative scenario allows for a 1% rise in the nominal GDP target.
← 26. The default scenarios shown are with unchanged budgetary targets in all economies, so that the higher level of spending in the G7 economies is offset by an increase in the effective tax rate on households which brings about an adjustment in consumer spending. In the short term, private consumption is stronger in the debt-financed fiscal stimulus than in the tax-financed one (reflecting higher direct taxes on households), but this is more than offset by weaker private investment due to higher interest rates, so that the overall impact on GDP is smaller.
← 27. The rise of 1 percentage point is a relatively modest shock, corresponding to a change of 1 standard deviation in the US equity risk premium over 1960-2017, based on the estimates by Damodaran (2018). The equity risk premium is the excess return of investment in equities over a risk-free rate (usually the government bond yield), which compensates investors for taking higher risks by investing in equities.
← 28. Participation in GVCs facilitates greater specialisation, which increases economic efficiency and helps economies reap the benefits of trade without having to develop entire industries. GVCs are also crucial to the diffusion of knowledge. Exposure to more productive foreign firms can help local firms increase productivity through learning about advanced technologies or beneficial organisational and managerial practices (Criscuolo and Timmis, 2017).
← 29. In the median OECD economy, relative price elasticities declined by between 0.1 to 0.2 percentage point between the two sets of estimates.
← 30. Akinci and Olmstead-Rumsey (2015) find that macro-prudential measures, especially directly targeted at limiting housing credit growth, are associated with lower house price inflation. However, Cerutti et al. (2017c) suggest that macro-prudential measures are less effective in more developed and open economies as their usage comes with greater cross-border borrowing.
← 31. While participation in GVCs tends to increase regional employment in manufacturing (Rusticelli et al., forthcoming), the opposite is true of regions subject to greater exposure to final goods imports. Also, the loss of manufacturing jobs is associated with lower overall regional employment and earnings (Autor et al., 2013; Malgouyres, 2016; OECD, 2017a) and has tended to widen inequality between regions. Moreover, displaced manufacturing workers tend to be lower-skilled, older, less geographically mobile, and have more job-specific skills than workers who find themselves unemployed for other reasons (OECD, 2005; 2017a). In many OECD countries, regional disparities persist in large part due to poor geographical mobility (OECD, 2017a).
← 32. In theory, international policy co-ordination is beneficial when there are large cross-border policy spillovers as they are internalised (Hamada, 1976, 1985; Canzoneri and Henderson, 1991).
← 33. The arrangement was agreed on 31 October 2013 between the Bank of Canada, the Bank of England, the Bank of Japan, the European Central Bank, the US Federal Reserve and the Swiss National Bank.
← 34. For instance, China, Japan, Korea and the Association of Southeast Asian Nations countries have established a multilateral swap agreement (the Chiang Mai Initiative) that enables member countries to exchange their local currencies against US dollars up to their contribution to the scheme. This is supported by various bilateral swap agreements, for instance, between Japan and the Philippines and between Japan and Singapore.
← 35. This includes assistance through the Platform for Collaboration on Tax, which is a joint effort of the OECD, the International Monetary Fund, the United Nations and the World Bank Group. In addition, support is provided to tax administrations through the Tax Inspectors Without Borders Initiative (TIWB), which is a joint initiative of the OECD and the United Nations Development Programme (UNDP).
← 36. Warnock and Warnock (2009) show that foreign official investors pushed down US nominal government bond yields by 80 basis points from the mid-1980s to around 2005.