Subnational government investment
After strongly declining between 2009 and 2016, SNG investment has started to rebound. Regional and local governments remain key public investors, accounting for almost 58% of total public investment in 2018.
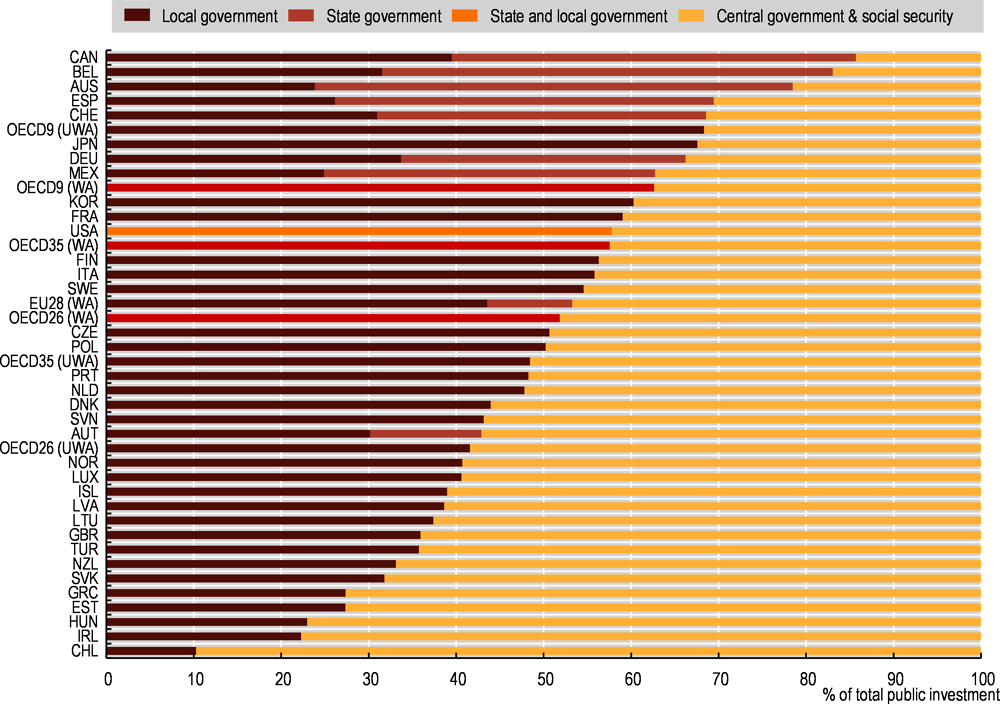
In 2018, SNGs in OECD countries undertook 57.6% of total public investment on average (Figure 5.5). The share of public investment made by SNGs is significantly higher in federal countries (62.6% compared to 51.9% in unitary countries). Combining investments by the state governments and the local level, SNG investment exceeds 80% of public investment in Belgium and Canada. At the other end of the spectrum, the role of SNGs in public investment is particularly low in Hungary, Ireland and especially Chile, where the local share is 10%.
In a large number of OECD countries, public investment is therefore a shared responsibility across government tiers. Whether through shared policy competencies or joint funding arrangements, public investment typically involves different levels of government at some stage of the investment process. The OECD member countries have acknowledged the importance of better governance for public investment by adopting the OECD Recommendation of Effective Public Investment across Levels of Government in March 2014 (OECD, 2014).
SNG investment-to-GDP ratio stood at an average of 1.9% in 2018 (total public investment represented 3.2% of GDP), a ratio that was above 2.5% of GDP in Canada, Japan, Korea and Sweden but below 1% of GDP in Chile, Greece, Ireland, Portugal and the United Kingdom.
SNG investment represented 11.4% of total SNG expenditure in the OECD in 2018. This ratio ranges from less than 7% in countries like Denmark to more than 30% in Luxembourg and Turkey. These differences reflect that in the least-decentralised countries SNGs tend to be more investors than managers of public services, having few functions that affect current expenditure. By contrast, in countries where SNGs carry out a large number of responsibilities involving significant staff spending, intermediate consumption or benefits, the relative weight of investment in total subnational expenditure may be low. In addition, it can vary a lot, from one year to another as investment is often a budgetary adjustment variable in many countries.
The deepening of the social and economic crisis and the adoption of budget consolidation measures from 2010 onwards put a severe strain on subnational finance. SNG investment was thus cut back in a majority of OECD countries (Figure 5.6). However, public investment has started to recover since 2017 across the board (central and SNGs) both in real terms and as a percentage of GDP. Overall, between 2009 and 2018, SNG investment decreased by -0.3% per year in real terms in the OECD area, compared to -0.7% in the EU. SNG investment contracted sharply in Greece, Spain and particularly in Ireland where it declined on average by approximately 10% annually, in real terms, between 2009 and 2018. Yet, not all OECD countries followed this trend, as SNG investment increased in some countries during this period, especially in Sweden and Switzerland.
One of the main risks in the current context of the COVID-19 crisis is a new decline of SNG investment, which would weaken the recovery. In several countries, the risk is high, given the contraction of self-financing capacities and increasing deficits. It is also important to avoid large investment stimulus plans followed by very strong fiscal consolidation, a sequence seen in 2008-10 that undermined public investment for almost a decade.
General government includes four sub-sectors: central/federal government and related public entities; state governments (e.g. states in the United States, länder in Germany, cantons in Switzerland, etc.) and related public entities; local government, i.e. regional and local governments and related public entities; and social security funds. Data are consolidated within the four sub-sectors. Subnational government is defined as the sum of state governments and local/regional governments.
Expenditure comprises: “current expenditure” and “capital expenditure”. Capital expenditure is the sum of capital transfers and investment. Gross fixed capital formation is the main component of investment (see Annex D for a detailed definition).
Sources
OECD (2020a), National Accounts Statistics (database), OECD, Paris, https://doi.org/10.1787/na-data-en.
OECD (2020b), “Subnational government finance”, OECD Regional Statistics (database), OECD, Paris https://doi.org/10.1787/region-data-en.
OECD (2014), OECD Recommendation on Effective Public Investment across levels of Government, OECD, Paris, https://www.oecd.org/effective-public-investment-toolkit/.
Estimates from IMF Government Statistics for Australia and Chile.
Reference years and territorial level
2018: National accounts; Levels of government; 2017: JPN, NZL, TUR.
Figure notes
Figure 5.6: JPN, NZL, TUR (2009-17). Not including Israel. OECD averages are presented as weighted (WA) and unweighted (UWA) average of OECD countries. OECD9 and OECD26 refer respectively to the averages for OECD federal countries and OECD unitary countries.