Subnational government revenue
The COVID-19 crisis has affected more significantly SNGs in countries where taxes, user charges and fees represent a high share of SNG revenues.
In 2018, SNG revenue accounted for 42.5% of total public revenue in the OECD and 15.7% of GDP. This proportion varies significantly across countries. The average share of SNG in total public revenue is greater in federal countries (54% versus 29.4% for unitary countries), while Denmark and Sweden stood out among unitary countries with a share of subnational revenue close to or above 50% of total public revenue in 2017. As a share of GDP, subnational revenue exceeded 20% in Belgium, Canada, Denmark, Finland, Germany, Spain, Sweden and Switzerland.
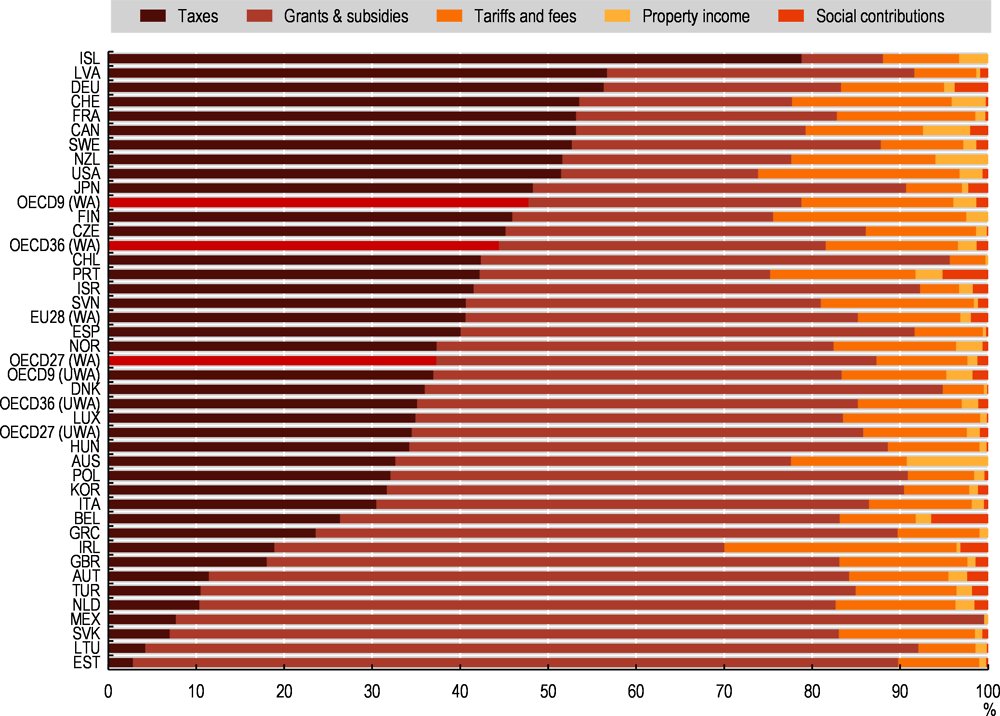
Subnational revenue in OECD countries primarily comprises tax revenues and grants and subsidies. In 2017, taxes accounted for 44% of total SNG revenues, whereas grants and subsidies accounted for 37%. Revenue deriving from local public service charges (tariffs and fees) is the third most important source of SNG revenue (15%). Other minor sources of revenues are property income revenue (sale and operation of physical and financial assets) and social contributions, which represented 2.1% and 1.3% of total SNG revenue respectively. The unweighted OECD average of the share of taxes in SNG revenue is however lower than that of grants and subsidies (35% vs. 50% in 2018) while tariffs and fees accounted for 12% (Figure 5.7).
Grants and subsidies make up the bulk of SNG revenue in Estonia, Lithuania and the Slovak Republic (more than 75% of SNG revenue) but represent less than 25% in Switzerland and the United States.
The share of tax revenue of total SNG revenue varies a lot from one country to another. It tends to be higher in federal countries – especially in Canada, Germany and Switzerland – than in unitary countries. However, some unitary countries stand out by the high share of taxes in local revenues such as France, Iceland, Latvia, New Zealand and Sweden, where tax revenue made up more than 50% of local revenue in 2018. At the opposite end, taxes amounted to less than 11% of local revenue in Estonia, the Netherlands, the Slovak Republic and Turkey.
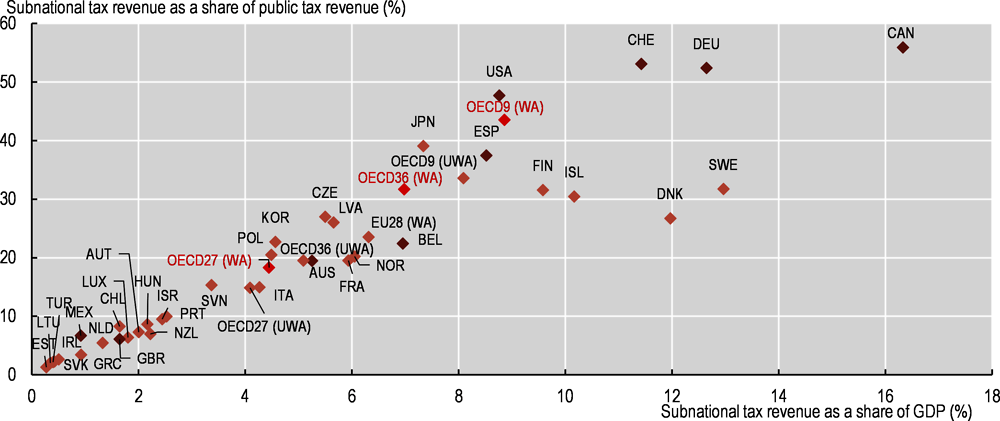
A high share of tax revenue in subnational revenues does not imply, however, a high level of tax revenue. While subnational tax revenue accounted for 7% of GDP in the OECD and 31.7% of public tax revenue in 2018, there is great variation across countries (Figure 5.8). The share of subnational tax revenue relative to total public tax revenue and GDP is particularly high among federal countries, where SNG tax revenue accounted for 43.5% of public tax revenue and 8.9% of GDP in 2018, compared to 18.3% of public tax revenue and 4.4% of GDP in unitary countries. SNG tax revenue stood at less than 10% of total public tax revenue in 15 OECD countries including 2 federal countries, Austria and Mexico. SNG tax revenue is below 2% of GDP in 12 countries and below 0.5% of GDP in Estonia, Ireland, Lithuania and Turkey.
Tax indicators offer an incomplete gauge of tax autonomy as SNG tax revenues include both shared and own-source tax revenue. Shared taxes are national taxes, often based on personal or corporate income tax, value-added or excise tax, which are redistributed to subnational authorities according to nationally defined allocation criteria, leaving SNGs with limited or no decision-making power over such taxes. Own-source taxes, on the other hand, provide some leeway for SNGs to set the tax rates or bases even if the taxing power may be restricted (imposition of caps on rate, constraints on exemptions or tax reliefs, etc.). Property tax is the cornerstone of local taxation. It is par excellence a local own-source tax, particularly for the municipal level.
General government includes four sub-sectors: central/federal government and related public entities; state governments (e.g. states in the United States, länder in Germany, cantons in Switzerland, etc.) and related public entities; local government, i.e. regional and local governments and related public entities; and social security funds. Data are consolidated within the four sub-sectors. Subnational government is defined as the sum of state governments and local/regional governments.
Definitions of expenditure and tax revenue are developed in Annex D.
Sources
OECD (2020a), National Accounts Statistics (database), OECD, Paris, https://doi.org/10.1787/na-data-en.
OECD (2020b), “Subnational government finance”, OECD Regional Statistics (database), OECD, Paris https://doi.org/10.1787/region-data-en.
Estimates from IMF Government Statistics for Australia and Chile.
Reference years and territorial level
2018: National accounts; Levels of government; 2017: JPN, NZL, TUR.
Further information
OECD (2020), Subnational Governments in OECD Countries: Key Data (brochure), OECD, Paris.
Figure notes
Figure 5.7 and Figure 5.8: OECD averages as weighted (WA), or unweighted (UWA) average of OECD countries. OECD9 and OECD27 refer respectively to the averages for OECD federal countries and OECD unitary countries.
Figure 5.8: Federal countries: dark brown markers; Unitary countries: light brown markers.