Unemployment
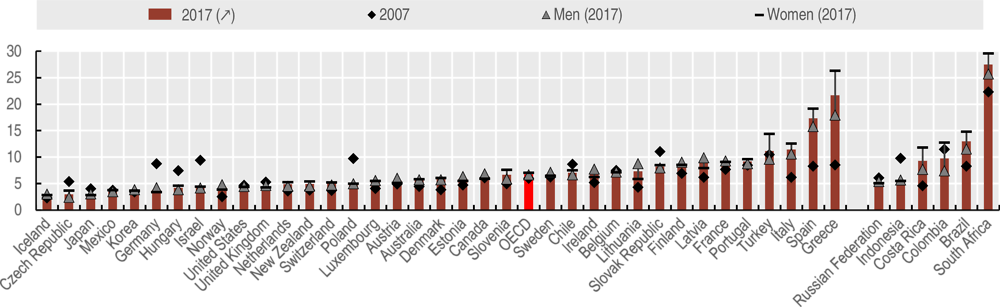
In addition to putting a strain on household and public finances, unemployment can have a demoralising effect on individuals and diminish their career prospects. The great recession of 2008-09 led to record unemployment rates across the OECD. Even if unemployment rates are below (or close to) pre-crisis levels in many countries, still on average 7% of the active working-age population was unemployed in 2017 across the OECD (Figure 5.4).
Countries present a diverse picture. The Czech Republic, Iceland and Japan exhibit rates as low as 3%, while many countries including the United States, the United Kingdom and Germany, cluster around 4%. On the other hand, unemployment is still strikingly high in the Southern European countries hit hardest by the crisis, such as Greece (22%), Spain (17%) and Portugal and Italy (11%) as well as in Brazil (13%) and South Africa (27%). Some countries have seen impressive falls in unemployment in the last decade, particularly Germany and Israel, where the unemployment rate more than halved. The fall has also been also substantial in the Czech Republic, Hungary, Poland and Indonesia.
Gender unemployment gap is low (under 3 percentage points difference) in most countries, but women are more likely to be on unemployment than men (above 3 percentage points difference) in Greece, Spain and Turkey and in key partner countries Brazil, Costa Rica and South Africa.
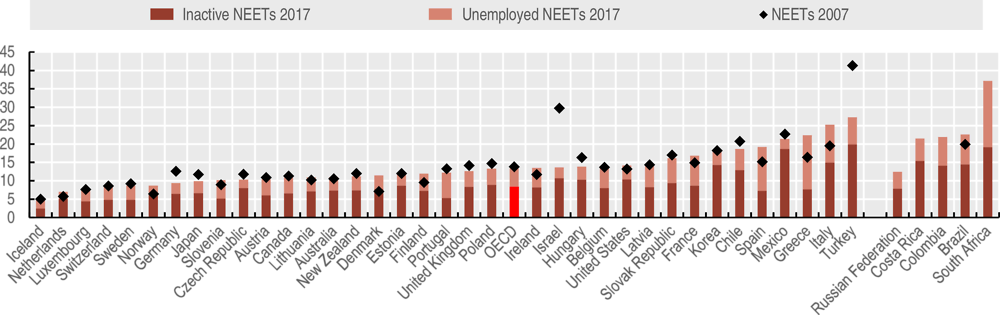
Unemployment as well as inactivity also hits the young people. The share of 15-29-year olds who were neither employed, nor in education or training in 2017 reached 13.4% on average across OECD countries (Figure 5.5). A breakdown of NEETs into those actively seeking a job (unemployed NEETs) and those who are not (inactive NEETs) shows that in most countries the majority of NEETs are not looking for work. Lower skills make young people particularly vulnerable to unemployment and inactivity, as young people with no more than lower-secondary education are three times more likely to be NEET than those with a university-level degree.
A broader measure of labour market slack is the so-called broad labour underutilisation, which enables to quantify the degree to which available labour resources are either not utilised (i.e. joblessness) or underutilised such as people who wish to and are available to work more hours than they usually do and are working part-time (i.e. underemployment). On average across OECD countries, more than one in four persons (26%) of working-age is “underutilised” (Figure 5.6). The share is lowest in Iceland at 12% and is highest in Greece, Italy and Turkey at above 40%. Compared to 2007, 2017 rates are 4% points higher in Ireland and Italy, 7% points higher in Spain and as much as 11% points in Greece in 2017. On the other hand, rates particularly decreased during the same period in the Czech Republic (-6%), Poland (-7%), Germany and Turkey (-8%) and Hungary and Israel (-10%).
The unemployment rate is the ratio of people not working, actively seeking and available to take a job to the population of working age either in work or unemployed (aged 15 to 64). The data are gathered through labour force surveys of member countries. According to the standardised ILO definition used in these surveys, the unemployed are those who did not work for at least one hour in the reference week of the survey, but who are currently available for work and who have taken specific steps to seek employment in the four weeks including the survey reference week. Thus, for example, people who cannot work because of physical impairment, or who are not actively seeking a job because they have little hope of finding work are not considered as unemployed. The unemployment rates are also presented by gender.
The so-called NEET population refers to youth population (aged 15 to 29) who is neither in employment nor in education or training. NEET rates are presented here by status of joblessness: unemployed or inactive. Data refer to OECD estimates based on national labour force surveys.
Broad labour underutilisation is a broader measure of joblessness and underemployment adding up inactive and unemployed people as well as involuntary part-timers aged 15-64 expressed as a share of population aged 15-64. Youth (15-29) in education and not in employment are excluded from the numerator and the denominator.
For more information, see www.oecd.org/employment/database.
Further reading
OECD (2018), OECD Employment Outlook 2018, OECD Publishing, Paris, https://doi.org/10.1787/empl_outlook-2018-en.
OECD (2018), Good Jobs for All in a Changing World of Work: The OECD Jobs Strategy, OECD Publishing, Paris, https://doi.org/10.1787/9789264308817-en.
OECD, Investing in Youth Reviews, www.oecd.org/social/action-plan-youth.htm.
Figure notes
Figure 5.5: 2017 refers to 2016 for the United States, 2015 for South Africa and 2014 for Japan; 2007 refers for 2006 for Chile; 2007 data are missing for Colombia, Costa Rica, Russian Federation and South Africa.
Source: OECD Employment Database, www.oecd.org/employment/database.
Source: Calculations based on national labour force surveys and the OECD Education database, www.oecd.org/education/database.htm.

Source: OECD Employment Database, www.oecd.org/employment/database.