
Hospital beds and occupancy
The number of hospital beds provides an indication of the resources available for delivering services to inpatients. The COVID-19 pandemic has highlighted the need to have a sufficient number of hospital beds and flexibility in their use, to address any unexpected surge in demand for intensive care, together with a sufficient number of doctors and nurses with the right skills to provide the required services (OECD/European Union, 2020[14]). Still, a surplus of hospital beds may lead to overuse and therefore costs – notably for patients whose outcomes may not improve from intensive care (Phua, Hashmi and Haniffa, 2020[15]). Therefore, while policy makers should guarantee sufficient hospital bed capacity to ensure resilience, value-for-money considerations should also be taken into account.
Across OECD countries, there were on average 4.4 hospital beds per 1 000 people in 2019 (Figure 5.16). In Japan (12.8 beds per 1 000 people) and Korea (12.4 beds per 1 000 people), rates were much higher. Over half of OECD countries reported between 3 and 8 hospital beds per 1 000 population, with the lowest rates in Colombia, Costa Rica and Mexico. Among OECD partner countries, India and Indonesia also had relatively few beds.
Since 2009, the number of beds per capita has decreased in nearly all OECD countries. The largest reduction occurred in Finland, with a fall of more than 50%, mainly affecting long-term care beds and psychiatric care beds. Latvia, Luxembourg, Norway and the Netherlands reduced capacity by 1 bed or more per 1 000 population. Part of the decrease can be attributed to advances in medical technology, allowing more surgery to be performed on a same-day basis, or as part of a broader policy strategy to reduce the number of hospital admissions. In contrast, the number of beds increased strongly in Korea (+52%), with a significant number of these dedicated to long-term care.
Hospital bed occupancy rates offer complementary information to assess hospital capacity. High occupancy rates of curative (acute) care beds can be symptomatic of a health system under pressure. Some spare bed capacity is necessary to absorb unexpected surges in patients requiring hospitalisation. Although there is no general consensus about the “optimal” occupancy rate, a rate of about 85% is often considered a maximum to reduce the risk of bed shortages (NICE, 2018[16]). In 2019, the bed occupancy rate was higher than 85% in four of 27 OECD countries with comparable data: Canada, Israel, Ireland and Costa Rica (Figure 5.17). Occupancy rates were comparatively low in the United States, Hungary and the Netherlands (less than 65%). Around half of OECD countries had bed occupancy rates of 70-80%, and the OECD average was 76% in 2019.
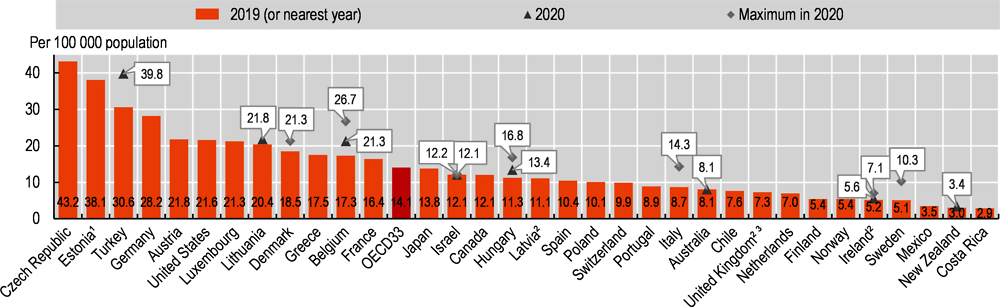
While general hospital bed capacity matters, intensive care unit (ICU) capacity has been an essential resource during the COVID-19 pandemic, delivering care for critically ill patients. Notwithstanding definitional differences, on average across 34 OECD countries there were 14.1 intensive care beds per 100 000 population in 2019 (Figure 5.18). The Czech Republic (43 beds per 100 000 population) and Estonia (38 beds per 100 000 population) had the highest number of ICU beds prior to the pandemic. Germany and Turkey also had numbers well above the OECD average. At the other end of the spectrum, Costa Rica, New Zealand and Mexico had the lowest number of ICU beds, at below 4 beds per 100 000 population. During the pandemic, countries deployed a number of policy interventions to boost surge capacity in a flexible manner. These included transformation of other clinical wards into ICUs, creation of field hospitals with ICU units and transfer of patients to localities with spare ICU capacity. Indeed, preliminary data suggest that among ten countries providing 2020 figures, most increased ICU capacity compared to capacity prior to the pandemic. In Turkey, for example, the number of ICU beds in 2020 increased by about 30% compared to 2019.
Hospital beds include all beds that are regularly maintained and staffed that are immediately available for use. They include beds in general hospitals, mental health and substance abuse hospitals, and other specialty hospitals. Beds in residential long-term care facilities are excluded. Data for some countries do not cover all hospitals. In Costa Rica and the United Kingdom, data are restricted to public hospitals. Data for Sweden exclude private beds that are privately financed. Beds for same-day care may be included in some countries (such as Austria and Luxembourg until 2018 and the Netherlands). Cots for healthy infants are included for a few countries (such as Canada and Poland).
The occupancy rate for curative (acute) care beds is calculated as the number of hospital bed-days related to curative care divided by the number of available curative care beds (multiplied by 365). In the Netherlands, the numbers of beds used for the calculation of occupancy rates are under investigation.
ICU beds are for critically ill patients who need intensive and specialised medical and nursing care, strong monitoring and physiological organ support to sustain life during a period of acute organ system insufficiency. ICU beds are classified by the level of care provided to the patient. Commonly, this falls into three levels, with Level 3 providing the most intense monitoring and Level 1 the lowest. The data on ICU beds cover the three levels, except in England (United Kingdom), Latvia and Ireland, which include only critical care beds (Levels 2 and 3). The exact definition of intensive care beds varies across OECD countries, shaped by differences in regulations, specifying requirements such as the patient/nurse ratio, physical properties of the bed (including ventilators, monitoring equipment, infusion equipment and so on) and patient characteristics. The data in Figure 5.18 relate to adult ICU beds for most countries, but a few countries (such as Estonia) also include neonatal and paediatric ICU beds.

Source: OECD Health Statistics 2021.

Source: OECD Health Statistics 2021.
1. Neonatal and paediatric ICU beds included. 2. Data cover critical care beds only. 3. Data refers to England only.
Source: OECD/Eurostat/WHO Regional Office for Europe Joint Questionnaire on Non-Monetary Health Care Statistics 2021 (unpublished data); Country Health Profiles 2021; Health at a Glance: Latin America and the Caribbean 2020; national sources.