
Poland
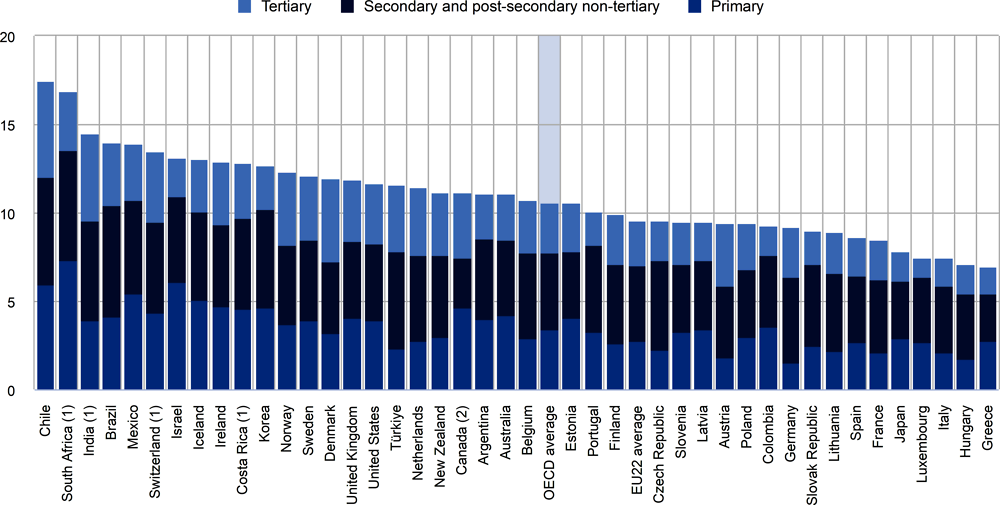
Educational attainment has been increasing throughout the OECD, in particular at tertiary level. Between 2000 and 2021, the share of 25-34 year-olds with tertiary attainment increased on average by 21 percentage points. In Poland, the share increased at an even faster pace, by 26 percentage points (from 14% in 2000 to 41% in 2021) (Figure 1). Poland remains one of the 12 OECD countries where tertiary education is still less common than upper secondary or post-secondary non-tertiary education as the highest level of attainment among 25-34 year-olds.
Upper secondary attainment is often seen as a minimum qualification for successful labour market participation. Although the general increase in educational attainment has seen a parallel decline in the share of 25-34 year-olds without upper secondary attainment, 14% of young adults across the OECD still left school without an upper secondary qualification. In Poland, the share is 7%, which is lower than the OECD average.
Higher educational attainment is often associated with better employment prospects and Poland is no exception. In 2021 the employment rate among 25-34 year-olds with tertiary education in Poland was 41 percentage points higher than among those with below upper secondary attainment and 10 percentage points higher than among those with upper secondary or post-secondary non-tertiary attainment. On average across OECD countries, the employment rate among 25-34 year-olds with a tertiary qualification was 26 percentage points higher than among those with below upper secondary attainment and 8 percentage points higher than among those with upper secondary or post-secondary non-tertiary attainment. While the positive link between educational attainment and employment rates holds for both men and for women across the OECD, it is particularly strong for women. In Poland, 31% of women with below upper secondary attainment were employed in 2021, compared to 88% of those with tertiary attainment. In contrast, the figures were 60% and 95% for men.
Across the OECD, the labour market benefits of tertiary attainment have proved especially strong during economic crises. This was also the case during the COVID-19 pandemic in Poland. Between 2019 and 2020, unemployment for 25-34 year-old workers with below upper secondary attainment increased by 0.3 percentage points, by 0.2 percentage points for workers with upper secondary attainment and remained constant for workers with tertiary attainment. In 2021, unemployment for workers with below upper secondary attainment fell by 1.1 percentage points, compared to 2020, while it rose by 0.2 percentage points for workers with upper secondary attainment and remained constant for workers with tertiary attainment.
Educational attainment affects not just employment prospects, but also wage levels. On average across the OECD, 25-64 year-old workers with upper secondary or post-secondary non-tertiary attainment earn 29% more than workers with below upper secondary attainment, while those with tertiary attainment earn about twice as much. In Poland, the earnings advantage of tertiary-educated workers was smaller than the OECD average. In 2020, workers with upper secondary or post-secondary non-tertiary attainment earned 17% more than those with below upper secondary attainment and those with tertiary attainment earned 80% more.
National averages provide only an incomplete picture of the situation in any given country. In most OECD countries, there are large differences in educational attainment across subnational regions. This is also the case in Poland. In 2021, the difference between the region with the highest share of 25-64 year-olds with tertiary attainment (Warsaw, at 57%) and that with the lowest share (Warmian-Masuria, at 25%) was 32 percentage points. These subnational variations do not only reflect differences in education opportunities. To a large degree, they are due to economic conditions and internal migration patterns.

1. Data for tertiary education include upper secondary or post-secondary non-tertiary programmes (less than 5% of adults are in this group).
2. Year of reference differs from 2000: 2002 for Israel and 2003 for Iceland.
Countries are ranked in descending order of the difference in the share of tertiary-educated 25-34 year-olds between 2000 and 2021.
Source: OECD (2022), Education at a Glance Database, http://stats.oecd.org/. See Source section for more information and Annex 3 for notes (https://www.oecd.org/education/education-at-a-glance/EAG2022_X3-A.pdf).
Compulsory education begins at the age of 6 and ends at the age of 15 in Poland. The range of ages for which at least 90% of the population are enrolled is longer than the period of compulsory education and goes from the age of 4 to the age of 18. This is similar to most other OECD countries, where more than 90% of the population are also enrolled for longer than the period of compulsory education.
The age at which children enter early childhood education differs widely across countries. In Poland, early childhood education starts offering intentional education objectives at age 3 and 2% of children under 3 are enrolled in early childhood education. Across OECD countries, the average enrolment rate among children below the age of 3 is 27%, but the rates range from less than 1% to 63%. The enrolment rate among 3-5 year-olds increases substantially in all OECD countries. In Poland, 88% of all children of this age are enrolled in early childhood education, which is slightly above the OECD average.
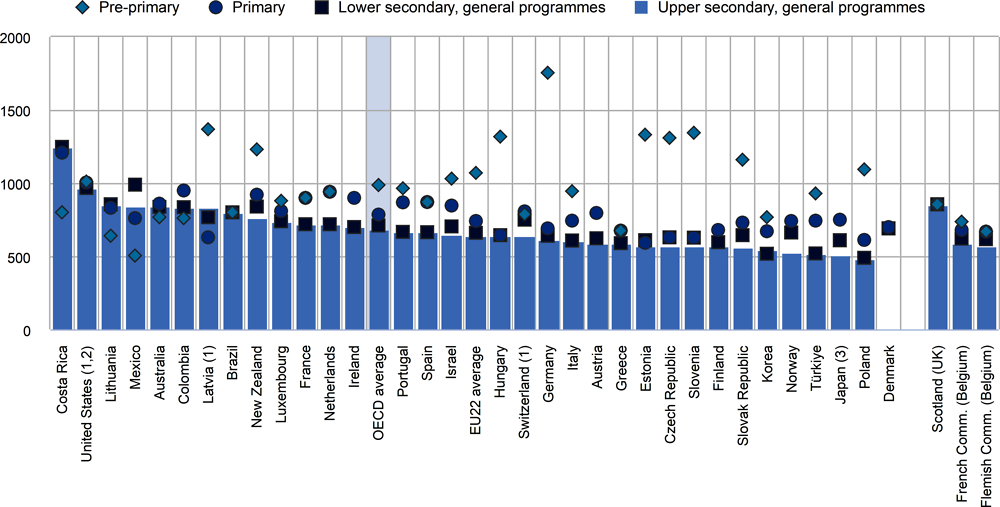
The average age of graduation from general upper secondary programmes varies from 17 to 21 years across OECD countries and is 20 years in Poland. Differences in the average age of graduation from vocational upper secondary education are much larger and vary from 16 to 34 years across the OECD. These differences largely depend on whether vocational upper secondary students usually enrol in these programmes towards the end of their compulsory education or in mid-career. In Poland, the average age of graduation from vocational upper secondary education is 20 years, which is below the OECD average at 22 years (Figure 2).
In almost all OECD countries, women make up the majority of those graduating from general upper secondary education. In Poland, the share is 60% (OECD average 55%). In contrast, men are overrepresented among graduates of vocational upper secondary programmes in most OECD countries, as is the case in Poland where they make up 62% of all vocational upper secondary graduates, above the OECD average (55%).
In Poland, 57% of 18-24 year-olds are still in full- or part-time education or training at either upper secondary or tertiary level (slightly above the OECD average of 54%). A subset of these students (8% of 18-24 year-olds) combine their education or training with some form of employment in Poland, compared to 17% on average across the OECD.
One significant difference across countries’ education systems is on whether or not vocational upper secondary programmes provide access to tertiary education. In 12 OECD countries and other participants, all vocational upper secondary graduates have direct access to tertiary education. In Poland 74% of graduates from vocational upper secondary programme have direct access to tertiary education.
As is the case in all OECD countries, a majority of students enrolled at tertiary level in Poland are bachelor’s students (66%). However, the next commonest enrolment level varies from country to country. In Poland, master's students make up the second largest group of tertiary students at 32%. This is also the case in 25 other OECD countries, while in the remaining 14 countries with available data, short-cycle tertiary students form the second largest group.
At 23%, business, administration and law was the most popular field of study among new entrants into tertiary education in Poland, which is the case in most OECD countries. Despite the growing need for digital skills and the good employment prospects of students with degrees in information and communication technologies (ICT), only a small fraction of entrants into tertiary education choose this field. In Poland, 97% of 25-64 year-olds with a tertiary ICT qualification are employed, but ICT students make up 6% of new entrants into tertiary education. This is the same level as the OECD average.

1. Average age is based on all graduates instead of first-time graduates.
Countries are ranked in descending order of the average age of first-time upper secondary graduates in general programmes.
Source: OECD//Eurostat/UIS (2022), Tables B3.1 and B3.2. See Source section for more information and Annex 3 for notes (https://www.oecd.org/education/education-at-a-glance/EAG2022_X3-B.pdf).
All OECD countries devote a substantial share of national output to educational institutions. In 2019, OECD countries spent on average 4.9% of their gross domestic product (GDP) on primary to tertiary educational institutions. In Poland, the corresponding share was 4.5%. Between 2008 and 2019, funding for educational institutions from all sources grew by 30% in Poland. However, over the same period of time, the increase in GDP was higher with 47%. As a consequence, expenditure on educational institutions as a share of GDP fell by 0.6 percentage points over the same time period.
Public spending on primary to tertiary education was 9.4% of total government expenditure in Poland (Figure 3), lower than the OECD average (10.6%). Also, relative to GDP, public spending on primary to tertiary education (3.9%) is lower than the OECD average (4.4%).
Spending on educational institutions as share of GDP or public budgets are important measures of the importance that countries place on education in their budgeting decisions. However, they do not show the total amount of funding per student because GDP levels, public budgets and student numbers vary from country to country. Across primary to tertiary education, OECD countries spend an average of USD 11 990 per student (in equivalent USD converted using PPPs for GDP) on educational institutions each year. In comparison, Poland spent USD 9 611 per student in 2019. Its cumulative expenditure on educating a student from the age of 6 to 15 was USD 87 741, which was significantly below the OECD average of USD 105 502.
1. Year of reference differs from 2019. Refer to the source table for more details.
2. Primary education includes pre-primary programmes.
Countries are ranked in descending order of total public expenditure on education as a percentage of total government expenditure.
Source: OECD/UIS/Eurostat (2022), Table C4.1. See Source section for more information and Annex 3 for notes (https://www.oecd.org/education/education-at-a-glance/EAG2022_X3-C.pdf).
Across OECD countries, the provision of education at primary and secondary levels in terms of curricula, teaching styles and organisational management leads, on average, to similar patterns of expenditure per student from primary to post-secondary non-tertiary levels. OECD countries as a whole spend on average around USD 9 923 per student at primary and USD 11 400 per student at secondary level. In Poland, the values are USD 8 949 at primary and USD 8 689 per student at secondary level.
In contrast to lower levels of education, spending on tertiary education varies widely across OECD countries. Expenditure per student at tertiary level in Poland is higher than at other levels of education, as is the case in almost all other OECD countries. The average expenditure per student in Poland is USD 12 912 per year, which is about USD 4 000 higher than that of the primary level and USD 4 200 higher than that of the secondary level. It is below the OECD average, but similar to many other countries. The average expenditure at tertiary level (USD 17 559) is driven up by high values in a few countries. At 30%, the share of research and development (R&D) expenditure makes up a larger fraction of expenditure on tertiary education in Poland than on average across OECD countries (29%).
Public funding dominates non-tertiary education (primary, secondary and post-secondary non-tertiary) in all OECD countries, even after transfers to the private sector. On average across the OECD, private funding accounts for 10% of expenditure at primary, secondary and post-secondary non-tertiary levels, the same share observed in Poland in 2019. In contrast, private expenditure at tertiary level was higher in all OECD countries. In Poland, the share of private expenditure at tertiary level reached 18%, which was below the OECD average of 31%, after public-to-private transfers. These latter accounted for 8% of expenditure on educational institutions at this level.
Between 2015 and 2021, on average across OECD countries, the statutory salaries of teachers at lower secondary level (general programmes) with 15 years of experience and the most prevalent qualifications increased by 6% in real terms. In Poland, salaries increased more than the OECD average, by 18%.
The average number of teaching hours per year required from a typical teacher in public educational institutions in OECD countries tends to decrease as the level of education increases. This is also the case in Poland.
Based on official regulations or agreements, annual teaching hours in Poland are 1 095 hours per year at pre-primary level, 611 hours at primary level, 489 hours at lower secondary level (general programmes) and 483 hours at upper secondary level (general programmes) (Figure 4).
During their working hours, teachers also perform various non-teaching tasks such as lesson planning and preparation, marking students’ work and communicating or co-operating with parents or guardians. At the upper secondary level, 66% of teachers’ working time is formally dedicated to non-teaching activities in Poland, compared to an average of 56% across OECD countries.
The duration of initial teacher education for primary and lower secondary teachers ranges from 2.5 years to 6.5 years across OECD countries. In Poland, initial teacher education typically lasts 5 years for prospective lower secondary teachers (general programmes). It is the same length for prospective primary teachers. As is the case in almost all OECD countries, a tertiary degree is awarded to prospective teachers of all levels of education upon completion of their initial teacher training.
Continuing professional development is compulsory for all teachers of general programmes in most countries with data, but Poland is an exception. At secondary level, professional development activities are compulsory for teachers in some circumstances.
1. Actual teaching time (in Latvia except for pre-primary level).
2. Reference year differs from 2021. Refer to the source table for details.
3. Average planned teaching time in each school at the beginning of the school year.
Countries and other participants are ranked in descending order of the number of teaching hours per year in general upper secondary education.
Source: OECD (2022), Table D4.1. See Source section for more information and Annex 3 for notes (https://www.oecd.org/education/education-at-a-glance/EAG2022_X3-D.pdf).
Among 25-64 year-olds in Poland, master's degrees are the most common tertiary attainment at 25% of the population followed by bachelor's degrees at 8% and short-cycle tertiary qualifications with less than 1%. This is different from the OECD average, where bachelor’s degrees are most common (19%), followed by master’s degrees (14%) and short cycle tertiary qualifications (7%). As in all OECD countries and other participants, only a small fraction of the population holds a doctoral degree: the share is 1% in Poland.
On average, tertiary attainment generates a wide range of labour-market benefits, including high employment rates. Yet, there are significant differences depending on the field of study. In 2021, employment rates in Poland were highest among tertiary-educated individuals who studied information and communication technologies with 97% and lowest among those who studied arts at 86%. However, these differences need to be put into perspective. Even among 25-64 year-olds with tertiary attainment in the field with the lowest employment rate, this was 12.4 percentage points higher than among those with upper secondary attainment (all fields combined).
Despite the labour market advantages of a tertiary degree, many tertiary students do not graduate on time or do not graduate at all. In Poland, 50% of bachelor’s students graduate within the theoretical programme duration. Across the OECD, the completion rate within the theoretical programme duration ranges from 12% to 69%. Completion rates three years after the theoretical programme duration are significantly higher in most countries and the differences between OECD countries somewhat narrower. In Poland, 69% of bachelor’s students have graduated within three years after the end of the theoretical programme duration, compared to 68% on average across the OECD.
In all OECD countries, tertiary completion rates are higher for women than for men. In Poland, 77% of women graduated within three years after the end of the theoretical programme duration at bachelor’s level, compared to 60% of men. On average across the OECD, there is little systematic difference between the completion rates of public and private institutions, but the figures differ from country to country. In Poland, the same share of bachelor's students (69%) graduate from public and private institutions within three years after the end of the theoretical programme duration.
In most OECD countries including in Poland, tertiary-educated adults have higher rates of participation in non-formal education and training than those with a lower level of educational attainment. In 2021, 10% of 25-64 year-olds with tertiary attainment in Poland had participated in non-formal education and training in the four weeks prior to being surveyed, compared to 1% of their peers with below upper secondary attainment.
Over the decades, independent private institutions have been established to meet increased demand for tertiary education. On average across the OECD, 17% of students are enrolled in independent private institutions, but this figure masks large differences between countries. In Poland, 30% of tertiary students are enrolled in such institutions. Independent private institutions charge higher annual tuition fees on average than public institutions for master’s programmes in all OECD countries and other participants with available data, except in Chile and Lithuania.
Enabling students to enrol on a part-time basis is an important way to facilitate access to tertiary education. Many part-time students would not be able to study full time, for example because they have child-care responsibilities or have to work to fund their studies. The share of part-time students at the tertiary level in Poland is 30%, above the OECD average (22%). Compared to 2013, it has decreased by 17 percentage points.
Staff at tertiary level tend to start their careers relatively late due to the length of the education they need to qualify. In Poland, only 4% of academic staff are aged under 30, below the OECD average (8%). In contrast, the share of academic staff aged 50 or over is 39%, which is slightly below the OECD average by 1 percentage point.
The COVID-19 pandemic disrupted traditional schooling in 2020 and the first half of 2021, leading to school closures across all OECD countries. While most shut down their premises entirely in the wake of the pandemic in 2020, by 2021 the situation had improved and returned to normal in most countries in 2022. In Poland, primary and secondary schools were entirely closed for 47-71 days during the school year 2019/20, for 21-110 days in 2020/21 and up to 14 days in 2021/22 (Figure 5). Partial closures reached up to 24 days during the school year 2019/20, 11-110 days in 2020/21 and up to 23 days in 2021/22.
National examinations have also been affected by the pandemic. At general upper secondary level, 18 OECD countries postponed their national examinations during the school year 2019/20, while 10 countries even cancelled them entirely. In 2020/21, national examinations were postponed in 9 countries and cancelled in 6 countries. Poland rescheduled its national examinations in 2019/20.
Most countries conducted assessments of the impact of school closures on learning outcomes at various levels of education and along several dimensions. Poland has conducted studies to evaluate the effects of the pandemic on the impact on primary, lower secondary, upper secondary general and vocational education. The assessments covered mathematics, reading and science. Like many other countries, Poland also evaluated dimensions such as non-cognitive skills, the relations between parents and students during lockdowns as well as the mental health and well-being of students.
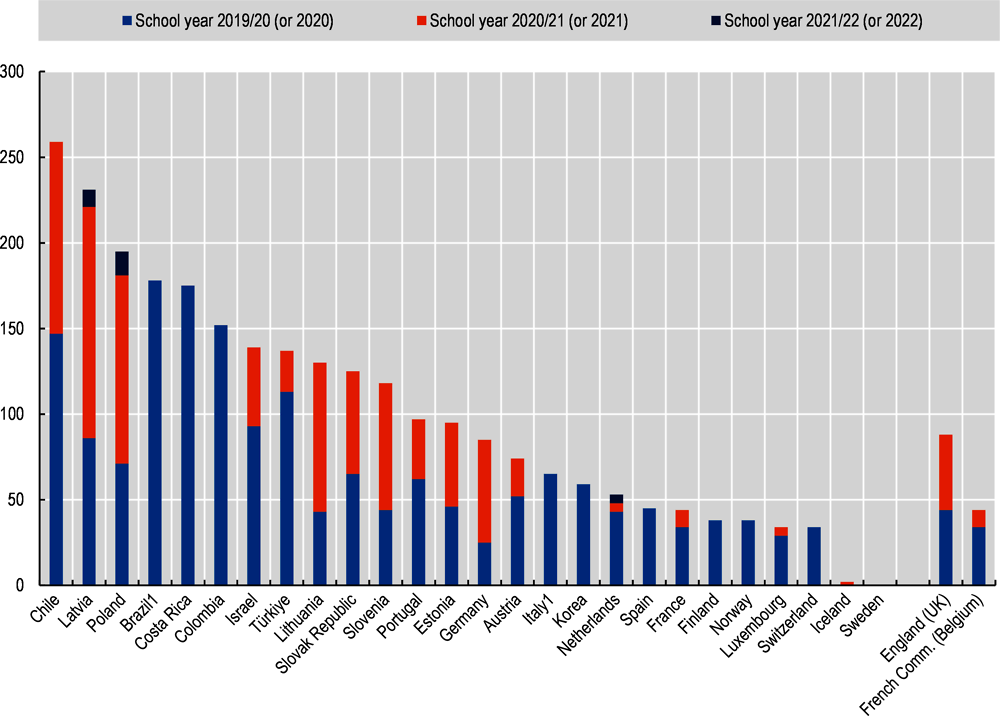
Note: The data underlying this report were produced through the Survey on Joint National Responses to COVID 19, a collaborative effort conducted by the United Nations Educational, Scientific and Cultural Organization (UNESCO), the United Nations Children’s Fund (UNICEF), the World Bank (WB), and the Organisation for Economic Co-operation and Development (OECD). Data for other levels of education are available at https://www.oecd.org/education/Results-4th-wave-COVID-Survey-OECD-database.xlsx.
1. Data for 2021 and 2022 are missing.
Countries and other participants are ranked in descending order of the total number of days lower secondary schools were fully closed during the school years 2019/20 (2020), 2020/21 (2021) and 2021/22 (2022).
Source: OECD/UIS/UNESCO/UNICEF/WB (2022).
In school year 2022, national programmes to support students affected by the pandemic were implemented in Poland at, primary, lower secondary, upper secondary general and vocational and tertiary level. At primary to upper secondary education, measures to address the effects of the COVID-19 pandemic included accelerated education or catch-up programmes for students who dropped out of school, adjustments to subject curricula, referral systems for students in need of specialised services, psychosocial and mental health support to students, increased instruction time through summer schools, extended school days or the school week or academic year. The government has already assessed the effectiveness of these programmes.
The increased digitalisation of education has been a major consequence of the COVID-19 pandemic in many OECD countries. At lower secondary level, Poland has responded to the pandemic with an enhanced provision of digitalised assessments/exams, digital tools at school, distance learning, hybrid learning, in-service digital training to teachers and digital training to students.
The challenges related to the COVID-19 pandemic have created additional costs for education systems. Preliminary budget estimates for 2021 suggest that, compared to 2020, the education budget at pre-primary to upper secondary level in Poland increased slightly (by between 1% and 5%, in nominal terms), while it increased strongly (by more than 5%) at the tertiary level.
The COVID-19 pandemic had a significant impact on adult learning in most OECD countries. In 2020, the share of adults who participated in a formal or non-formal education and training activity in the four weeks prior to being surveyed decreased by 2 percentage points on average across OECD countries compared with 2019. However, in 2021, participation in non-formal education and training returned to pre-pandemic levels in most countries. In Poland, a similar pattern emerged. From 2019 to 2020, the share of adults participating in a formal or non-formal education and training activity fell by 1 percentage point. From 2020 to 2021, it increased by 2 percentage points and has thus reached pre-pandemic levels.
Young adults who are not in employment, education or training (NEET) for prolonged periods are at risk of adverse economic and social outcomes in both the short and the long term. After increasing during the COVID-19 pandemic in 2020, the share of 18-24 year-olds who are NEET in Poland rose also in 2021. The share of NEET among young adults was 14% in 2021, above pre-COVID levels.
References
OECD (2022), Education at a Glance 2022: OECD Indicators, OECD Publishing, Paris, https://dx.doi.org/10.1787/69096873-en.
OECD (2022), “Regional education”, OECD Regional Statistics (database), https://dx.doi.org/10.1787/213e806c-en.
For more information on Education at a Glance 2022 and to access the full set of Indicators, see: https://doi.org/10.1787/3197152b-en
For more information on the methodology used during the data collection for each indicator, the references to the sources and the specific notes for each country, See Annex 3 (https://www.oecd.org/education/education-at-a-glance/EAG2022_X3.pdf).
For general information on the methodology, please refer to the OECD Handbook for Internationally Comparative Education Statistics: Concepts, Standards, Definitions and Classifications (https://doi.org/10.1787/9789264304444-en).
Updated data can be found on line at https://doi.org/10.1787/eag-data-en and by following the StatLinks under the tables and charts in the publication.
Data on subnational regions for selected indicators are available in the OECD Regional Statistics (database) (OECD, 2022). When interpreting the results on subnational entities, readers should take into account that the population size of subnational entities can vary widely within countries. For example, regional variation in enrolment may be influenced by students attending school in a different region from their area of residence, particularly at higher levels of education. Also, regional disparities tend to be higher when more subnational entities are used in the analysis.
Explore, compare and visualise more data and analysis using the Education GPS:
https://gpseducation.oecd.org/
The data on educational responses during COVID-19 were collected and processed by the OECD based on the Joint Survey on National Responses to COVID-19 School Closures, a collaborative effort conducted by the United Nations Educational, Scientific and Cultural Organization (UNESCO); the UNESCO Institute for Statistics (UIS); the United Nations Children's Fund (UNICEF); the World Bank; and the OECD.