
Annex 3A. Source, methodology and technical notes for Chapter A
Indicator A2: Transition from education to work: where are today’s youth?
Indicator A3: How does educational attainment affect participation in the labour market?
Indicator A4: What are the earnings advantages from education?
Indicator A5: What are the incentives to invest in education?
Indicator A7. To what extent do adults participate in education and training?
Description
This document is intended to provide guidance as to the methodology used during the data collection for each indicator, the references to the sources and the specific notes for each country. For general information on methodology, please refer to the OECD Handbook for Internationally Comparative Education Statistics: Concepts, Standards, Definitions and Classifications (https://doi.org/10.1787/9789264304444-en).
Methodology
The educational attainment profiles for most countries are based on the percentage of the population that has completed a specific level of education. The International Standard Classification of Education (ISCED) is used to define the levels of education.
In Education at a Glance (EAG), ISCED 2011 is used to classify the levels of education. Unless data using national codes according to ISCED 2011 have been provided by countries, trend data on educational attainment are only available for the three aggregated levels of education. The linkage between ISCED-97 and ISCED 2011 for the three aggregated levels of education are the following:
Below upper secondary education includes either the codes 0/1/2 if data are classified using ISCED 2011 or codes 0/1/2/3C short if data are classified using ISCED-97
Upper secondary or post-secondary non-tertiary education includes either the codes 3/4 if data are classified using ISCED 2011 or codes 3/3C long/4 if data are classified using ISCED-97
Tertiary education includes either the codes 5/6/7/8 if data are classified using ISCED 2011 or codes 5A/5B/6 if data are classified using ISCED-97
Table X3.A1.1 in the Statlink file https://stat.link/sqgt5h shows the educational attainment and ISCED mappings/codes for each country. It presents the national codes according to ISCED 2011 and shows the codes included in each level of education.
Notes on new methodology of the European Union Labour Force Survey (EU-LFS)
For European countries providing data from the EU-LFS there was a new LFS legislation in 2021 and Eurostat flag all 2021 LFS data with b, i.e. break in series, in particular for labour market outcomes indicators.. Information on the impacts of the new methodology is not available by the time Education at a Glance 2022 was released. For general information and country specific notes on the changes, please see: https://ec.europa.eu/eurostat/statistics-explained/index.php?title=EU_labour_force_survey.
Notes on the COVID-19 pandemic
The COVID-19 pandemic might have an impact on the data collection for some countries. Table X3.A1.2 in the the Statlink file https://stat.link/sqgt5h summarises the metadata by country on the changes in the survey methodology due to the pandemic.
Notes on fields of study
Data on fields of study in Chapter A, the output of educational institutions and the impact of learning, are for tertiary degree. The OECD Labour Market, Economic and Social Outcomes of Learning (LSO) Network selected some fields to be collected and presented in Chapter A taking into account the policy relevance of the different narrow and detailed fields. For example, the medical and dental health fields are separated from nursing and associate health fields, business and administration fields are separated from law fields, and arts fields are separated from fields on humanities (except languages).
EAG 2021 include data on the following fields of study – including into brackets the codes in the ISCED Fields of education and training classification (ISCED-F 2013):
Notes on specific countries
Austria: ISCED 0-2 includes ISCED 3c short from 2006 onwards (measured as successful attainment of intermediate technical and vocational school shorter than two years), 2004 and 2005 ISCED 3c short covers also intermediate technical and vocational schools of a duration of two years. For 2004 and 2005 ISCED 3c short is therefore reported as upper level.
Due to the reclassification of a programme spanning levels data published from Education at a Glance 2015 on are not directly comparable with data published on previous editions of Education at a Glance. The qualification acquired upon successful completion of higher technical and vocational colleges is allocated in ISCED 2011 to ISCED level 5; under ISCED 1997 the same qualification was reported on ISCED level 4, but earmarked as equivalent to tertiary education.
In 2021, the mode of the data collection changed: F2F Interviews were done partly by phone as recommended by Stat.AT. The CAWI mode was implemented in Q2 2021.
Belgium: A break in time series occurred in 2017 as the Belgian LFS has undergone a major reform in 2017 with the introduction of a 2(2)2 panel design, the introduction of mixed mode data collection, the introduction of the wave approach and the change of the calibration method.
During the whole year 2021 face to face interviews were forbidden. Interviewers were asked to do their 1st wave interviews by phone. Wave 2-4 are CATI/CAWI and not affected. The change from CAPI to CATI in the first wave was already implemented in March 2020.
Canada: The Canadian Labour Force Survey does not allow for a clear delineation of attainment at ISCED 4 and at ISCED 5; as a result, some credentials that should be classified as ISCED 4 cannot be identified and are therefore included in ISCED 5. Thus, the proportion of the population with tertiary education ISCED level 5 is inflated. It is also not possible to single out university certificates above bachelor’s (ISCED 6) and therefore doctoral levels (ISCED 8) are included in Masters or equivalent (ISCED 7), resulting in the overstating of Masters or equivalent (ISCED 7).
Statistics Canada has an established history of applying a standard revision to LFS estimates following the release of final population estimates from each census. This standard revision process ensures the continued accuracy and quality of LFS information by ensuring that survey estimates reflect the size and composition of Canadian society. Resulting changes to recent and historical LFS data are relatively minor and have little impact on trends in key labour market indicators, such as employment, unemployment, and participation rates. Until December 2020, labour force estimates were based on population counts from the 2011 Census of Population. As of January 2021, the estimates have been adjusted to reflect population counts from the 2016 Census, and revisions back to 2006 have also been made. https://www150.statcan.gc.ca/n1/pub/71f0031x/71f0031x2021001-eng.htm
Chile: The National Socio-Economic Characterization Survey (CASEN) does not allow determine the orientation of upper secondary educational programmes (ISCED 344/354) for those with incomplete tertiary education. Observations in this situation have been classified as general upper secondary education (ISCED 344).
Costa Rica: Data collection changed in 2020 to a combination of telephone calls and face to face interviews. In 2021 we gradually increased the share of face-to-face interviews buy we maintained the combined methodology.
Denmark: A break in time series occurred in 2007 as the survey was changed and expanded considerably, by expanding the quarterly sample size from around 20,000 to 40,532 in order to reduce sampling errors of survey results. Furthermore, the rotation pattern was changed from three to four waves, and the data collection process which Statistics Denmark had been in charge of so far was outsourced. The changes in 2007 resulted in a break in series both on detailed sub-groups. As a result of this one should be aware of this when comparing results before and after the break.
In 2019 the weighting scheme was changed in the Danish LFS as the Employees Statistics, information on transfer income from the eIncome register and information on ownership of sole proprietorships and partnership enterprises from Statistics Denmark’s business register had become sufficiently up-to-date to be applied in LFS’s raising model. Altogether, over 90 per cent of the respondents in the LFS are registered in one or more of the mentioned relevant registers. By ensuring that the number of persons in employment – as well as other labour market statuses in the LFS – better match the number they represent in the population, different response rates of these different groups are adjusted for. Thereby bias is reduced.
The Employees Statistics goes back to 2008, so implementing this new raising model has created a break in time series between 2007 and 2008.
Estonia: In tables with trend data, the European Union Labour Force Survey (EU-LFS) data were used for all years.
At the beginning of 2021, the data content, data collection and estimation method of the Finnish Labour Force Survey were revised. The most important content changes concerned working time data and the definition of employed person. The data collection was revised by introducing a web questionnaire as a new data collection method alongside computer-assisted telephone interviews and face-to-face interviews. The revised estimation method utilises more widely different registers, such as Statistics Finland's Register of Completed Education and Degrees. For example, the Register of Completed Education and Degrees is used to correct the skewness of the collected Labour Force Survey data according to the level of education more precisely than before.
Unfortunately, the data before 2021 has not been corrected this time due to resource limitations.
Revisions of the Finnish Labour Force Survey were not related to the COVID-19 pandemic. The revisions were general development of the Labour Force Survey and due to the revisions of the Integrated European Social Statistics. The statistics produced with the old estimation method are not comparable with the statistics produced with the new estimation method.
France: Variables on education attainment changed in 2003 and 2013 (more accurate). From 2003, age is reported at survey time instead of the end of the year. In 2013, the questions on educational attainment have been simplified and the process became more interactive (impact of about +2 percentage points of the proportion of 25-64 with ISCED 3-8). Furthermore, in 2013 a break in the series of unemployment rates occurred. From 2015, data cover overseas departments.
Germany: Impact of the methodological redesign and the Covid-19 crisis on the microcensus 2021 results:
A completely new IT system was set up for the redesigned microcensus from 2020; its introduction was accompanied by technical problems. Individual technical challenges continued in the 2021 survey year. Together with the partially ongoing effects of the corona pandemic, these led to restrictions in the survey conduct. Taken together, however, the effects were much less strong than in 2020 - analysis limitations may still occur in deep technical or regional breakdowns.
The average non-response rate for the first results of the 2021 microcensus is approximately 17 % at the federal level. This value is considerably lower than in 2020 (approx. 38 %). Thus, there is an improvement in the quality of the annual results in 2021 compared to 2020.
Greece: 1. For reasons of public health protection, data were collected mainly by way of telephone interviews. 2. The adoption of the new Framework Regulation of Social Statistics (ΕU 2019/1700, IESS) and the Implementing Regulation (ΕΕ) 2019/2240 for the Labour Force Survey, introduced important changes in the survey methodology. The main changes concern: i. Data collection (general use of computer-aided interviews); ii. The formulation of questions related to the employment status of respondents during the reference week (due to the adoption of a model questionnaire prepared by Eurostat); iii. The computation of the weighting factors; iv. The definition of employment and, in particular, the treatment of person reporting having a job during but not working even for one hour.
Ireland: Prior to COVID-19, all LFS interviews were carried out using both face to face and telephone interviewing. However due to Public Health restrictions resulting from COVID-19, all face-to-face interviewing on CSO household surveys was suspended from March 2020. As a result, all interviews for the LFS were carried out by telephone only from March 2020 onwards.
Israel: Although pre-academic institutions in Israel are classified under ISCED 4 in the national mapping of education, this level remains unaccounted for in this report, since the LFS does not include a specific answer category for this level.
Italy: During 2021, the Labor Force Survey underwent two major changes:
1. the introduction, from 1 January 2021, of the European Regulation (EU) 2019/1700, which entailed changes in definitions and questionnaire in order to improve the degree of harmonization of the statistics produced by the EU countries, to optimize the information already collected, to meet current needs for information and to explore specific issues;
2. the adaptation to the new population estimates of individuals and families derived from the Permanent Census of Population, which aims to improve the quality of demographic statistics in terms of consistency, structural composition and amount of events observed, also in order to ensure that the results of the sample surveys are representative of the resident population.
For these reasons, a process of back-recalculation has been conducted and new time series are now available, starting from 2004 for the main indicators and from 2018 for more detailed series.
The questions concerning the education attainment were revised without affecting the education attainment data on below upper secondary, upper secondary and tertiary aggregates, although some minor impact may have occurred at more disaggregated level or on specific age-classes. Some slight impact may also occur when the participation is analysed separately for formal and non-formal education, because the changes introduced in the 2021 questionnaire.
Moreover, some indicators are still under study and among them there is the information on usual working hours. Considering that data collected during 2020 and 2021 were strongly affected by the pandemic, for this topic it is necessary to acquire further data to assess the seasonality of the estimates from the new survey and to evaluate the need to proceed with the reconstruction of the entire time series.
Since the survey is longitudinal, the effects and biases introduced and treated in 2020 continue to be seen in 2021, in particular for the subsamples interviewed in 2020 and re-interviewed in 2021.
It is recalled in particular that in 2020 this had happened: During the Covid-19 emergency, the ban on carrying out the interviews in CAPI mode as well as the temporary suspension of the activities carried out by the enterprise in charge for CATI interviews, has led to a change in the survey technique. The interviews originally assigned to CATI have been reassigned to CAPI interviewers, allowing them to contact households and conduct the interview by telephone. This means that not all the features of the CATI system were available; nevertheless, CATI technique seems to be the more suitable option.
1. The sub-samples of the labour force survey referring to March and April 2020 present bias elements related to: the selection of respondent units due to the availability of telephone contact; the changed probability in contacting employed persons following the closure of some activity sectors and the adoption of smart working modalities; the change of survey technique and interviewers network.
3. The bias has been confirmed by the comparison with both administrative data and the previous monthly and quarterly samples of the same survey. In particular, working people, normally representing the subpopulation with the highest rate of non-response, in March and April show a response rate very similar to those obtained for unemployed and inactive people.
4. The availability of a telephone contact seems to be associated with some demographic characteristics (already considered in the data weighting system), but also with the educational level, a variable that in its turn is related to the employment condition. The educational level distribution in March and April samples appears biased, especially among people over 30 years old; by contrast, the distribution by citizenship seems to be in line.
5. In order to correct the bias mentioned above, a new calibration constraint based on education qualification has been included in the quarterly and monthly processing.
Latvia: As of 13 March 2020, with aim to limit spread of Covid-19 face-to-face interviews (CAPI) are restricted, data collection only through CATI interviews and online surveys (CAWI).
Luxembourg: The results apply to those people living in Luxembourg who have been educated in Luxembourg, as well as to those who have been educated in another country. This means the figures cannot be used to analyse the national educational system. There was a break in 2003 due to transition to a quarterly continuous survey (source Eurostat).
Methodology changed for year 2021 according to ESS 202.
New Zealand: Attainment data before 2013 on ISCED levels 4 and 5 are no longer reliable, and trends should not be used. Trend data for total tertiary attainment (ISCED 5 and above), or for the combined ISCED 3 and 4 group, can therefore also no longer be used. Trend data for “below upper secondary”, “upper secondary” only, and “degree and above” can still be reliably used.
Attainment data for New Zealand are sourced from the New Zealand Household Labour Force Survey (HLFS). The educational attainment question in this survey changed in 2013. These changes brought the questions asked more in line with the way educational attainment is collected in other government surveys and administrative collections. The new question provided a more accurate way to map responses to both the New Zealand qualifications framework (NZQF), and to the ISCED. The previous question included a number of categories that related to types of qualifications that could span more than one educational level. For example, “University certificate or diploma below degree level”, “Teacher and nursing certificates or diplomas” or “NZ certificate or diploma”, which can span a number of ISCED levels from 2 to 6. For the reporting of New Zealand attainment data in Education at a Glance, a best-fit mapping of these categories to ISCED was developed, using a method that minimised the level of error inherent form assigning categories spanning more than one level to just one level. The new educational attainment question introduced into the HLFS in 2013 provides a more exact mapping to NZQF levels, and to ISCED levels. In particular, the new question can separate post-initial school ISCED 3, ISCED 4 and ISCED 5 attainment more accurately than the previous question could.
The main impact of this survey change on New Zealand attainment data for Education at a Glance affects ISCED 4 and ISCED 5. Between EAG 2014 (using 2012 data and the old HLFS question) and EAG 2015 interim report (using 2013 data and the new HLFS question), attainment of the 25-64 year-old population at ISCED 5 shifted from 15% to 11%; and at ISCED 4 from and 8% to 16%. Consequently, the proportion with “tertiary” attainment shifted from 40% to 35%. The changes did not significantly affect the proportions with degrees above (ISCED 6 and over), or those with upper secondary (ISCED 3) only, or those with less than upper secondary.
Around 9% of adults in New Zealand have a one-year upper secondary level qualification as their highest attainment. These include the National Certificate of Educational Achievement Level 1, School Certificate for older adults, or a Level 1 National Certificate. Under either ISCED-97 or ISCED 11 these do not count as upper secondary attainment. In earlier editions of Education at a Glance using ISCED-97, these were identified separately as ISCED 3CS. Under ISCED 2011, being used from EAG 2015 on, these one-year qualifications are no longer recognised separately, and are grouped with those with no school qualifications.
Norway: A break in time series on educational attainment occurred in 2005, as the classification of educational attainment was reclassified. Attainment numbers for 2000-2004 follow the former classification of educational attainment and are not comparable with more recent years. The main change is an increase in ISCED 2 attainment, at the expense of ISCED 3. The attainment criteria for ISCED 3 were tightened from course completion to successful completion of the whole programme (studiekompetanse/fagbrev). A reasonable amount of movement also occurred between ISCED 3 and ISCED-97 – level 5, but the net difference is marginal. A minimum of two years full-time study load, equivalent to 120 credit points, is defined as an attainment criterion for ISCED-97 - level 5 (http://www.ssb.no/english/subjects/04/01/utniv_en/).
In 2020, the register on educational attainment of the population was supplemented with new information about immigrants’ highest level of education from the Norwegian Agency for Quality Assurance in Education (NOKUT), the Norwegian Labour and Welfare Administration (NAV) and from the statistical agencies in Iceland, Finland and Denmark. This has caused changes to the proportion of the population by educational attainment. The register will from 2020 be updated annually with data from NOKUT and NAV.
Poland: From 2006 onwards previous 3CS programmes for Poland have been reallocated to 3C Long, since 3C programmes in Poland last three years, which is similar to the typical cumulative duration of a standard national ISCED 3A general programme.
Since the first quarter of 2021, there have been introduced methodological changes in the LFS resulting from the implementation of the framework regulation for social statistics, i.e. Regulation (EU) 2019/1700 of the European Parliament and of the Council of 10 October 2019 and its implementing acts.
the subjective range – the core part of the survey covers persons aged 15-89 years (until the fourth quarter of 2020, they were persons aged 15 years and more), for other household members, i.e. persons aged below 15 years and over 89 years, there is only collected information regarding the general characteristic of a household,
definition and the way of specifying particular populations of persons on the labour market – employed, unemployed and economically inactive persons (i.e. in the wording and the order of asking questions),
the objective range of the survey (partial exchange of the variables).
Therefore, the LFS data since the first quarter of 2021 must not be compared with previous periods.
Portugal: Since the 2nd quarter of 2020 the data has been collected only by telephone (CATI). Face-to-face interviews (CAPI) were suspended and will be reactivated as soon as possible.
Slovak Republic: In 2021, the IESS methodology has been applied and a new weighing method was used. In addition, due to lockdown, from 3rd week to 8th week CAPI mode of data collection in LFS was replaced by CATI.
Spain: The new regulations in the LFS were implemented in 2021 but no significant impact in the Spanish results was detected.
Sweden: There are the following breaks in the series: 2013/2014 when the ISCED Classification 2011 has been introduced. Upper secondary education with duration shorter than 2 years (mainly AMU-education and Komvux) was reported at ISCED 3 in ISCED-97 and is reported at ISCED 2 according to ISCED 2011. Due to this change, there is a big increase in the share of the population aged 25-64 with “below uppers secondary education”, from 12% to 18%. Furthermore, in 2001 when the new standard for classification of education (SUN 2000) was applied in 2001, and in 2005, when a new EU-harmonised questionnaire was introduced, the break in the series leads, among other consequences, to a breakdown of ISCED-97 levels 4 and 5B into two separate variables. The latter explains the decrease in tertiary attainment 2005.
In 2020, the register on educational attainment of the population was supplemented with new information about immigrants’ highest level of education from the Norwegian Agency for Quality Assurance in Education (NOKUT), the Norwegian Labour and Welfare Administration (NAV) and from the statistical agencies in Iceland, Finland and Denmark. This has caused changes to the proportion of the population by educational attainment. The register will from 2020 be updated annually with data from NOKUT and NAV.
Switzerland: Trend data have been revised from 1997 to 2008 to correct an error in the original data source. Changes in ISCED categories 3CS and 3CL were carried over the time series (1997 to 2008). Before 2001, however, ISCED 3CL only partially reflects the reality. It should not be distinguished from other categories of ISCED 3. In general, before 2001, it is not possible to distinguish between the ISCED categories 1 and 2, as well as to the ISCED categories 3 and 4 or that of ISCED 5A and ISCED-97 – level 6.
In 2021, the Swiss LFS survey changed from being a survey conducted purely by telephone to a multi-mode survey (via internet and telephone) with priority given to the internet survey. In addition, the 2021 questionnaire was modified to comply with the new Eurostat regulations, also in force from January 2021. For certain results, these changes have led to a break in the series between 2020 and 2021.
Türkiye: The 2007 figures were adjusted according to the new census showing a decrease in total population compared to the projections. For the moment no adjustment/revision are available for the previous years. When the new population projections will be ready, the series will be revised back in time, including 2007 figures. It is not correct to compare 2007 figures with previous years.
United Kingdom: An improved methodology introduced in 2009 led to an increase in measured educational attainment. For 25-64 year-olds the effect was an increase of 3.4 percentage points for those with at least upper secondary level education, and 3.4 percentage points for tertiary level attainment. Women aged 60-64 are included from 2009. The back time series was revised in 2008, taking account of reweighted (to mid-census population estimates) and revised (now using calendar rather than seasonal quarters) data. The revisions provided an opportunity to correct some long-standing anomalies in older data (reported up to 2005), such as an overestimation of the proportion holding ISCED-97 – level 6 (doctoral level), and where ISCED 3B was incorrectly grouped in 3A.
In 2020, telephone interviews were used instead of face to face and reweighting of figures to account for potential sample bias.
United States: Please note that the NEAC submission for the United States includes those members of the US military services who live in civilian households. These individuals are normally excluded from civilian labour force computations produced by the United States. The figure for inactive population calculated by the OECD as the difference between the total population and those employed in civilian jobs plus unemployed population does include these military service personnel as “inactive”. For this reason, the figure for inactive population differs from the one produced nationally in the United States from the same survey.
Caution should be used when comparing 2021 estimates to those of prior years due to the impact that the coronavirus pandemic had on interviewing and response rates. For additional information about the impact of the coronavirus pandemic on the Current Population Survey data collection, see https://www2.census.gov/programs-surveys/cps/techdocs/cpsmar21.pdf.
The household survey is conducted by the U.S. Census Bureau and normally includes both in-person and telephone interviews, with the majority of interviews collected by telephone. In 2021, for the safety of both interviewers and respondents, in-person interviews were only conducted when telephone interviews could not be done. While the response rate improved over 2020, it is still lower than pre-COVID years. Additionally, there are larger differences between respondents and non-respondents in 2020 and 2021 than in earlier years. Of particular interest for the estimates in the ASEC reports are the differences in median income and educational attainment, indicating that respondents in 2020 and 2021 had relatively higher income and were more educated than non-respondents. For possible effects on these estimates, please see https://www.census.gov/newsroom/blogs/research-matters/2021/09/pandemic-affect-survey-response.html Caution should be used when comparing 2021 estimates to those of prior years due to the impact that the coronavirus pandemic had on interviewing and response rates. For additional information about the impact of the coronavirus pandemic on the Current Population Survey data collection, see https://www2.census.gov/programs-surveys/cps/techdocs/cpsmar21.pdf.
The household survey is conducted by the U.S. Census Bureau and normally includes both in-person and telephone interviews, with the majority of interviews collected by telephone. In 2021, for the safety of both interviewers and respondents, in-person interviews were only conducted when telephone interviews could not be done. While the response rate improved over 2020, it is still lower than pre-COVID years. Additionally, there are larger differences between respondents and non-respondents in 2020 and 2021 than in earlier years. Of particular interest for the estimates in the ASEC reports are the differences in median income and educational attainment, indicating that respondents in 2020 and 2021 had relatively higher income and were more educated than non-respondents. For possible effects on these estimates, please see https://www.census.gov/newsroom/blogs/research-matters/2021/09/pandemic-affect-survey-response.html.
Argentina: Data collected through the Permanent Household Survey (Urban) (Encuesta Anual de Hogares Urbanos (EAHU)) covers the 31 Urban Agglomerations as well as all administrative units with 2000 or more inhabitants with the exception of the provinces Tierra del Fuego, Antártida e Islas del Atlántico Sur.
Brazil: In 2020 and 2021, investigation of supplementary themes and topics was temporarily suspended, but the survey on basic demographic, education and labor force characteristics, which is continuously surveyed in every quarter of the year, was maintained. However, due to difficulty in contacting residents by telephone, non-response rates increased, especially in dwellings that were in the sample for the first time in each quarter. It was not necessary to make aggregations to generate the data that are presented in this questionnaire, as the information used is not from the themes and topics that were suspended due to the Covid-19 pandemic. Until 2019, information from interviews carried out in dwellings that were in the sample for the first time was used to generate annual results. However, for 2020 and 2021, annual results were generated with information from interviews carried out in households that were in the sample for the fifth time. This procedure was adopted considering that, during this period, the non-response rates of dwellings that were in the sample for the first time were higher than those of dwellings that were in the sample for the fifth time. For 2021, estimates related to educational levels should be interpreted with caution due to the impact on data collection caused by the Covid-19 pandemic.
Source
Data on educational attainment and labour market status by educational attainment are available online in the Education at a Glance database (http://stats.oecd.org/wbos/default.aspx?datasetcode=EAG_NEAC). Data from the national Labour Force Surveys (LFS) are compiled by the LSO Network (OECD Labour Market, Economic and Social Outcomes of Learning).
For tables with trend data, the European Union LFS (EU-LFS) has been used for Denmark, Estonia and Latvia for the years 2000, 2005 and 2010.
Data for China are taken from the UNESCO Institute of Statistics (UIS) database on educational attainment of the population aged 25 years and older, http://stats.uis.unesco.org (accessed on 7 June 2019).
Data on educational attainment and labour force status for India, Indonesia and Saudi Arabia are taken from the ILO database, https://www.ilo.org/global/statistics-and-databases/lang--en/index.htm (accessed on 7 July 2022).
Specific reliability and confidentiality thresholds by country have been applied. The reliability and confidentiality thresholds are either applied to unweighted data (respondents) or weighted data (population).
Reliability thresholds refer to sample limits to the statistical precision of the indicator that implies that data are either not published or flagged as having a reduced reliability. Reliability thresholds have been applied to the denominator of the indicator. A minimum threshold of 30 respondents for unweighted data have been applied to the denominator.
Data may be omitted due to confidentiality reasons. The respective confidentiality threshold has been applied to the numerator of the indicator. A minimum threshold of 3 respondents for unweighted data have been applied to the denominator.
Table X3.A1.2 in the Statlink file https://stat.link/sqgt5h summarises the metadata by country.
Standard errors
Table X3.A1.3 in the Statlink file https://stat.link/sqgt5h presents estimates and their associated standard errors for data published in EAG 2022:
An asterisk in the column for the standard error (SE) indicates that the value is not statistically significant different from the OECD average.
Standard error estimates incorporating a simple random sample assumption were based on sample size data collected from country-level labour force surveys. The sample sizes of the surveys differ widely, ranging from relatively small samples in Estonia, Iceland, Luxembourg and New Zealand to relatively large samples in France, Germany, Italy, the Netherlands, Spain and the United Kingdom.
In order to get a sense of the impact of these standard errors on the meaning and interpretation of the values in the publication it is helpful to compute the associated confidence intervals. These confidence intervals seem reasonably close to the value reported in most cases, indicating that we can be fairly confident about the statistical accuracy of the values in Tables A1.1 and A1.2 and the supplemental educational attainment estimates from OECD.Stat using the available information on sample sizes. However, even though these estimates are relatively precise, small standard errors can still complicate some types of interpretations of these values, in particular, OECD rankings, due to the fact that small standard errors result in narrow ranges for confidence intervals. It is crucial to note that employing the simple random survey assumption offers a conservative, “best-case scenario” of standard error estimates. As most, if not all, countries’ labour force surveys use complex sample designs, the standard errors would generally be larger if the sample design information were used. The generally small standard errors in Tables A1.1 and A1.2 result in the finding that most of the values are statistically significantly different from the OECD average. If the standard errors were larger, indicating a wider range of possible true values, it would be harder to discern a significant difference between one country and the OECD average value.
While the findings generally support the validity of the tables appearing in EAG, they also suggest that more attention to statistical testing and statistical validity is needed, particularly when detailed data using smaller segments of the population are presented. Also, the standard error estimates should incorporate appropriate adjustments for survey design effects, where the information is available.
For all countries with data available on the sample size, the standard errors were computed under the assumption of a simple random sample. Standard errors taking into account the complex sample design may be higher. The extend of the estimation error of the standard error can be assessed by comparing the precise standard errors released for selected indicators in EAG taking into account the complex survey design with the respective standard errors computed under the simple random sample assumption in the Education at a Glance database (http://stats.oecd.org/wbos/default.aspx?datasetcode=EAG_NEAC).
Methodology
Data from the regular TRANS survey refer to the first quarter of each year: January, February, and March. In case of seasonal quarters, data refer to spring quarters: March, April, May. Exceptions are Greece and Switzerland (second quarter for years prior to 2010).
In contrast, data reported in Table A2.4 refer to the annual average and have been collected in the ad hoc TRANS data collection.
The calculation of educational attainment for those “in education”, as well as for those “not in education” has changed since the reference year 2006. From this year onwards the ISCED level refers to the completed level of education rather than the attended level of education. People with no information on their educational attainment are excluded from all data disaggregated by educational attainment.
The definition of inactive is that inactive individuals are those who are, during the survey reference week, neither employed nor unemployed, i.e. individuals who are not looking for a job, i.e. there is nothing on whether the person is in education or not. Note, for example that in Table A2.1, column 3, even among 18-24 year-olds, 17% of young adults are in education and employed, therefore those in education should not be considered as active or inactive by default.
To note also that data in Indicators A2 and A3 are not directly comparable due to the difference in reference period. This is particularly important for Indicator A2 which focus on the young adults, given that they might be temporarily out of education during summer period.
The COVID-19 pandemic might have an impact on the data collection for some countries. Table X3.A2.1 in the Statlink file https://stat.link/sqgt5h summarises the metadata by country on the survey methodology changes for the TRANS questionnaire due to the pandemic.
Notes on specific countries
Australia: Australian data at the detailed level may be unreliable due to the suppression of small values. The data is indicative only and should be used with caution.
Austria: In 2021, the mode of the data collection changed: F2F Interviews were done partly by phone as recommended by Stat.AT. The CAWI mode was implemented in Q2 2021.
Belgium: A break in time series occurred in 2017 as the Belgian LFS has undergone a major reform in 2017 with the introduction of a 2(2)2 panel design, the introduction of mixed mode data collection, the introduction of the wave approach and the change of the calibration method.
During the whole year 2021 face to face interviews were forbidden. Interviewers were asked to do their 1st wave interviews by phone. Wave 2-4 are CATI/CAWI and not affected. The change from CAPI to CATI in the first wave was already implemented in March 2020.
Canada: The Labour Force Survey establishes whether or not a respondent is attending an educational establishment (includes primary, secondary, college, CEGEP, university).
Costa Rica: Data collection changed in 2020 to a combination of telephone calls and face to face interviews. In 2021 we gradually increased the share of face-to-face interviews buy we maintained the combined methodology.
At the beginning of 2021, the data content, data collection and estimation method of the Finnish Labour Force Survey were revised. The most important content changes concerned working time data and the definition of employed person. The data collection was revised by introducing a web questionnaire as a new data collection method alongside computer-assisted telephone interviews and face-to-face interviews. The revised estimation method utilises more widely different registers, such as Statistics Finland's Register of Completed Education and Degrees.
Revisions of the Finnish Labour Force Survey were not related to the COVID-19 pandemic. The revisions were general development of the Labour Force Survey and due to the revisions of the Integrated European Social Statistics. The statistics produced with the old estimation method are not comparable with the statistics produced with the new estimation method. There is a break in time series in 2021 in the data which are based on the Labour Force Survey.
In 2021, mixed-mode data collection mode (CAWI+CATI) was applied. In addition to that, a minor part of interviews (c. 1%) were made before March 2020 by CAPI, which was cancelled during the pandemic.
France: The time series have been updated to allow for more accurate comparisons across countries than the previous estimates, and to reach comparability with the Eurostat data collection (used from data on years 2009 to 2015). Trends in education participation rates have been lacking reliability since 2013, especially for young people aged 20-24. Trends based on enrolment rates are more accurate.
Germany: Impact of the methodological redesign and the Covid-19 crisis on the microcensus 2021 results:
A completely new IT system was set up for the redesigned microcensus from 2020; its introduction was accompanied by technical problems. Individual technical challenges continued in the 2021 survey year. Together with the partially ongoing effects of the corona pandemic, these led to restrictions in the survey conduct. Taken together, however, the effects were much less strong than in 2020 - analysis limitations may still occur in deep technical or regional breakdowns.
The average non-response rate for the first results of the 2021 microcensus is approximately 17 % at the federal level. This value is considerably lower than in 2020 (approx. 38 %). Thus, there is an improvement in the quality of the annual results in 2021 compared to 2020.
Greece: In 2021, for reasons of public health protection, data were collected mainly by way of telephone interviews. In addition, the adoption of the new Framework Regulation of Social Statistics (ΕU 2019/1700, IESS) and the Implementing Regulation (ΕΕ) 2019/2240 for the Labour Force Survey, introduced important changes in the survey methodology. The main changes concern:
The formulation of questions related to the employment status of respondents during the reference week (due to the adoption of a model questionnaire prepared by Eurostat)
The definition of employment and, in particular, the treatment of person reporting having a job during but not working even for one hour.
Hungary: In 2020 and 2021, most of the interviews were conducted over telephone during the waves of the COVID-19 pandemic.
Iceland: Raw data before 2003 concern 16-29 year-olds. Those aged 15 are estimated as the fraction of 1/14 of the total 16-29 year-old population. They are considered in education, with lower secondary level of education and out of labour force.
Ireland: As of January 2009, the Irish LFS collects data by calendar quarter and not the seasonal second quarter (March-May). Hence data for 2009 onwards are not directly comparable back to previous years.
Israel: The proportion of NEETs from 2012 on is not comparable with data for 2011 and previous years. Conscripts into the army are considered to be employed, as opposed to 2011 and before, when they were counted as not in the labour force.
Work-study programmes apply to a very small part of the population (currently 4% of secondary students are enrolled in such programmes).
Italy: Since the survey is longitudinal, the effects and biases introduced and treated in 2020 continue to be seen in 2021, in particular for the subsamples interviewed in 2020 and re-interviewed in 2021.
It is recalled in particular that in 2020 this had happened: During the Covid-19 emergency, the ban on carrying out the interviews in CAPI mode as well as the temporary suspension of the activities carried out by the enterprise in charge for CATI interviews, has led to a change in the survey technique. The interviews originally assigned to CATI have been reassigned to CAPI interviewers, allowing them to contact households and conduct the interview by telephone. This means that not all the features of the CATI system were available; nevertheless, CATI technique seems to be the more suitable option.
The sub-samples of the labour force survey referring to March and April 2020 present bias elements related to: the selection of respondent units due to the availability of telephone contact; the changed probability in contacting employed persons following the closure of some activity sectors and the adoption of smart working modalities; the change of survey technique and interviewers network.
The bias has been confirmed by the comparison with both administrative data and the previous monthly and quarterly samples of the same survey. In particular, working people, normally representing the subpopulation with the highest rate of non-response, in March and April show a response rate very similar to those obtained for unemployed and inactive people.
The availability of a telephone contact seems to be associated with some demographic characteristics (already considered in the data weighting system), but also with the educational level, a variable that in its turn is related to the employment condition. The educational level distribution in March and April samples appears biased, especially among people over 30 years old; by contrast, the distribution by citizenship seems to be in line.
In order to correct the bias mentioned above, a new calibration constraint based on education qualification has been included in the quarterly and monthly processing.
Latvia: As of 13 March 2020, with aim to limit spread of Covid-19 face-to-face interviews (CAPI) are restricted, data collection only through CATI interviews and online surveys (CAWI).
Netherlands: In 2021, face to face data collection was not possible all months.
Portugal: Since the 2nd quarter of 2020 the data has been collected only by telephone (CATI). Face-to-face interviews (CAPI) were suspended and will be reactivated as soon as possible.
Slovak Republic: In 2021, the IESS methodology has been applied and a new weighing method was used. In addition, due to lockdown, from 3rd week to 8th week CAPI mode of data collection in LFS was replaced by CATI.
Spain: Those aged 15 are considered in lower secondary level of education and out of labour force because education is compulsory for this age.
The new regulations in the LFS were implemented in 2021 but no significant impact in the Spanish results was detected.
Sweden: From 2005, the introduction of a new EU-harmonised questionnaire resulted in a break in all-time series. With the modification of the definition of unemployment, the rate of unemployment increased by 0.5%.
Switzerland: In 2021, the Swiss LFS survey changed from being a survey conducted purely by telephone to a multi-mode survey (via internet and telephone) with priority given to the internet survey. In addition, the 2021 questionnaire was modified to comply with the new Eurostat regulations, also in force from January 2021. For certain results, these changes have led to a break in the series between 2020 and 2021.
Türkiye: There is a break in the series from 2007. Figures were adjusted according to the new census showing a decrease in total population compared to the projections.
United Kingdom: Raw data before 2013 concern 16-29 year-olds. Those aged 15 were previously estimated as the fraction of 1/14 of the total 16-29 year-old population. They are considered in education, with lower secondary level of education and out of labour force.
The work-study programmes definition includes:
Government employment or training schemes (youth training programme, training for work, action for community employment, job skills, national young traineeship).
Those on a new deal scheme, working for an employer in the public or private sector, working for the voluntary sector, working for an environmental task force, other type of new deal schemes involving practical training (practical training, at college, temporarily away from project/college).
Those on the following government employment or training schemes: in England/Wales on a scheme run by a training and enterprise council, in Scotland on a scheme run by a local enterprise company.
Anyone on a recognised trade apprenticeship not included in any of the above schemes.
The category “Other employed” includes people in education, who are employed but not included in the work-study programme.
In 2020, telephone interviews were introduced instead of face to face and reweighting of figures to account for potential sample bias.
United States: For the safety of both interviewers and respondents, in-person interviews were suspended on March 20, 2020. Starting in July 2020, interviewers resumed conducting some in-person interviews on a limited basis in certain areas of the country.
This submission includes data for January, February and March 2021. The household survey is conducted by the Census Bureau and normally includes both in-person and telephone interviews, with the majority of interviews collected by telephone. For all 3 months, interviewers in most areas of the country conducted in-person interviews, though only after first attempting to reach households by telephone. Also, a relatively small number of telephone interviews were conducted through two call centres. The response rate for the household survey was 78 percent in January 2021, 78 percent in February 2021, and 76 percent in March 2021. While response rates were lower than the average before the pandemic of 83 percent for the 12 months ending in February 2020, they were considerably higher than the low of 65 percent in June 2020. For all three months, response rates for households entering the sample for their first month, which has a direct impact on response rates in successive months, remained lower than average. The response rate for these households, which normally are interviewed in person, was 9 percentage points lower in January 2021, 7 percentage points lower in February 2021, and 7 percentage points lower in March 2021 than the average for the 12 months ending in February 2020. However, this was a considerable improvement over the initial months of the pandemic. For more information on the impact of the pandemic on data collection and detailed response rate information, please see: https://www.bls.gov/covid19/effects-of-covid-19-pandemic-and-response-on-the-employment-situation-news-release.htm.
The TRANS ad hoc submission includes 12-month data for 2021. The household survey is conducted by the Census Bureau and normally includes both in-person and telephone interviews, with the majority of interviews collected by telephone. For all 12 months, interviewers in most areas of the country conducted in-person interviews, though only after first attempting to reach households by telephone. Also, a relatively small number of telephone interviews were conducted through two call centers. The response rate for households entering the sample for their first month, which has a direct impact on response rates in successive months, remained lower than average for all 12 months. The response rates for these households, which normally are interviewed in person, were between 5 and 12 percentage points lower than the average for the 12 months ending in February 2020 for all 12 months of 2021. However, this was a considerable improvement over the initial months of the pandemic.Overall, while monthly responses rates in 2021 were lower than the average before the pandemic of 83 percent for the 12 months ending in February 2020, they were considerably higher than the low of 65 percent in June 2020 (https://data.bls.gov/timeseries/LNU09300000).
Brazil: For 2020, QIII BRA Trans' figures cannot be estimated due to impact on data collection caused by the Covid-19 pandemic.
Source
Data on population, educational attainment and labour-market status for most countries are taken from OECD and Eurostat databases, which are compiled from National Labour Force Surveys by the OECD LSO (Labour Market and Social Outcomes of Learning) Network, and usually refer to the first quarter, or the average of the first three months of the calendar year.
The sources for data on the transition from education to work are the same as in Table A1.1 except for France where the source is the European Union LFS (EU-LFS) for year reference 2009 to 2015 and for the United States where the source is the October Supplement to the Current Population Survey (CPS) instead of the March Supplement.
Table X3.A2.2 1 in the Statlink file https://stat.link/sqgt5h summarises the metadata by country.
Standard errors
Table X3.A2.2 in the Statlink file https://stat.link/sqgt5h presents estimates and their associated standard errors for data published in EAG 2022.
For more information see above in Indicator A1 the section on Standard errors for EAG 2022.
Methodology
The methodology for this Indicator and the changes in the survey methodology due to the Covid-19 pandemic are similar to the information included for Indicator A1. The following tables are available in the Statlink file https://stat.link/sqgt5h:
Table X3.A1.1 shows the educational attainment and ISCED mappings/codes for each country. It presents the national codes according to ISCED 2011 and shows the codes included in each level of education.
Table X3.A1.2 summarises the metadata by country on the changes in the survey methodology due to the COVID-19 pandemic.
For further information on sources and notes on specific countries, see Indicator A1.
United States: The employment rate for the field of study submission is based on the American Community Survey (ACS) and is a different value than the employment rate submitted in the main submission based on the Current Population Survey (CPS). The table A3.4 uses the CPS total even though the rest of the table is ACS.
Source
The sources for data in this indicator are the same as for Indicator A1, with the exception of the data for fields of study for some countries listed below.
For further information on sources and notes on specific countries, see Indicator A1.
Standard errors
Tables X3.A3.1 and X3.A3.2 in the Statlink file https://stat.link/sqgt5h present estimates and their associated standard errors for data published in EAG 2022.
For more information see above on Indicator A1 the section on Standard errors for EAG 2022.
Methodology
Indicator A4 provides data on earning advantages from education. Data is collected by national questionnaires and compiled by the INES network on Labour Market, Economic and Social outcomes of learning (LSO). Earning advantages are based on educational attainment (ISCED classification).
Relative earnings of employed compared to employed with upper secondary education are calculated as follows:
is the mean earnings of persons within an age group and gender with a certain educational attainment level compared to where the mean earnings of persons of the same age group is upper secondary education as highest level of educational attainment.
Women’s earnings relative to men’s earnings are calculated as follows:
is the annual mean earnings of women of a particular age group and highest educational attainment level and is the annual mean earnings of men of the same age group and level of educational attainment.
Level of earnings relative to median earnings:
The level of earnings relative to median earnings is defined as the ratio of the number of people with earnings within an earnings level relative to the median and all persons with earnings from employment. The distribution is calculated for all earners (including full-time, full-year earners and part-time earners). These relative earnings are broken down into the following earning levels:
Notes on specific countries
Australia: The data source used since reference year 2016 is different from the one used in previous years. As a result, data are not directly comparable between 2016 onwards and previous years.
Belgium: The data source used for all earnings from work is the EU Statistics on Income and Living Conditions (EU-SILC). There is a break in the data source between reference year 2019 and the previous years.
Canada: The data source used since reference year 2014 is different from the one used in previous years. As a result, data are not directly comparable between 2014 onwards and previous years. For data collected from the Canadian Income Survey (CIS), population estimates of a value equal to or less than 5,000 should not be released, nor used in the calculation of ratios. Characteristics of such populations should not be released either.
For data collected from the Canadian Income Survey (CIS), population estimates of a value equal to or less than 5,000 should not be released, nor used in the calculation of ratios. Characteristics of such populations should not be released either.
Chile: Data on earnings is obtained from a process of inclusion of compulsory salary deductions, depending on labour and social characteristics of each observation.
Czech Republic: The term full-time is a self-designated full-time status. Working hours are defined for a concrete position which is the same as real time usage defined as a full-time. As far as the working hours defined for concrete job differ from real time the employee spends at work, it is defined as part time. There is another additional criterion that says: if the defined working hours for concrete position are less than 30 hours per week, it automatically marked as a part-time. But the usual working time is 40 hours per week for full-time.
Finland: Data on earnings by field of study for 2017 and 2020 used a different data source. In 2017 Earnings data by fields was from the Structure of Earnings Survey while the latest dataset is from the Employment Statistics.
France: Since reference year 2012, the age is measured at the beginning of the reference period, i.e. one year before the survey. Age was previously measured at the beginning of the survey year.
Ireland: The source for the data in all tables is the EU Statistics on Income and Living Conditions (EU-SILC). The results for the Irish EU-SILC for 2010 have been revised following extensive investigation of anomalies in the data. There was no significant change in the deprivation and consistent poverty rates. Due to the timescale involved there was not time to revise the 2010 data published for Ireland in this year’s EAG. The data for 2010 to be published in subsequent editions of EAG will be based on the revised data.
Regarding data for year 2020 (data collection in 2021), there has been a complete re-design of SILC questionnaire for Ireland and processes resulting in breaks in series in certain variables.
Luxembourg: The data source used since reference year 2016 is different from the one used in previous years. As a result, data are not directly comparable between 2016 onwards and previous years.
Norway: Information on those working full-time, full-year is collected from an administrative register on employees; the Employer and Employee register (EE-register). For reference years before 2014, full-time full-year earners are defined as those being registered with a job each month through the year with a contractual number of at least 35 hours per week each month. Since reference year 2015, full-time full-year earners are defined as those being registered with a job in December with a contractual number of at least 35 hours per week.
The EE-register covers about 90 per cent of all the employees. Those not covered are mainly employees with short term jobs.
The EE-register has not been used for compiling these kinds of data so far. There are some quality problems with the EE-register which probably results in an overestimation of the number of full-time, full-year employees. Updating of the EE-register is done by the employers. Some employers might have forgotten to report about employees that have left their job before the end of the year and some might have forgotten to report about employees that have decreased their contractual hours below 35 hours.
Portugal: The data, whose source is "Personnel Tables", refers to firms with employees in the private sector (covered by Portuguese Labour Code), excluding public administration and the coverage of the agricultural sector is low. Civil servants (with employment contracts in public functions), self-employed and domestic service are not covered. Data refers to employees (and respective earnings in the main job) at establishments in Portugal in October 2020.
Sweden: Data from total registers for year 2017 while previous years data was from EU Statistics on Income and Living Conditions (EU-SILC), therefore there is a break in time series. The distribution of full-time full year and part-time part-year earners have changed due to a methodological change. A new source “AGI Employer declaration at individual level” is used, which has much higher quality than the previous used “KU register”. In the old source, the number of full-year workers was over-estimated. The effect on the Earnings data is a decline in full-time full-year workers and a corresponding increase of part-time part-year workers, as a share of all workers. The Indicator A4 on full-time earners might be slightly affected but measures based on all earners or total population should not be affected at all. The category "No earners" has been redefined from year 2020. Before 2020 people with zero earnings has been classified as No earners no matter if they worked or not. From 2020 the number of months worked is decisive, rather than the level of earnings. This resulted in 52 000 people transferred from "No earnings" to "All earners". About 10% of them are Full-time Full-year earners. The overall impact is expected to be low. For example, the effect on median earning is -0,5 percent.
United Kingdom: Data for upper secondary attainment include completion of a sufficient volume and standard of programmes that would be classified individually as completion of intermediate upper secondary programmes (about 15% of the adults are in this group).
United States: Data users should exercise caution when comparing estimates for data year 2020 from the reports or from the microdata files to those from previous years due to the effects that the coronavirus (COVID-19) pandemic had on interviewing and response rates. Using administrative data, U.S. Census Bureau researchers have documented that there are more (and larger) differences between respondents and nonrespondents in 2021 than in earlier years. Of particular interest for the estimates in the Current Population Survey Annual Social and Economic Supplement reports are the differences in median income and educational attainment, indicating that respondents in 2021 had relatively higher income and were more educated than non-respondents.
Source
The indicator is based on the data collection on education and earnings by the OECD LSO (Labour Market and Social Outcomes of Learning) Network. Tables X3.A4.1 and X3.A4.2 in the Statlink file https://stat.link/sqgt5h summarise the metadata by country.
Table X3.A4.3 in the Statlink file https://stat.link/sqgt5h summarise the information on the treatment of persons with zero or negative earnings.
The COVID-19 pandemic might have an impact on the data collection for some countries. Table X3.A4.6 in the Statlink file https://stat.link/sqgt5h summarises the metadata by country on the changes in the survey methodology due to the pandemic.
Actual earnings data for EAG 2022
Tables X3.A4.4 and X3.A4.5 in the Statlink file https://stat.link/sqgt5h present earnings data in actual values in USD using PPP for private consumption.
Methodology
Table A6.1. Internet use, by educational attainment and age group (2021)
Variables included in this table are based on the EU Survey on ICT usage in households and by individuals (EU-ICT) for European OECD member countries; and national surveys for non-European countries. See the Source section for more details.
Data from EU-ICT were extracted from Eurostat on 10 June 2022. More information on the methodology of this survey are available at: https://ec.europa.eu/eurostat/cache/metadata/en/isoc_i_esms.htm
Table A6.2. Trends in the use of the Internet for different activities among 55-74 year-olds, by educational attainment (2019 to 2021)
Variables included in this table are based on the EU Survey on ICT usage in households and by individuals (EU-ICT) for European OECD member countries; and national surveys for non-European countries. See the Source section for more details.
Data from EU-ICT were extracted from Eurostat on 10 June 2022. More information on the methodology of this survey are available at: https://ec.europa.eu/eurostat/cache/metadata/en/isoc_i_esms.htm
Table A6.3. Students' social tolerance, by educational attainment of the mother (2018)
Indices included in this table are based on the Programme for International Student Assessment (PISA) 2018 Global Competence Questionnaire, available at: https://www.oecd.org/pisa/PISA-2018-Global-Competence-Questionnaire.pdf
Across OECD countries, the average of each index is 0 and the standard deviation is 1. A negative value in the mean index does not imply that students responded negatively, merely that their answers were less positive than the average student across OECD countries. Likewise, positive values indicate more favourable or more positive responses than the OECD average. For variables used to construct each index, please refer to the explanations provided for Tables A6.4, A6.5 and A6.6.
Mother’s educational attainment is based ISCED-97. Below upper secondary corresponds to ISCED-97 levels 0, 1, 2 and 3C short programs; upper secondary or post-secondary non-tertiary corresponds to ISCED-97 levels 3A, 3B, 3C long programmes and level 4; and tertiary corresponds to ISCED-97 levels 5A, 5B and 6.
Table A6.4 (Web only). Students’ interest in learning about other cultures, by mother’s educational attainment (2018)
Variables included in this table are based on PISA 2018 Global Competence questionnaire and reflect the share of 15 year-old students surveyed who answered “very much like me” or “mostly like me” to the following statements:

Table A6.5 (Web only). Students’ attitudes towards immigrants, by mother's educational attainment (2018)
Variables included in this table are based on PISA 2018 Global Competence questionnaire and reflect the share of 15 year-old students surveyed who answered “agree” or “strongly agree” to the following statements:
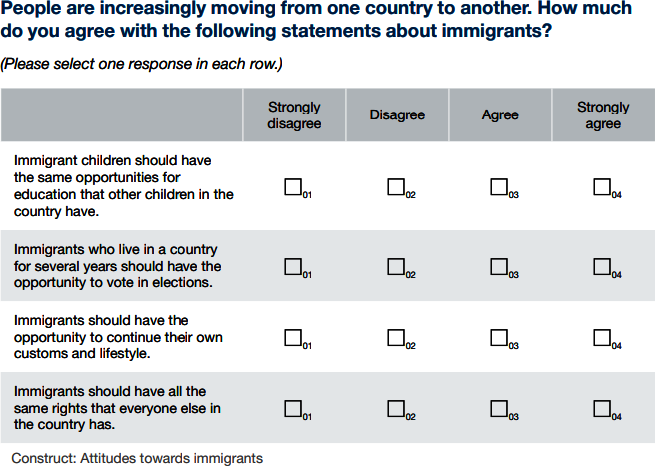
Table A6.6 (Web only). Students’ global mindedness, by mother's educational attainment (2018)
Variables included in this table are based on PISA 2018 Global Competence questionnaire and reflect the share of 15 year-old students surveyed who answered “agree” or “strongly agree” to the following statements:

Table A6.7 (Web only). Percentage of adults working from home, by age group and educational attainment (2019 to 2021)
Variables included in this table are based on the EU Labour Force Survey (EU-LFS) for European OECD member countries; and national surveys for non-European countries. See the Source section for more details.
For countries taking part of EU-LFS, data with the breakdown by educational attainment are from the special extraction from Eurostat on 10 June 2022. Data are extracted with the EU-LFS reliability rules. The extraction is based on the best sample available for a given year and the variables requested corresponds either to one single quarter (generally the second quarter), or to a sub-sample distributed along the year (sample size equivalent to one reference quarter). More information on the methodology of this survey are available at: https://ec.europa.eu/eurostat/cache/metadata/EN/employ_esms.htm.
Notes on specific countries
Table A6.1: Data refer to respondents who used the Internet over the last three months, but not necessarily at least once a week.
Table A6.7 (Web only): Changes in the survey methodology have led to a break in German data in 2020. Estimates for 2020 can therefore not be compared directly with those of previous years. In addition, data collection during 2020 was impacted by technical issues and COVID-19 measures. The German data published is therefore preliminary and may be revised in the future. More details are available at: https://ec.europa.eu/eurostat/documents/1978984/6037342/German+note+for+EU+LFS+data+2020.pdf/c223fa3c-1271-2977-6965-9654bea23f8f?t=1618238557179.
Table A6.1: data refer to 20-24 year-olds instead of 16-24 year-olds.
Table A6.7 (Web only): 2020 data refer to an average of four months (September - December 2020).
Table A6.7 (Web only): Data are subject to the application of small random perturbations. This can lead to loss of data consistency for these two countries, both as regards additivity for (sub-)totals and comparability with results published elsewhere (e.g. by Eurostat or national statistics offices).
Table A6.7 (Web only): Data are subject to the application of small random perturbations. This can lead to loss of data consistency for these two countries, both as regards additivity for (sub-)totals and comparability with results published elsewhere (e.g. by Eurostat or national statistics offices).
Source
Table A6.1. Internet use, by educational attainment and age group (2021)
EU Survey on ICT usage in households and by individuals (EU-ICT) for European OECD member countries;
National surveys for non-European countries: the Canadian Internet Use Survey (CIUS) for Canada; the Social Survey for Israel; and the American Community Survey (ACS) for the United States.
Table A6.2. Trends in the use of the Internet for different activities among 55-74 year-olds, by educational attainment (2019 to 2021)
EU Survey on ICT usage in households and by individuals (EU-ICT) for European OECD member countries;
National surveys for non-European countries: the CIUS for Canada; the Social Survey for Israel; and the Current Population Survey (CPS), Computer and Internet Use supplement for the United States.
Table A6.3. Students' social tolerance, by educational attainment of the mother (2018)
Variable shown in the first column on the share of foreign-born adults among all 25-64 year-olds. This share is calculated by the OECD Labour Market, Economic and Social Outcomes of Learning (LSO) Network.
Indices included in this table are based on the Programme for International Student Assessment (PISA) 2018, Global Competence Questionnaire.
Table A6.4 (Web only). Students’ interest in learning about other cultures, by mother’s educational attainment (2018)
Table A6.5 (Web only). Students’ attitudes towards immigrants, by mother's educational attainment (2018)
Table A6.6 (Web only). Students’ global mindedness, by mother's educational attainment (2018)
Table A6.7 (Web only). Percentage of adults working from home, by age group and educational attainment (2019 to 2021)
Methodology
Tables A7.1 and A7.2 include data from Labour Force Survey (LFS) for EU countries and these data were provided by Eurostat using the following variables
For European countries providing data from the EU-LFS there was a new LFS legislation in 2021 and Eurostat flag all 2021 LFS data with b, i.e. break in series, in particular for labour market outcomes indicators. For the education variables, the main change concerns the participation in non-formal education. Information on the impacts of the new methodology is not available by the time Education at a Glance 2022 was released. For general information and country specific notes on the changes, please see: https://ec.europa.eu/eurostat/statistics-explained/index.php?title=EU_labour_force_survey.
Note that the LFS users guides are available here: EU labour force survey - documentation - Statistics Explained (europa.eu).
Note that the reference period is the previous 4 weeks.
Participation in formal and/or non-formal education and training (up to 2020)
POP: All people in the target age group
EDUC4WN being derived from EDUCSTAT and COURATT:
if EDUCSTAT in ('1' ‘3’) or COURATT=’1’ then EDUC4WN='1'
else if EDUCSTAT='2' and COURATT='2' then EDUC4WN='0'
else if EDUCSTAT='9' and COURATT='9' then EDUC4WN='9'
else if EDUCSTAT=' ' or COURATT=' ' then EDUC4WN=' '
Participation in formal and/or non-formal education and training (from 2021)
POP: All people in the target age group
EDUC4WEEKS being derived from EDUCFED4 and EDUCNFE4:
if EDUCFED4='1' or EDUCNFE4 in ('1','2') then EDUC4WEEKS='1'
else if EDUCFED4='2' and EDUCNFE4='3' then EDUC4WEEKS='0'
else if EDUCFED4='9' and EDUCNFE4='9' then EDUC4WEEKS='9'
else if EDUCFED4=' ' or EDUCNFE4=' ' then EDUC4WEEKS=' '
Participation in non-formal education and training (from 2021)
POP_Target: EDUCNFE4 in (‘1’ ‘2’)
POP: All people in the target age group
Tables A7.1 and A7.2 include data from the Survey of Adult Skills (PIAAC) for some countries and these data were extracted based on variables FEFAET12, FAET12, NFE12, EDCAT3 and AGEG10LFS coded as follows
Note that the reference period is the previous 12 months.
The participation by educational attainment is using the variable EDCAT3 which is derived by the OECD with the following SAS syntax:
if B_Q01a<=.Z AND B_Q01a3<=.Z then EDCAT3=-4;
else if B_Q01a in (1,2,3,4) then EDCAT3=1;
else if B_Q01a<=10 then EDCAT3=2;
else if B_Q01a<=14 then EDCAT3=3;
else if B_Q01a=16 then EDCAT3=3;
else if B_Q01a=15 or B_Q01a<=.Z then do;
if B_Q01a3 in (1,2,3,4) then EDCAT3=1;
else if B_Q01a3>4 and B_Q01a3<=10 then EDCAT3=2;
else if B_Q01a3>=11 and B_Q01a3<=14 then EDCAT3=3;
else if B_Q01a3=16 then EDCAT3=3;
The participation by age group is using the variable AGEG10LFS which is derived by the OECD with the following SAS syntax:
if AGEG5LFS = 1 then AGEG10LFS = 1;
else if AGEG5LFS = 2 then AGEG10LFS = 1;
else if AGEG5LFS = 3 then AGEG10LFS = 2;
else if AGEG5LFS = 4 then AGEG10LFS = 2;
else if AGEG5LFS = 5 then AGEG10LFS = 3;
else if AGEG5LFS = 6 then AGEG10LFS = 3;
else if AGEG5LFS = 7 then AGEG10LFS = 4;
else if AGEG5LFS = 8 then AGEG10LFS = 4;
else if AGEG5LFS = 9 then AGEG10LFS = 5;
else if AGEG5LFS = 10 then AGEG10LFS = 5;
else if DISP_BQ >. Z and AGEG5LFS =. then AGEG10LFS =. N;
if AGEG5LFS =. S then AGEG10LFS =. N;
Information on derived variables can be consulted via the following link: http://www.oecd.org/skills/piaac/codebook%20for%20DVs%203_16%20March%202015.docx.
Tables A7.1 and A7.2 include data from the ABS survey of work-related training and adult learning survey for Australia and these data have the following characteristics.
The total includes persons whose level of educational attainment was not determined.
The level of educational attainment was determined by concording to ISCED from codes based on the Australian Standard Classification of Education (ASCED).
The proportions and standard errors are perturbed to protect small cell counts.
Note that the reference period is the previous 12 months.
Further detail on the scope and methodoloy of this survey is provided on the ABS website: https://www.abs.gov.au/methodologies/work-related-training-and-adult-learning-australia-methodology/2020-21.
Notes on specific countries
Table A7.1: data are comparable for the financial year of reference: 2021-2022. ABS survey of Work-Related Training and Adult Learning was first conducted in April 2013 as a supplement to the monthly LFS, and then from July 2020 to June 2021. The reference period of data on participation in formal and/or non-formal education and training is the 12 months prior to the survey.
Table A7.2: data are comparable for the financial year of reference 2021-2022, and for participation in non-formal education and training, by genre, age group and education attainment (data for below upper secondary and upper secondary are not available). ABS survey of Work-Related Training and Adult Learning was first conducted in April 2013 as a supplement to the monthly LFS, and then from July 2020 to June 2021. The reference period of data on participation in formal and/or non-formal education and training is the 4 weeks prior to the survey.
Table A7.1: data are comparable for the year of reference: 2010 to 2021. Continuous Employment Survey provides quarterly datasets and the reference period of data on participation in formal and/or non-formal education and training is the 4 weeks prior to the survey.
Table A7.2: data are comparable for the year of reference: 2010 to 2021. Continuous Employment Survey provides quarterly datasets and the reference period of data on participation in formal and/or non-formal education and training is the 4 weeks prior to the survey.
Table A7.1: data are comparable for the year of reference: 2019, 2020 and 2021. Labour Force Survey provides quarterly datasets and the reference period of data on participation in formal and/or non-formal education and training is the 4 weeks prior to the survey.
Table A7.2: data are comparable for the year of reference: 2021. Labour Force Survey provides quarterly datasets and the reference period of data on participation in formal and/or non-formal education and training is the 4 weeks prior to the survey.
Source
Table A7.1 Trends in participation in formal and/or non-formal education and training, by year and quarter (2019, 2020 and 2021)
The EU-LFS for European OECD countries; Survey of Adult Skills (PIAAC) for Canada, Chile, Israel, Japan, Korea, Mexico, New Zealand and the United States; and national data sources for Australia (ABS survey of Work-Related Training and Adult Learning), Costa Rica (Continuous Employment Survey), Colombia (Great Integrated Household Survey), the United Kingdom (Labour Force Survey) and the United States (Current Population Survey (CPS) March Annual Social and Economic Supplement).
Table A7.2 Participation in non-formal education and training, by gender, age group and educational attainment (2021)
The EU-LFS for European OECD countries; Survey of Adult Skills (PIAAC) for Canada, Chile, Israel, Japan, Korea, Mexico, New Zealand and the United States; and national data sources for Australia (ABS survey of Work-Related Training and Adult Learning), Costa Rica (Continuous Employment Survey), Colombia (Great Integrated Household Survey), the United Kingdom (Labour Force Survey) and the United States (Current Population Survey (CPS) March Annual Social and Economic Supplement).
Table A7.3 Enrolment rates in formal education, by level of education and age group (2020)
The UNESCO-UIS/OECD/EUROSTAT data collection on education statistics administered by the OECD in 2020 for all countries; all data refer to the academic year 2019/2020 (for details, see Annex 3 at https://doi.org/10.1787/f8d7880d-en).
Figure A7.2 Determinants of adult learning by job-related characteristics, personal characteristics and education
The Adult Education Survey (AES) for European OECD countries.
Figure A7.4. Indicator 4.4.1: Proportion of youth and adults with information and communications technology (ICT) skills, by type of skill
The World Telecommunication/ICT Indicators Database for all countries.
Figure A7.6 Jurisdictions providing grant support to students, by programme type and study intensity (2020)
The Higher Education Policy Survey (HEPS) for 27 OECD jurisdictions.