6.2. Employment dynamics
Between 2006 and 2016, total employment in the OECD area grew by 6.9% (a net gain of about 38 million jobs). Examining the contributions towards these net changes shows that the sectors with the highest digital intensity made a strong contribution to employment gains in many countries: around four of every ten additional jobs in the OECD area, and as many as eight-in-ten jobs created in the Slovak Republic. In contrast, the contribution from medium-high digital intensity sectors was much smaller, on average, across the OECD (3.7%), as relatively strong positive contributions in some countries such as Poland, Chile and Mexico were balanced by strong negative effects in Greece, Finland, Italy and others. In almost all countries where aggregate employment fell between 2006 and 2016, the greatest declines were in low digital intensity sectors, while medium-low digital intensity sectors also experienced a decline in employment. Overall, this suggests that the more digitally intensive sectors have contributed to employment growth more strongly than other sectors.
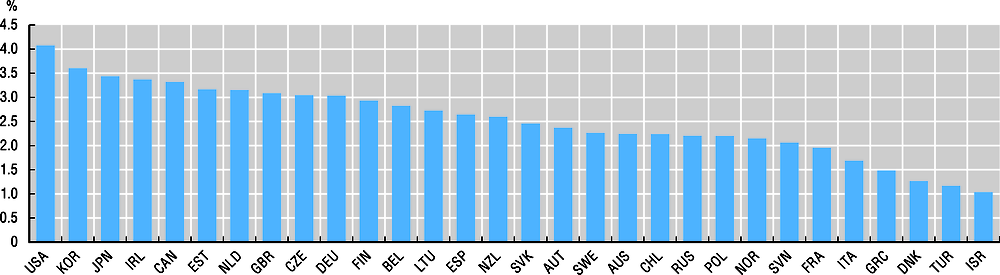
ICT skills are in high demand. All things being equal (including education and other workers’ skills), the higher the ICT task intensity of a job, the higher the hourly wage earned. However, estimates suggest that the pay-off for working in ICT task-intensive jobs varies widely across countries. In Korea and the United States, workers in jobs requiring a 10% higher intensity of ICT tasks than the country average earn hourly wages that are more than 3.5% higher. Conversely, workers in Israel and Turkey enjoy relatively lower returns on ICT task-intensive jobs (i.e. only about 1%). Returns on ICT task-intensive jobs depend on many factors including a country’s supply of and demand for ICT skills, and its wage structure (OECD, 2017; Grundke et al., 2018).
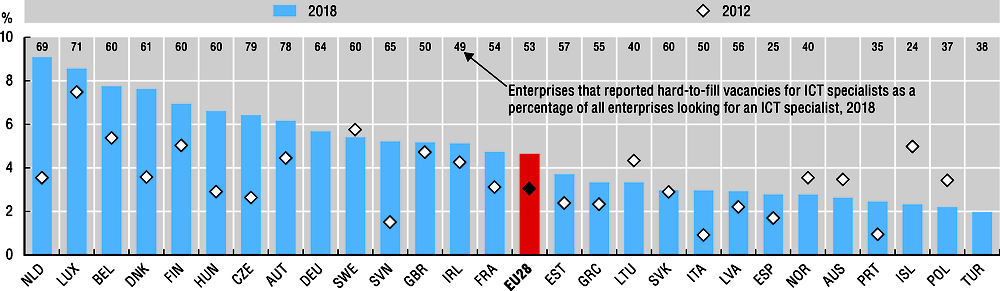
Recently, some have expressed concern over potential imbalance between the demand for and the supply of ICT specialists in the labour market (OECD, 2017b). According to data available for European countries, over half of firms trying to recruit ICT specialists reported difficulties in doing so. The number of ICT specialist vacancies in each responding business is not known. Nevertheless, this equates to a relatively small percentage of all enterprises reporting hard-to-fill vacancies for ICT specialists – about 5% in 2018. However, the share of businesses overall having difficulties with filling ICT specialist roles has increased nearly two percentage points, from 3% in 2012, on average. A majority of countries have seen the share of firms reporting recruitment difficulties increase, with especially large rises in Slovenia and Italy, where the rate of businesses with hard-to-fill ICT specialist vacancies tripled between 2012 and 2018. The Netherlands has the highest rate, at 9% in 2018, nearly three-times the 2012 figure. Meanwhile, markedly fewer businesses in Iceland and Poland reported hard-to-fill ICT specialist vacancies in 2018 compared to 2012.
Of the 38 million jobs added in the OECD area between 2006 and 2016, around four-in-ten were in highly digital-intensive sectors.
Definitions
Sectors were classified by digital intensity (high/medium-high/medium-low/low) using a number of dimensions (ICT investment and ICT intermediates, use of robots, online sales and ICT specialists) and then grouped by quartile (Calvino et al., 2018). Examples of high digital-intensity sectors include transport equipment, ICT services, finance and insurance, legal and accounting, R&D, advertising and marketing. Examples of medium-high digital-intensity sectors include ICT equipment and machinery, wholesale and retail, publishing, audiovisual and broadcasting (see page 2.9 for more information).
The ICT task-intensity of a job describes the frequency with which ICT tasks (ranging from simple use of the Internet, word processing or spreadsheet software, to use of programming language) are undertaken at work.
ICT specialists are defined in the European Community Survey on ICT Usage in Businesses as “employees for whom ICT is the main job, for example, to develop, operate or maintain ICT systems or applications”.
Measurability
Changes in employment levels in each country can be “normalised” to highlight the relative contributions of sectors of different digital-intensities to employment gains or losses. The aggregate increase or decrease in employment in sectors of each digital-intensity is expressed as a percentage of the total absolute change in employment in each country. Using a finer activity breakdown (e.g. ISIC Rev.4 two-digit Divisions) would produce different estimates for total gains and losses, though total net changes would remain the same.
The ICT task intensity of jobs is assessed using exploratory factor analysis of responses to 11 items on the OECD Programme for International Assessment of Adult Competencies (PIAAC) survey, which relates to the performance of ICT tasks at work. See Grundke et al., 2017 for the detailed methodology. Labour market returns on task intensities are based on OLS wage regressions (Mincer equations) using data from PIAAC. Estimates rely on the log of hourly wages as the dependent variable and on a number of individual-related control variables including age, years of education, gender and other skill measurements, as well as industry dummy variables as regressors (Grundke et al., 2018).

Source: OECD calculations based on STAN Database, http://oe.cd/stan, National Accounts Statistics, national sources and Inter-Country Input-Output Database, http://oe.cd/icio, December 2018. See 1. StatLink contains more data.
← 1. Digital intensity is defined according to the taxonomy described in Calvino et al. (2018).
For Brazil, China, Costa Rica, India, Indonesia and the Russian Federation, data refer to 2006-15
Low digital-intensive sectors are defined according to ISIC Rev.4: Agriculture, hunting, forestry and fishing (Divisions 01 to 03), Mining and quarrying (05 to 09), Food products, beverages and tobacco (10 to 12), Electricity, gas and water supply; sewerage, waste management and remediation activities (35 to 39), Construction (41 to 43), Transportation and storage (49 to 53), Accommodation and food service activities (55 to 56) and Real estate activities (68).
Medium-low digital-intensive sectors include: Textiles, wearing apparel, leather and related products (ISIC Rev.4 Divisions 13 to 15), Chemical, rubber, plastics, fuel products and other non-metallic mineral products (19 to 23), Basic metals and fabricated metal products, except machinery and equipment (24 to 25), Education (85) and Human health and social work activities (86 to 88).
Medium-high digital-intensive sectors include: Wood and paper products; printing (ISIC Rev.4 Divisions 16 to 18), Machinery and equipment (26 to 28), Furniture; other manufacturing; repair and installation of machinery and equipment (31 to 33), Wholesale and retail trade, repair of motor vehicles and motorcycles (45 to 47), Publishing, audiovisual and broadcasting activities (58 to 60), Public administration and defence; compulsory social security (84) and Arts, entertainment and recreation (90 to 93).
High digital-intensive sectors include: Transport equipment (ISIC Rev.4 Divisions 29 to 30), Telecommunications (61), IT and other information services (62 to 63), Financial and insurance activities (64 to 66), Professional, scientific and technical activities; administrative and support service activities (69 to 82) and Other service activities (94 to 96).
More digital-intensive sectors consists of high and medium-high digital-intensive sectors.
Source: OECD (2017a), calculations based on the Survey of Adult Skills (PIAAC) Database, June 2017. See 1.
← 1. The ICT task intensity of the jobs indicator relies on exploratory state-of-the-art factor analysis and captures the use of ICTs on the job. It relies on 11 items from the OECD Survey of Adult Skills (PIAAC) ranging from simple use of the Internet to the use of a word processor, spreadsheet software or a programming language. The detailed methodology can be found in Grundke et al. (2017).
Labour market returns to task intensities are based on OLS wage regressions (Mincer equations) using data from the OECD Survey of Adult Skills (PIAAC). Estimates rely on the log of hourly wages as a dependent variable and include a number of individual-related control variables (including age, years of education, gender and other skill measures detailed in Grundke et al., 2018), as well as industry dummy variables.
The data for the following 23 countries from the first round of PIAAC refer to the year 2012: Australia, Austria, Belgium (Flanders), Canada, Czech Republic, Denmark, Estonia, Finland, France, Germany, Ireland, Italy, Japan, Korea, the Netherlands, Norway, Poland, the Russian Federation (excluding Moscow), Slovak Republic, Spain, Sweden, the United Kingdom (England and Northern Ireland) and the United States. Data for the remaining countries refer to 2015 and are sourced from the second round of the first wave of the PIAAC survey.
For the Russian Federation, the PIAAC sample does not include the population of the Moscow municipal area. The data published, therefore, do not represent the entire resident population aged 16-65, but rather the population of the Russian Federation excluding the population residing in the Moscow municipal area.
Source: OECD, ICT Access and Usage by Businesses Database, http://oe.cd/bus, December 2018. See 1. StatLink contains more data.
← 1. For Australia, data refer to the fiscal year fiscal year 2015/16 ending on 30 June.
For Iceland, data relate to 2017 instead of 2018.
For Portugal, data relate to 2014 instead of 2012.