
2. Towards evidence-based audit selection in Brazil’s decentralised policy areas
This chapter begins with a look at the application of risk assessment in audit selection generally and the corresponding need for sound evidence. The focus then shifts to Brazil and education, describing the complexity of auditing in a decentralised policy area. The chapter points to the existing wealth of high-quality education data in Brazil, and shows how a logic model can be applied to the sector to select significant indicators and thereby identify potential problems in policy implementation. Risk scenarios are then described, as is their application in six-step process for risk-based audit selection. The chapter concludes by noting how IT can be a useful tool in supporting audit selection in Brazil.
The audit universe, i.e. the number of auditable entities and topics, for supreme audit institutions (SAIs) is extensive. It consists of many policy areas, all with different policy objectives, and a multitude of entities and procedures. In decentralised policies, the different multi-level governance aspects of the policy delivery, in some cases combined with a decentralised external audit system, increase the complexity, as discussed in Chapter 1.
INTOSAI-P - 20 - Principles of Transparency and Accountability – states that “SAIs shall adopt audit standards, processes and methods that are objective and transparent” (INTOSAI, 2019[1]). In addition to the audit work itself, this requirement can be extended to the audit selection phase. Where there is a collaborative selection of audits by multiple external audit bodies, a uniform risk-based approach is useful to install objectivity and – at the same time – simplify the complex environment in which selection takes place. A common approach also helps to develop a shared language that facilitates communication, transparency and learning among the different external auditors within the system.
Taking into account regional variations in socio-economic conditions and policy outcomes is supremely important in selecting audits in decentralised policy areas. When available, data and evidence at the local level can provide insights into differences among regions. As audit institutions, the Tribunais de Contas do Estado (state courts of accounts,TCEs) and Tribunais de Contas dos Municípios (municipal courts of accounts, TCMs ) in Brazil are in an excellent position to systematically collect and analyse evidence that will shed a light on disparities in regional policy performance, help to identify risks and ultimately lead to improved audit selection. For their work to be effective however, systematic and strategic collaboration between them and the Tribunal de Contas da União, (federal court of accounts, TCU) while selecting audits of decentralised policy areas is critical.
Risk assessment helps focus resources on key concerns
The audit selection process is a way to narrow down the possible audits in a structured way, in order to select audits within the existing capacity of the audit body that will have the highest impact. “Having impact” refers to whether the audits are likely to significantly improve the conduct of government operations and programmes, e.g. by lowering costs and simplifying administration, enhancing the quality and volume of services, or improving their effectiveness or the benefits to society (INTOSAI, 2016[2]).
Audit programmes can be implemented through a robust, risk-based process that considers issues of key concern to society, as well as their materiality (OECD, 2016[3]). International standards for selection of audits all, in one way or another, involve some type of risk- or problem assessment as (see Box 2.1).
Requirements for audit selection according to ISSAI 3000
“The auditor shall select audit topics through the SAI’s strategic planning process by analysing potential topics and conducting research to identify risks and problems” (ISSAI -3000/89).
“The auditor shall select topics that are significant and auditable, and consistent with the SAI mandate” (ISSAI -3000/90).
“The auditor shall conduct the process of selecting audit topics with the aim of maximising the expected impact of the audit while taking account of audit capacities” (ISSAI - 3000/91).
Guidance on audit selection, ISSAI - GUID - 3920: Assessing potential audit topics in terms of risks, materiality and problems identified
“The selection of audit topics can result from assessing risk, analysing problems and considering materiality. Risks are the likelihood and impact of an event with the potential to affect the achievement of an organisation’s objectives.”
Materiality relates not only to financial aspects, but also to social and/or political ones, such as the number of people affected by a law or reform, transparency, and good governance.
“In performance auditing, risks may involve areas of potentially poor performance that concern citizens or that will have a great impact on specific groups of citizens. An accumulation of such indicators or factors linked to an entity or a government programme may represent an important signal to the auditor, leading them to plan audits based on the risks or problems detected.”
Analysis of potential topics should consider maximising the expected impact of an audit.”
Source: (INTOSAI, 2019[4]; INTOSAI, 2016[2]).
Risk-based audit selection allows directing audit capacity and efforts to risk areas that are key among the many alternatives, thus optimising allocation of resources and addressing main issues. For audit bodies with limited resources, the risk-based approach is highly valuable for achieving the greatest impact. A risk map with identified risks and risk ratings can provide a good overview of the risks in the audit universe and thus facilitate the selection of audits (OECD, 2018[5]) (see Box 2.2 for further definition).
The concept of risk
Risk is an effect of uncertainty on objectives. An effect is a deviation from the expected. The deviation can be positive, negative or both, and can result in opportunities and threats.
A risk is formulated as an event that may happen (probability) and its consequences (impact).
Risk assessment
According to the ISO Risk Management Guidelines, risk assessment is a three-step process that starts with risk identification and is followed by risk analysis, which involves developing an understanding of each risk, the likelihood of these risks occurring, and the risk’s severity. The third step is risk evaluation, which includes prioritising each risk.
Risk assessment can be qualitative and descriptive, such as a report, or quantitative, such as data analysis with numerical values for likelihood and impact of risk. The way in which risks are assessed and the form of the output should be compatible with entity defined risk criteria. There are various risk analysis techniques that may be used, such as those outlined in IEC/ISO Risk management: Risk assessment techniques:
bow-tie analysis
hazard analysis and critical control points (for assessment of health safety risks)
strengths-Weaknesses-Opportunities-and-Threat analyses
failure modes and effects analysis (FMEA)
hazard and operability (HAZOP) studies that involve identifying potential deviations from the design intent (SWOT)
scenario analysis
structured what if technique (SWIFT)
layers of protection analysis (LOPA) analyses that assesses whether a risk is controlled to an acceptable level.
All of these risk assessment techniques involve the basic principles of risk identification, risk analysis and risk evaluation.
Source: (OECD, 2018[5]; ISO, 2018[6]; IEC/ISO, 2009[7]).
Sound risk assessment requires sound evidence
SAIs commonly apply some sort of risk or problem assessment to guide the audit selection process, drawing on their accumulated knowledge. The assessment is usually based on the auditor’s field knowledge and professional judgement. As a result, there will be certain subjective elements involved in selection (Put and Turksema, 2011[8]). Objectivity is one of the core ethical values of SAIs, and one of the main principles of professional auditing (INTOSAI, 2016[9]). SAIs should reduce the subjectivity of the audit selection process in order to select the topics that will maximise the audit’s impact for the citizens and maintain the trust of society.
SAIs can demonstrate accountability by explaining to stakeholders why the topics were selected. A risk identification process that is well documented and repeatable, with validated interpretation and not dependent on the individual auditor, is especially useful here. SAIs could also try to increase the objectivity of the risk analysis undertaken for audit selection by making their selection evidence-based. This can include the use of quantitative and qualitative information to ascertain which auditable programmes or entities pose the greatest risk to the achievement of objectives (see Box 2.3 for the Canadian approaches to audit selection).
The Office of the Auditor General (OAG) - the SAI in Canada - is responsible for auditing a vast range of activities conducted by the federal government and the three Canadian territories. These activities cover topics such as health, culture, the environment, finance, agriculture, transportation and scientific research.
To assist in determining areas to audit, the OAG conducts an analysis called “the strategic audit planning process”. There are three aspects to the process. One is to review entity performance reports and plans, risk analyses, sustainable development strategies, and key internal audit and programme evaluations, as well as parliamentary and other reports. A second one is to conduct interviews with entity management, key external stakeholders, non-governmental experts and entity officials to find out what they consider to be the areas of greatest risk. Finally, the OAG takes a strategic and risk-based approach to selecting performance audit topics.
Strategic audit plans, including the proposed audit topics, are discussed with the Auditor General and the Performance Audit Practice Oversight Committee, the body ultimately responsible for approving a two-year performance audit schedule. The plan is re-evaluated each year to ensure that the right audits are planned.
The information usually required to either validate a strategic audit plan or identify new risks and areas for audit can include, as necessary:
review of media reports
discussions with internal specialists
review of internal audit reports
meetings with chief audit executives
interviews with departmental audit committee members
review of entity tracking systems to assess the extent to which current and outstanding audit recommendations and entity commitments have been implemented
review of parliamentary committee minutes and reports
review of relevant audit reports of other jurisdictions (nationally and internationally)
attendance at relevant conferences
site visits.
Source: (Office of the Auditor General of Canada, 2019[10]).
Guidance can be taken from ISSAI GUID 3920, which states that “In performance auditing, risks may involve areas of potential poor performance that concerns citizens or have a great impact on specific groups of citizens”. By considering areas that could well perform poorly, the scope of the risks is substantially reduced and the targeting of high-risk areas to audit becomes manageable. Data that may provide evidence for identification of these performance risks are very often collected by the government and available as indicators to be used for monitoring progress towards policy objectives. The evidence-based audit selection process would ultimately produce a consolidated and objective picture of the main outcome risks for decentralised policies, guiding the external auditors in selecting and aligning audits.
Risk-based audit selection in Brazil is an evolving practice
The OECD surveyed the courts of accounts in Brazil to find out how they select audits and received 28 responses. The most common inputs used by the courts of accounts (Tribunais de Contas, TCs) for informing their audit selection process are laws and regulations that specify what TCs should audit and the frequency of those audits. The second most common factor considered is the internal budget and resources of auditees, which reflect a risk-based audit selection process focused on inputs rather than on outputs or outcomes. For instance, some TCs consider information on the percentage of an auditee’s expenditure in relation to the municipality or state’s budget, or in relation to the greatest expenditure of the municipality or state as “indicators of materiality.” Only 10 –- of the 28 –- TCs reported using audit reports or findings from other TCs to inform audit selection, indicating a limited level of collaboration or sharing of insights among TCs when selecting audits.
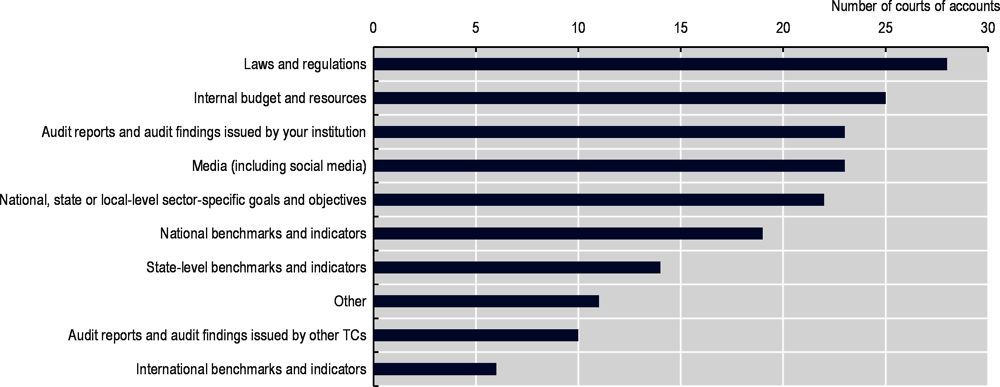
Note: N=28. More than one choice allowed per respondent; in this question, “audit programming” is referring to the audit selection process as opposed to planning of individual audits.
Source: OECD Survey (2020).
A number of TCs apply external indicators across the audit cycle (including for the audit selection), such as the Municipal Management Effectiveness Index (Índice de Efetividade da Gestão Municipal), the Human Development Index and demographic information. Some also consider information such as the number of irregularities found in previous audit reports, and assessment of the internal control of the auditees.
The majority of TCs in Brazil have a written policy for prioritising and selecting audits based on the assessment of risks (see Figure 2.2), but some TCs do not apply the policy regularly. According to officials from the TCs, some of the factors preventing them from regular application of the policy include:
institutional and internal obstacles (e.g. internal organisation that prevents joint application of the policy at the state and municipal levels, lack of a risk assessment system, limited resources)
external pressure (e.g. media, population, legislature, other control bodies) that may prevail over the policy
issues related to the policy itself (e.g. outdated policy, its limited applicability, quality of the policy).
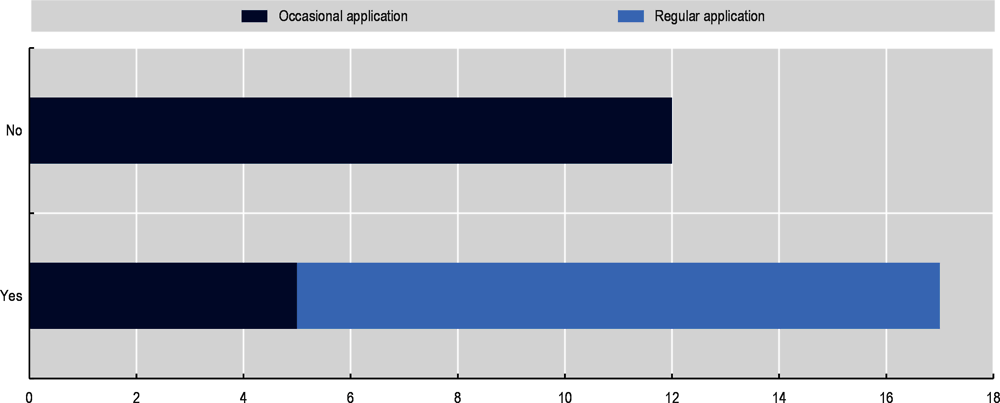
Note: N=29.
Source: OECD Survey (2020).
Some TCs also maintain a risk registry for tracking the risks related to auditees or other policy-related risks in specific sectors. For example, TCE-Rio Grande do Norte uses software developed by the Ministry of Planning to support the monitoring of risks: the Ágatha System –- Integrity, Risk and Controls Management System. Auditees’ internal control units are responsible for updating this tool with information about auditees, and the TC uses system-generated reports for audit programming.
Approaches of the TCs towards the application of risk analysis in audit selection vary considerably. The use of indicators is not universal among TCs. Some apply advanced methods, such as analysis of budget data as described above, and others do not make any use of indicators. Co-ordination and collaboration in audit selection occurs on an ad-hoc basis, if at all, and are only the practice of those TCs that have the capacity for it. Developing a common and shared approach to risk-based audit selection provides an opportunity for TCs, particularly those with little or no experience with co-ordination or risk assessments, to modernise their practices towards greater alignment with international standards. A harmonised risk-based approach to audit selection, based on improved exchange of insights and evidence, can lead to more coherent and outcome-driven auditing of decentralised policies. Each policy area has its own context and set of challenges. To narrow the scope, TCs decided to pilot new approaches for risk-based audit selection and co-ordination in the field of education.
Education is a critical policy field and an area in which policy making and implementation are decentralised – to some extent at least – in nearly all OECD and partner countries. Accessible, high-quality education prepares citizens for life in increasingly knowledge-intensive societies and, in so doing, supports equal opportunity and social equity (OECD, 2018[11]). In many countries, responsibility for education is shared between central, state or regional governments – which typically play a role in formulating educational policies, co-ordination and funding – and municipal authorities and individual schools – which organise and deliver educational services on the ground to citizens.
Education is one of the most important areas of decentralised policy in Brazil. Successive Brazilian governments have adopted ambitious national strategies - and committed substantial public resources - to improve the accessibility and quality of education across the country. Over the past decade, total public spending on education, from primary to the post-secondary, non-tertiary level, has risen to 4% of gross domestic product (GDP) (OECD, 2019[12]). Brazil is thus one of the OECD member and partner countries that spends the most on education as a proportion of national wealth1, although the country’s comparatively low GDP per capita and young population mean that this translates into comparatively low spending per student. Spending on education accounts for over 10% of total public expenditure in Brazil (OECD, 2019[12]) and over 20% of spending by sub-national governments (OECD/UCLG, 2019[13]). The federal government’s strategic focus on education is reflected in the National Education Plan (Plano Nacional de Educação - PNE), adopted in 2014, which sets specific educational goals for the period up to 2024 (Government of Brazil, 2014[14]).
The need for attentive evaluations of policy and practice in education is all the more pressing given the considerable challenges Brazil continues to face in this field. The country has made great progress over the past decade in increasing access to education for its citizens. For example, the proportion of 3-5 year-olds enrolled in early childhood education and care increased from 60% in 2012 to 84% in 2017 and is now close to the OECD average of 87% (OECD, 2019[12]). Enrolment rates in upper secondary education have also increased notably. However, major concerns persist about the ability of the public school system to deliver high quality education consistently across the country. Teacher salaries remain low in comparison to the earnings of other tertiary graduates, making it harder to attract talented individuals to the profession (OECD, 2019[12]). Moreover, 15-year old students in Brazil continued to score well below the OECD average in reading, mathematics and science in the latest (2018) results of the OECD Programme for International Student Assessment (PISA). Only 2% of students performed at the highest levels of proficiency (level 5 or 6) in at least one subject (OECD average: 16%), and 43% of students scored below the minimum level of proficiency (level 2) in all three subjects (OECD average: 13%) (OECD, 2019[15]).
At the same time, provision and oversight of public crèches and basic education2 are a shared responsibility within the country’s federal system of multi-level governance. While responsibility for providing strategic direction and a proportion3 of public funding lies with the federal government, constitutional responsibility for providing early child education and care (ECEC), primary and secondary education rests primarily with the states and municipalities. Moreover, states and municipalities may establish their own goals and political strategies for education. However, Brazil lacks external school inspectorates for basic education of the type seen in many OECD countries. This oversight gap highlights the critical role that TCs play, and can improve, to assess the country’s progress towards national policy goals in education.
Education is a complex policy field for TCs to monitor and audit
Whereas conducting performance audits to assess outputs and policy outcomes is a challenge regardless of the sector, the challenge is all the greater with education. The multiplicity and diversity of actors involved in governing and providing educational services to citizens in Brazil exacerbates this challenge for TCs. As shown in Table 2.1, the 5 570 municipalities in Brazil are responsible for providing crèche services, pre-school and primary education (initial years of fundamental education) to a majority of children enrolled in these levels of education. Moreover, municipalities vary greatly in size, internal organisation, resources and administrative capacity. In lower secondary education (final years of fundamental education), enrolment in public schools is distributed equally between municipal and state school networks, which operate with limited co-ordination between them – adding another dimension of complexity.
In this landscape, responsibility for auditing the use of public resources in education – and for assessing the degree to which policy objectives are being achieved – is shared between TCU and both state and municipal courts of accounts in each federal entity. The extent to which the different TCs actively conduct audits in the field of education depends, in part, on their internal priorities and capacities in the field. The multiplicity of actors involved in decision-making, policy delivery and oversight can complicate the identification of risks and their root causes.
In health policy measuring the outcomes of patients is largely uncontested, and many aspects of medical practice have internationally recognised standards of best practice. The same cannot be said of measuring the learning outcomes of students. There is no rigid set of practice standards for teaching and learning. For this reason, many models of quality assurance in education rely primarily on qualitative assessments of school activities and performance. Nonetheless, policy makers in Brazil and indeed worldwide routinely use a range of quantitative indicators to assess the performance of the school systems for which they are responsible.
Brazil has high-quality data on education
Brazil has a well-established national system for collecting harmonised data about key aspects of the education system. The Anísio Teixeira National Institute for Educational Studies and Research (Instituto Nacional de Estudos e Pesquisas Educacionais Anísio Teixeira, INEP), an agency under the responsibility of the federal Ministry of Education (MEC), collects data on student enrolment, teaching staff and other variables for individual schools in its “School Census” (censo escolar) (INEP, 2019[17]). Data are published for municipal and state school networks for each municipality, while microdata exist for every public school.
Moreover, Brazil has a highly developed system for assessing the learning outcomes of school students through the Evaluation System for Basic Education (Sistema de Avaliação da Educação Básica, -SAEB), also co-ordinated by INEP. As part of SAEB, INEP designs and oversees the implementation of standardised national tests of students at three points in their educational pathway: in the last years of primary, lower secondary and upper secondary education4. The SAEB assessments (known as Prova Brasil) at each level assess students’ competence in Portuguese and mathematics. Alongside the results of the learning outcomes tests that students take, the SAEB assessments also generate contextual information about students and schools, gathered through student and school questionnaires administered at the same time as the tests themselves. The data for SAEB results are published for each municipality and microdata are used by INEP and external researchers to analyse educational outcomes.
Largely because of its role as a statistical and evaluation agency for education, INEP has also been tasked with developing indicators to monitor progress towards achievement of the goals in the country’s National Education Plan (PNE) and with conducting regular progress monitoring exercises (INEP, 2018[18]). The indicators used by INEP to monitor the PNE are the most complete set of national indicators of educational performance in Brazil.
TCs can use these data to build a methodology for shared risk-based audit selection
This wealth of statistical data on education in Brazil provides a strong basis to gain a broad overview of the characteristics and certain aspects of basic education performance in Brazil. Existing national data on the education system could be exploited to identify strengths and weakness in the performance of education policy in Brazil and to inform the planning, selection and implementation of audits in the field. At present, however, available data are not systematically used for this purpose in the country’s external audit community.
As recommended in Chapter 1, TCs are in a position to leverage the audit capacity of each external audit body individually and collectively by sharing insights and analysing indicators to take a more strategic and systematic approach to audit selection. To do this, TCs can develop a common risk assessment methodology that is structured around the rich data sources in Brazil and a logic model that accounts for policy outcomes, as described below. This assessment can help TCs develop a harmonised language and map risks related to shared policy goals and national priorities in the field of education (i.e. the PNE), while accounting for each entity’s unique context and mandate. As the process develops, TCs could also consider applying the methodology to other sectors and policy issues with similar challenges for auditing in a decentralised context, such as health and infrastructure.
As discussed in the previous section, a pre-requisite for making better use of existing data to identify potential problems in policy implementation is to understand the significance of individual indicators within a broader conceptual understanding of the educational process. This broader understanding can be supported by a logic model for education that draws the relationships between inputs, processes, outputs and outcomes.
In policy design and evaluation, a logic model is a theory of how a particular policy intervention works to produce its outcomes. Logic models are used in policy planning and design to identify relevant interventions and assess their likely effectiveness, and in policy monitoring and evaluation as tools to help understand why policies achieve or fail to achieve their intended outcomes.
The three E’s of economy, effectiveness and efficiency are central to performance audit. Use of a logic model can help the audit team focus the audit towards one or more of the three E’s. The model helps to identify and set out the relationship between the needs to be addressed by the policy intervention and its objectives, inputs, processes, outputs, and outcomes, which include results and impacts (INTOSAI, 2016[19]) (European Court of Auditors, 2017[20]).
A tool for understanding policies
There are many different ways to structure logic models, but – as illustrated in Figure 2.3 – most seek to map and explain the linkages among the following key elements, all of which can in theory be linked to indicators:
The inputs to the policy, programme or project. This generally includes financial, human and physical (buildings, equipment etc.) resources allocated for implementation of the policy in question, although some approaches to logic models include a wide range of contextual factors relating to the environment, in which policy is implemented under the heading of “inputs”.
The processes or activities undertaken to deliver or implement the policy, programme or project.
The outputs from the processes and activities undertaken (for example, length of highway built, volume of wastewater treated, number of patients receiving medical assistance, number of children graduating from school).
The outcomes that the policy, programme or project seeks to achieve (for example, improved accessibility of particular regions; cleaner rivers; a healthier population; or a skilled and societally engaged population). The intended outcomes of a given policy, programme or project can be formulated as policy objectives. Policy evaluations generally seek to compare intended outcomes (objectives) with outcomes observed on the ground.

Logic models are a valuable tool for conceptualising and understanding the likely causal relationships between the way policies are designed and their outcomes, and they support results- or outcomes-based policymaking. However, they have their limitations. First, there is a risk of over-simplification, as logic models create a linear picture of cause and effect between an intervention and outcomes, when in fact a wide range of predictable and unpredictable exogenous factors may influence the outcomes achieved in practice. Moreover, lines of causality between action and outcome are often complex and impossible to predict or prove with absolute certainty. Equally, it is not always easy to incorporate contextual factors – such as the economic, social, cultural or geographical context in which a policy is implemented – into the logic model in a satisfactory manner. This is sometimes addressed by incorporating “context” as a specific element in models (ETS/OECD, 2019[21]; Onderwijsinspectie, 2019[22]). Finally, there may be a lack of conceptual clarity and consensus about how to classify variables in logic models. For example, it is not always clear how the beneficiaries of public services or targeted policy interventions (users, students, patients, etc.) should be treated in models that map the inputs, processes and outputs of policies. A patient can conceptually be seen as an “input” into the health system (while treated patients are outputs), but individuals are clearly a different kind of “input” from the financial and human resources used to run the health system, which are also inputs. These kinds of issues need to be carefully explained when applying logic models.
A logic model of education
The OECD developed a basic logic model for the educational activities that education policy seeks to steer. The objective is to identify the key elements (inputs, processes, outputs and outcomes) in the educational process and illustrate basic assumptions about the relationships among these elements, based on a broad review of educational theory and relevant research literature.

The logic model shown in Figure 2.4 can, in principle, be applied to any level of basic education. It takes an outcome-oriented approach and assumes that the ultimate objective of education is to equip the target population of students with a satisfactory level of knowledge, skills and attitudes (learning outcomes). Outputs are implicit in the outcomes in the logic model. The inputs and processes lead to students having received an education (output), through which they have acquired knowledge and skills (learning outcomes) that are relevant in everyday/working life (outcome). This approach is consistent with a student-centred approach to education policy and practice, as used in international learning assessments such as PISA (ETS/OECD, 2019[21]) and in national educational assessment systems, including the system in Brazil (INEP, 2019[23]). These assessment systems seek to measure students’ learning outcomes in an objective manner. Although assessment of young children in pre-primary and primary education is theoretically possible, such assessments at a young age are rare in OECD countries. As a result, more indirect measures of “outcomes” need to be used to gauge the effectiveness of educational policies at this level.
For early childhood education and care and basic education, the “target population” of students encompasses all children in the relevant age cohorts in the jurisdiction in question. The intended outcome of education policy for these levels of education is thus for all children to acquire a satisfactory level of learning outcomes. Access to primary and lower secondary education has been universal in most OECD countries for many decades, although international assessments such as PISA show considerable variation in the learning outcomes students achieve. Governments in many OECD countries have also aimed to “universalise” early childhood education and care and upper secondary education, although participation rates continue to vary among OECD member and partner countries. Measurement of educational outcomes at different levels of education and in different jurisdictions must take into account the proportion of the targeted population that is actually reached by the education system (the “coverage” of the system). Information on education “output”, such as enrolment and completion rates for target age cohorts, must be considered alongside any available measures of student learning outcomes.
The logic model assumes that the outcomes achieved by the education system (in terms of both coverage and learning) are achieved through the interaction between students and teachers in the school environment. Schools (and notably their teachers) and students lie at the heart of the educational process. A wide range of contextual factors influences the characteristics and behaviour of all three groups. These factors are shaped by a combination of inputs (e.g. student characteristics, teachers and their characteristics or school infrastructure) and school-level processes (e.g. curriculum and related teaching methods, support services and guidance).
The ability of students to acquire intended learning outcomes is affected in particular by the students’ own background and abilities and by the capacity of their teachers to support their learning effectively. The home background of students has been widely shown to have a major influence on their initial cognitive and socio-emotional development (OECD, 2015[24]) and their subsequent performance at school. The initial and ongoing training teachers receive, alongside their own aptitude for the job, plays a critical role in their ability to support the learning of students from different backgrounds (OECD, 2018[25]).
The wider environment in which the teaching-learning process occurs further conditions teachers’ ability to work effectively and students’ ability to learn and develop. Within individual schools, this environment includes the quality and relevance of the educational content (curriculum) specified for students at different levels, the effectiveness of school leadership and the quality of the physical infrastructure and resources available for teaching and related activities. Ancillary services not directly related to the educational process, such as social services and support and school transport, also impact on students and their ability to learn.
Many of the inputs and processes surrounding schools and students identified in the logic model require financial resources. Teachers need salaries, school infrastructure and equipment need to be paid for, funds are required for teacher training, for financial support programmes for students and their families and for support and guidance services. When these financial resources come from public sources, they need to be mobilised and allocated through political decisions and policy design. As illustrated in Figure 2.4, governance and policy affect education not only by providing resources through direct financial transfers and public funding programmes, but also through regulation, guidelines and target-setting, all of which influence the behaviour of schools (and, to some extent, students). For TCs, key elements when analysing the policy and governance environment for education include:
1. Governance arrangements: the overall governance architecture, including the entities responsible for designing and implementing education policy and the distribution of responsibilities among them. This dimension encompasses the degree of centralised control or school-level autonomy within a system.
2. Education policy and programmes: the formulation and implementation of specific policies that guide and affect the way schools do their work, which may include policies on teacher training, school staffing, curriculum guidelines, admissions rules for students, and external tests and examinations, as well as policies that determine the level of resources schools (and teachers) receive. Some ancillary services, such as school transport, may fall under the category of education policy and programmes.
3. Other relevant policies and programmes: the formulation and implementation of policies and programmes not directly related to provision of education, but which directly support the goals of the education system.
4. Targets, evaluation and monitoring: the goal-setting and broader set of evaluation and monitoring exercises – including reviews by audit bodies – that inform the formulation and implementation of education and other relevant policies and programmes. It is helpful to single out these activities when analysing governance and policy as they typically occur at arm’s length from detailed policy formulation and implementation – either at the strategic political level (as in goal setting) or through independent or semi-independent bodies (as in monitoring and evaluation).
Applying the logic model to education in Brazil
The logic model for education discussed above is designed to be sufficiently generic to allow application to any level of basic education in any jurisdiction. However, when the model is applied in Brazil to map the relationship between the policy and governance context, financial inputs, the characteristics of schools and students, and outcomes, the following considerations are particularly important:
1. Some of the elements mapped in the generic model will be more important in some countries than in others. For example, enrolment and completion rates in upper secondary education will be more of a concern in Brazil where access to this level of education is not yet universal than in countries where universal access and participation is taken for granted.
2. The role of social programmes in promoting school attendance, or organised school transport, will be more important in Brazil, where demonstrable low family income and limited transport options are frequent barriers to school attendance. For example, the Bolsa Família programme, which makes social welfare payments conditional on children attending school, has been instrumental in increasing enrolment rates in education – a precondition for achieving good learning outcomes. Similarly, providing school transport for students in rural and remote regions to increase school attendance has been a policy priority for federal government.
3. As discussed further below, the availability of relevant information and data relating to the different components in the logic model will affect the extent to which the model can be applied in practice. While the model describes which elements would be helpful for analysing education policy, some of these elements are difficult to measure - and even those that are measurable may not be measured at all. Particularly in Brazil, with significant social and regional variation in income levels and educational outcomes, information and data disaggregated by locality and social group are important for gaining a nuanced picture of education policy performance in different parts of the country and for different populations when applying the model.
As mentioned, Brazil has a well-developed national system of learning outcomes assessment in the school sector - the Evaluation System for Basic Education (SAEB) (INEP, 2019[23]) – which means comparable data are available on key outcomes achieved by public schools and school networks across the country. This greatly facilitates the practical application of the logic model. In contrast, data on other factors, some of which may be relevant in Brazil, such as enrolment rates for specific age cohorts and access to school transport services, are not readily available.
Well-designed indicators, underpinned by updated and reliable data, are a valuable means to obtain objective information about the implementation and effects of public policies, including progress made towards policy objectives. Good indicators can provide an easily comprehensible, evidence-based overview of key aspects of policy and the environment in which the policy operates; in making it possible to identify relevant patterns and trends, they provide a sound basis for informed decisions.
Indicators are usually quantitative measures, expressed numerically – for instance the number of X, the percentage of Y. Indicators can be based on quantitative or qualitative information. The number of schools for instance is a basic indicator using simple quantitative information.
More complex indicators can also be based on qualitative information. For these indicators the qualitative information is expressed as a categorical value – that is one of a number of fixed possible values, usually on a scale. For instance, the number or percentage of schools rated “excellent” by a school inspectorate is based on complex qualitative information, reduced to a scale of school ratings.
As illustrated in Figure 2.5, indicators can refer to input, output and outcome of a policy and thus mirror the basic logic model that is behind the policy design. This makes them extremely useful for policy monitoring and in auditing policy performance.
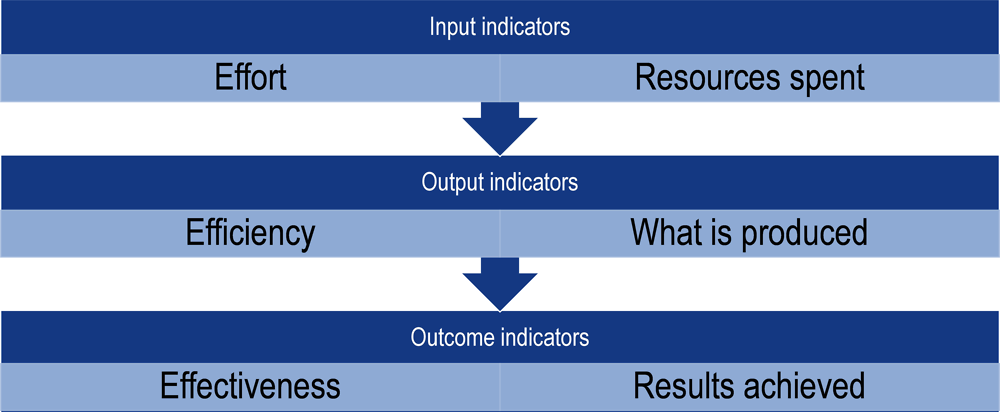
Input indicators are used to measure the amount of resources allocated to a policy; as such they provide a measure of the effort devoted to a policy or the intensity with which it is pursued. They do not provide information on whether the resources are spent efficiently, or whether a policy is effective in achieving an objective.
Output indicators provide a quantitative measure of the results that are produced by a policy. Combined with input indicators, they can be used to judge how efficiently policies are executed, but they do not provide any information on whether the outputs of a policy are effective in achieving the ultimate objectives of the policy in question – the desired outcomes.
Outcome indicators are used to monitor the effectiveness of policies in achieving their objectives. The intervention logic for a given policy – summarised in a logic model - should map the expected relationship between the outputs produced directly by the policy (such as the number of kilometres of motorway built or the number of teachers trained) and the desired outcomes of the policy (such as improved connectivity or enhanced student learning outcomes). Outcomes cannot be changed directly: policies must produce outputs, which, in turn, influence the outcome in the desired way. An outcome indicator always has a normative component in the sense that (within a reasonable range) a movement in one direction is considered a positive development and in the other a negative development.
One element in the simple logic model from the previous section, the process, is predominantly qualitative, and therefore more complicated to include in a quantitative indicator system. For simplicity’s sake, it would be best for process indicators to be either input or output for the specific process considered, depending on quantitative data available for specific processes.
Source: (Schumann, 2016[26]).
Quantitative indicators allow quantifiable aspects of inputs, processes, outputs and outcomes to be judged in relation to established targets or benchmarks. In the field of education, for instance, the scores of students in learning outcome assessments (an outcome indicator) can be compared with expected levels or median scores. Similarly, staff-to-student ratios in one school, a school network or a municipality (an input indicator) can be compared with targets or median values.
Two of the most common objectives of indicator systems in public policy are benchmarking government performance (against established targets or comparators) and measuring the efficiency of spending (the results achieved for the resources invested). These two objectives are well suited to the objective of audit and audit selection. In all cases, the reliability and usefulness of indicator systems will hinge on the judicious selection and definition of the indicators themselves and on the quality of available data.
Key considerations for selecting indicators
The logic model serves as a tool for TCs to conceptualise the main variables that interact to influence the outcomes of a particular policy. This model then provides a basis on which TCs can identify the most relevant indicators for policy monitoring and audit selection in the Brazilian context. Once the conceptual model is in place, the next step is to identify which of the variables in the model can be measured reliably using indicators, taking into account evidence about the strengths and limitations of these indicators.
Annex 2.A of this chapter contains an analysis of the theoretical relevance of each variable in the logic model for the education sector presented above, as well as a short assessment of the main strengths and weaknesses of the indicators commonly used in OECD countries and beyond to capture and measure the variables in question. Based on a list of potential indicators, TCs should narrow down the set of usable indicators to avoid creating a process that becomes burdensome in attempting to measure too much.
When selecting indicators that can be used for policy monitoring and selection of audits, these key criteria can be considered (Schumann, 2016[26]):
1. Relevance: do the available data (and indicators that define them) provide information that helps to measure the performance of policy systems and identify policy problems?
2. Availability and timeliness: are data available for relevant units of analysis (for example, in education, school networks, municipalities, states) for the whole country (or a large part of it)? How frequently are the data collected and updated? Does this frequency fit the purpose?
3. Reliability: are the available data from a reliable source that uses robust methods of data collection and management?
In addition to these, there are other factors that TCs can take into account when defining indicators. Some issues are common regardless of context and are typical of indicator-based assessments. For instance, in general, data on outputs are more likely to be available than data on outcomes. Monitoring basic compliance can be done with output indicators (e.g. “Was the number of schools built in accordance with the agreed plans?”), whereas monitoring performance or effectiveness requires outcome indicators, even if they are imperfect (e.g. ”What proportion of students would not have graduated from high school if the new schools had not been built?”).
When it comes to audit selection of decentralised policies, TCs should also take into account indicators that represent the experience of both national and subnational levels. Depending on existing conditions, the same policies can cause different outcomes in different regions, and in these cases national indicators may be of limited value. The choice of the sub-national level should be determined by the degree of regional variation in the effects of a policy. If for instance there are big differences in outcomes between municipalities or even school networks, an indicator showing this level of data should be considered above a national indicator. Alternatively, if the local variation is small, a national indicator may suffice, but won’t have much added value as an instrument to evaluate regional variation in outcome. Co-ordination gaps that occur on sub-national levels – a weakness of multi-level governance common in Brazil and elsewhere – could be captured by outcome indicators that measure objectives at intermediate levels rather than at local or national levels.
TCs may also consider scoreboard indicators to monitor outcomes on sub-national levels, while exercising care not to generalise results. Scoreboard indicators are the highest level of outcome indicators, primarily used to give a general overview of an entire policy area. The smaller the sub-national unit to which an indicator refers – for instance an indicator on school level – the more strong it is affected by random fluctuations. Every sub-national unit should be large enough to be representative of the entire country with respect to the outcome in question. (Schumann, 2016[26])
Finally, when interpreting quantitative information in any policy field, two factors are vital for TCs to consider:
1. Many important things cannot be – or are not – measured. By definition, quantitative indicators cannot capture variables and factors that cannot be quantified – or for which quantitative data are not collected and computed because it would be too burdensome or methodologically complex to do so.
2. Examination of quantitative data alone will not explain why observed values are as they are. Although regression analysis and other statistical techniques can be used to identify relationships between the values of different variables and points to lines of causality, policy evaluation and performance audit always need to complement analysis of quantitative indicators with qualitative investigation of explanatory factors on the ground.
A two tiered approach of selecting indicators for audit-programming in Brazil
The logic model and considerations for indicator selection described above provide a road map for TCs to select education indicators for audit programming. There are essentially two tiers of indicators that the TCs can consider. The first are indicators that measure the desired outcomes for different levels of education. These indicators can be taken from the nationally adopted education policy (PNE); they include “coverage” (the proportion of the target population in education) and learning outcomes (the skills and competencies acquired).
Key first-tier indicators include enrolment rates by age cohorts and, for educational levels where these exist, data on students learning outcomes obtained from the country’s system of national standardised assessments (the aforementioned SAEB). Examining data for these indicators in conjunction with established benchmark values makes it possible to identify schools, school networks, municipalities or groups of municipalities in each state where outcomes fall below expected standards. Given the broad range of educational performance that exists in Brazil, the benchmarks used may need to be adapted to the circumstances of each state.
Second-tier indicators represent data on selected inputs and processes that are likely to affect the observed outcomes. TCs can use these indicators to identify patterns that may help to explain poor observed outcomes and potentially identify more specific issues that could warrant audit. If, for example, data on the qualification level of teachers in a particular state are lower than in other states in Brazil – and learning outcomes are also poorer than relevant benchmarks – there may be a prima facie case to examine that state’s system of initial teacher training or continuous education for teachers. If the level of teacher qualifications is low and combined with poor learning outcomes only in selected municipalities, it may be worthwhile to investigate why this is the case and whether it is linked to recruitment practices or staff conditions in the school networks concerned.
To ensure national coverage, comparability and reliability, TCs can select indicators from official national data sources, including the national education evaluation agency INEP and the national statistical office (IGBE). In collaboration with the TCs, the OECD has developed an initial indicator panel that includes the following:
For learning outcomes – Disaggregated data from SAEB on learning outcomes in Portuguese and mathematics are available for students for years 5 and 9 and the final year of upper secondary education.
For coverage – Data on the number and basic characteristics of children and students enrolled in education from the INEP School Census are combined with estimated populations by age cohort. It is necessary to use population estimates based on an established projection methodology as Brazil lacks reliable population registers and instead relies on decennial censuses, which rapidly become outdated.
For selected inputs and processes – Basic data on municipal and state school networks; on numbers of classes; and on the number, age, qualification level and contractual state of teachers are taken from the INEP’s School Census. Some more qualitative data on the perceptions of school leaders, teachers and students are collected through the questionnaires that are completed at the same time as the SAEB tests, while limited data on financial inputs at school and school network level are obtained from SIOPE (Sistema de Informações sobre Orçamentos Públicos em Educação) and the Ministry of Education’s FNDE (Fundo Nacional de Desenvolvimento da Educação).
These indicators are not static. As policy objectives, challenges and data availability or quality change, so to do the opportunities, limitations or rationale for using a specific set of indicators. Those indicators offer a starting point for TCs to ground future analysis and risk assessments in the logic model and criteria discussed above.
The objective of using indicators in the process of audit selection is to identify, in a systematic way, where policies are not achieving objectives and may thus warrant investigation, particularly through performance auditing. The interpretation of indicators ideally should allow auditors to formulate a coherent explanatory narrative on which they can base the selection of audits. The ideal narrative would explain which events or circumstances, as flagged by the indicator model, could lead to poor performance on key outcome indicators. Such narratives can be captured in “risk scenarios,” as described in Box 2.6. Developing these scenarios involves concrete steps, described in the next section, that will ultimately help TCs prioritise and select audit subjects.
What is a risk scenario?
Risk scenarios are hypothetical narratives of possible events, how they may materialise and lead to unwanted outcomes. These narratives are realistic descriptions of the unfolding of an event and are grounded in validated knowledge and past experience. The risk assessment itself looks at the actual risk of the event in terms of likelihood and impact. Risk scenarios are commonly used for assessing safety and security risks, as described below.
Example of using risk scenario analysis in Dutch national safety policy
The National Safety and Security Strategy in the Netherlands is based on the elaboration of scenarios that could be a threat to the country in the medium term (up to five years). Scenarios offer a way of communicating to form a joint picture of future uncertainties, factors that influence policy objectives, and decisions that have to be taken.
A risk scenario describes:
the incident, i.e. (the nature and scale of) one or more inter-related events that have consequences for national safety and security and therefore have an impact at national level
the lead-up to the incident, consisting of the (underlying) cause and any underlying insidious process, and the trigger that actually creates the incident or brings the insidious process to the surface
the context of the events, indicating general circumstances and the degree of vulnerability and resistance of people, objects and society, to the extent relevant to the incident described
the consequences of the incident, indicating the projected nature and scale with an overall description of the response and the control measures
the effects of the incident on the continuity of vital infrastructure.
A multi-disciplinary working group develops each scenario. Representatives of the various (specialist) departments have a seat in the working group. The group’s chair is usually from the specialist department most affected. Where necessary, use is made of expertise present in other ministries and from authorities, private individuals, knowledge centres and planning bureaus.
The next steps are then:
1. Risk assessment – Assessment of each scenario in terms of likelihood and impact is carried out by a balanced group of experts.
2. Capability analysis – The capability analysis takes place in a working group that includes all relevant experts and interests.
The specialist department with the prime responsibility for the scenario sets up the working group. Reporting of the capability analysis from various thematic in-depth studies forms the basis for the findings report.
Source: (Center for Security Studies, ETH Zurich, 2011[27]); (Ministerie van Binnenlandse Zaken en Koninkrijksrelaties, 2009[28]).
Well-designed risk scenarios provide a narrative that is built around cause and effect and grounded in experience and research evidence. They may be revised regularly, depending on the changing context and environment. Analytical techniques such as fault tree analysis or problem tree analysis, described below, can help in developing the scenarios. A problem tree starts from a detected problem whereas a fault tree starts from a future undesired event. However, in the context of developing a risk scenario, this difference is mainly semantic. A problem tree can also serve as a risk tree when the central question is future oriented: what can go wrong?.
Fault Tree Analysis
Fault Tree Analysis (FTA) is a well-established technique of deductive failure analysis. It focuses on one particular undesired event, the “fault”, and provides causes for this event before it occurs. The logical connections between the fault and its causes are graphically presented in a “fault tree”. The tree traces all branches of events that could contribute to the failure, down to the root causes. The method uses sets of Boolean symbols, labels and identifiers. It can also be used to evaluate the probability of the top event using statistical methods. FTA is common in many industries, including the aerospace, car, medical, and energy sectors.
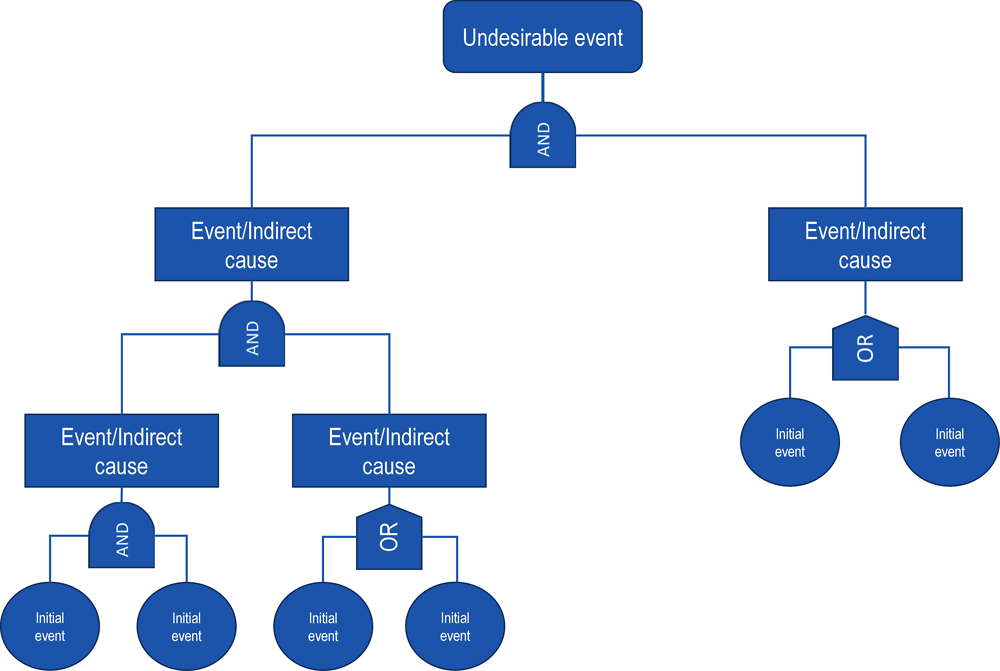
Problem Tree Analysis
A problem tree looks at the relationship between problems. It relates and links different problems to each other hierarchically according to how they influence each other. Any box in the tree can be identified as a problem. Root causes of that problem will then be found as one moves downward in the tree, asking ‘why’ and the consequences will be found as one moves upward asking “so what”. Problem tree analysis stays close to policy design in that it may also be used to map policy options that may solve a specific societal problem. The Performance Audit Manual of the sub-regional organisation for supreme audit institutions in English speaking countries in Africa (AFROSAI-E) recommends the problem tree technique as a way to direct focus for an audit.

Source: (Kabir, 2017[29]) (AFROSAI-E, 2016[30]).
TCs can build a risk scenario for each of the outcome indicators in the logic model. Essential steps in building these risk scenarios include:
1. Select a first-tier outcome indicator, as discussed above, from the logic model to start. A low score on this indicator will be the ‘undesirable event’ or ‘future problem’ that is at the basis of the scenario.
2. Identify tier-two output indicators in the logic model, making sure that the linkages between them illustrate a realistic explanation as to why and how these factors may contribute to the first-tier indicator and the undesirable event. The aforementioned techniques, i.e. the problem or fault tree analysis, can be useful at this stage.
3. Consider whether there are any elements in the logic model without indicators, which may contribute to the outcome problem.
4. Finally, add elements that are not in the model but seem relevant, based on experience or expert opinion. Steps 3 and 4 provide additional context and “local” knowledge to help uncover possible root causes.
5. Validate the scenario with stakeholders and other field experts. As a good practice, the building of risk scenarios could take place in working groups, involving risk analysts and experts.
Risk scenarios can be simple, and do not need to capture all possible elements. TCs should focus on the most relevant elements for auditing. By developing only a limited set of scenarios, it becomes relatively easy to share them among external auditors, discuss outcomes and develop a shared risk map. Box 2.8 shows a fictitious example of developing risk scenarios in the education sector.
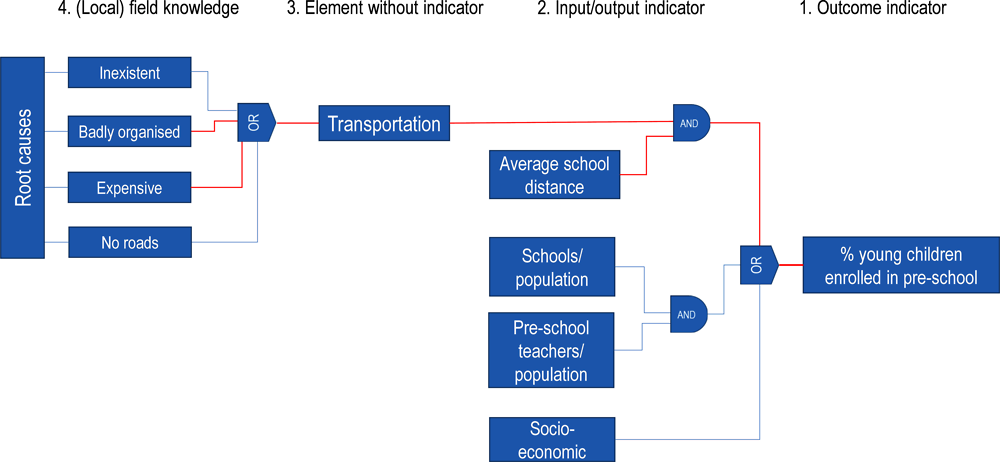
A lack of school busses limits access to pre-school for young children
The undesirable event that triggers the scenario is low pre-school enrolment among young children. This is a typical example of an outcome that has a high regional variation in Brazil. A hypothetical cause may be that parents cannot or will not send their children to preschool because children need to travel a long way and parents have no access to school transportation. Following that line of reasoning, underlying hypothetical problems concerning school transportation may be that transportation may be non-existent in certain regions; it is badly organised; it is too expensive; or perhaps there are no roads in a rural area. One possible root cause may be corruption in the procurement of school buses. Other scenarios may be developed based on socio-economic disparity or elements related to scarcity of schools or pre-school teachers.
To build the risk scenarios, TCs could establish temporary working groups for each outcome indicator in the logic model, making sure there is a good mixture of experts and local knowledge. These working groups could be part of a sustainable collaboration mechanism among TCs (see Chapter 4 on collaboration). Since this is a new and innovative approach, TCs may work together in an iterative way, building a risk scenario and testing it in the audit selection phase (see next section).
In keeping with the purpose of the project, evaluating decentralised policies in a co-ordinated manner and highlighting multi-level governance issues, TCs could start this work with outcome indicators that show the highest regional variation. As stated in the section on indicators, in those cases it is probable that multi-level governance issues play a role. Also the added value of TCs working together is biggest.
TCs may follow the steps described in the previous section, but in addition should focus their scenario on explanations of regional variation. If they are not already included in the logic model, multi-level governance elements (see also chapter 3) could be considered as a part of step 4.
In addition to building a narrative, TCs could also consider to visualise the scenarios, so they can be easily communicated with other TCs and external stakeholders.
In order to facilitate learning and to make sure that the scenarios stay realistic and relevant, TCs should update the risk scenarios annually, in line with their audit planning cycles, based on developments in policy, context and knowledge gathered in recent audits.
The application of risk scenarios in audit selection
Risk scenarios help the organisation and prioritisation of the risk universe in an analytical way to steer risk identification and analysis. They serve as hypotheses that can be checked and analysed using indicator data and the auditors’ field knowledge, thus identifying the scenarios with the highest probability and negative impact on policy outcomes. This is what happens in the risk analysis and audit selection phase.
Six consecutive analytical steps connect all previous recommendations in this chapter into one process for risk-based audit selection (Figure 2.9). Each step is guided by a key question. The assumption is that all outcome indicators of the logic model have underlying risk scenarios that hypothetically explain possible weak outcomes, but the steps may also be applied for a single outcome indicator.

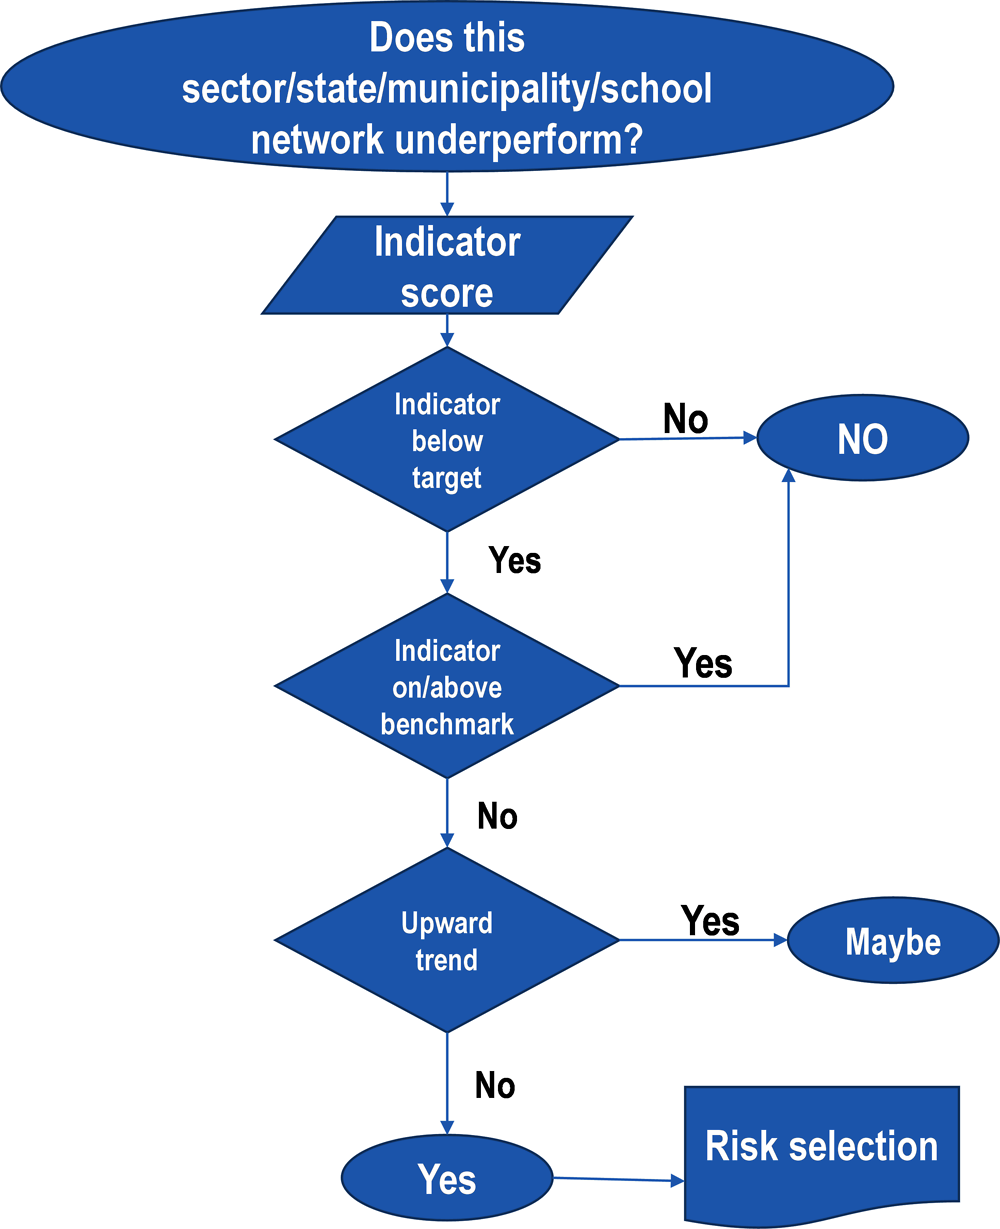
Step 1: Finding weak performance
Auditors should first look at outcome indicators in the indicator model, ideally with the assistance of a technological tool (see Box 2.9). The goal of the first step is to select outcomes that are below a certain target or benchmark (e.g. established in a policy, or highlighted by the centre of government) and therefore raise concerns. The analysis might be at the national level, regional and/or municipal levels. In this way it also highlights any regional disparity of outcomes that may point to local or regional governance issues.
Key question to answer: Where do observed outcomes diverge from policy objectives and targets?
Expected output: reduction of the audit universe by weak policy performance, in relation to the level of analysis (e.g. municipalities, regions).
Step 2: Associating input and process indicators
In this step, auditors should search for the input, output and process indicators of the risk scenarios that are associated with the weak performance areas that have been identified in Step 1. The purpose is to select the scenarios that best explain the observed weak outcomes.
Key question to answer: Do the associated scenario’s input and process indicators diverge from established targets or highlight specific problems that may influence poor outcomes?
Expected output: further reduction of the audit universe, by investigating the likelihood of possible risk scenarios that may contribute to explaining the observed weak performance.
Step 3: Looking at other contextual risk factors
The primary risk factors associated with weak performance should be included in the risk scenarios, but other factors, outside the scenarios might also help explain the observed outcomes. This step focuses on these other factors that might help explain the variations in outcomes observed in Step 1. Local knowledge is needed for this step, which requires auditors to consider for example indicators of socio-economic context, issues affected by complementary policies (e.g. social policies) and other local evidence, such as previous audit reports and findings, known issues, etc. Auditors’ field knowledge is pivotal in this step, but if needed the team could also consult (local) experts.
Key question to answer: What other contextual risk factors in the locations concerned may contribute to the observed outcomes? Are there other risk factors outside the scenarios that would better explain the observed outcomes? May multi-level governance issues play a role?
Expected output: a limited number of enriched scenarios that explain the observed weak outcomes and take into account local variations in risk factors.
Step 4: Considering risks factors to audit
The previous steps lead to a problem analysis. At this stage, the factors in the scenarios that may contribute to the weak policy performance have been identified. However, these factors do not immediately provide audit topics. They must be brought down to risks (impact and likelihood), and connected to auditable entities.
This step looks at possible factors to audit. Some may be local, others general. Some may be influencing performance in multiple ways while others may have very limited impact. This step is the team’s qualitative assessment of impact and likelihood of the scenarios and the constituting factors. The team members typically would have to reach agreement on the likely weight of all different factors in a scenario that are influencing poor observed outcomes.
Key question to answer: Which scenario factors identified in Steps 2 and 3 might need an in-depth examination as part of an audit?
Expected output: a sorted list or “heat map” of risk factors, connected to scenarios, which may be considered for audit.
Step 5: Identifying relevant policies and responsible actors
This step establishes the specific policies and actors connected to the risk factors under examination. In this step, it is important to consider possible multi-level governance aspects of the factors under consideration and to identify the responsibilities concerned. The possible complementary policies that have an impact on the risk factors under examination could also be considered.
Key questions to answer: Which public policies influence the factors identified in Step 4? Which public bodies (and at which levels of government) are responsible for these policies?
Expected output: a list of auditable objects in relation to the identified risk factors and an indication of the relevance of multi-level governance issues.
Step 6: Identifying topics for audit selection
This step combines auditable issues and entities into topics for audit selection; it looks for clusters or overlapping topics. Auditors or the responsible team might choose to apply visual techniques, such as mind mapping. To conclude the step, the team might search for validation from stakeholders, to ensure that these selected topics are indeed the most relevant.
Key questions to answer: With the purpose of gaining a better understanding of the weak outcomes and to allow the formulation of effective recommendations, which public policy interventions (co-ordinated by which public bodies) should be audited?
Expected output: a proposal for optional audit topics that can be taken into the audit selection phase.
This proposal will then be input for collaborative deliberation; specifying feasibility and the need for co-ordinated audits that may feed into the audit programming of each external audit entity (see Chapter 4 for further information about collaborative work among audit institutions).
Information technology can facilitate the risk assessment
The auditors doing the risk-based audit selection (described in the previous section) need to have access to the relevant indicator data and the risk scenarios that have been developed. In case of collaboration among TCs, it would be useful if auditors could document and share the results of their own risk assessment with other TCs to create a common knowledge base such as a shared risk map.
The main purpose of such an IT-tool is to facilitate data collection, exchanges of the data and execution of the analytical steps that are linked to the evaluation of indicators. In combining the risk scenarios, the tool may enable TCs to carry out risk assessments individually, as well as collectively.
Through a Geographic Information System (GIS) user interface for visualisation, auditors could apply the tool to identify key performance challenges and risk scenarios by policy area and by geographical area.
Moreover, it may prove a valuable instrument for harmonising assessment procedures and assuring the quality and comparability across the different collaborating TCs. The tool might also support the sharing of audit reports and facilitate the mapping of audit coverage and results, thus further contributing to collaboration (see Box 2.9 for examples of IT-supported risk assessment tools).
Austrian Court of Audit’s Municipal Monitoring Tool
Since 1929, the Austrian Court of Audit (ACA) has been entitled to audit municipalities with more than 20 000 inhabitants. However, in recent years, municipalities in Austria have progressively been entrusted with more budgets to deliver services in such areas as social affairs, education and healthcare. This has resulted in an increase in the financial and economic significance of municipalities, and since 2011 the ACA has been entitled to audit those with more than 10 000 inhabitants. The extended audit responsibility has prompted the ACA to develop a tool to monitor the financial health of Austrian municipalities.
The tool operates mainly through the statistics software “R” and enables municipalities to be compared using different criteria, as well as observation of changes in municipalities and select the ones with the highest financial risk. The ACA obtains raw data from the country’s statistical body. The data include detailed information on the closed accounts of the municipalities, statements of debts and liabilities, and socio-demographic data.
By ranking the municipalities according to their financial risk based on certain indicators, the tool allows the ACA to profile each of the 2 356 municipalities in Austria and to assess them with regard to their significance for the audit activities. The tool is used for audit planning and for the preparation of audits at the operational level (e.g. for the selection of peers). Upon request, the ACA also provides the relevant fact sheets to the respective municipalities.
The National Risk Atlas of Mexico
The National Centre for Disaster Prevention (CENAPRED) in Mexico created the National Risk Atlas (NRA), an innovative tool that integrates information on exposure and vulnerability from the three levels of government. The NRA provides a comprehensive national and local view of all disaster risks, natural or manmade and its GIS architecture provides excellent visualisation of the spatial relation between hazards and the population and assets at risk.
While it is mostly used to strengthen emergency response planning, the NRA is publicly available on its website http://www.atlasnacionalderiesgos.gob.mx/, allowing growing risk awareness among the Mexican population.
Source: (EUROSAI, 2014[31]) (EUROSAI, 2018[32]) (OECD, 2013[33]) (CENAPRED, n.d.[34]).
Concerning the evaluation of indicators to facilitate audit selection, the basic functionality of the tool would be to allow Step 1 outcome analysis and subsequently, Step 2 analysis of contributing factors that constitute the risk scenarios. The tool could also have additional functionality, such as access to data on audit coverage, access to qualitative analytical information associated with the risk scenarios, a reporting and documenting unit, a risk map interface, etc.
This indicator-based and scenario-driven approach to audit selection requires strong leadership for implementation, not only because it is innovative but also because it requires multiple TCs to collaborate intensively. The governance, organisation and working methods that are needed are all part of the proposed collaboration mechanism that is the topic of Chapter 4. Within this mechanism, TCs should establish a permanent working group that prepares, supervises and executes the steps of the risk assessment, as described in the previous section. This group should work in an iterative way, developing the practical steps of the procedure and evaluating continuously.
The working group should also consider developing an information technology solution that supports the analysis and sharing of information, as described above. Box 2.10 proposes the basic functionality of this tool. An IT tool may not provide TCs with automated results (i.e. the exact definition of the auditee, or the specific issues of a policy that need to be audited), but it can provide an initial basis for the identification of possible risks by topic, sector and geographical location.
Step 1 – Where do observed outcomes diverge from policy objectives and targets?
To answer this question the tool could provide an automated evaluation of all outcome indicators at the lowest level of analysis possible, using a simple decision tree; more decision trees would be needed to calculate the aggregated result. The GIS user interface then would allow the auditors to contemplate combinations of geographical level of analysis and policy objectives, establishing not only the main policy areas at risk, but also geographical variations. They can then focus their next analytical step not only on the policy outcomes that are most critical, but also on those municipalities that show the weakest indicator scores, narrowing down the audit universe.
Step 2 – Do the associated scenario input and process indicators diverge from established targets or highlight specific problems that may lead to poor outcomes?
To answer this question the tool could provide an automated evaluation of all the indicators belonging to the risk scenarios that are associated with the selected policy objective, thus providing the auditors insight into the elements of the scenarios that have indicators and that are critical. In addition, the auditors can evaluate geographical variation, thus establishing if this is a local or more general problem.
The audit selection in itself is not part of the risk assessment, because audit selection requires different criteria, such as strategic, technical or resource related criteria. Audit selection in collaboration with other external audit bodies will be discussed in Chapter 4: Improving collaboration in the public sector audit system in Brazil.
Taking into account regional variations in socio-economic conditions and policy outcomes is extremely important in selecting audits in decentralised policy areas in Brazil. Data and evidence at the local level are widely available in Brazil and can provide insights into differences among regions.
TCs are in an excellent position to systematically collect and analyse evidence that will shed a light on disparities in policy performance, help to identify risks and ultimately lead to strategic audit selection.
TCs are already evolving practices on risk based audit selection, but they could make them more systematic, sharing information and knowledge that will allow them to build a shared risk map. They could develop a common method, beginning with the policy field of education.
Based on an outcome-oriented logic model for the policy area of education, TCs could describe the relations between actual input, processes and output/outcomes of education policy in Brazil. TCs should then select a limited set of available indicators for the elements in the logic model for which good data are available.
For each selected outcome indicator TCs could develop risk scenarios that connect the outcome indicator with indicators on input and processes, as well as local context, thus explaining what could lead to poor performance on this output indicator.
In six analytical steps, using the indicator data, TCs could test the probability and impact of the risk scenarios, leading to a proposal for optional audit topics.
TCs could build an IT tool to facilitate the analysis and share results. A permanent working group could prepare, supervise and execute the steps of the risk assessment at the same time further developing the practical steps of the approach. Once the approach is an established practice, TCs could extend the method to other decentralised policy areas.
The simple conceptual model of the educational process used in the Integrar project, presented in Annex Figure 2.A.1, distinguishes between:
A. The governance and policy context in which education takes place;
B. The overall financial inputs into the educational process;
C. The interaction between school and student-level factors in the learning process (schools and students) and
D. The intended outcomes of the educational process: that the target population of students (e.g. a specific age cohort) acquires good learning outcomes in a timely manner.
Following an iterative process of discussions with the audit community and educational experts in Brazil, the project is focusing on assembling a limited set of indicators that will allow auditors to monitor key performance variables in the basic education system in Brazil and to identify issues where performance audit may be warranted. This note provides an overview of the main types of indicator that can be used to measure the key variables related to the educational process and educational outcomes included (parts C. and D. of the conceptual model). The tables in the follow pages present, first, key outcome variables and indicators and, second, variables and indicators related to the educational process that leads these outcomes.
The tables provide a brief explanation of the theoretical relevance of each variable, as well as a short assessment of the main strengths and weaknesses of the indicators commonly used in the OECD and beyond to capture and measure the variables in question.
References
[30] AFROSAI-E (2016), Performance Audit Handbook, https://afrosai-e.org.za/wp-content/uploads/2019/07/AFROSAI-E-Performance-Audit-Handbook-2016.pdf.
[34] CENAPRED (n.d.), CENAPRED website (Centro Nacional de Prevención de Desastres), http://www.atlasnacionalderiesgos.gob.mx/ (accessed on 13 May 2020).
[27] Center for Security Studies, ETH Zurich (2011), Using Scenarios to Assess Risks: Examining Trends in the Public Sector, https://www.files.ethz.ch/isn/164303/Focal-Report-5-Scenarios-to-Assess-Risks.pdf.
[21] ETS/OECD (2019), PISA 2021 Context Questionnaires Framework, https://www.oecd.org/pisa/publications/ (accessed on 13 May 2020).
[20] European Court of Auditors (2017), Performance Audit Manual, https://www.eca.europa.eu/Lists/ECADocuments/PERF_AUDIT_MANUAL/PERF_AUDIT_MANUAL_EN.PDF.
[32] EUROSAI (2018), Overview of External Audit Systems in Local Governments, http://www.eurosaiop.org/docs/upload/documents/TFMA_Overview_external_audit_systems_2018_1555656170.pdf.
[31] EUROSAI (2014), EUROSAI Innovations: Volume II, https://www.eurosai.org/handle404?exporturi=/export/sites/eurosai/.content/documents/strategic-plan/goal-team-1/Eurosai-Innovations-II_en.pdf.
[14] Government of Brazil (2014), Lei No.13005 - Aprova o Plano Nacional de Educação (PNE) (Law No.13005 - Approves the National Education Plan (PNE)), http://www.planalto.gov.br/CCIVIL_03/_Ato2011-2014/2014/Lei/L13005.htm (accessed on 4 September 2018).
[7] IEC/ISO (2009), 31010:2009 Risk management, Risk Assessment Techniques, https://www.iso.org/obp/ui/#iso:std:iec:31010:ed-1:en.
[17] INEP (2019), Censo Escolar, http://inep.gov.br/censo-escolar (accessed on 9 July 2019).
[16] INEP (2019), Sinopse Estatística da Educação Básica - 2018, http://inep.gov.br/sinopses-estatisticas-da-educacao-basica (accessed on 15 June 2020).
[23] INEP (2019), Testes e Questionários - SAEB, SAEB, http://portal.inep.gov.br/educacao-basica/saeb/instrumentos-de-avaliacao (accessed on 29 October 2019).
[18] INEP (2018), Relatório do 2º Ciclo de Monitoramento das Metas do Plano Nacional de Educação – 2018, Instituto Nacional de Estudos e Pesquisas Educacionais Anísio Teixeira (Inep), Brasília, http://portal.inep.gov.br/informacao-da-publicacao/-/asset_publisher/6JYIsGMAMkW1/document/id/1476034 (accessed on 24 April 2019).
[1] INTOSAI (2019), GUID-9000 Cooperative audits between SAIs, https://www.issai.org/wp-content/uploads/2019/08/GUID-9000-Cooperative-Audits-between-SAIs.pdf.
[4] INTOSAI (2019), ISSAI 3000, Performance Audit Standard, https://www.issai.org/pronouncements/issai-3000-performance-audit-standard/.
[2] INTOSAI (2016), GUID - 3920 - The Performance Auditing Process, https://www.issai.org/wp-content/uploads/2019/08/GUID-3920-The-Performance-Auditing-Process.pdf.
[19] INTOSAI (2016), GUID 3910, Central Concepts for performance Auditing, https://www.issai.org/pronouncements/guid-3910-central-concepts-for-performance-auditing/.
[9] INTOSAI (2016), ISSAI 130 Code of Ethics, https://www.issai.org/pronouncements/issai-130-code-of-ethics/.
[6] ISO (2018), 3100, Risk management Guidelines, https://www.iso.org/obp/ui/#iso:std:iso:31000:ed-2:v1:en.
[29] Kabir, S. (2017), “An overview of fault tree analysis and its application in model based dependability analysis”, Expert Systems with Applications, Vol. 77, pp. 114-135, https://doi.org/10.1016/j.eswa.2017.01.058.
[28] Ministerie van Binnenlandse Zaken en Koninkrijksrelaties (2009), Working with scenarios, risk assessment and capabilities, https://www.preventionweb.net/files/26422_guidancemethodologynationalsafetyan.pdf.
[12] OECD (2019), Education at a Glance 2019: OECD Indicators, OECD Publishing, Paris, https://dx.doi.org/10.1787/f8d7880d-en.
[15] OECD (2019), Results from PISA 2018 - Brazil, OECD, Paris, https://www.oecd.org/pisa/publications/PISA2018_CN_BRA.pdf (accessed on 27 January 2020).
[25] OECD (2018), Effective Teacher Policies: Insights from PISA, PISA, OECD Publishing, Paris, https://dx.doi.org/10.1787/9789264301603-en.
[11] OECD (2018), The Future of Education and Skills: Education 2030, OECD, Paris, https://www.oecd.org/education/2030/E2030%20Position%20Paper%20(05.04.2018).pdf (accessed on 24 September 2018).
[5] OECD (2018), Using Risk Assessment in Multi-years Performance Audit Planning, OECD, Paris, https://www.oecd.org/gov/ethics/using-risk-assessment.pdf.
[3] OECD (2016), Supreme Audit Institutions and Good Governance: Oversight, Insight and Foresight, OECD Public Governance Reviews, OECD Publishing, Paris, https://dx.doi.org/10.1787/9789264263871-en.
[24] OECD (2015), Skills for Social Progress: The Power of Social and Emotional Skills, OECD Skills Studies, OECD Publishing, Paris, https://dx.doi.org/10.1787/9789264226159-en.
[33] OECD (2013), OECD Reviews of Risk Management Policies: Mexico 2013: Review of the Mexican National Civil Protection System, OECD Reviews of Risk Management Policies, OECD Publishing, Paris, https://dx.doi.org/10.1787/9789264192294-en.
[13] OECD/UCLG (2019), Report of the World Observatory on Subnational Government Finance and Investment – Country Profiles, OECD, Paris, http://www.sng-wofi.org/publications/SNGWOFI_2019_report_country_profiles.pdf (accessed on 15 June 2020).
[10] Office of the Auditor General of Canada (2019), Selection of Performance Audit Topics, https://www.oag-bvg.gc.ca/internet/methodology/performance-audit/manual/1510.shtm (accessed on 24 July 2020).
[22] Onderwijsinspectie (2019), Het referentiekader voor onderwijskwaliteit (OK), Flemish Government - Education Inspectorate, https://www.onderwijsinspectie.be/nl/het-referentiekader-voor-onderwijskwaliteit-ok (accessed on 29 October 2019).
[8] Put, V. and R. Turksema (2011), Selection of topics, Performance Auditing, Edward Elgar Publishing Limited.
[26] Schumann, A. (2016), “Using Outcome Indicators to Improve Policies: Methods, Design Strategies and Implementation”, OECD Regional Development Working Papers, No. 2016/2, OECD Publishing, Paris, https://dx.doi.org/10.1787/5jm5cgr8j532-en.
Notes
← 1. Data from 2016 show that, of the 33 member and partner countries for which data are available, public spending as a proportion of GDP on primary and secondary education is the same or higher in only Norway, Belgium and Iceland (OECD, 2019[12]).
← 2. “Basic education” (educação básica) in Brazil refers to all forms of school-level education, from pre-school to the end of high school. It has three stages: pre-school (educação infantil), fundamental education (educação fundamental – which combines primary and lower secondary education) and upper secondary education (ensino médio).
← 3. For basic education the federal government funds targeted programmes and provides a contribution to the FUNDEB redistribution fund in each state and the DF (Fundo de Manutenção e Desenvolvimento da Educação Básica). This is in total equivalent to around 10% of all spending on basic education in Brazil, but the proportion varies considerably per state.
← 4. Years 5 and 9 of fundamental education and the last year of upper secondary education.