copy the linklink copied!Indicator A7. To what extent do adults participate equally in education and learning?
-
Learning begets learning. On average across OECD countries, the participation of adults in formal and/or non-formal education and training is about 20 percentage points higher for those who completed tertiary education than for those who completed upper secondary or post-secondary non-tertiary education.
-
Participation in non-formal education and training is much higher than participation in formal education and training. This holds true even for 25-34 year-olds: on average across the OECD countries taking part in the Adult Education Survey (AES), 50% of younger adults were participating in non-formal education and training while only about 16% were participating in formal education and training.
-
Participation in adult education and training is largely driven by employment. On average across the OECD countries participating in the AES, 70% of the education and training activities followed by tertiary-educated 25-64 year-olds participating in non-formal education and training were job-related and sponsored by their employer.

1. Some categories might need to be interpreted with caution. Refer to the source table for more details.
2. Year of reference differs from 2016. Refer to the source table for more details.
* See note on data for the Russian Federation in the Source section.
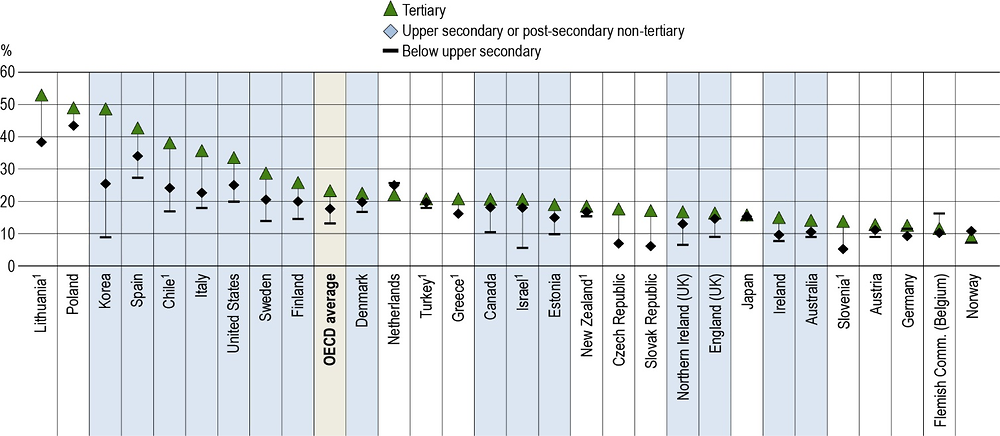
Countries are ranked in descending order of the percentage of tertiary-educated 25-64 year-olds participating in formal and/or non-formal education.
Source: OECD (2019), Table A7.1. See Source section for more information and Annex 3 for notes (https://doi.org/10.1787/f8d7880d-en).
Context
Adult learning can play an important role in helping adults to develop and maintain key information-processing skills and acquire other knowledge and skills throughout their lives. It is crucial to provide and ensure access to organised learning opportunities for adults beyond initial formal education, especially for workers who need to adapt to changes throughout their careers (OECD, 2013[1]).
Adult learning can also contribute to non-economic goals, such as personal fulfilment, improved health, civic participation and social inclusion. However, the wide variation in adult learning activities and participation among OECD countries at similar levels of economic development suggests that there are significant differences in learning cultures, learning opportunities at work and adult education systems (Borkowsky, 2013[2]).
Other findings
-
Across all OECD countries taking part in the AES, participation in formal and/or non-formal education and training increases with each additional level of formal educational attainment.
-
Distance learning is an increasingly common form of participation in adult learning. Across OECD countries and economies participating in the Survey of Adult Skills (PIAAC), 20% of the adults who reported participating in non-formal education and training were doing so through distance learning.
-
Across OECD countries, most adults enrolled in formal education are attending a tertiary programme. However, in Australia, Belgium, Mexico and Sweden, less than half of adults participating in formal education were enrolled in tertiary programmes.
Analysis
Participation in formal and/or non-formal education and training by gender, age group and educational attainment
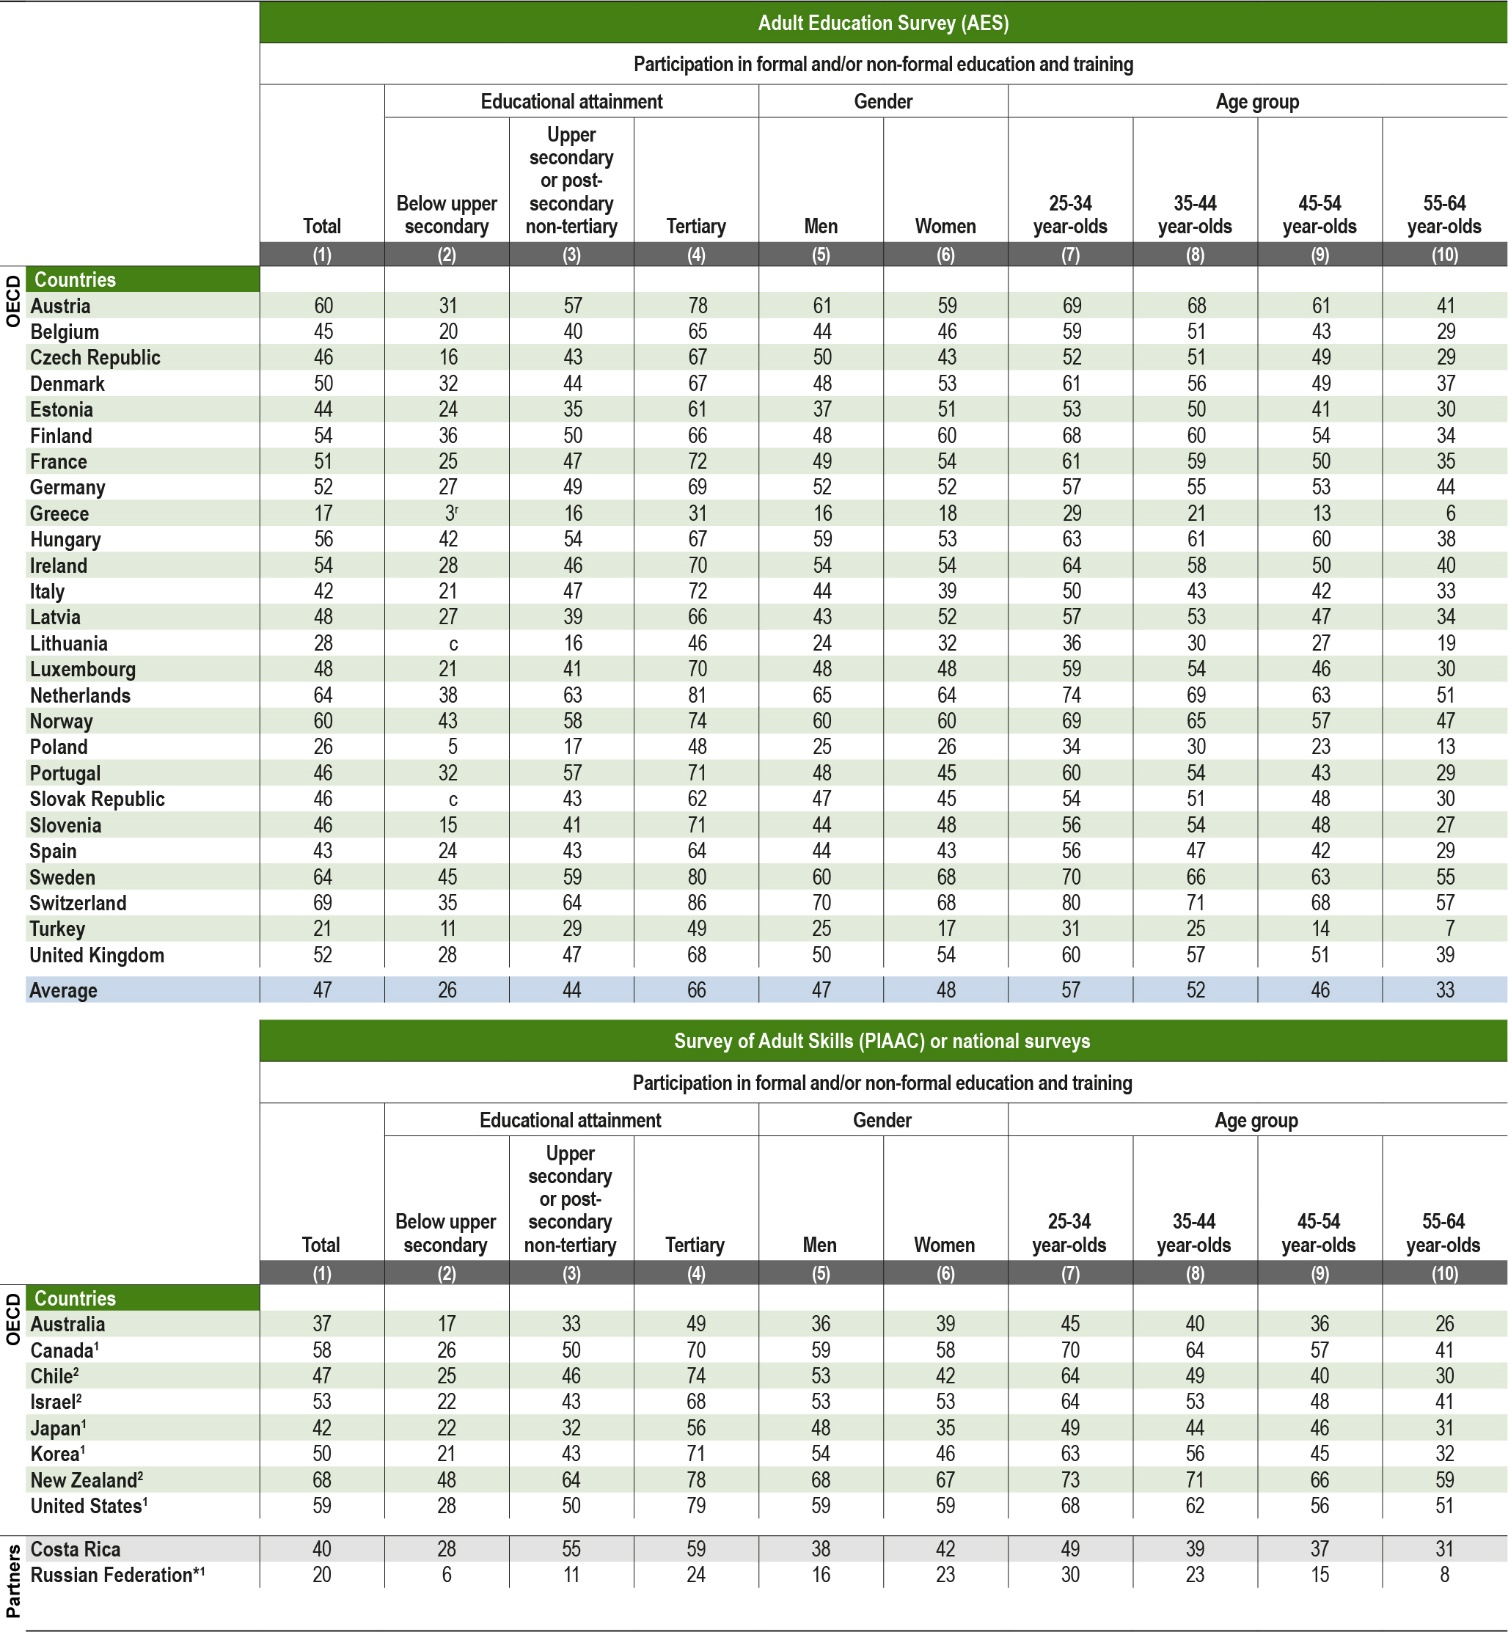
On average across OECD countries taking part in the Adult Education Survey (AES), 47% of 25-64 year-olds had participated in formal and/or non-formal education and training in the 12 months preceding the survey. In Greece and Turkey, less than 25% of adults were participating, while this rate reaches 60% and above in Austria, the Netherlands, Norway, Sweden and Switzerland (Table A7.1).
Figure A7.1 shows that adults with higher educational attainment are more likely to participate in formal and/or non-formal education and training activities. On average across OECD countries taking part in the AES, 26% of 25-64 year-olds with below upper secondary education had participated in formal and/or non-formal education and training in the 12 months preceding the survey. This rate increases to 44% for those with upper secondary or post-secondary non-tertiary education and reaches 66% for those with a tertiary education. Participation across countries varies greatly even among tertiary-educated adults: the rates range from 31% in Greece to 86% in Switzerland. The difference in participation between those with a tertiary degree and those with below upper secondary education is over 25 percentage points in all OECD countries participating in AES, and reaches 50 percentage points or more in the Czech Republic, Italy, Slovenia and Switzerland (Figure A7.1).
Completing upper secondary or post-secondary non-tertiary education is also associated with big differences in participation rates: participation is at least 25 percentage points higher in Austria, the Czech Republic, Italy, the Netherlands, Portugal, Slovenia and Switzerland among adults educated to this level compared to those who did not complete upper secondary education. In contrast, Denmark, Estonia, Finland, Greece, Hungary, Latvia, Norway, Poland and Sweden have the smallest gap, with 15 percentage points difference or less (Figure A7.1).
In most countries, the participation rates for women and men vary by less than 5 percentage points. The gender gap exceeds 10 percentage points only in Estonia and Finland; in both countries women participate more than men do. In Turkey, the gender gap is reversed and particularly large considering the country’s generally low participation in adult learning: 17% of women and 25% of men had taken part in formal and/or non-formal education and training (Table A7.1).
In all countries participating in AES, younger adults (25-34 year-olds) are more likely to participate in formal and/or non-formal education and training than older age groups (35-44, 45-54 and 55-64 year-olds). On average across OECD countries taking part in the AES, 57% of 25-34 year-olds were taking part in formal and/or non-formal education and training, 52% of 35-44 year-olds, 46% of 45-54 year-olds and 33% of 55-64 year-olds. The participation gap between age groups is highest in Finland where the rates are 68% for 25-34 year-olds and 34% for 55-64 year-olds. In contrast, the gap is the lowest in Germany where 57% of younger adults were taking part in formal and/or non-formal education and training compared to 44% among older adults (Table A7.1).
Comparison of participation in formal and non-formal education and training
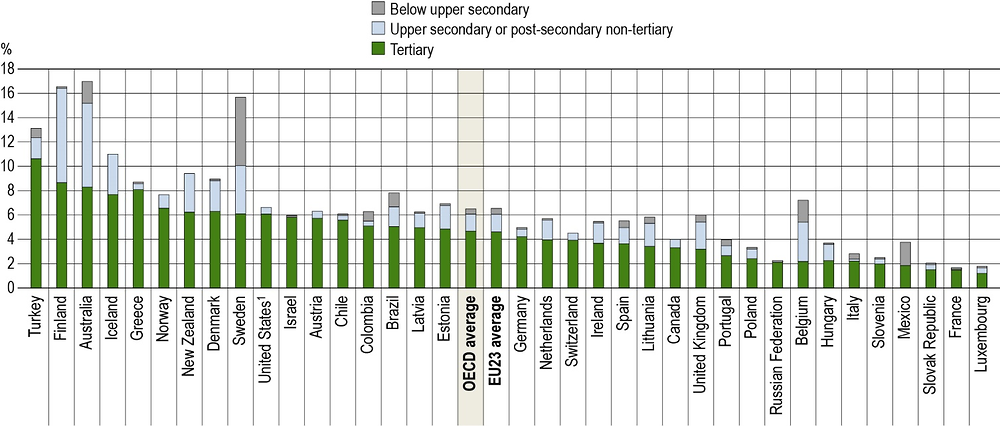
Participation in non-formal education and training surpasses participation in formal education and training among all age groups. This is true in all countries, even among 25-34 year-olds, the age group with the highest participation in formal education and training. On average across OECD countries taking part in the AES, 16% of 25-34 year-olds were taking part in formal education and training while 50% were taking part in non-formal education and training. In Greece, Poland and Turkey, participation in both formal and non-formal education and training is below 30%. In contrast, the rates are above 30% for both types of adult learning programmes in Denmark and Finland. In Denmark, the data suggest that a significant share of younger adults who were taking part in non-formal education and training were also taking part in formal education and training (Figure A7.2).

1. Some categories might need to be interpreted with caution. Refer to the source table for more details.
2. Year of reference differs from 2016. Refer to the source table for more details.
* See note on data for the Russian Federation in the Source section.
Countries are ranked in descending order of the percentage of 25-34 year-olds participating in formal and/or non-formal education.
Source: OECD (2019), Table A7.1. See Source section for more information and Annex 3 for notes (https://doi.org/10.1787/f8d7880d-en).
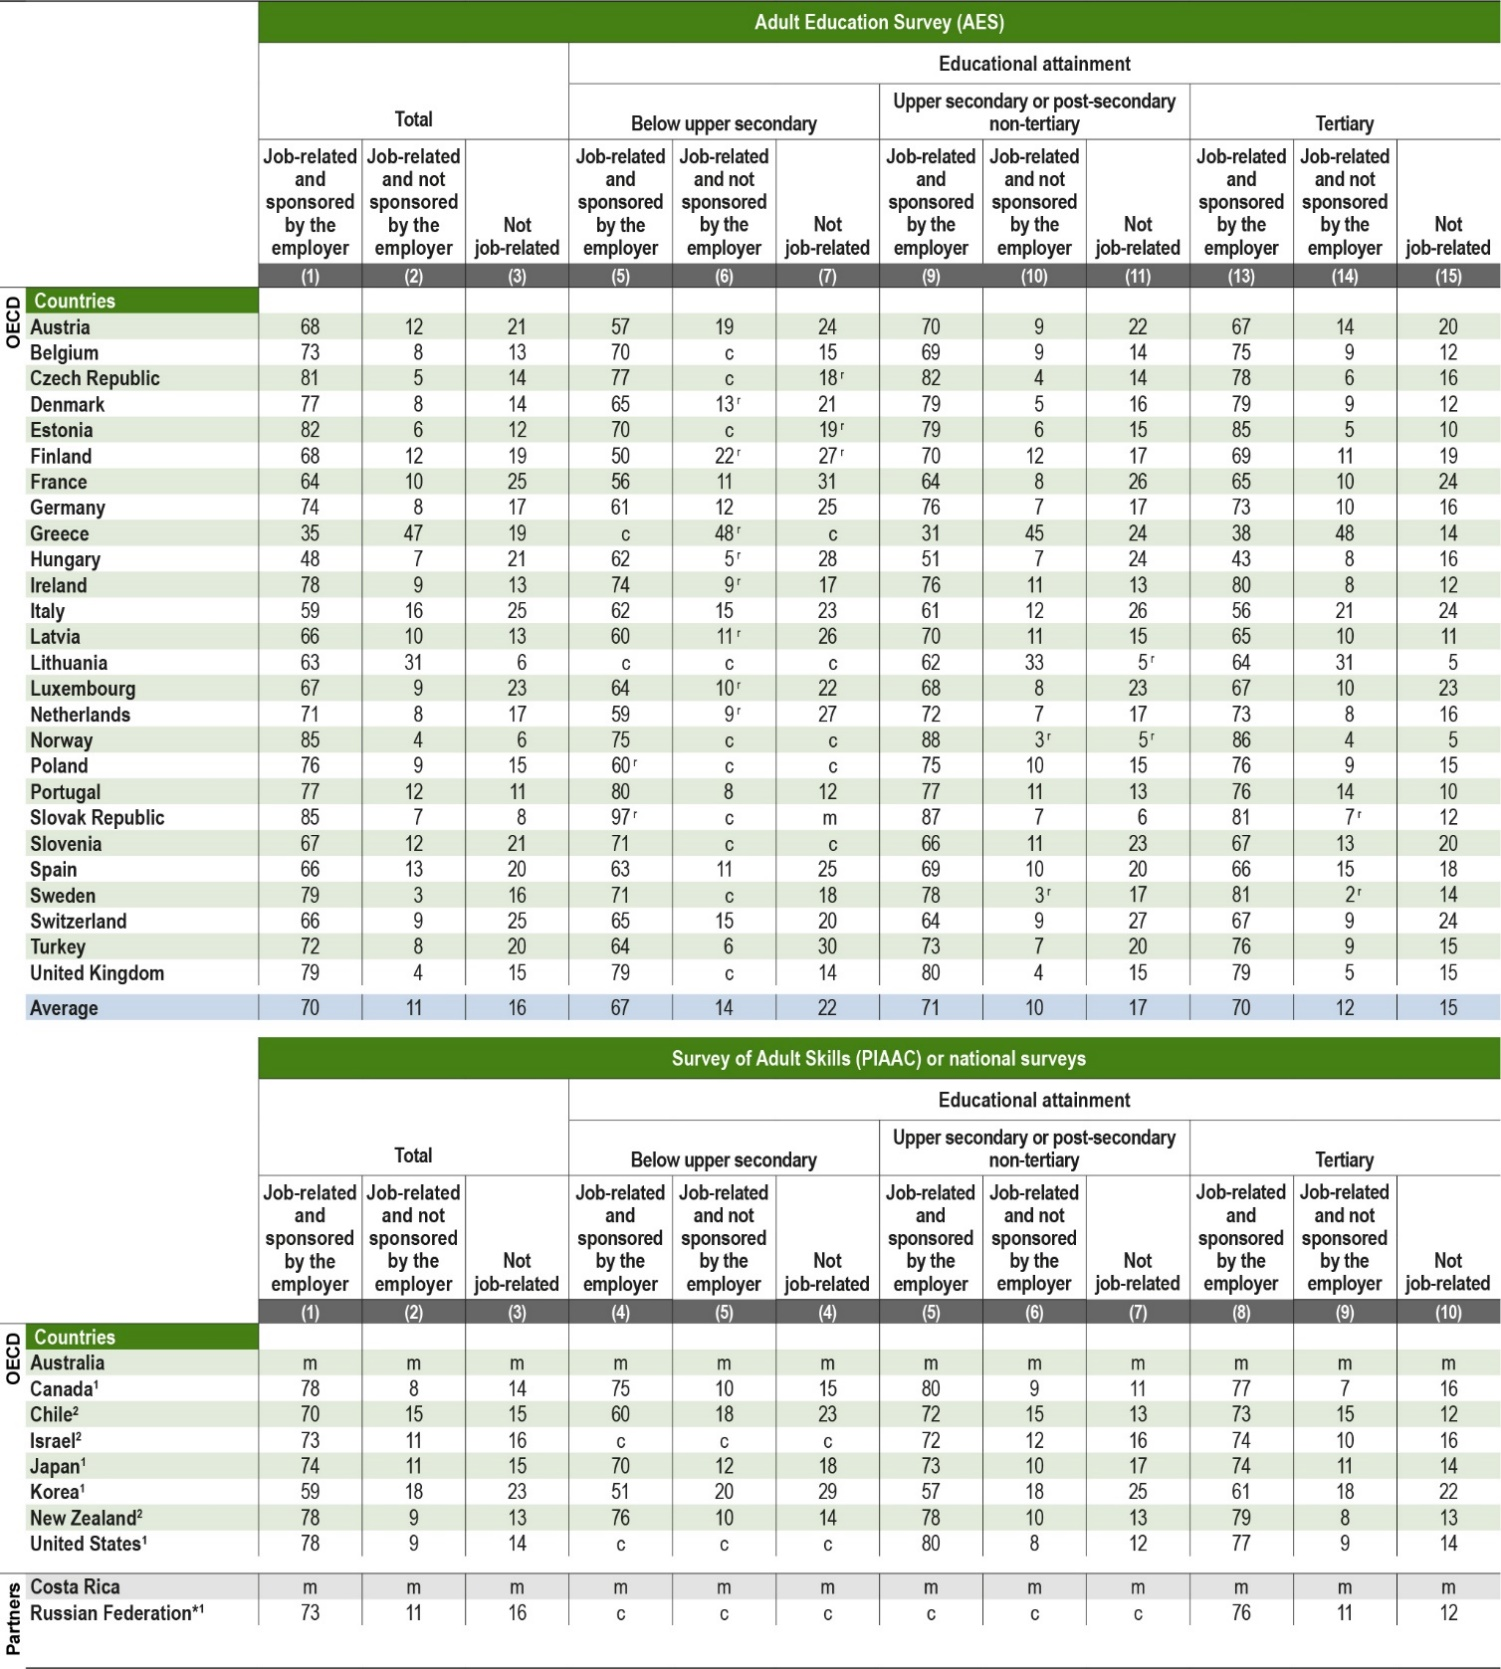
Participation in non-formal education (job-related and non-job related)
Figure A7.3 shows that education and training sponsored by the employer makes up the largest share of activities among tertiary-educated adults participating in non-formal education. This is true for all countries except Greece, where the commonest form of non-formal education was job-related education not sponsored by the employer.
Non-job-related education is less common than job-related education in all countries, but represents 20% or more of the programmes undertaken by adults in Austria, France, Italy, Luxembourg, Slovenia and Switzerland. This shows that participation in non-formal adult education is most commonly linked to a current job or to improve skills for a future job and is rarely strictly for leisure (Table A7.2a).
The share of not job-related non-formal education and training activities increases for participants with below upper secondary education. This can be partly explained by the lower employment rates for adults with lower levels of education (see Indicator A3) and therefore their lower exposure to job-related training opportunities. This is an important consideration as participation in adult learning among those who are not employed is key to them increasing their human capital and reintegrating into the labour market (Table A7.2a).
Distance learning and non-formal education
Non-formal education activities can take place in many different settings, including seminars, private lessons, on-the-job training and distance learning courses (OECD, 2014[3]). The growth in participation in education has led to increased demand for more flexible learning options, and as a result distance learning (particularly online learning) has become mainstream (Kentnor, 2015[4]). Distance learning is also a feature of non-formal education; on average across OECD countries, 20% of all adults who reported participating in non-formal education and training in the Survey of Adult Skills did so through distance learning. The largest shares of adults participating in non-formal distance learning are in Lithuania and Poland, where more than 45% of adults participating in non-formal education took part in distance learning. On the other hand, just 9% of adults in Norway and Slovenia participating in non-formal learning did so by distance learning (Figure A7.4 and Table A7.2c, available on line).

1. Some categories might need to be interpreted with caution. Refer to the source table for more details.
2. Year of reference differs from 2016. Refer to the source table for more details.
* See note on data for the Russian Federation in the Source section.
Countries are ranked in descending order of the percentage of tertiary-educated 25-64 year-olds participating in non-formal job-related education sponsored by their employer.
Source: OECD (2019), Table A7.2a. See Source section for more information and Annex 3 for notes (https://doi.org/10.1787/f8d7880d-en).
Differences are also evident in distance-learning patterns across attainment levels in OECD countries. In the majority of countries, among adults who participate in non-formal education, those who have attained tertiary education are more likely to participate through distance learning than adults with below upper secondary education. This mirrors the greater tendency for adults with tertiary education to participate in non-formal education (Figure A7.1). The differences are particularly large in Korea, where the share of adults with tertiary education participating in non-formal distance learning is 40 percentage points higher than the share of adults with below upper secondary education. Conversely, in Austria, Germany, Japan, the Netherlands, New Zealand, Norway and Turkey, the difference is less than 5 percentage points across education levels (Figure A7.4 and Table A7.2c, available on line).
Note: Grey zone denotes statistically significant differences between below upper secondary and tertiary education.
1. Reference year is 2015; for all other countries and economies the reference year is 2012.
Countries and economies are ranked in descending order of the distance learning participation rate among tertiary-educated adults participating in non-formal education.
Source: OECD (2019). Table A7.2c, available on line only. See Source section for more information and Annex 3 for notes (https://doi.org/10.1787/f8d7880d-en).
On average across the OECD, there is little difference in participation in non-formal distance learning by gender (19% for men and 21% for women). However, the gender differences are more substantial in a small number of countries; in Poland, the share of men participating in non-formal distance learning was 57%, which was 21 percentage points higher than the share of participating women. The share of men participating in non-formal distance education was also 10 percentage points higher than the share of women in Lithuania and Turkey (Table A7.2c, available on line).
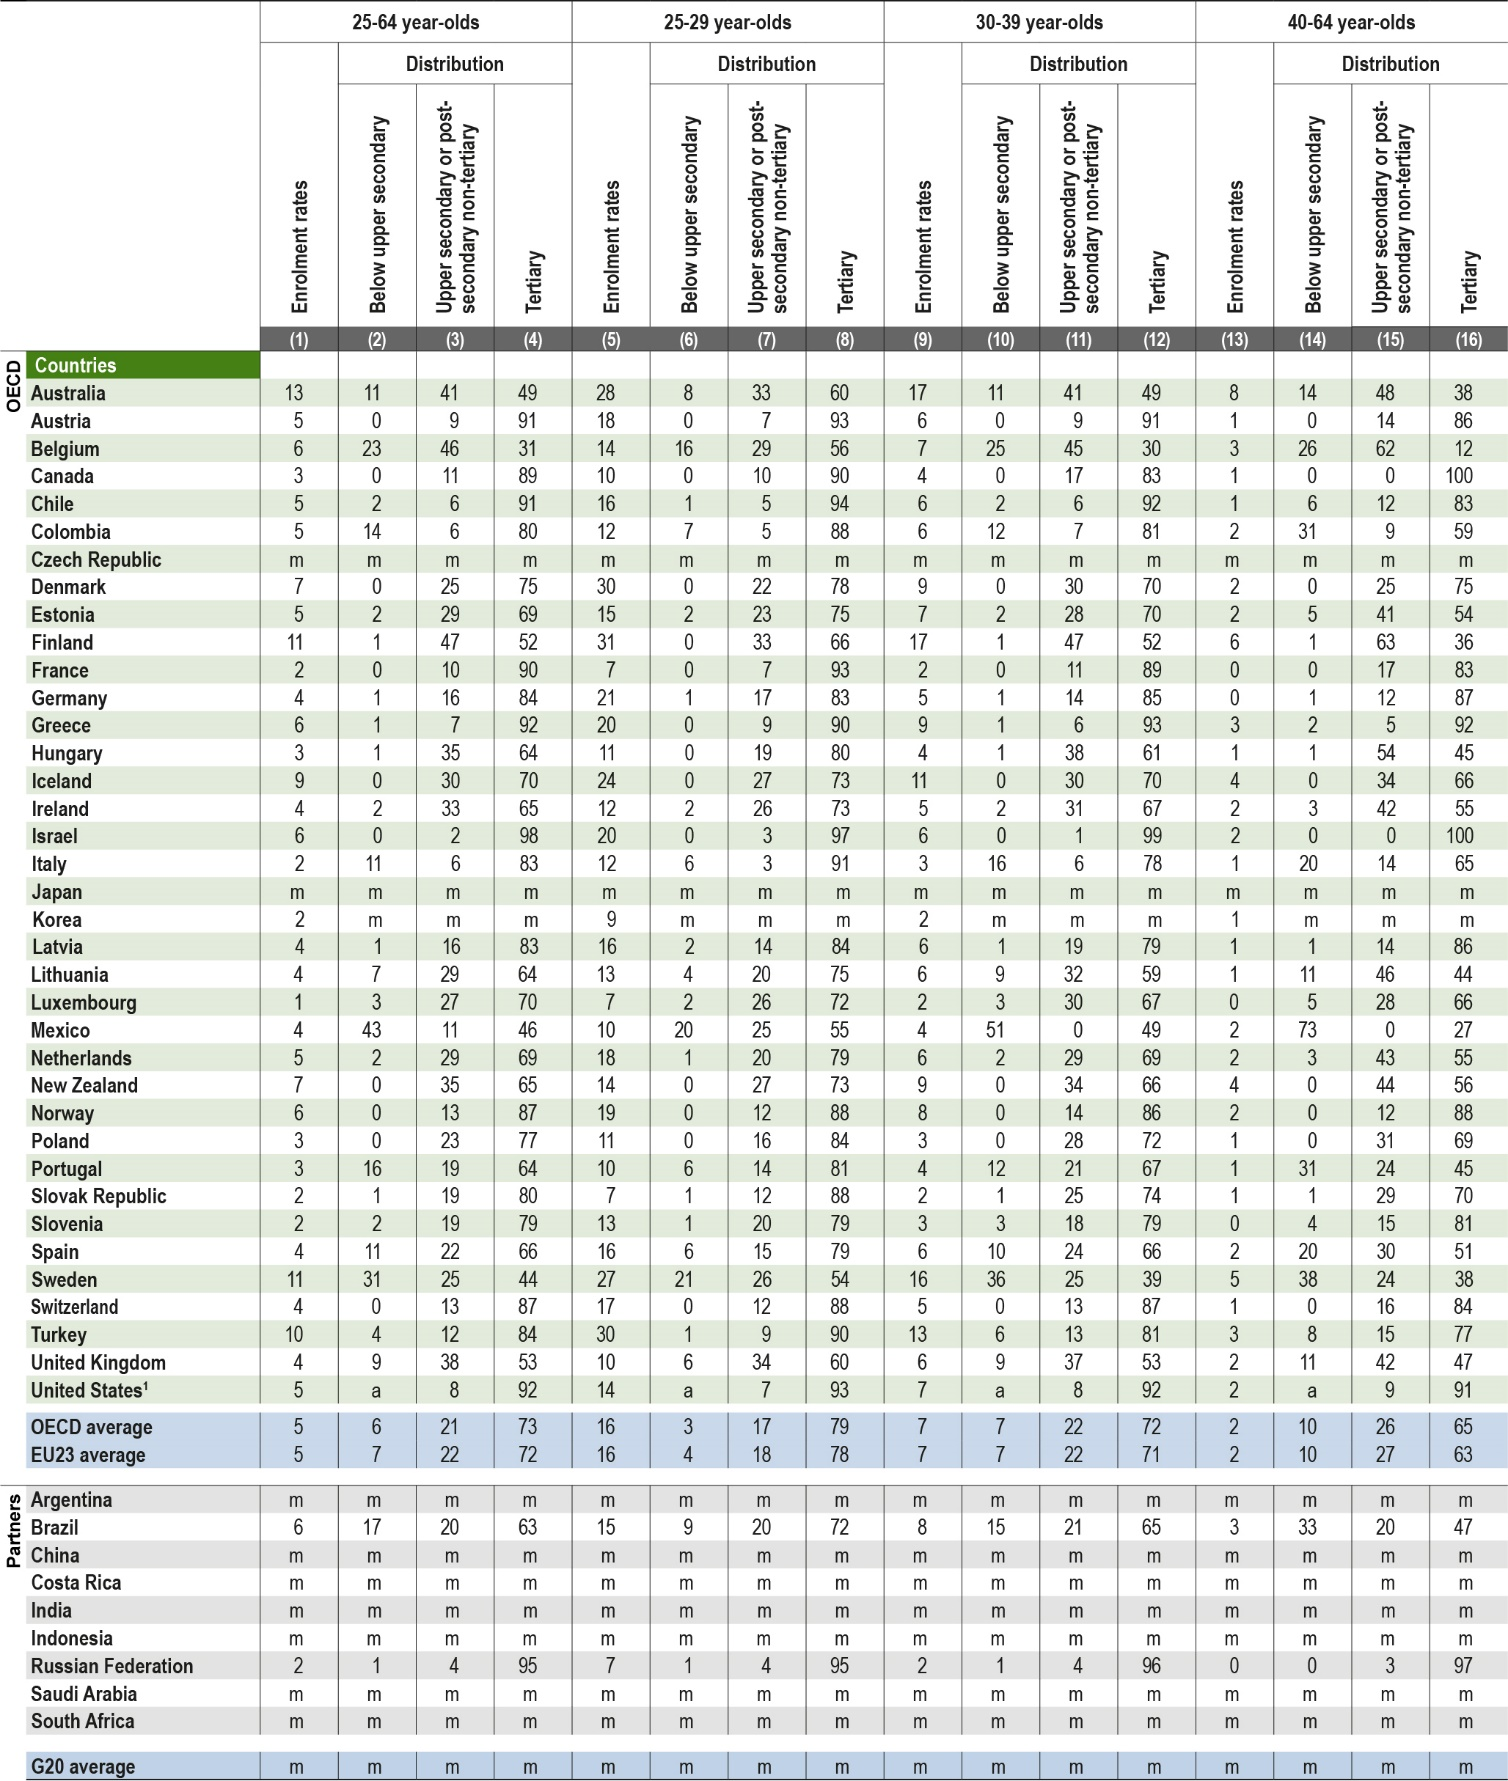
Enrolment in different levels of formal education by age group
The share of adults enrolled in formal education decreases with age, but the distribution of educational levels they are enrolled in remains somewhat similar across the different age groups. On average across OECD countries, 16% of 25-29 year-olds are participating in formal education, 7% of 30-39 year-olds and only 2% of 40-64 year-olds. Across all three age groups, tertiary education is the most common but its share decreases slightly with age: from 79% among 25-29 year-olds, to 72% among 30-39 year-olds and 65% among 40-64 year-olds (Table A7.3).
Across OECD countries, enrolment in formal education among 30-39 year-olds ranges from 2% in France, Korea, Luxembourg and the Slovak Republic to over 15% in Australia, Finland and Sweden. The level of education also shows some substantial differences among countries for this age group. In most countries, tertiary education remains the most important level, indicating the high demand for tertiary education in the labour market. However, in Australia, Belgium, Mexico and Sweden, less than half of participants are enrolled in tertiary programmes. In Australia, Belgium and Finland at least 40% of 30-39 year-olds who are enrolled in formal education are in upper secondary or post-secondary non-tertiary programmes while in Mexico about half of participants are enrolled in below upper secondary education (Figure A7.5 and Table A7.3).
The high enrolment rate of 30-39 year-olds in formal education in Sweden is in line with the national effort to make adult education accessible. Formal adult education, organised at the municipal level, is deep-rooted in Sweden. Its aim is to provide basic adult education for all Swedish residents who are at least 20 years old and have not completed lower secondary education (Eurydice, 2018[5]). In the public education system, adult education and training is free of charge for Swedish citizens (OECD, 2015[6]). Similarly, in Finland, adults are entitled to acquire the same educational and vocational qualifications as the young, and in some cases, young and older students learn together. This may partly explain the higher than average share of 30-39 year-olds enrolled in formal upper secondary or post-secondary non-tertiary programmes in Finland. Finally, providing information and guidance is key to increase participation and inclusiveness. For example, Denmark’s relatively high enrolment rates could be associated with the country’s proactive dissemination of information about general education, higher education and adult/continuing education through the website UddannelsesGuiden (OECD, 2019[7]).
1. Data for upper secondary and post-secondary non-tertiary education enrolment excludes upper secondary education.
Note: The enrolment rates for each level of education is calculated based on the distribution presented in Table A7.3.
Countries are ranked in descending order of the percentage of 30-39 year-olds enrolled in formal tertiary education.
Source: OECD/UIS/Eurostat (2019), Table A7.3. See Source section for more information and Annex 3 for notes (https://doi.org/10.1787/f8d7880d-en).
Definitions
Adults refer to 25-64 year-olds.
Adult education and learning: Formal education is planned education provided in the system of schools, colleges, universities and other formal educational institutions that normally constitutes a continuous “ladder” of full-time education for children and young people. The providers may be public or private. Non-formal education is sustained educational activity that does not correspond exactly to the definition of formal education. Non-formal education may take place both within and outside educational institutions and cater to individuals of all ages. Depending on country contexts, it may cover education programmes in adult literacy, basic education for out-of-school children, life skills, work skills and general culture.
Levels of education: See the Reader’s Guide at the beginning of this publication for a presentation of all ISCED 2011 levels.
The previous classification, ISCED-97, is used for the analyses based on the Survey of Adult Skills (PIAAC): Below upper secondary corresponds to ISCED-97 levels 0, 1, 2 and 3C short programmes; upper secondary or post-secondary non-tertiary corresponds to ISCED-97 levels 3A, 3B, 3C long programmes and level 4; and tertiary corresponds to ISCED-97 levels 5A, 5B and 6.
Methodology
Calculations for data based Adult Education Survey (AES) can be found at: https://circabc.europa.eu/ui/group/d14c857a-601d-438a-b878-4b4cebd0e10f/library/c28a2e5b-ecdf-4b07-ac2f-f3811d032295/details.
For data from the Survey of Adult Skills (PIAAC), the observations based on a numerator with fewer than 5 observations or on a denominator with fewer than 30 observations times the number of categories have been replaced by "c" in the tables.
Source
Tables A7.1, A7.2a and A7.2b on adult education and training are based on:
-
Adult Education Survey (AES) for European OECD countries.
-
The OECD Programme for the International Assessment of Adult Competencies (the Survey of Adult Skills [PIAAC]) for: Canada, Chile, Israel, Japan, Korea, New Zealand, the Russian Federation and the United States.
-
The Survey of Work-Related Training and Adult Learning, Australian Bureau of Statistics, for Australia.
-
Encuesta Continua de Empleo (ECE), Instituto Nacional de Estadística y Censos (INEC), for Costa Rica.
Table A7.2c on participation in distance learning is based on data from the OECD Programme for the International Assessment of Adult Competencies (the Survey of Adult Skills [PIAAC]) for all countries and economies.
Table A7.3 on enrolment in formal education is based on the UNESCO-UIS/OECD/EUROSTAT data collection on education statistics administered by the OECD in 2018 for all countries; all data refer to the academic year 2016/17 (for details, see Annex 3 at https://doi.org/10.1787/f8d7880d-en).
Note regarding data from the Russian Federation in the Survey of Adult Skills (PIAAC)
The sample for the Russian Federation does not include the population of the Moscow municipal area. The data published, therefore, do not represent the entire resident population aged 16-65 in the Russian Federation but rather the population of the Russian Federation excluding the population residing in the Moscow municipal area. More detailed information regarding the data from the Russian Federation as well as that of other countries can be found in the Technical Report of the Survey of Adult Skills, Second Edition (OECD, 2016[8]).
Note regarding data from Israel
The statistical data for Israel are supplied by and are under the responsibility of the relevant Israeli authorities. The use of such data by the OECD is without prejudice to the status of the Golan Heights, East Jerusalem and Israeli settlements in the West Bank under the terms of international law.
References
[2] Borkowsky, A. (2013), “Monitoring adult learning policies: A theoretical framework and indicators”, OECD Education Working Papers, No. 88, OECD Publishing, Paris, https://doi.org/10.1787/5k4c0vxjlkzt-en.
[5] Eurydice (2018), Adult Education and Training - Sweden, https://eacea.ec.europa.eu/national-policies/eurydice/content/adult-education-and-training-80_en (accessed on 19 July 2019).
[4] Kentnor, H. (2015), “Distance education and the evolution of online learning in the United States”, Curriculum and Teaching Dialogue, Vol. 17/1-2, pp. S21-S21.
[7] OECD (2019), Getting Skills Right: Future-Ready Adult Learning Systems, Getting Skills Right, OECD Publishing, Paris, https://dx.doi.org/10.1787/9789264311756-en.
[8] OECD (2016), Technical Report of the Survey of Adult Skills (PIAAC), 2nd Edition, OECD, Paris, http://www.oecd.org/skills/piaac/PIAAC_Technical_Report_2nd_Edition_Full_Report.pdf.
[6] OECD (2015), Education Policy Outlook 2015: Making Reforms Happen, OECD Publishing, Paris, https://dx.doi.org/10.1787/9789264225442-en.
[3] OECD (2014), Education at a Glance 2014: OECD Indicators, OECD Publishing, Paris, https://dx.doi.org/10.1787/eag-2014-en.
[1] OECD (2013), OECD Skills Outlook 2013 : First results from the Survey of Adult Skills, OECD Publishing, Paris, https://doi.org/10.1787/9789264204256-en.
Table A7.1 Participation in formal and/or non-formal education and training, by gender, age group and educational attainment (2016)
Table A7.2a Distribution of non-formal education and training activities, by gender, age group and educational attainment (2016)
WEB Table A7.2b Participation in job-related and non-job-related non-formal education and training, by gender, age group and educational attainment (2016)
WEB Table A7.2c Participation in distance learning among adults participating in non-formal education and training, by gender and age group and educational attainment (2012 or 2015)
Table A7.3 Enrolment in formal education, by age group, and distribution by level of education (2017)
Cut-off date for the data: 19 July 2019. Any updates on data can be found on line at https://doi.org/10.1787/eag-data-en. More breakdowns can also be found at http://stats.oecd.org/, Education at a Glance Database.
StatLink: https://doi.org/10.1787/888933980906
|
Table A7.1. Participation in formal and/or non-formal education and training, by gender, age group and educational attainment (2016)
|
|---|
|
Adult Education Survey (AES), Survey of Adult Skills (PIAAC) or national surveys, 25-64 year-olds
|
 |
|
Note: Participation in formal and/or non-formal education and training during previous 12 months. Additional columns showing data for participation in formal and non-formal education and training separately are available for consultation on line (see StatLink below). Note that the average differs from the one published by Eurostat as this is an unweighted average and the country coverage is different. |
|
1. Year of reference 2012. |
|
2. Year of reference 2015. |
|
* See note on data for the Russian Federation in the Source section. |
|
Source: OECD (2019). See Source section for more information and Annex 3 for notes (https://doi.org/10.1787/f8d7880d-en). |
|
Please refer to the Reader's Guide for information concerning symbols for missing data and abbreviations.. |
|
Table A7.2a. Distribution of non-formal education and training activities, by gender, age group and educational attainment (2016)
|
|---|
|
Adult Education Survey (AES), Survey of Adult Skills (PIAAC) or national surveys, 25-64 year-olds who participated in non-formal education and training activities
|
 |
|
Note: The distribution of non-formal education and training activities refers to the previous 12 months. Additional columns showing the "no response" category and showing data by gender and age group are available for consultation on line (see StatLink below). Note that the average differs from the one published by Eurostat as this is an unweighted average and the country coverage is different. |
|
1. Year of reference 2012. |
|
2. Year of reference 2015. |
|
* See note on data for the Russian Federation in the Source section. |
|
Source: OECD (2019). See Source section for more information and Annex 3 for notes (https://doi.org/10.1787/f8d7880d-en). |
|
Please refer to the Reader's Guide for information concerning symbols for missing data and abbreviations. |
|
Table A7.3. Enrolment in formal education, by age group, and distribution by level of education (2017)
|
|---|
|
OECD/UIS/Eurostat
|
 |
|
1. Data for upper secondary and post-secondary non-tertiary education enrolment excludes upper secondary education. |
|
Source: OECD/UIS/Eurostat (2019). See Source section for more information and Annex 3 for notes (https://doi.org/10.1787/f8d7880d-en). |
|
Please refer to the Reader's Guide for information concerning symbols for missing data and abbreviations. |
Metadata, Legal and Rights
https://doi.org/10.1787/f8d7880d-en
© OECD 2019
The use of this work, whether digital or print, is governed by the Terms and Conditions to be found at http://www.oecd.org/termsandconditions.