
1. Overview and policy highlights
The first manufactured plastic, Parkesine, was developed from cellulose in the mid-19th century and found applications as a clothing waterproofer and as synthetic ivory. Almost half a century later, Bakelite became the first truly synthetic plastic to be developed. However, it was not until 1950 that global plastics production began its unprecedented growth, which has seen it expand 230-fold to the present day.
The rapid growth of plastics is due to their unique properties: high strength-to-weight ratio, high moldability, impermeability to liquids, resistance to physical and chemical degradation, and low cost. They can easily substitute for other materials (such as glass, metal, wood and natural fibres) in a wide range of applications. However, some of the desirable qualities of plastics are also their key limitations. Plastics are highly resistant to physical and chemical degradation, which also means that they can persist as waste in the environment for decades or even centuries.
Concern about the environmental externalities of plastics had already emerged by the 1970s when scientists started observing plastic leakage in the aquatic environment. Numerous beach clean-up and citizen-science initiatives burgeoned to deal with what was seen as a threat to marine wildlife. A 1987 publication, Plastics in the Ocean: More than a Litter Problem, observed that “A growing body of evidence indicates that when discharged, lost or abandoned in the marine environment, plastic debris adversely affects the oceans and their inhabitants in a multitude of ways” (Center for Environmental Education, 1987[1]). Growing evidence for the presence of plastics in the food chain, water supply and the air we breathe has since raised concerns that plastics could be harming human health as well.
Despite this long history, global public concern over plastic leakage has only become widespread in the second decade of the 21st century. A confluence of seminal research and high-profile media focus on plastic waste in the ocean and on land, has catapulted plastics to the centre of public consciousness and preoccupation for the environment. In 2018, “single-use” was the Collins Dictionary “word of the year” (Collins Dictionary, 2018[2]), while 90.5% - the percentage of plastic that has never been recycled - was the Royal Statistical Society’s “statistic of the year” (Royal Statistics Society, 2018[3]).
This surge in public attention has also coincided with a proliferation of local, national and international policy responses. More than 100 countries have imposed restrictions or outright bans on certain single-use plastics. International initiatives to target marine litter and plastic waste have been established under the UN, the G7 and the G20 over the past decade (UNEP, 2020[4]; G7, 2018[5]; G20, 2019[6]). Notably within the G20 process, the Osaka Blue Ocean Vision aims to reduce additional marine plastic litter to zero by 2050. Public-private partnerships and voluntary schemes have been established, with businesses committing to tackle plastic leakage (see Glossary) to the environment, such as the Global Plastics Alliance, and the Alliance to End Plastic Waste, among others (Global Plastics Alliance, 2020[7]; Alliance to End Plastic Waste, 2020[8]).
A global outlook on plastics can help policy makers understand the need for policy action and the scale of the challenge. Plastics are not a homogenous product – they include different polymer types and applications, ranging from drink bottles to cable insulation, food packaging and automotive parts. These various plastics have different lifetimes, recyclability, and risks to the environment and to human health – all of which call for a more granular perspective. In developing a policy agenda, governments would benefit from a stocktake of these aspects, especially as the world emerges from the COVID-19 pandemic.
While a limited number of global stocktakes and projections of plastics along the value chain already exist in the published literature,1 most of them rely on engineering models that describe the lifecycle of plastic commodities in detail, but do not embed these details into a consistent global macroeconomic framework. Existing studies also pre-date the COVID-19 pandemic and do not take into account the disruptions and the potential longer-term implications of the pandemic on plastics use and waste generation. Finally, they generally do not provide a comprehensive overview of the performance of key levers available to decision makers to curb plastics use.
The OECD Global Plastics Outlook develops a regional and sectoral perspective through a comprehensive mapping of material flows and economic drivers throughout the plastics lifecycle. It provides an internally consistent and comprehensive view on production, trade, and use of plastics, as well as plastic waste management and leakage to the environment. This analysis is based on the OECD’s multi-sectoral, multi-regional dynamic computable general equilibrium (CGE) model, ENV-Linkages (Chateau, Dellink and Lanzi, 2014[9]), which has been extended to include plastics in 14 polymer categories and to calculate plastic waste flows.2 Furthermore, the modelling framework has been enhanced to include both primary and secondary (recycled – see Glossary) plastics production. The strength of CGE models such as ENV-Linkages is their ability to embed the drivers of structural change – such as changes in demand patterns, production modes (including increases in recycling activities) and trade specialisation – in a consistent framework. This framework also facilitates a more detailed understanding of the consequences of policy action, as it links the use of plastics to production input in each sector. Annex A describes the modelling approach in more detail.
The Global Plastics Outlook consists of two volumes. This first volume quantifies current plastics production, use, disposal and key environmental impacts throughout the plastics lifecycle. It also examines the impacts of the COVID-19 pandemic on plastics use and waste generation. Furthermore, this volume provides novel analysis of four key levers to improve sustainability and circularity along the plastics value chain: markets for recycled plastics, technological innovation in plastics, domestic policy measures and international co-operation to curb plastics use and waste generation (Box 1.1).
To complement the transversal analysis in this first volume, detailed environmental-economic modelling will be presented in a separate second volume. This second volume makes projections of plastics use, waste and key related environmental impacts to 2060 under a range of scenarios (OECD, forthcoming[10]). The scenario analysis will quantify the environmental benefits and economic consequences of ambitious policy action on plastics, exploring how environmental impacts vary with the stringency of policy action.
Together, the two volumes of the Global Plastics Outlook provide a roadmap towards net-zero plastic leakage and a more circular use of plastics all along the lifecycle.
It provides a first comprehensive mapping of material flows and economic drivers of plastics and develops a regional and sectoral perspective. It does so while taking an internally consistent and comprehensive view on production, trade and use of plastics, as well as on plastic waste management and leakage to the environment.
The modelling framework has a high-level of granularity with the inclusion of primary and secondary plastics production, 14 polymer categories and various applications.
The volumes and processes involved in plastic leakage (for both macroplastics and microplastics) into aquatic and terrestrial environments, as well as greenhouse gas emissions are estimated.
It is the first report to analyse how plastics use and waste have been affected by the COVID-19 pandemic across sectors and regions, and the potential implications for the years to come.
It offers a first-of-its-kind empirical analysis of environmentally relevant plastics innovation, presented along the entire value chain. The analysis exploits textual analysis methods on patent and trademark data to derive insights into the trends and dynamics in environmentally relevant plastics innovation, with a special focus on the most prolific innovators.
It develops an inventory of the global plastics policy landscape, based on an in-depth investigation of economic instruments and regulations in 50 different (OECD and non-OECD) countries. This inventory systematically catalogues and categorises policies to allow important insights into their potential to curb plastic waste.
It assesses the global financial costs of drastic action in low and middle-income countries, and benchmarks these costs to the available funding from official development assistance to facilitate making the required investments and building up the necessary policy frameworks.
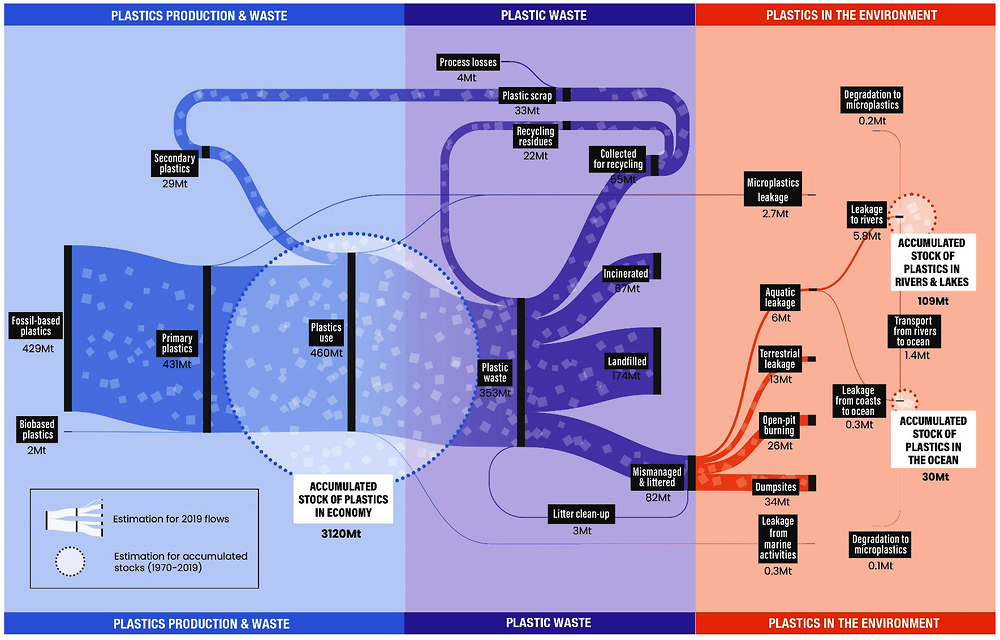
This section presents key findings from the report for the entire plastics lifecycle in 2019, from production and accumulation in the economy, to their end-of-life fate and leakage into the environment. Figure 1.1 helps visualise the complex interactions that plastics are subject to throughout their lifecycle and places the numbers presented below in context.
1.3.1. The current plastics lifecycle is far from circular
Population growth and higher incomes have driven up global plastics production, which has doubled, soaring from 234 million tonnes (Mt) in 2000 to 460 Mt in 2019. In this same period, the growth of plastics volumes outpaced economic growth by almost 40%. While COVID-19 temporarily curtailed this growth, it is likely to rebound once again, though with a slight shift in use and waste trends (Box 1.2).
Global annual plastic waste has more than doubled, from 156 Mt in 2000 to 353 Mt in 2019. Almost two-thirds of all plastic waste comes from applications with lifespans of less than five years: packaging (40%), consumer products (12%) and textiles (11%). Only 55 Mt of this waste was collected for recycling, but 22 Mt ended up as a recycling residue that needed further disposal. Ultimately, 9% of plastic waste was recycled, 19% was incinerated and almost 50% went to sanitary landfills. The remaining 22% was disposed of in uncontrolled dumpsites, burned in open pits or leaked to the environment.
Source: OECD Global Plastics Outlook Database, https://doi.org/10.1787/c0821f81-en.
1.3.2. Mismanaged plastic waste is the main source of macroplastic leakage
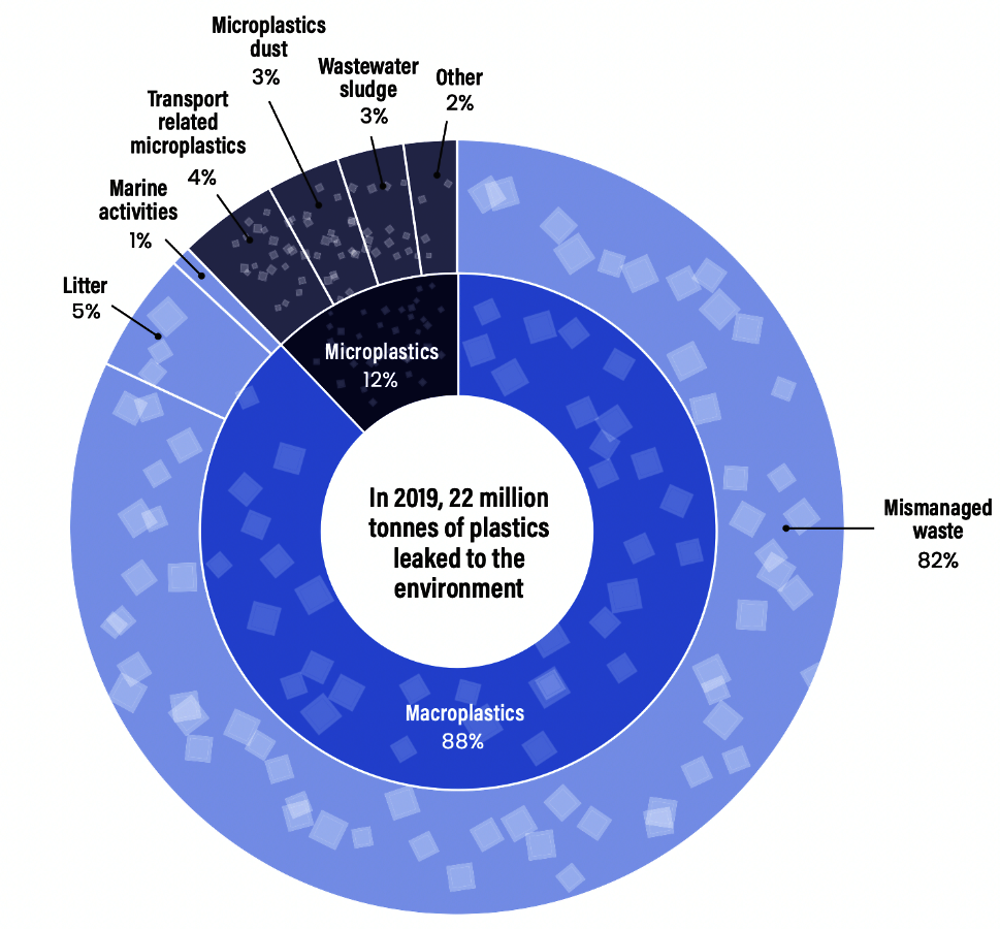
Widespread plastics use coupled with inadequate end-of-life disposal resulted in 22 Mt of plastic materials leaking into the environment in 2019 (Figure 1.2), contributing to persistent plastic pollution. The vast majority (19.4 Mt) are macroplastics (see Glossary), and most (82%) found their way into the natural environment as a result of inadequate collection and disposal. Other leakage routes include littering or fly-tipping (5%), and marine activities (1%). Microplastics (see Glossary) also make up a sizeable share of total leakage (12%), largely reaching the environment through wear to tyres and road markings, as well as the accidental loss of plastic pellets and washing of synthetic textile fibres.
Leakage occurs in all regions, but there are significant geographical differences in leakage drivers. OECD countries contribute 14% to the global leakage but 36% of microplastic leakage. Non-OECD countries account for 86% of the plastic leakage, driven mainly by the high amount of mismanaged waste ending up in the environment. This problem is becoming worse as leakage from mismanaged waste has more than doubled since 2000. These numbers stress the urgency of addressing waste management practices in rapidly growing economies, while taking into account littering and the steadily increasing microplastic leakage around the world.
Source: OECD Global Plastics Outlook Database, https://doi.org/10.1787/c0821f81-en.
1.3.3. The 30 Mt of plastics accumulated in the ocean, and 109 Mt in rivers, will pollute aquatic environments for decades to come
Plastic leakage is fundamentally altering marine and terrestrial ecosystems, whilst also posing substantial risks to human livelihoods that depend on the integrity of such environments, such as tourism and fishing. Plastics are also a source of concern for human health through the leaching or adsorption of hazardous chemicals, as well as their bio-accumulation in substances and organisms consumed by humans. In 2019 alone, 6.1 Mt of plastic waste leaked into rivers, lakes and the ocean. As the bulk of plastics reach the ocean through rivers via a slow process that can take years or even decades, 109 Mt of plastics are estimated to have accumulated in rivers globally to date, with 1.7 Mt flowing into the ocean in 2019 (Figure 1.1). Cleaning up these plastics from nature is becoming more difficult and costly as plastics fragment into ever smaller particles.
The pandemic has altered previous trends in plastics use in myriad ways; however, there were two main, and opposing, trends:
On the one hand, global demand for certain plastics applications grew significantly. This is particularly true of the healthcare sector, partly driven by the ubiquitous demand for personal protective equipment (PPE). Plastics use for face masks is estimated to be around 300 thousand tonnes in 2020. Similarly, the COVID-19 pandemic also significantly altered economic activity and demand patterns, with a shift in demand towards take-away foods and e-commerce, which use significant amounts of single-use plastics and plastic packaging.
On the other hand, the substantial decrease in overall economic activity during the pandemic saw use of most plastics fall, with especially large reductions in wholesale and retail trade, motor vehicle manufacture and construction. These three sectors alone reduced plastics use by an estimated 8.2 Mt in 2020.
The overall effect of these countervailing trends was that 2020 saw plastics use decrease overall from 2019 levels by an estimated 2.2%, although data sources are still relatively weak. However, as the decrease in plastics use was less substantial than the decline in global economic activity, the plastics intensity of the economy increased in 2020 on average.
The COVID-19 pandemic also disrupted global progress in the transition to a resource-efficient and circular economy. Many municipalities suspended recycling temporarily due to fears about contamination; recycling value chains were disrupted; and some studies also point to a decrease in waste sorting by households during the pandemic. In the short-run it is likely that certain applications saw waste levels increase, such as medical and household plastic waste. However, the shrinking of commercial activity meant less packaging use, which is likely to have dampened that increase. Nonetheless, the switch to single-use plastics likely increased plastic leakage, with an estimated 1.6 billion face masks entering the ocean in 2020 alone (Bondaroff and Cooke, 2020[11]).
Several impacts of the pandemic on plastic waste may be long lasting. Reduced plastics use in areas such as construction and automobiles could affect the composition of plastic waste for decades to come given the long lifespan of many plastics used in these sectors. On the other hand, littered PPE such as single-use facemasks could stay with us for the foreseeable future given their resistance to degradation. If the pandemic-induced changes to human behaviour endure, these effects could be felt well beyond the end of the pandemic. Nevertheless, although the COVID-19 pandemic may permanently leave its mark on cumulative plastics volumes, the upward trajectory of plastics use, waste generation and leakage will likely resume as economies enter the recovery stage and economic activity picks up again.
1.3.4. The carbon footprint of the plastics lifecycle is significant
Beyond the hazards posed to the marine and terrestrial environment as well as to humans, plastics are also a substantial contributor to global greenhouse gas emissions. In 2019, plastics generated 1.8 gigatonnes (Gt) of greenhouse gas (GHG) emissions – 3.4% of global emissions – with 90% of these emissions coming from their production and conversion from fossil fuels. Closing material loops could lower the carbon footprint of plastics substantially. The use of bioplastics derived from biomass, such as corn, sugarcane, wheat or residues of other processes, could also reduce GHG emissions from plastics production. However, there are important concerns about the indirect environmental effects from the production of the required agricultural feedstock.
As countries seek to rebound from the COVID-19 pandemic and put their economies on a more sustainable path, what levers are available to curb plastics use and reduce the related environmental challenges? The Global Plastics Outlook identifies four critical levers for “bending the plastic curve”: recycled (secondary) plastics markets, technological innovation for more circular plastics value chains, more coherent and ambitious domestic policy measures and greater international co-operation.
1.4.1. Combine push and pull policies to support recycled plastics markets
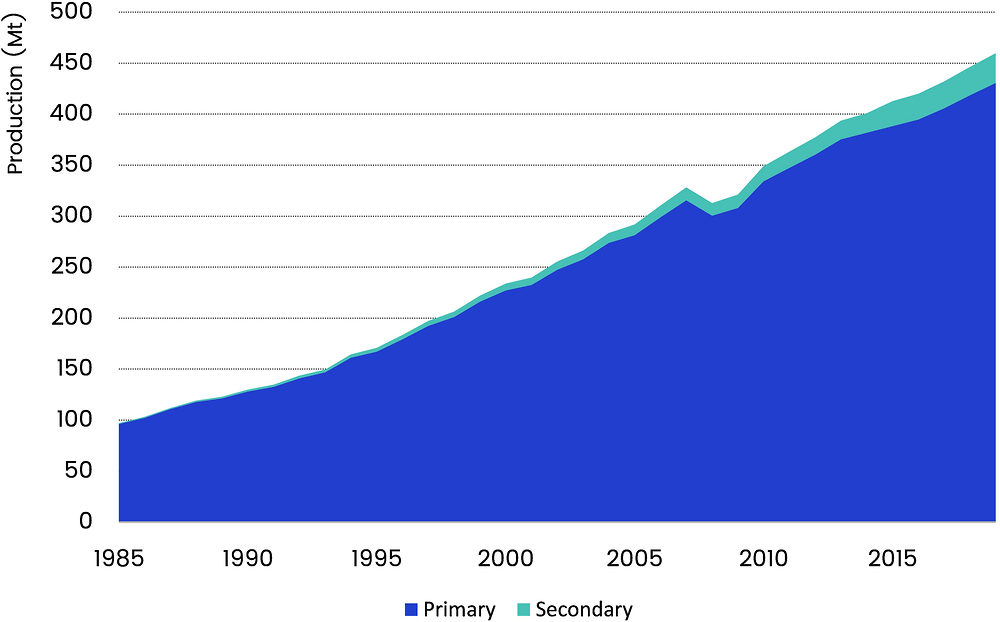
Recycling has an important role to play in lowering the environmental footprint of plastics, diverting material from more harmful waste management practices and helping to decrease demand for primary equivalents. Yet secondary plastics, i.e. plastics produced from recycled end-of-life plastic items, currently only account for 6% of the feedstock for new plastics produced globally. This is despite the fact that global production of secondary plastics has more than quadrupled in two decades, from 6.8 Mt in 2000 to 29.1 Mt in 2019 (Figure 1.3).
Source: OECD Global Plastics Outlook Database, https://doi.org/10.1787/c0821f81-en.
Recycling markets are the fora of exchange for the numerous actors involved at different points in the supply chain, including the public sector, firms, traders (exporters and importers), brokers, and ultimately manufacturers. Markets allocate recycled plastics to the use with the highest value and create a profit motive that incentivises higher recycling rates. The larger the scale and depth of the markets, the better secondary materials are able to compete with primary equivalents, in turn driving the environmental benefits of recycling. However, although global production of secondary (recycled) plastics has more than quadrupled, secondary plastics are still mainly considered substitutes for primary plastics, rather than a valuable resource in their own right. In addition, fluctuations in the price of primary material, which secondary plastics track closely, can greatly affect the economic viability of recycling due to the disconnect between secondary price and the costs of secondary production (e.g. collection, sorting, and processing). Thus, the secondary plastics market is small and vulnerable.
Another barrier inhibiting the growth of secondary plastics is the quality of plastic waste collected. The wide range of polymers and additives (including hazardous chemicals) used in the manufacture of plastics means that polymers in plastic waste are often co-mingled and contaminated. Moreover, if not sorted properly, plastic waste is of little value for secondary material production due to the difficulty of extracting impurities and the limited range of potential applications.
Regulation strongly affects the business case for recycling and the market for secondary plastics. Plastics are only recycled on a large scale if it is profitable to do so. Economic and regulatory policy instruments can ensure a business case for collecting and recycling plastic waste. Moreover, incentivising sorting at source is a critical lever because the quality of sorting determines the purity and value of recycled materials, and therefore the profitability of recycling operations. High landfill and incineration taxes are strong drivers of recycling, as are landfill bans. However, weak environmental standards or enforcement will reduce recycling rates and may result in mismanaged waste (OECD, 2018[12]).
In order to foster secondary plastics markets, several countries have recently strengthened policies to simultaneously “push” supply (for example, through extended producer responsibility schemes) and “pull” demand (e.g. via recycled content targets). The recent decoupling of prices for primary and secondary polyethylene terephthalate (PET) (mainly for food-grade applications) in Europe and increasing innovation in recycling technologies are positive signs that these policies are helping to strengthen secondary markets.
Furthermore, the regulatory environments that govern markets for secondary plastics have undergone important transformations since 2017 when the People’s Republic of China (hereafter China) introduced its National Sword policy, banning most imports of plastic waste. These and subsequent import restrictions have shifted trade away from traditional destinations to new markets, while simultaneously decreasing international trade volumes and increasing the need for domestic recycling capacities. Modifications in international law, such as the amendments to the Basel Convention3 and the OECD Decision on Transboundary Movements of Waste,4 are expected to reinforce these trends and to lead to further on-shoring of waste plastic recycling in advanced economies.
1.4.2. Do more to boost innovation in environmental plastics
The second lever, innovation, can deliver significant environmental benefits throughout the lifecycle of plastics, for example by reducing the amount of virgin material needed, prolonging the useful life of materials and facilitating recycling. As part of the Global Plastics Outlook, a novel approach was developed to unpack the dynamics governing innovation in sustainable plastics technologies. Trends in innovation can help in identifying both the distribution of innovation in the plastics lifecycle, the geographic hotspots of plastics innovation, as well as the possible policy environments that lead to the emergence of intensified innovative activity. Analysis of patent data shows that innovation for more sustainable plastics is increasing, with patented technologies in this area increasing by a factor of 3.4 over 1990-2017. OECD countries and China generated 80% of these innovations; the transfer of these technologies to other countries needs to be accelerated.
There is also a shift occurring in innovation focus from waste prevention to plastics recycling, potentially due to policy emphasis on the latter and higher consumer willingness to pay for products made out of recycled plastics. About half of all environmentally relevant innovations patented in 2017 focused on plastics circularity, i.e. on the prevention and recycling of plastic waste. One-third were related to biobased feedstock, and the remainder were aimed at the conversion or disposal of waste as well as the removal of plastics leaked into the natural environment. Innovation in biodegradable plastics, which grew rapidly during the last decade, has recently slowed down likely due to concerns about poor biodegradation in natural environments. Plastic-to-plastic chemical recycling, which aims to recycle waste that cannot be processed with mechanical recycling, is an emerging technology but faces significant challenges.
Although innovation in environmentally relevant plastics technologies is growing, it still only makes up a minor share of all plastics-related innovation. Indeed, innovation in waste prevention and recycling accounted for only 1.2% of plastics innovation in 2017. Quantitative evidence for plastics recycling suggests that circular economy policies (e.g. EPR schemes) can incentivise innovation effectively; however more ambitious policies are needed to orient technological change towards closing plastics loops and reducing leakage to the environment. These policies should combine investments in innovation with interventions aimed at increasing demand for circular solutions, while restraining plastics consumption overall.
1.4.3. Strengthen the ambition of domestic public policies
Public policies are a key lever for reducing the environmental consequences of plastics production and use. The OECD has recently developed an inventory of policies to analyse economic and regulatory policy instruments that are exclusively focused on plastics, as well as broader instruments that target products and waste streams, such as municipal solid waste (MSW), that contain important fractions of plastics. It covers 50 countries: the 38 OECD member countries, and 12 non-OECD countries selected for the size of their populations and their geographic coverage (Brazil, China, India, Indonesia, Russia and South Africa, as well as several countries with large populations in South-East Asia and Africa).5 Overall, the inventory covers 69% of the world’s population and 84% of global Gross Domestic Product (GDP).
Analysis of this inventory of policies suggests that the current plastics policy landscape is fragmented and can be strengthened significantly. Only 13 countries (representing 4% of the population covered by the inventory) have national policy instruments in place that provide direct financial incentives to sort plastic waste at source. Similarly, only 25 countries (representing 11% of the population covered by the inventory) have implemented well-known instruments to encourage recycling, such as national landfill and incineration taxes. Globally, bans and taxes on single-use plastic items exist in more than 120 countries, but their effectiveness for reducing plastic leakage can be improved. Most regulations are limited to single-use plastic bags or other streams that are small in volume. This means that these instruments are mainly effective in reducing leakage via littering, rather than restraining overall consumption of plastics. Moreover, poor implementation or shifts to alternative materials with larger environmental footprints sometimes reduce the potential benefits of these policies.
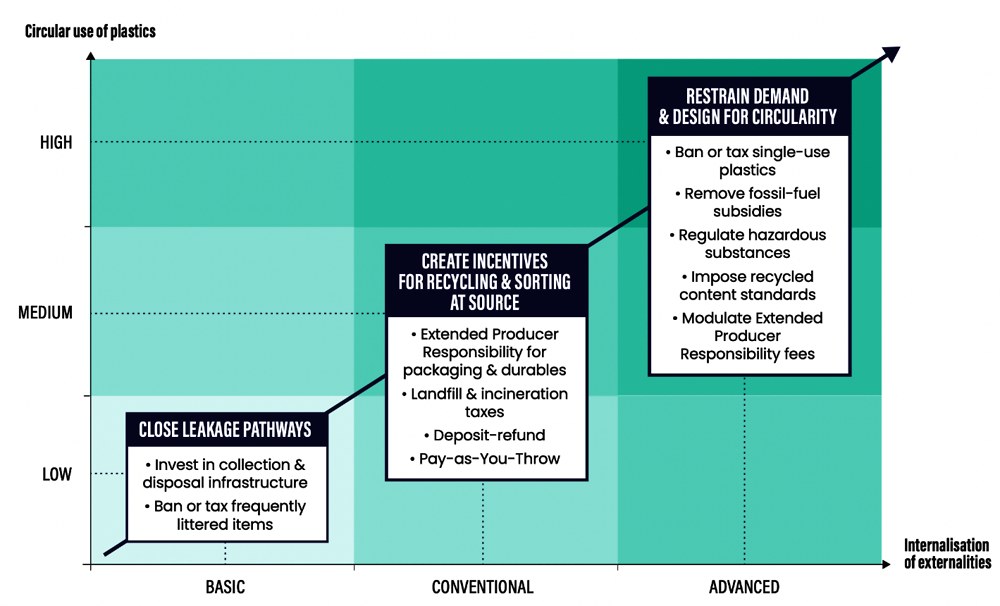
Drawing on this assessment a policy roadmap is proposed (Figure 1.4). It involves three increasingly ambitious phases:
1. Close leakage pathways: Investing in basic waste management infrastructure and developing legal frameworks that steer economic actors towards environmentally sound management of plastic waste are key first steps within any national context. Organising waste collection, structurally reducing plastics littering by enlarging the scope of anti-littering policies (bans or taxes of frequently littered items) to cover a broader set of items and enhancing implementation of legislation are also key for closing plastic leakage pathways.
2. Create incentives for recycling and enhance sorting at source. Recycling plastics only occurs on a large scale if it is profitable. Policy makers can apply taxes to landfill and incineration to make recycling more cost competitive. By also imposing EPR, policy makers can make producers responsible for recycling packaging and durable products such as cars, batteries, tyres and electronics. As the quality of collected waste streams drives the feasibility and profitability of recycling, countries can achieve much greater circularity by sharpening the financial incentives to sort waste at source. Deposit-refund systems give a strong financial incentive to return beverage bottles, while pay-as-you-throw makes mixed waste disposal by households more costly. If combined with policies to avoid dumping and contaminating other waste streams, making households pay per bag or kilo of mixed waste is an effective way to incentivise sorting at source.
3. Restrain demand and optimise design to make plastic value chains more circular and recycled plastics more price competitive. The largest environmental gains can be achieved by reducing the use of virgin materials and by improving product design (Watkins et al., 2019[13]). Removing support schemes for fossil-based plastics, such as shale gas subsidies (OECD, 2016[14]), will make plastic value chains more circular by restraining consumption and by making recycled plastics more price competitive. By removing hazardous substances and recycling inhibitors from plastics at the design stage, chemical hazards can be avoided and recycling rates can be increased. Upstream policy instruments, such as plastics taxes, recycled content targets and EPR with fee modulation can all create financial incentives to reduce use and foster circularity. Their impact could be improved considerably by extending them to more product types and more countries.
1.4.4. Strengthen international co-operation to make plastics value chains more circular and achieve net zero plastic leakage
National efforts to address the challenges linked to the use of plastics will need to be supplemented with international co-operation for several reasons:
1. The environmental consequences of plastics polluting water bodies are often transboundary and threaten the global commons, such as the ocean.
2. Plastics are shipped across the world as materials, products and waste streams, and supply chains are spread across the globe – policy responses would be more effective if co-ordinated internationally.
3. Tackling both the upstream and downstream environmental challenges posed by plastics requires innovation and investment on a significant scale, all of which can be accelerated through international co-operation.
The international community has voiced strong ambitions to limit the leakage of plastics to the environment and momentum is building to strengthen international co-operation to address environment and health impacts throughout the entire plastics life cycle. Improving waste management to reduce land-based sources of marine plastic is recognised as one of the priorities for action, alongside upstream measures to restrain excessive use of plastics, foster design for circularity and promote reuse. For example, given the global nature of the plastics value chains, aligning regulation of chemical substances and design approaches across countries can reduce health risks and improve circularity.
Mismanaged waste is by far the largest source of plastic leakage. Macroplastics account for almost 90% of total leakage, with land-based leakage coming from improper waste management practices accounting for 93% of all macroplastics. Since the bulk of mismanaged macroplastic waste occurs in low and middle-income countries, the investments needed in these countries are particularly large. Estimates presented in this Outlook suggest that annual costs, of more than EUR 25 billion a year, are needed to drastically reduce plastic leakage in low- and middle-income countries. The annual costs represent 0.3% of low and lower middle-income countries’ GDP and would be an important financial burden, especially for the group of least developed countries.
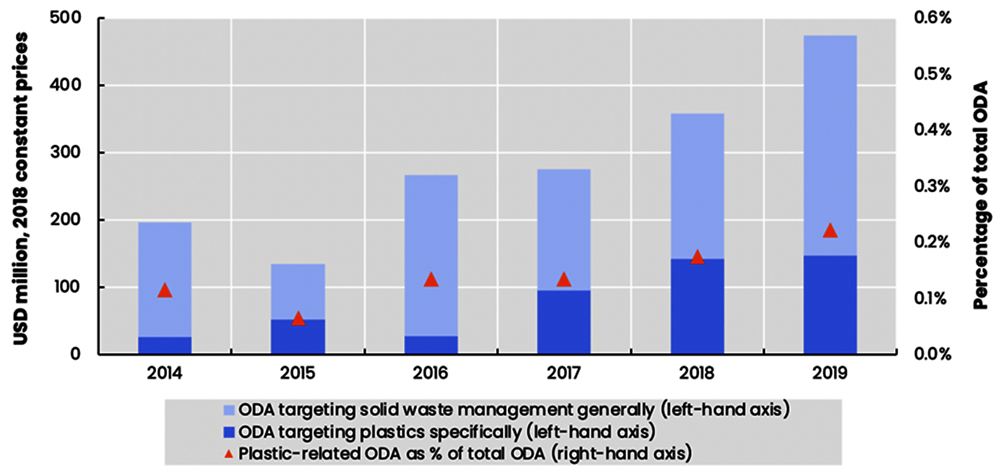
International support will be instrumental in accelerating the investments required in infrastructure and changes to waste management practices, policies and governance. Official development assistance (ODA) could be one avenue for such support. However, the share of plastic-related ODA in total ODA spending remains marginal, accounting for only 0.2% of ODA gross commitments in 2017-19 (Figure 1.5).
Beyond ODA, additional sources of funding will need to be tapped to provide adequate and sustainable levels of funding, including revenue from households and firms benefiting from public waste management services, as well as domestic government subsidies and private sector investment. Enabling policy frameworks and governance mechanisms will need to be put in place to ensure that resources are used effectively. International support and local political leadership will be crucial in facilitating the required investments and governance structures for high-quality infrastructure.
Source: Own calculations based on (OECD, 2021[15]), OECD Data Platform on Development Finance for the Sustainable Ocean Economy and the OECD’s Creditor Reporting System, https://stats.oecd.org/Index.aspx?DataSetCode=crs1.
References
[18] Aguiar, A. et al. (2019), “The GTAP Data Base: Version 10”, Journal of Global Economic Analysis, Vol. 4/1, pp. 1-27, https://doi.org/10.21642/jgea.040101af.
[8] Alliance to End Plastic Waste (2020), Alliance to End Plastic Waste, https://endplasticwaste.org/about/ (accessed on 1 November 2020).
[17] Benavides, P. et al. (2018), “Exploring Comparative Energy and Environmental Benefits of Virgin, Recycled, and Bio-Derived PET Bottles”, ACS Sustainable Chemistry & Engineering, Vol. 6/8, pp. 9725-9733, https://doi.org/10.1021/acssuschemeng.8b00750.
[11] Bondaroff, T. and S. Cooke (2020), Masks on the Beach: The Impact of COVID-19 on Marine Plastic Pollution, OceansAsia, https://oceansasia.org/wp-content/uploads/2020/12/Marine-Plastic-Pollution-FINAL.pdf.
[22] Borrelle, S. et al. (2020), “Predicted growth in plastic waste exceeds efforts to mitigate plastic pollution”, Science, Vol. 369/6510, https://doi.org/10.1126/science.aba3656.
[1] Center for Environmental Education (1987), Plastics in the Ocean: More Than a Litter Problem, Center for Environmental Education, Washington D.C.
[9] Chateau, J., R. Dellink and E. Lanzi (2014), “An Overview of the OECD ENV-Linkages Model: Version 3”, OECD Environment Working Papers, No. 65, OECD Publishing, Paris, https://doi.org/10.1787/5jz2qck2b2vd-en.
[2] Collins Dictionary (2018), Collins 2018 Word of the Year Shortlist, https://blog.collinsdictionary.com/language-lovers/collins-2018-word-of-the-year-shortlist/ (accessed on 22 October 2021).
[25] Ellen MacArthur Foundation (2017), The New Plastics Economy: Rethinking the Future of Plastics & Catalysing Action, https://ellenmacarthurfoundation.org/the-new-plastics-economy-rethinking-the-future-of-plastics-and-catalysing.
[6] G20 (2019), G20 Implementation Framework for Actions on Marine Plastic Litter, https://www.mofa.go.jp/policy/economy/g20_summit/osaka19/pdf/documents/en/annex_14.pdf (accessed on 1 November 2021).
[5] G7 (2018), Ocean Plastics Charter, https://www.consilium.europa.eu/media/40516/charlevoix_oceans_plastic_charter_en.pdf (accessed on 1 November 2021).
[19] Geyer, R., J. Jambeck and K. Law (2017), “Production, use, and fate of all plastics ever made”, Science Advances, Vol. 3/7, p. e1700782, https://doi.org/10.1126/sciadv.1700782.
[7] Global Plastics Alliance (2020), Marine Litter Solutions - 5th Progress Report, https://www.marinelittersolutions.com/wp-content/uploads/2020/08/ACC_12376_2020-Marine-Litter-Solutions_V5_Pages_NoCropsBleeds.pdf (accessed on 1 November 2020).
[20] Jambeck, J. et al. (2015), “Plastic waste inputs from land into the ocean”, Science, Vol. 347/6223, pp. 768-771, https://doi.org/10.1126/science.1260352.
[21] Lebreton, L. and A. Andrady (2019), “Future scenarios of global plastic waste generation and disposal”, Palgrave Communications, Vol. 5/1, p. 6, https://doi.org/10.1057/s41599-018-0212-7.
[15] OECD (2021), Trends of ODA for a sustainable ocean economy, OECD, Paris, https://oecd-main.shinyapps.io/ocean/.
[12] OECD (2018), Improving Markets for Recycled Plastics: Trends, Prospects and Policy Responses, OECD Publishing, Paris, https://dx.doi.org/10.1787/9789264301016-en.
[14] OECD (2016), Policy Guidance on Resource Efficiency, OECD Publishing, Paris, https://dx.doi.org/10.1787/9789264257344-en.
[10] OECD (forthcoming), Global Plastics Outlook, Volume 2, OECD.
[3] Royal Statistics Society (2018), Statistics of the Year 2018: Winners announced, https://rss.org.uk/news-publication/news-publications/2018/general-news/statistics-of-the-year-2018-winners-announced/ (accessed on 22 October 2021).
[23] Ryberg, M., A. Laurent and H. Michael (2018), “Mapping of global plastics value chain and plastics losses to the environment: with a particular focus on marine environment”, UNEP.
[16] Stefanini, R. et al. (2020), “Plastic or glass: a new environmental assessment with a marine litter indicator for the comparison of pasteurized milk bottles”, The International Journal of Life Cycle Assessment, Vol. 26/4, pp. 767-784, https://doi.org/10.1007/s11367-020-01804-x.
[24] The Pew Charitable Trust; SYSTEMIQ (2020), Breaking The Plastic Wave: A Comprehensive Assessment of Pathways Towards Stopping Ocean Plastic Pollution, https://www.systemiq.earth/wp-content/uploads/2020/07/BreakingThePlasticWave_MainReport.pdf.
[4] UNEP (2020), Global Partnership on Marine Litter, https://www.unenvironment.org/explore-topics/oceans-seas/what-we-do/addressing-land-based-pollution/global-partnership-marine (accessed on 1 November 2020).
[13] Watkins, E. et al. (2019), “Policy approaches to incentivise sustainable plastic design”, OECD Environment Working Papers, No. 149, OECD Publishing, Paris, https://dx.doi.org/10.1787/233ac351-en.
Notes
← 1. Including (Geyer, Jambeck and Law, 2017[19]; Jambeck et al., 2015[20]; Lebreton and Andrady, 2019[21]; Ryberg, Laurent and Michael, 2018[23]; The Pew Charitable Trust; SYSTEMIQ, 2020[24]; Borrelle et al., 2020[22]; Ellen MacArthur Foundation, 2017[25]).
← 2. The Annex provides more details on the production structure, as well on the sectoral and regional aggregation of the model.
← 3. Amendments to Annexes II, VIII and IX to the Basel Convention on the Control of Transboundary Movements of Hazardous Wastes and their Disposal came into force on the 1 January 2021.
← 4. Modifications to Appendices 3 and 4 of the OECD Decision of the Council on the Control of Transboundary Movements of Wastes Destined for Recovery Operations [OECD/LEGAL/0266] came into force on the 1 January 2021.
← 5. These additional countries are Egypt, Ghana, Morocco, Nigeria, the Philippines, and Thailand.