Chapter 3. The role of national statistical systems in the data revolution1
The supply of relevant, timely and usable data is essential for countries to set priorities, make informed choices and implement better policies for sustainable development. This chapter looks at how national statistical systems in developing countries can and should harness the data revolution. It explores the opportunities, enablers and challenges countries face in using big data and other new sources of data. The chapter reviews developing country capacity, gaps and strategies for putting in place the right data for policy making. It also presents selected examples of how the data revolution is already fuelling better statistics in developing countries. The chapter considers the role of governments as well as the opportunities offered by public-private partnerships. It enumerates the key conditions for building capable statistical systems and proposes steps to be taken by national statistical offices, policy makers and international development partners.
Key facts
-
The 2010 Population Census Round, conducted between 2005 and 2014, was one of the great successes of national and international statistical efforts. Only 21 countries did not conduct a census (UNFPA, 2016a). An estimated 6.4 billion people (93% of the world’s population) were enumerated (UNFPA, 2016b).
-
The 2020 census round has already begun. Thirty-nine countries (including some that missed earlier rounds) are expected to prepare for or conduct censuses in 2017; some 200 more will need to complete censuses between 2018 and 2024.
-
Many low and middle-income countries are using outdated base years for national accounts and price statistics while the lack of recent agricultural surveys or censuses limit their ability to produce reliable economic statistics.
-
According to the World Health Organization’s Global Health Observatory, “Only 34 countries – representing 15% of the world population – produce high-quality cause-of-death data… A further 85 countries – representing 65% of the world population – produce lower quality cause-of-death data, while 75 countries lack such data altogether” (WHO, n.d.).
-
To seize the opportunities presented by the data revolution, statistical offices will need to invest in new technology and production processes and establish partnerships with new actors.
Advances in the ability to manage, exchange, combine and analyse data of all types, and to disseminate statistical information on line, are changing the way traditional statistical processes are carried out. National statistical offices can and should play a critical role in harnessing the data revolution for sustainable development. To be effective in stimulating data use and evidence-based decision making, they must also improve data accessibility by adopting open data policies.
However, there are still large differences in the capabilities of statistical systems. Despite some progress made over the past decade, many countries still lack the means and infrastructure to produce high-quality data. To enable national statistical systems to respond to the demands of data users, notably policy makers, it is critical that providers of development co-operation and developing countries alike increase their support for national statistical offices, strengthen the use and production of statistics, and change their mind-sets towards producing and using more open, transparent and action-oriented data.
The data revolution is fuelling better data in developing countries
The size and scope of the data revolution can be gauged by the exponential increase of on line digital information; by the growth of new occupations described as data scientist, data activist or data evangelist; and by the manifold impacts of digital information on our daily lives. Revolutions are, by their nature, disruptive, and the data revolution has already disrupted traditional modes of production, human interaction and public discourse. Yet a revolution can also overcome enduring barriers and solve long-standing problems, bringing benefits to people previously left out, left behind or forgotten.
The data revolution has the potential to transform the operations of national statistical systems in rich and poor countries alike.
The data revolution has the potential to transform the operations of national statistical systems in rich and poor countries alike. It is often described in terms of the vast increase in the volume of digital data, called “big data”, but it is more than big data. Innovative technologies have decreased the cost and increased the speed of data collection and data dissemination, responding to the growing demand for actionable, empirical information. When, for example, a World Bank project in Guatemala used entry-level mobile phones and free web-based software for data collection, it cut the average cost per interview by 71%. The project could, as a result of lower costs, increase the survey’s sample size from 200 to 700 respondents, including from remote and marginalised areas highly populated by indigenous people, making the survey nationally representative.2
There are signs that the national statistical systems of developing countries are already embracing the data revolution and starting to make use of new technologies and methods. Far from being reluctant followers, many statistical offices are enthusiastic leaders. The following examples illustrate the exciting opportunities for development partners to engage in new and fruitful enterprises.
Combining traditional and unconventional data sources can fill statistical gaps
The United Nations (UN) Global Working Group on Big Data for Official Statistics is working with countries and their private sector partners to demonstrate the use of unconventional data sources to supplement official statistics. While many projects are still in the pilot phase, they are already demonstrating that insights can be obtained by combining data from traditional sources – such as censuses, surveys or administrative data – with information from new, big data sources. Statistics South Africa, for example, is assessing the use of detailed scanner data from retail chains as inputs to the consumer price index (GWG, 2017a). Statistics Canada is investigating the use of data from smart metres to track electricity consumption (GWG, 2017b). The World Bank Group is partnering with the government of Colombia to assess use of call detail records to measure income and inequality (GWG, 2017c).
Geospatial data can help to include people who have been overlooked
The Data2X report, “Big data and the well-being of women and girls” (Data2X, 2017), illustrates the use of a large, geospatial database to improve the understanding of stunting, literacy and access to contraceptives in Bangladesh, Haiti, Kenya, Nigeria and the United Republic of Tanzania. Because many types of social and health data correlate with physical phenomena – such as elevation, land cover, and distance to roads and schools – it is possible to use geospatial data along with other sources of data to infer social and health conditions in communities not included in the sample design, ensuring that these groups are not left behind.
Innovative use of big data can improve Sustainable Development Goal outcomes
SDG Target 3.3 calls for the elimination of epidemic diseases, including malaria. Insecticide-treated bed nets offer a proven method of reducing malaria incidence, but it is expensive and ineffective to distribute bed nets widely in low-incidence areas. If measures are taken to protect privacy, big data can be used to identify target populations. In Namibia, the country’s largest cell phone service provider shared anonymised call detail records for 1.2 million subscribers. This permitted the construction of maps documenting patterns of internal migration. To pinpoint areas with high risk of malaria infection, the data from these maps were combined with remote sensing data – collected by the Namibia National Vector-borne Diseases Control Programme – tracing the factors affecting the location of mosquitos. With this information in hand, Namibia’s Ministry of Health can target the distribution of bed nets to the most likely sources of the spread of infections (Vaitla et al., 2017; Tatem et al., 2014).
Monitoring progress on half of the SDG targets depends on the availability of environmental statistics.
Citizen-generated data can help close gaps in environmental statistics
Monitoring progress on half of the SDG targets depends on the availability of environmental statistics, yet a large portion of the indicators under these targets require data that are not regularly produced by countries. It may be possible to compensate for these significant gaps in environmental data by engaging citizens in data collection. A case study in the People’s Republic of China is exploring the use of citizen-generated data to address traditionally intractable gaps in environmental statistics, highlighting the possibilities and challenges (Hsu, Weinfurter and Yan, 2017).
New technologies can improve census and survey data collection
Another example of the application of new technology to generate statistics is the use of computer-assisted personal interview (CAPI) devices – such as tablet computers or other handheld devices – to improve the efficiency and accuracy of census and survey data collection. There are numerous examples of the transition to CAPI in developing countries, including Uganda’s National Panel Survey in 2011/12; Ethiopia’s Rural Socioeconomic Survey in 2013/14; South Africa’s Community Survey in 2016; and Sri Lanka’s pilot in 2017 using CAPI with sample surveys.
The preceding examples illustrate just some of the many opportunities presented by the data revolution. To seize these opportunities, however, statistical offices will need to invest in new technology and production processes; they will also need to establish partnerships with new actors from the private sector, the media and academia. Too many statistical offices are not yet in a position to benefit from these opportunities as they are under-resourced, have limited capacity, and are unable to obtain the skilled staff or the equipment needed.
It is time to create a virtuous data cycle
Securing the investments needed to improve data production will depend on a clear demonstration of the value of data.
Now is the time to make a big push for investments in better data. The poorest and least-equipped statistical systems are fully dependent on external support and struggle to produce the data needed to advance their societies. In these countries, the use of statistics by policy makers remains limited, leading to uninformed decision making that generates poor development outcomes. Indeed, national statistical systems are often trapped in a vicious cycle of statistical under-development, where limited awareness and appreciation of the importance of data – by policy makers and at all levels of society – has led to sustained under-funding for statistics. This vicious cycle needs to be turned into a virtuous one (Figure 3.1). For example, efforts in planning and production will only create value for society if they are followed by strong data dissemination, and if users understand and use the available information. Similarly, securing the investments needed to improve data production will depend on a clear demonstration of the value of data.
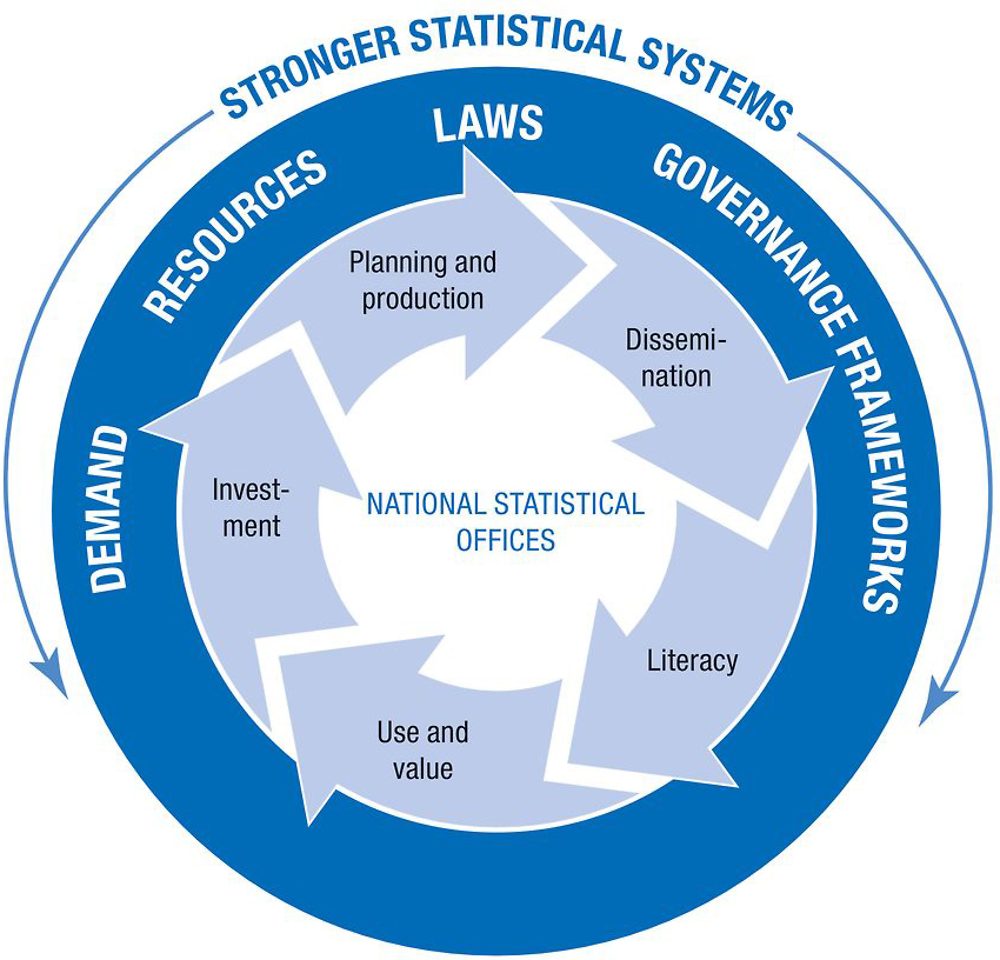
Source: OECD, based on PARIS21 and Open Data Watch.
The following section outlines various aspects of this virtuous cycle in detail, starting with the challenges emerging from the SDGs and the need to adjust national development and statistical plans to meet them.
The data challenges of the Sustainable Development Goals are both global and local
Recognising the importance of quality data for guiding social, economic and environmental policies, the high-level panel commissioned to make recommendations for the United Nations’ 2030 Agenda for Sustainable Development proposed an ambitious programme of goals and targets, to be monitored using statistical indicators:
The indicators that track them should be disaggregated to ensure no one is left behind and targets should only be considered “achieved” if they are met for all relevant income and social groups. We recommend that any new goals should be accompanied by an independent and rigorous monitoring system, with regular opportunities to report on progress and shortcomings at a high political level. We also call for a data revolution for sustainable development, with a new international initiative to improve the quality of statistics and information available to citizens. (UN, 2013: iv)
This vision of a data-driven programme of action to bring about “transformative shifts” in the well-being of people and the condition of the planet is embodied in the 17 SDGs, which comprise 169 targets and 232 indicators across a range of economic, social and environmental domains. This is a considerable step up from the 8 Millennium Development Goals (MDGs), which included 21 targets and 60 indicators, and puts pressure on countries to respond. Recognising these challenges, the Global Partnership for Sustainable Development Data (GPSDD), a broad coalition of governments, international agencies, non-governmental organisations and private sector firms, was established to help countries meet the challenges of monitoring the SDGs. The Data4SDGs Toolbox (GPSDD, n.d. b), for example, comprises a set of tools, methods and resources.
The 2015 report by the Sustainable Development Solutions Network (SDSN, 2015) lays out the programme of data collection and capacity development that will be needed to produce data for the core SDG indicators. It identifies six major categories of activity that are essential for producing SDG-relevant statistics: 1) national survey programmes; 2) decennial censuses; 3) administrative data, including civil registration and vital statistics systems; 4) economic statistics; 5) geospatial infrastructure; and 6) environmental monitoring. The investment and annual operating costs for 77 International Development Association (IDA)-eligible countries are estimated to be in the order of USD 925 million per year. When the cost of data collection to meet additional requirements for the SDGs is added to this figure, it brings the total to USD 1.2 billion per year (GPSDD, 2016).
In order to leave no one behind, data will have to be disaggregated by age, sex, disability and other relevant functional categories.
In addition to monitoring the sheer number of indicators comprised by the SDGs, measuring progress towards these goals presents additional challenges to national statistical systems:
-
The need to compare data over time and to aggregate them across countries and regions requires adherence to common standards and methods. Where standards and methods already exist, baseline measurements are needed, coupled with an agreed programme of regular data collection. In addition, many of the proposed SDG indicators still lack clear definitions and may require new data collection instruments that will need to be tested and calibrated; staff will also require training in their use.
-
To fulfil the SDGs’ promise of leaving no one behind, data will have to be disaggregated by age, sex, disability status and other relevant functional categories. Administrative systems of central and local governments are important sources of information, which may be combined with data from censuses, surveys or new sources to provide more granular measurement and results. Some groups, such as nomadic populations, are difficult to reach and count accurately, especially if they move across borders. Other groups may live in areas affected by fragility, or with access to very limited communications.
-
Developing countries face the challenge of producing more granular, local data related to each country’s unique situation and challenges. The “data localisation” of the SDGs can be achieved only when the data revolution is accompanied by a capacity revolution that empowers data producers and users in developing countries to navigate through – and make full use of – the new emerging data ecosystem (see the “In my view” piece by Stefan Schweinfest).
Stefan Schweinfest, Director, United Nations Statistics Division
I was recently asked to name the three key elements of the data revolution. My answer was “capacity, capacity, capacity!”
The 2030 Agenda for Sustainable Development poses tremendous challenges for statisticians like me. At the same time, it offers an unprecedented opportunity. We need more data – covering all countries and relevant areas – more integrated data and disaggregated data.
In a remarkable effort, the global statistical community came together under the leadership of the United Nations (UN) Statistical Commission to develop a global indicator framework to underpin the new development goals and targets. Over the coming years, my office – the UN Statistics Division – will build a global data cube comprising 232 indicators for 193 countries over 15 years.
There are many reasons why achieving this is far from simple. Here, in my view, are what may be the two most important ones:
-
We need quality data and national ownership.
In addition to the usual standards of reliability, timeliness and relevance, in a global development database consistency is critical – over time, and over space. Only if data are sustained over time can we produce the series needed to measure what we truly wish to understand: development. And only if we apply consistent methodologies worldwide will we be able to compare countries and aggregate continents, ensuring that global support goes where it is most needed. Finally, only if politicians and people truly own and trust the data will they have the power to change policies and minds.
-
The global indicators are only the tip of the iceberg.
To realise the ambition of the 2030 Agenda, action will be needed at the local, subnational, national, regional, global and sectoral levels. This action has to be supported by data that are fit for purpose.
In my view, what is needed is a global data architecture, where data are produced at the local and national levels, reviewed for validity and then transported effectively to the various decision nodes.
What do we need to get there?
-
investment in statistics and data at the national and international levels
-
new methodologies and technical capacity building
-
a transformation of national statistical systems to enable national statistical offices to play their new role as “chief data managers”, co-ordinating and validating national information beyond official statistics and integrating geospatial information and big data
-
a framework of knowledge-solidarity where diverse data stakeholders work together across the globe in an effective manner.
The recent UN resolution on the global indicator framework highlights all these elements. The UN High-Level Group for Partnership, Coordination and Capacity Building carries high ambitions in its name. Under its leadership, in January 2017 the first UN World Data Forum brought over 1 400 participants to Cape Town, South Africa to launch the Cape Town Global Action Plan, which addresses many of the challenges cited above.
I remain incurably optimistic. With this Cape Town Global Action Plan we are, collectively, on the right path. In this context, the partnership in statistics between the UN and the OECD, in particular the Statistics Directorate and the PARIS21 Secretariat, is key. I look forward to continuing this close and effective co-operation.
National statistical systems are the core of a larger, emerging data ecosystem
National statistical systems are ensembles of statistical organisations and units within a country that collect, process and disseminate “official statistics”. Official statistics are derived from data produced by public bodies as part of their official function; they provide a record of the social, economic and environmental condition of the country. Governance of a national statistical system is determined by law and is regulated by adherence to professional standards (Box 3.1).
Typically, one unit within the national statistical system serves as the lead or co-ordinating agency. This agency is generically described as the national statistical office. To improve trust in data and ensure the independence and integrity of the national statistical system, the national statistical office should be structured as an autonomous body with a separate budget, accountable primarily to the legislature. In many countries, a designated board of governors or an advisory body provides independent advice on the standards and conduct of the national statistical office and the larger statistical system. When this office is not administratively autonomous, it may be located within the Ministry of Finance or Planning. Wherever situated, however, laws and regulations should protect statistical agencies from partisan influence.
National statistical systems are expected to be guided by the United Nations Fundamental Principles of Official Statistics (UNSC, 2014) and to govern themselves accordingly. Of the ten principles, Principle 1 describes the responsibility of statistical offices to make official statistics available to everyone: “Official statistics that meet the test of practical utility are to be compiled and made available on an impartial basis by official statistical agencies to honour citizens’ entitlement to public information.” Principle 2 speaks of maintaining trust in statistics through the exercise of professional and scientific judgement in the “collection, processing, storage, and presentation of statistical data”. Principle 5 notes that “Data for statistical purposes may be drawn from all types of sources, be they statistical surveys or administrative records”. Principle 6 states that individual data are to be kept “strictly confidential and used exclusively for statistical purposes”.
The preamble to the Fundamental Principles tells us that “professional independence and accountability of statistical agencies are crucial”, and that they “have to be guaranteed by legal and institutional frameworks and be respected at all political levels and by all stakeholders in national statistical systems”. In most countries, specific legislation establishes the responsibilities of the national statistical office, its governance structure and its authority over the national statistical system (UNSD, 2013). National law should authorise national statistical offices to make data collection compulsory for certain purposes, to protect confidential information, and to release data or statistics in a form that preserves the privacy of individuals.
To respond to the call for greater transparency in government and to provide open access to data, countries may have to revise their statistical laws and regulations.
Source: Authors’ compilation based on UNSC (2014), “Fundamental Principles of Official Statistics”, https://unstats.un.org/unsd/dnss/gp/fundprinciples.aspx and UNSD (2013), “Implementation of the Fundamental Principles of Official Statistics”, http://unstats.un.org/unsd/statcom/doc13/BG-FP.pdf.
In the past, the ecosystem of official statistics was limited to the national statistical system itself and the direct users of its outputs, principally other government agencies and a few non-governmental groups. International bodies set standards and provided an outlet for a limited set of statistics. In the context of the data revolution, however, national statistical systems operate increasingly as part of a larger, emerging data ecosystem. This data ecosystem is made up of multiple communities of data producers and users beyond the national statistical system, including civil society; the private sector; academic and scientific communities; as well as regional, international and UN agencies; and specialised data producers (Figure 3.2). The interactions among these communities are determined by each of their legal, political, technological and financial constraints, as well as by their shared interest in maximising the value of the data available to them through mutually beneficial exchanges.
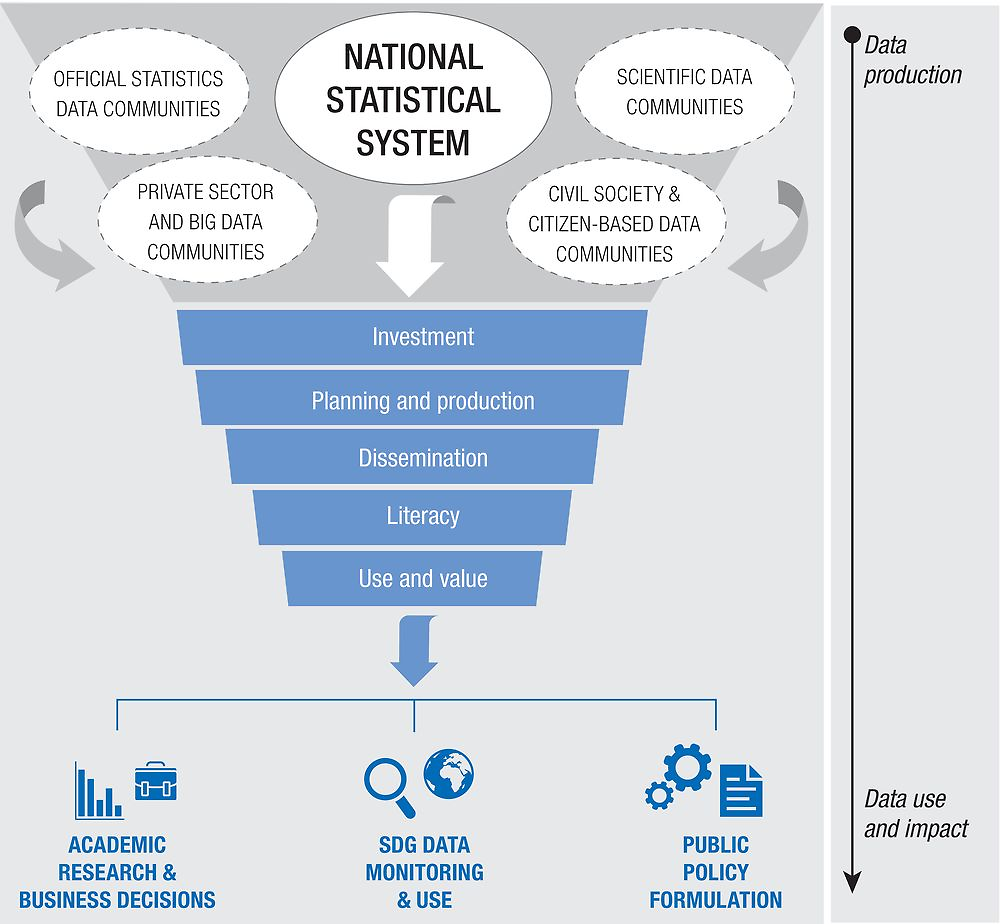
Source: Compiled by the authors, based on GPSDD (2016), “The state of development data funding 2016”, http://opendatawatch.com/wp-content/uploads/2016/09/development-data-funding-2016.pdf.
Partnerships with new actors are essential to realise the full benefits of the data revolution and modernise national statistical systems.
As co-ordinators of their national statistical systems and custodians of large amounts of data, national statistical offices create value by overseeing the production of reliable statistics and by assisting others in the interpretation of those statistics. They play a critical role in leading the data revolution for sustainable development. As experts in the measurement of social, economic and environmental conditions, official statisticians deliver data that are trusted and useful for research, analysis and policy making. As independent agents committed to transparency and adherence to standards, national statistical offices ensure the quality of official statistics and engender trust in the policy-making process.
While national statistical offices remain at the centre of the data ecosystem, their role is changing as they reach out to new partners and adopt new methods. They may even find themselves working or competing with producers of data that are not part of the traditional remit of the national statistical system. In the future, these offices may become information brokers and “info-mediaries”. In addition to their role as collectors and distributors of data, national statistical offices will actively co-ordinate work with non-governmental data producers, seeking the best sources of data to meet the needs of a variety of user communities. The national statistical office can also offer quality control services, advising on the correct implementation of standards and using data from censuses, surveys and administrative records to “ground-truth” estimates derived from big data or other non-standard sources. Partnerships with new data actors are essential to realise the full benefits of the data revolution and modernise the functions of national statistical systems.
Public-private partnerships for data can benefit business and the public good
As the data ecosystem expands and the demand for development data grows, taking advantage of new sources of data through public-private partnerships3 can help fill existing data gaps. Private sector sources of non-official data – telecom data, social media, sensor and geospatial data – are gaining attention for their cost-effectiveness, timeliness, granularity and scope for constructing new indicators (Robin, Klein and Jütting, 2016). Harnessing the data, software and skillsets that the private sector can offer should be a top priority for national statistical offices and private actors alike.
Countries and businesses have recognised the potential benefits of public-private partnerships. For example, the Open Algorithms Project (OPAL)4 is working with the telecom operators Orange Sonatel in Senegal and Telefónica in Colombia, employing big data analytics to mine telecom records in a manner that preserves privacy. In the OPAL model, algorithms developed by the co-operating partners are used to produce key development indicators in a secure environment controlled by the data owner.
Despite the recognised promise of public-private partnerships, however, there is still work to be done to find ways of navigating in this emerging space. For example, it is important to resolve issues concerning the perceived risks of sharing data and the protection of privacy. The World Economic Forum’s “Data-driven development: Pathways for progress” report (2015) stresses the reluctance of many private actors to share their datasets because of these issues. National statistical offices, which already subscribe to high professional standards and have a good record of protecting confidentiality, have similar concerns. Mutually satisfactory solutions will increase the opportunities for public-private partnerships in the future. National statistical offices should take the lead in forging and sustaining public-private partnerships to improve the breadth and depth of official statistics. Although the legal and practical guidelines governing their interactions with private partners are still evolving, this should not stop them from engaging.
Klein and Verhulst have looked closely into how to incentivise the private sector to share their data. For example, benefits can accrue from working with national statistical offices, especially when this permits gaining access to official data sources that may be important to business decisions. Further incentives include “… the potential to develop new analytical skills, improve reputations, generate revenue, meet regulatory compliance measures and demonstrate corporate responsibility” (Klein and Verhulst, 2017: 8). Among many companies, there is growing recognition, albeit slowly, of the incentives for making data available for the public good (Klein, Galdin and Mohamedou, 2016).
All countries have room to increase statistical capacity, transparency and use
Harnessing the data revolution to achieve the ambitious SDGs will depend greatly on how national statistical systems respond to the challenges involved. They will need to:
-
increase their capacity to produce timely and reliable data and statistics
-
embrace a culture of openness, sharing data freely and forming partnerships with other data producers
-
promote the use of data for decision making by engaging with users in and out of government and leading programmes to increase statistical literacy and use.
Despite 15 years of progress during the implementation of the MDGs, there remain large differences in the capabilities of national statistical systems to produce timely and reliable data and statistics.
Building statistical capacity is a long-term process
One way to understand the differences in capacity is to look at the statistical methods and data sources used by countries. For this report, we have selected 15 indicators from the World Bank’s Statistical Capacity Indicators database (World Bank, 2017), which covers 131 low and middle-income countries: 10 indicators record the methodological standards employed to produce important datasets and 5 indicators record the timeliness or availability of data sources.5 We rank the 131 countries according to their aggregate scores for methodological standards and indicators on data sources, grouping the countries into:
-
low-capacity countries (51) ranking in the bottom third on one or both methodology and source measures
-
mid-level capacity countries (50), ranking in the middle or upper third on one but not both of the measures
-
high-capacity countries (30), ranking in the upper third on both measures.
Figure 3.3 shows the number of countries meeting basic standards for core statistical activities by capacity group. The analysis shows that most countries, whatever their capacity level (about 70% of the sample) lack complete civil registration and vital statistics systems, so many births and deaths go unrecorded. This means that demographic data must be estimated from models. It also means that many children lack birth certificates and that the causes of death go unreported. Many of these countries also lack data from national vaccination programmes that are consistent with World Health Organization standards, and are not able to report education statistics regularly to the United Nations Educational, Scientific and Cultural Organization.
Outdated statistics limit a country’s ability to measure growth, productivity and poverty.
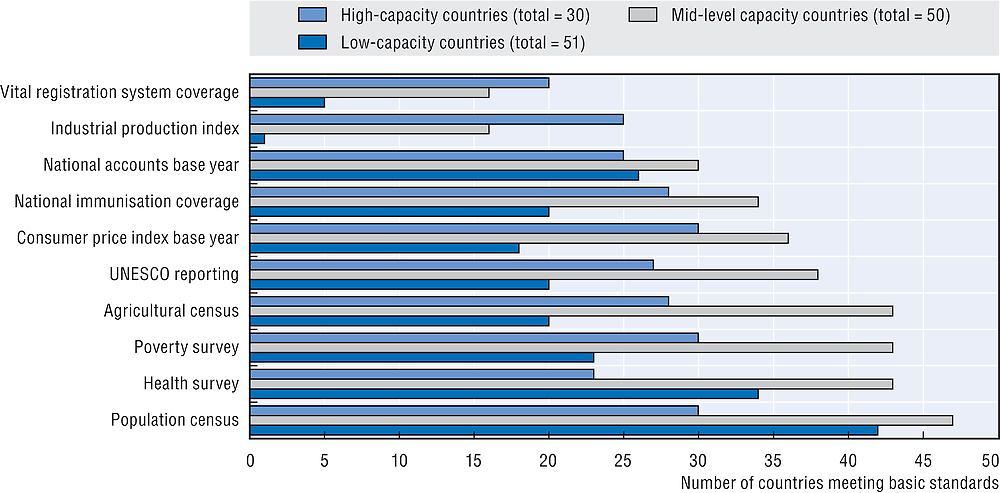
Source: Author’s calculations based on World Bank (2017), Statistical Capacity Indicators (database), http://databank.worldbank.org/data/reports.aspx?source=statistical-capacity-indicators#.
Outdated base years for national accounts and price statistics, as well as the lack of recent agricultural surveys or censuses, limit a country’s ability to produce the reliable economic statistics needed to measure growth, productivity and poverty. In poorer countries, these surveys are often supported by bilateral providers of development co-operation or international organisations. But not all countries with weak capacity in this area are exceptionally poor: among the low-scoring countries for this type of data, almost one-third are classified as upper middle-income countries.
The countries that have a mid-level capacity score, for the most part, are able to conduct regular surveys, which combined with census and administrative data allow them to produce a range of sophisticated statistics, largely relying on their own resources. Still, more than 60% of these countries lack complete civil registration and vital statistics systems and almost 40% have outdated base years for their national accounts. This middle group can move to the next level by mobilising additional resources and adopting new methods and technologies, but they must also pay attention to their core statistical processes.
At the upper end are high-capacity countries. Most, but not all, are upper middle-income countries. Many have subscribed to the International Monetary Fund’s Special Data Dissemination Standard, which sets criteria for their economic and financial statistics. They utilise data from multiple sources and adopt new techniques to increase the scope and quality of their statistics; they also carry out their activities on a regular schedule, adhering to documented standards, and are largely financed by their own governments. Yet one-third of these countries still lack complete civil registration and vital statistics systems and one-quarter have not conducted a health survey in the past five years.
Increasing statistical capacity is a long-term process. It encompasses investing in people and institutions, and improving the environment in which national statistical offices work. The Partnership in Statistics for Development in the 21st Century (PARIS21) – a global partnership of data users and producers – has identified lessons for building statistical capacity. These include providing leadership training for senior management in national statistical offices, with specific components on change management and leadership; a more demand-led/user-driven focus in the data-production process; and a greater focus on the enabling environment, including governance structures.
Make data more open, transparent and accessible
To build trust in official statistics and increase their value, these should be provided to a wide audience in formats people can easily understand and use, at little or no cost. The report of the UN Secretary-General’s Independent Expert Advisory Group, “A world that counts: Mobilizing the data revolution for sustainable development” (IEAG, 2014), called for open data standards to enable the data revolution to create a world of informed and empowered citizens who can hold decision makers accountable. The report recommends that all governments promote the release of open data – data that are available and useable by all data producers and statistical systems.
National statistical offices are joining the open data revolution by building partnerships with other statistical systems, civil society and the private sector.
Governments and their national statistical offices are joining the open data revolution by building partnerships with other statistical systems and with civil society and the private sector. For example, 22 national statistical offices shared their experiences in adopting international standards at the 2016 International Open Data Conference (OD4D, 2016). Sixteen national governments, including ten developing countries, have subscribed to the principles of the International Open Data Charter (Box 3.2; ODC, n.d.) With the first principle governments commit to “develop and adopt policies and practices to ensure that all government data is made open by default…” Statistical offices can explicitly include open data in their national strategies for the development of statistics (PARIS21, n.d.) or in their SDG roadmaps (GPSDD, n.d. a).
The Open Data Charter defines open data as “… digital data that is made available with the technical and legal characteristics necessary for it to be freely used, reused, and redistributed by anyone, anytime, anywhere” (ODC, n.d.). Four principles define the technical characteristics of open data:
-
open by default
-
timely and comprehensive
-
accessible and usable
-
comparable and interoperable.
The Open Data Inventory (ODIN) applies similar criteria in assessing the coverage and openness of the statistics published by national statistical offices (Open Data Watch, 2017b).1 The 2016 results show that all countries, from the poorest to the wealthiest, have room for improvement (Figure 3.4; Open Data Watch, 2017a). ODIN scores 173 countries on data coverage and openness in 20 data categories. The median country score in 2016 was 39, meaning that fewer than half the countries satisfied more than 39% of the ODIN criteria for data coverage and openness. Across all countries, ODIN scores ranged from 81 (Sweden) to 3 (Madagascar). While the high-income countries of Europe, North America and Asia achieved, on average, the highest scores, low and middle-income countries in many regions achieved higher results than their wealthier neighbours. Countries that have undertaken relatively simple reforms have made considerable improvements over the past years, but many have large deficits in coverage of important categories of statistics and have not taken the steps needed to make their data open.
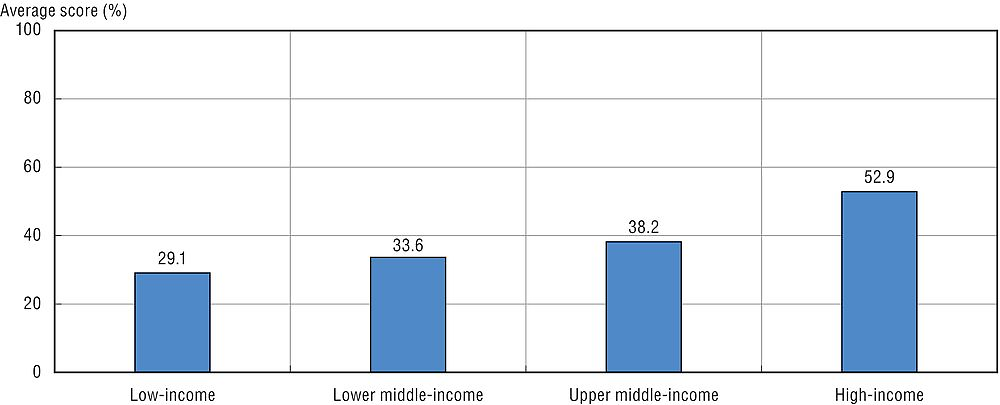
Source: Open Data Watch (2017a), “Data download”, 2016 Open Data Inventory (database), http://odin.opendatawatch.com/data/download (accessed 26 April 2017).
← 1. Two other indexes measure the openness of government data: the Open Data Barometer and the Global Open Data Index. However, these indexes include other types of data that are not usually within the provenance of national statistical systems, such as transportation timetables, mapping data, election outcomes and cadastral information.
Strengthen statistical literacy to increase the use of statistics
The power of data can only be realised when people can understand, analyse and explain them. Statistical literacy is often measured in terms of classroom statistical knowledge, but there are many other instances in which the ability to understand and use statistics is important.
Journalists play an important role by organising and interpreting statistical evidence. Klein, Galdin and Mohamedou (2016) argue that “… the writing of journalists can be seen as an image for a nation’s demand for statistical facts as well as the depth of critical analysis”. To assess the statistical literacy of journalists and journalists’ expectations about the statistical literacy of their readers, Klein, Galdin and Mohamedou examined the use of statistics in newspaper articles in 32 countries and 4 languages, classifying 3 levels of sophistication.6 Figure 3.5 shows the breakdown of scores by income group, based on the OECD Development Assistance Committee’s (DAC) list of ODA recipients (OECD, n.d.). The results indicate a wide range of statistical literacy, from 2.5 in Chad to 28.6 in the Philippines. They also show that statistical literacy is not necessarily determined by national income; for example, lower middle-income countries with strong statistical institutes, such as the Philippines, rank very high on this index. The Philippines Statistics Authority is very engaged in monitoring the use of statistics by journalists, tracking references to their statistical products using Google news and by engaging actively with the media.
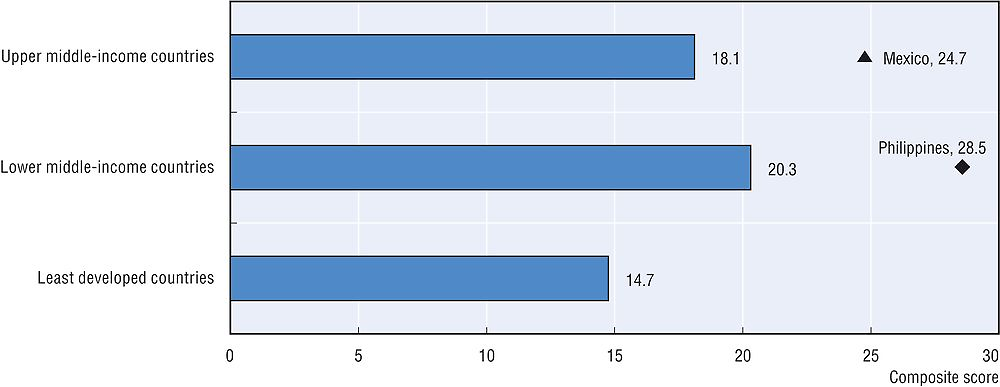
Note: Countries are classified according to the DAC List of ODA recipients, www.oecd.org/dac/stats/documentupload/DAC%20List%20of%20ODA%20Recipients%202014%20final.pdf.
Source: Klein, T., A. Galdin and E. Mohamedou (2016), “An indicator for statistical literacy based on national newspaper archives”, https://iase-web.org/documents/papers/rt2016/Klein.pdf.
Producing and disseminating data and statistics means little if they are not used. Providing data in open formats with open licenses encourages their use. Yet data will have little impact unless user communities recognise their relevance for understanding the world around them or for informing decisions made by themselves or others. We have seen that statistics are used to varying degrees in newspaper articles, for instance, but are they used for planning and decision making? PARIS21 (2015) analysed the use of statistics in poverty reduction strategy papers, medium-term strategies and national development plans. Of the 20 countries that produced development plans in both periods analysed by the study (2001-07 and 2008-13), all but one increased their score on the use of statistics (Figure 3.6). The average score increased by 16 points between the two periods. These improvements reflect a growing emphasis on measuring development results, as well as an effort to incorporate quantified targets (e.g. the MDGs) into national development strategies. The evidence of increased use of statistics is encouraging. What remains unclear is the impact of this use of statistics on policy and programme outcomes.
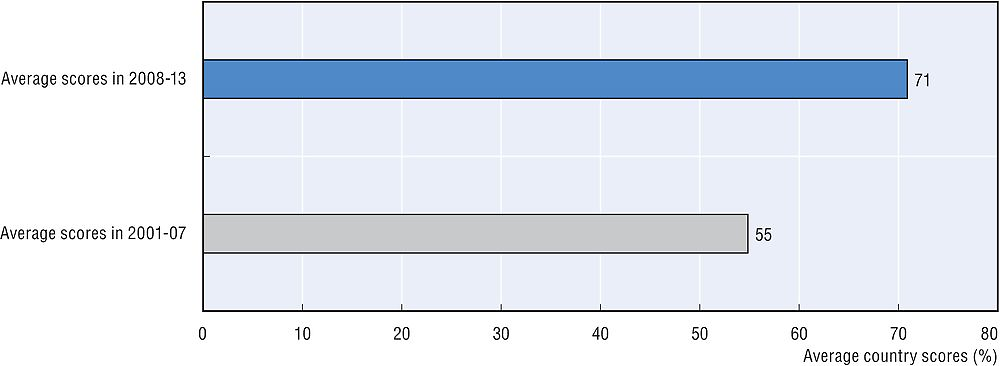
Note: The comparison is based on analysis of the use of statistics by 39 countries that published development/poverty reduction strategies and plans between 2001 and 2007 and 42 countries that published strategies and plans between 2008 and 2013.
Source: PARIS21 (2015), “A scoring system to measure the use of statistics in the policy-making process”, www.paris21.org/sites/default/files/Scoring_System_Use_Of_Data_2015_DFID.doc.
For countries to realise the benefits of the data revolution, strategies for increasing statistical literacy must proceed on many fronts.
For countries to realise the benefits of the data revolution, the statistical literacy of citizens and government officials must increase. Enterprises, institutions and government agencies – the potential users of statistics – will have to recognise the value of statistics for guiding policies, assessing results and creating valuable products. Just as statistical literacy has multiple dimensions, strategies for increasing statistical literacy must proceed on many fronts. Over the long term, education is crucial. Students should be taught the basic skills needed to understand and utilise statistics. In the near term, partnerships between data producers and data users, including academic researchers and innovators, can create new uses and stimulate better understanding of statistical methods. National statistical offices should reach out to these groups and engage them in formal and informal programmes to spread statistical knowledge. Only by promoting widespread statistical literacy and the effective use of data can their full value be realised.
What needs to happen to build capable statistical systems?
By itself, the data revolution will not prompt institutional reform of national statistical systems, expand capacity, or lead to better use of and greater impact from statistics. Building capable national statistical systems is incremental: it depends as much on improving traditional core capacities as it does on using revolutionary technologies. The Cape Town Global Action Plan for Sustainable Development Data (UNSC, 2017), adopted by the United Nations Statistical Commission in March 2017, identifies national statistical systems and offices as the “necessary and appropriate leaders of this effort”. It provides a framework for planning and implementing statistical capacity to match the scope of the 2030 Agenda.
The following section on what needs to happen is organised around four of the six strategic areas outlined in the Cape Town Global Action Plan: 1) leadership and governance; 2) strengthening core statistical programmes; 3) innovation and modernisation of national statistical systems; and 4) dissemination and use of statistics.7
Ensure better leadership and governance
To assert leadership within their own domain, national statistical offices need to work closely with national and subnational statistical agencies, facilitating communication with data users inside and outside of government. They need to modernise statistical standards and introduce new technologies and data sources into mainstream statistical activities. The national statistical agency of Tanzania offers a good example of how to do this: the Bureau of National Statistics played a critical role in championing the country’s Open Government Partnership Action Plan. Tanzania was also one of the first countries to conduct an SDG Data Roadmap exercise in collaboration with the Global Partnership for Sustainable Development Data. Partnerships also offer an important opportunity for intra-governmental co-operation. The Philippines, for example, created an inter-agency committee on statistical data management and dissemination.
Many countries will need to update their statistical laws or regulations, authorising statistical offices to adopt new modes of data collection, engage in partnerships with external organisations and openly disseminate data from the statistical system. These regulations should be complemented by right-to-information laws that guarantee access by citizens to statistics and other forms of government information. Statistical offices can also provide guidance to other government agencies as they implement open data and freedom-of-information policies. For example, as part of a wider open government strategy to achieve a “Digital Mexico”, open data was embraced as an enabler of economic and social growth, a lever to help fight corruption, and a mechanism to promote evidence-based policy making. The Coordination of National Digital Strategy of the Office of the President of Mexico partnered with the National Institute of Geography and Statistics to set up an Open Data Technical Committee, tasked with aligning national statistical plans with the implementation of open data policy across the government.
It is the responsibility of government, at the highest level, to recognise and support the production and use of reliable statistics.
Leadership must be earned, but it must also be nurtured. Many national statistical offices are unable to promote the use of recognised standards or to co-ordinate statistical activities throughout the larger data ecosystem. Under-resourced agencies find it hard enough to manage their own work without the added burden of co-ordinating their work with others. It is the responsibility of government, at the highest level, to recognise and support the production and use of reliable statistics. Likewise, international statistical bodies should encourage the full participation of all statistical systems in their processes, especially those from less developed countries. Finally, providers of development co-operation need to support statistical systems in a way that matches the value of the information they produce (Chapter 4).
Strengthen core statistical programmes
We have seen that many low and middle-income countries lack the capacity to produce the full range of statistical information needed to plan and monitor their development programmes and to inform citizens of their outcomes. Statistical planning and securing resources to deliver plans are integral functions of statistical systems. These plans need to ensure that core statistical programmes such as censuses, civil registration and vital statistics, and national accounts are prioritised.
Planning for the 2020 round of decennial censuses is an immediate concern. A few advanced statistical systems have replaced population censuses with data from civil registration and other administrative systems. Yet for most countries, the census is the only opportunity to anchor their demographic statistics to a complete enumeration of the population by sex, age, location and other important characteristics. The census is also a governance issue, as census results often determine legislative districts and the allocation of resources to communities. The 2010 census round, carried out between 2005 and 2014, was one of the great successes of national and international statistical efforts to date. With the support of the international development community, 214 countries and territories conducted national censuses, some for the first time in decades. However, 21 countries did not conduct a census, resulting in 7% of the world population not being enumerated. The 2020 census round has already begun. Based on the previous census dates for each country, 39 countries (including some that missed earlier rounds) should have begun preparing for or conducting censuses by 2017; some 200 more will need to complete censuses between 2018 and 2024.
Core statistical programmes such as censuses, civil registration and vital statistics, and national accounts should be prioritised.
Civil registration and vital statistics systems are essential for maintaining core demographic data. Through the registration of births, marriages, divorces and deaths, they also establish the legal basis for citizenship, inheritance and the right to public services; and they provide important information to the health system by recording cause of death. Complete registration of births and recording of cause of death should be the goal of every statistical system.
Timely and reliable statistics are needed to guide government policies and private economic and financial decisions. Although every country produces some form of national accounts, many lack adequate data on which to base their estimates of current or projected economic growth. The Cape Town Action Plan calls on countries to strengthen their national accounts; it also calls for implementing integrated systems of environmental economic accounts to capture the use of environmental resources and their possible depletion.
Modernise national statistical systems through innovation
To meet the demands of the SDGs and of domestic development programmes, national statistical systems will have to adopt new technologies and expand the scope of their work. The integration of geospatial data with conventional sources of environmental and socio-economic data is particularly important. Earth observations from satellites and aircraft or other remote sensors can be combined with geo-located data from censuses, surveys or other sources; these data can then be analysed and manipulated through geographic information systems. Geospatial data are crucial for monitoring environmental conditions and are rapidly becoming a core part of countries’ data infrastructure. Combined with household surveys, they enable disaggregation by spatial characteristics such as proximity to roads or population density. Call detail records from mobile phones and other transaction data can add a dynamic component to geo-located data.
Geospatial data are crucial for monitoring environmental conditions and are rapidly becoming a core part of countries’ data infrastructure.
The application of geospatial information and the analysis of big data will also require advances in information and communications technology (ICT). ICT is not only the foundation of the data revolution, it is also the key to improved government administration and e-government services, and to the widespread dissemination of data and statistics. The need for ICT capability is not limited to national statistical systems. The growth of the private sector and of its capacity to realise the benefits of the data revolution depend on modern ICT infrastructure. Public and private incentives for the development of ICT systems should, therefore, be aligned.
Focus more on disseminating and using statistics
As recommended by the Cape Town Action Plan, the work of statistical agencies should include programmes to increase data literacy, identify misuse of statistics and encourage knowledge sharing between producers and users. Potential allies of and clients for open and reliable development data include academic and research communities, news media and other information intermediaries, local governments and service providers, as well as the private sector and citizen groups. But data users are not uniform: each user group needs different kinds of data in different forms. It is also essential to accompany data with thorough and accurate metadata. Finally, open data policies must be supported by legal and regulatory frameworks that allow statistical agencies to disseminate data freely and without interference.
The way statistics are used is determined by historical factors, formal and informal institutional arrangements, the incentives of political elites and bureaucrats, external factors and global drivers.
Ultimately, the use and impact of statistics depend not only on their supply, but also on what Krätke and Byiers (2014) describe as the “political economy of official statistics”. In addition to technical and governance factors, the way statistics are used is determined by historical factors, formal and informal institutional arrangements, the incentives of political elites and bureaucrats, external factors and global drivers. This means that many developing countries will need to overcome a legacy of statistics that served the interests only of colonial administrators or political and economic elites. Legal reforms that protect the independence of statistical offices and provide for effective co-ordination among them can help to overcome institutional roadblocks, but informal impediments may remain. The isolation of statistical offices from the decision-making process, or a lack of control over their own budgets and administrative processes, inhibits their ability to promote the effective use of statistics.
The way forward for national statistical systems in the data revolution
The data revolution has put new tools and sources of data in the hands of statisticians. These can serve national statistical offices, as well as the increasing number of data users and producers in the growing data ecosystem. Countries that seize opportunities can leap ahead, realising a rapid change in their capacity to produce high-quality statistics. In the future, national statistical systems will find themselves working with new partners, and their role within the data ecosystem may well change, but their core responsibilities for official statistics will remain.
We are at a critical juncture. The data revolution has demonstrated the value of data for the economy and society, as well as the opportunities for creating private and public returns on investment in data. Experience with the Millennium Development Goals has shown that statistical measurements can create incentives for better outcomes if national statistical systems are able to respond to the increasing demand for data. The growing popular demand for open data and government transparency further incentivises governments to produce and use trustworthy statistics. As these factors come together, there is a window of opportunity for development data to join the data revolution. Seizing this opportunity to have more and better data to achieve development results depends on the concerted action of statistical agencies and their governments, development co-operation providers, international agencies, civil society and the private sector.
Priority steps for making the data revolution work for development
Every statistical system is different and the details matter. Nevertheless, these priority steps can serve as guidance for national statistical offices and policy makers:
-
Embrace the data revolution by using new sources of data, adopting innovative methods for producing and using statistics, and forging partnerships with other data producer and user communities.
-
Strengthen the traditional systems of data collection – including censuses, surveys and administrative records – as they remain essential in the national statistical system; make them more efficient by using new technologies and methods.
-
Support open data policies and the use of non-traditional sources of data, including through legal and regulatory reform; official data belong to everyone and should be open by default.
-
Promote data dissemination and statistical literacy programmes to spur the use of statistics; promote active user communities.
-
Identify the needs of the national statistical system and the resources available to address those needs.
-
In strategic plans, data compacts and other joint agreements with providers of development co-operation and international agencies incorporate practical steps to address deficits in the production and use of statistics.
References
Data2X (2017), “Big data and the well-being of women and girls: Applications on the social scientific frontier”, Data2X, http://data2x.org/wp-content/uploads/2017/03/Big-Data-and-the-Well-Being-of-Women-and-Girls.pdf.
GPSDD (2016), “The state of development data funding 2016”, Global Partnership for Sustainable Development Data, http://opendatawatch.com/wp-content/uploads/2016/09/development-data-funding-2016.pdf.
GPSDD (n.d. a), “Data roadmaps for sustainable development guidelines”, webpage, Global Partnership for Sustainable Development Data, www.data4sdgs.org/data-roadmaps-for-sustainable-development-guidelines.
GPSDD (n.d. b), “Data4SDGs toolbox”, webpage, Global Partnership for Sustainable Development Data, www.data4sdgs.org/toolbox.
GWG (2017a), “Assessing use of scanner data for compiling the Consumer Price Index”, Big Data Project Inventory, United Nations Global Working Group, https://unstats.un.org/bigdata/inventory/?selectID=201431.
GWG (2017b), “A big data pilot project: With smart meter data”, Big Data Project Inventory, United Nations Global Working Group, https://unstats.un.org/bigdata/inventory/?selectID=201429.
GWG (2017c), “How good are CDR-derived measures of income and inequality, and can governments systematically use them?” Big Data Project Inventory, United Nations Global Working Group, https://unstats.un.org/bigdata/inventory/?selectID=WB3.
Hsu, A., A. Weinfurter and C. Yan (2017), “The potential for citizen-generated data in China”, Yale ClimateWorks Foundation, http://datadriven.yale.edu/wp-content/uploads/2017/01/Third_Wave_Citizen-Science_FINAL.pdf.
IEAG (2014), “A world that counts: Mobilizing the data revolution for sustainable development”, Independent Expert Advisory Group on a Data Revolution for Sustainable Development, United Nations, New York, www.undatarevolution.org/wp-content/uploads/2014/11/A-World-That-Counts.pdf.
Klein, T. and S. Verhulst (2017), “Access to new data sources for statistics: Business models and incentives for the corporate sector”, OECD Statistics Working Papers, No. 82, OECD Publishing, Paris, https://doi.org/10.1787/9a1fa77f-en.
Klein, T., A. Galdin and E. Mohamedou (2016), “An indicator for statistical literacy based on national newspaper archives”, in: Proceedings of the IASE Roundtable Conference on Promoting Understanding of Statistics about Society, International Association of Statistics Education, Berlin, https://iase-web.org/documents/papers/rt2016/Klein.pdf.
Krätke, F. and B. Byiers (2014), “The political economy of official statistics: Implications for the data revolution in sub-Saharan Africa”, PARIS21 Discussion Papers, No. 5, OECD, Paris, www.paris21.org/sites/default/files/PARIS21-DiscussionPaper5_0.pdf.
OD4D (2016), “International open data road map: Global goals, local impact”, International Open Data Conference 2016, Summary Report and the Second Action Plan for International Collaboration, http://od4d.com/roadmap/assets/files/report-iodc-2016-web.pdf?platform=hootsuite.
ODC (n.d.), “Principles”, Open Data Charter, http://opendatacharter.net/principles.
OECD (n.d.), “DAC List of ODA Recipients: Effective for reporting on 2014, 2015 and 2016 flows”, OECD, Paris, www.oecd.org/dac/stats/documentupload/DAC%20List%20of%20ODA%20Recipients%202014%20final.pdf.
Open Data Watch (2017a), “Data download”, 2016 Open Data Inventory (database), http://odin.opendatawatch.com/data/download (accessed 26 April 2017).
Open Data Watch (2017b), “2016 Open Data Inventory: The ODIN annual report: Toward an open data revolution”, Open Data Watch, Washington, DC, http://odin.opendatawatch.com/report/pressReport.
PARIS21 (2015), “A scoring system to measure the use of statistics in the policy-making process,” www.paris21.org/sites/default/files/Scoring_System_Use_Of_Data_2015_DFID.doc.
PARIS21 (n.d.), “National strategies for the development of statistics”, www.paris21.org/NSDS.
Robin, N., T. Klein and J. Jütting (2016), “Public-private partnerships for statistics: Lessons learned, future steps: A focus on the use of non-official data sources for national statistics and public policy”, OECD Development Co-operation Working Papers, No. 27, OECD Publishing, Paris, https://doi.org/10.1787/5jm3nqp1g8wf-en.
SDSN (2015), “Data for development: A needs assessment for SDG monitoring and statistical capacity development”, United Nations Sustainable Development Solutions Network, http://unsdsn.org/wp-content/uploads/2015/04/Data-for-Development-Full-Report.pdf.
Tatem, A.J. et al. (2014), “Integrating rapid risk mapping and mobile phone call record data for strategic malaria elimination planning”, Malaria Journal, Vol. 13, https://malariajournal.biomedcentral.com/articles/10.1186/1475-2875-13-52.
UN (2013), “A new global partnership: Eradicate poverty and transform economies through sustainable development”, United Nations, New York, www.post2015hlp.org/the-report.
UNFPA (2016a), “Evaluation of UNFPA support to population and housing census data to inform decision-making and policy formulation 2005-2014”, Evaluation Report, Evaluation Office, United Nations Population Fund, New York, www.unfpa.org/sites/default/files/admin-resource/Evaluation_report_-_Volume.pdf.
UNFPA (2016b), “Evaluation of UNFPA support to population and housing census data to inform decision-making and policy formulation 2005-2014”, Evaluation Brief, Evaluation Office, United Nations Population Fund, New York, www.unfpa.org/sites/default/files/admin-resource/Brief_1.pdf.
UNICEF (2013), “Every child’s birth right: Inequities and trends in birth registration”, United Nations Children’s Fund, New York, www.unicef.org/publications/files/Birth_Registration_11_Dec_13.pdf.
UNSC (2017), “Cape Town Global Action Plan for Sustainable Development Data”, United Nations Statistics Commission, New York, http://unstats.un.org/sdgs/hlg/Cape-Town-Global-Action-Plan.
UNSC (2014), “Fundamental Principles of Official Statistics”, A/RES/68/261, United Nations Statistics Commission, New York, https://unstats.un.org/unsd/dnss/gp/fundprinciples.aspx.
UNSD (2013), “Implementation of the Fundamental Principles of Official Statistics”, United Nations Statistics Division, New York, http://unstats.un.org/unsd/statcom/doc13/BG-FP.pdf.
Vaitla, B. et al. (2017), “Phone records track malaria”, in Data Impacts: Case Studies from the Data Revolution, Data Impacts, http://dataimpacts.org/project/malaria.
WHO (n.d.), “Civil registration of deaths”, Global Health Observatory, World Health Organization, Geneva, www.who.int/gho/mortality_burden_disease/registered_deaths/text/en.
World Bank (2017), Statistical Capacity Indicators (database), http://databank.worldbank.org/data/reports.aspx?source=statistical-capacity-indicators# (accessed 22 May 2017).
World Economic Forum (2015), “Data-driven development: Pathways for progress”, World Economic Forum, Geneva, www3.weforum.org/docs/WEFUSA_DataDrivenDevelopment_Report2015.pdf.
Notes
← 1. Shaida Badiee, Deirdre Appel and Eric Swanson from Open Data Watch; and Johannes Jütting and Thilo Klein from PARIS21.
← 2. See: http://siteresources.worldbank.org/INTLAC/Resources/257803-1269390034020/EnBreve_166_Web.pdf.
← 3. Robin, Klein and Jütting (2016) define public-private partnerships as a “voluntary collaborative agreement between the public and private sectors, which is aimed at increasing a national statistical systems’ capacity to provide new or better statistics”.
← 4. See: www.opalproject.org/about-us.
← 5. Ten statistical capacity indicators that measured the availability of specific social and economic indicators were not included because they are based on data from international datasets that are often augmented by estimates from international agencies.
← 6. The three levels are: 1) consistent non-critical – appropriate but non-critical engagement with context, multiple aspects of terminology usage; 2) critical – critical, questioning engagement in contexts that do not involve proportional reasoning, but which do involve appropriate use of terminology; and 3) critical mathematical – critical, questioning engagement with context, using proportional reasoning particularly in chance contexts, showing appreciation of the need for uncertainty in making predictions, and interpreting subtle aspects of language (Klein, Galdin and Mohamedou, 2016: 4).
← 7. Chapter 4 covers the two remaining pillars of the Cape Town Global Action Plan: resource mobilisation and multi-stakeholder partnerships.