Sweden
Sweden’s contribution to data for development
Strengthening statistical capacities and systems in developing countries is an important part of Sweden’s development co-operation which has been included in the Budget Bill for 2017 and the recently adopted Aid Policy Framework. Sweden engages in statistical capacity building in developing countries to support the improvement of their statistical production, strengthen data dissemination and improve statistical literacy of data users. Support is offered to national statistical systems mainly in the form of technical assistance – with financial support and funding for equipment being offered for some projects – and focuses mainly on gender and trade statistics.
Sweden considers its co-operation between the Swedish Statistical Authority and national counterparts in Burkina Faso and Mali to implement “continuous household surveys” to have been successful in enabling national authorities to build up long-term analytical capacity. Sweden gives financial contributions to the UN Global Pulse, which harnesses big data for development and humanitarian action.
According to the 2017 Partner Report on Support to Statistics (PRESS) dataset, Sweden committed on average USD 20.89 million per year to finance national statistical capacities and systems in developing countries in 2013-15.
Financial flows from Sweden to developing countries
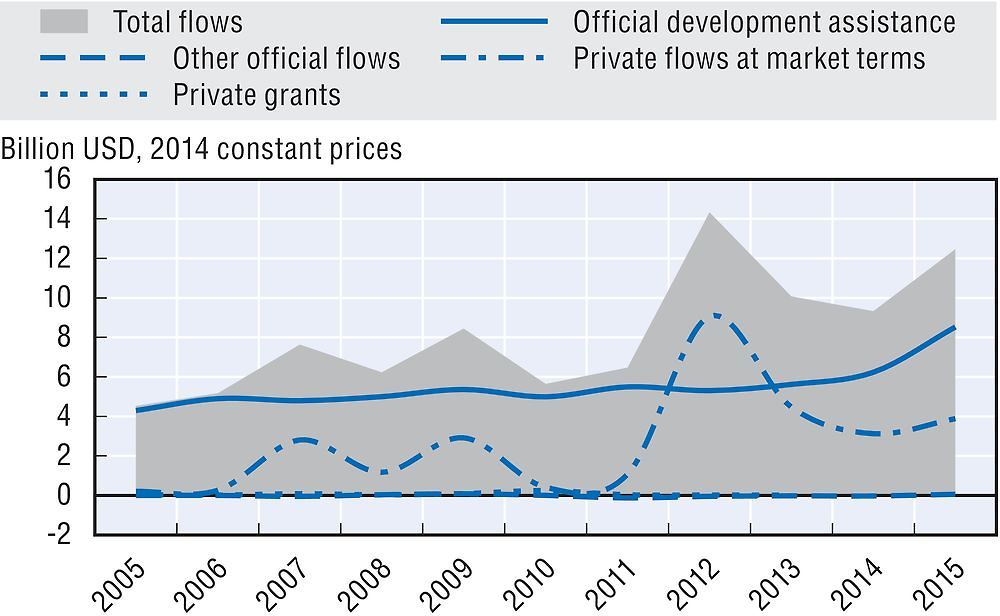
Note: Data on private grants are not available for 2014 or 2015.
Sweden’s use of ODA to mobilise other resources for sustainable development
-
USD 3.7 million of official development assistance (ODA) was committed to the mobilisation of domestic resources in developing countries, e.g. to support the development of their tax systems, in 2015.
-
USD 285 million of ODA (-23.2% in real terms from 2014) was committed to promote aid for trade and improve developing countries’ trade performance and integration into the world economy in 2015.
Sweden’s performance against commitments for effective development co-operation
Sweden’s official development assistance
In 2016, Sweden provided USD 4.9 billion in net ODA (preliminary data), which represented 0.94% of gross national income (GNI) and a 31.1% decrease in real terms from 2015, mostly due to lower costs for in-donor refugees compared to 2015, as well as lower contributions to multilateral organisations due to advance payments paid in 2015. Sweden is one of only six DAC members to have met the UN target of 0.7% and the government is committed by law to continue delivering 1% of its GNI to ODA, which is backed by a broad bipartisan support in parliament. Sweden’s share of untied ODA (excluding administrative costs and in-donor refugee costs) slightly increased from 85.8% in 2014 to 86.8% in 2015, and remains above the DAC average of 78.1% in 2015. The grant element of total ODA was 100% in 2015.
In 2016, in-donor refugee costs were USD 821 million, a decrease of 65.6% in real terms over 2015, and represented 16.9% of Sweden’s total net ODA.
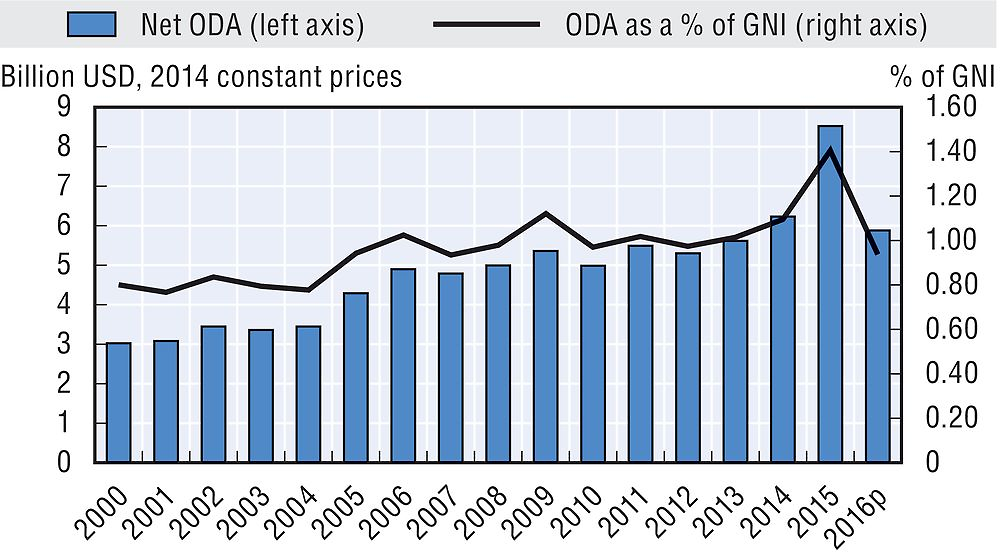
p: Preliminary data.
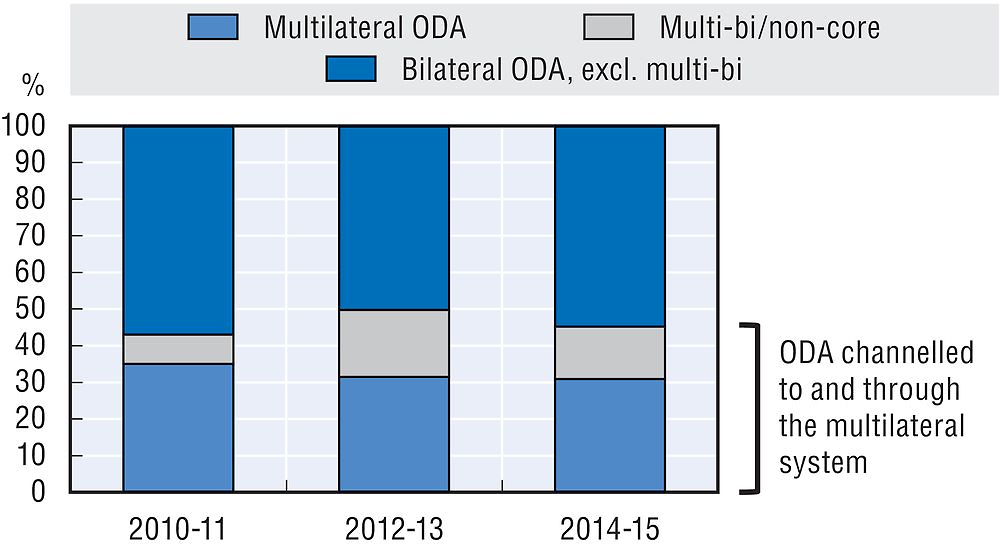
In 2015, 68.5% of ODA was provided bilaterally. Sweden allocated 31.6% of total ODA as core contributions to multilateral organisations, compared with the DAC country average of 26.2%. In addition, it channelled 15.6% of its bilateral ODA to specific projects implemented by multilateral organisations (multi-bi/non-core contributions).
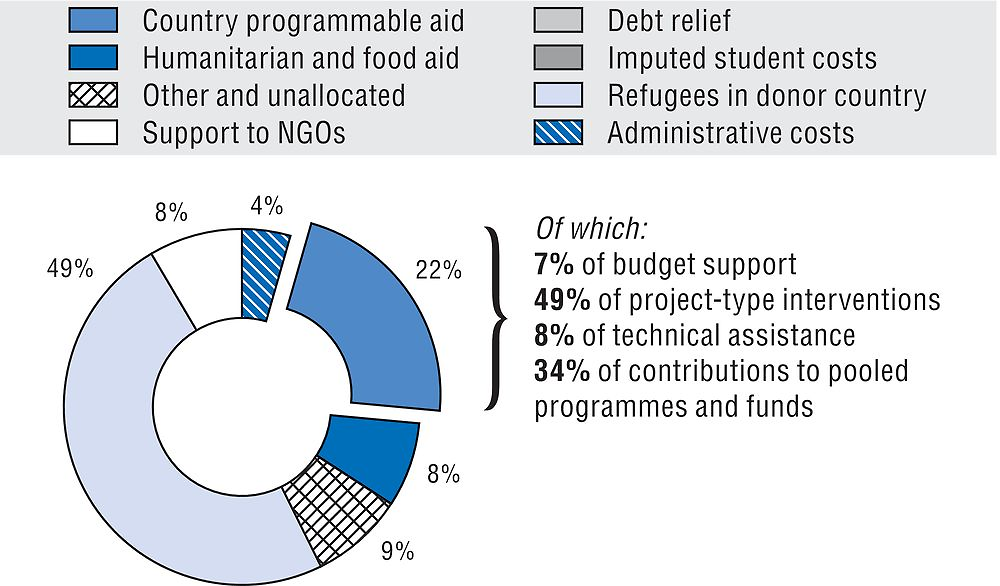
In 2015, 22% of bilateral ODA was programmed with partner countries, making Sweden’s share of country programmable aid lower than the DAC country average (48.8%). Project-type interventions accounted for 48.8% of this aid. Forty-nine per cent of bilateral ODA was allocated to refugees in donor country.
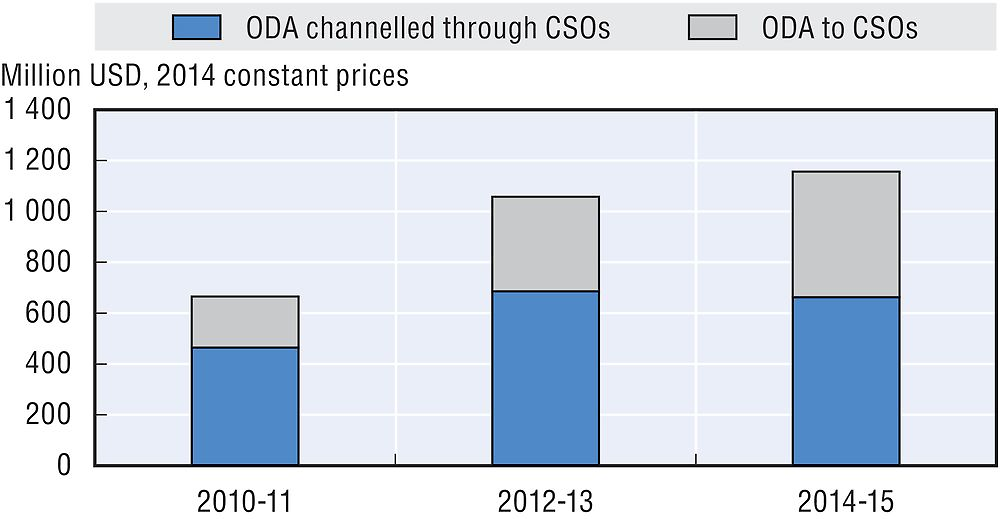
In 2015, USD 964.9 million of bilateral ODA was channelled to and through civil society organisations (CSOs). Between 2014 and 2015, ODA channelled to and through CSOs remained quite stable in terms of volume (+0.7% between 2014 and 2015), but decreased as a share of bilateral aid (from 26.1% to 19.7%). This share was higher than the 2015 DAC country average of 16.9%.
Bilateral ODA was primarily focused on sub-Saharan Africa. In 2015, USD 838 million was allocated to sub-Saharan Africa, USD 220.3 million to south and central Asia, and USD 187.7 million to the Middle East.
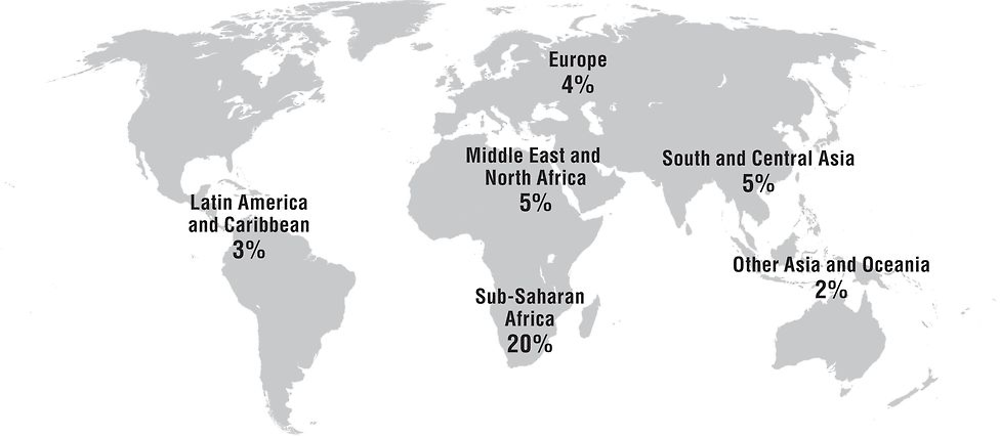
Note: 61% of bilateral ODA allocated was unspecified by region in 2014-15. This share is not represented on the map.
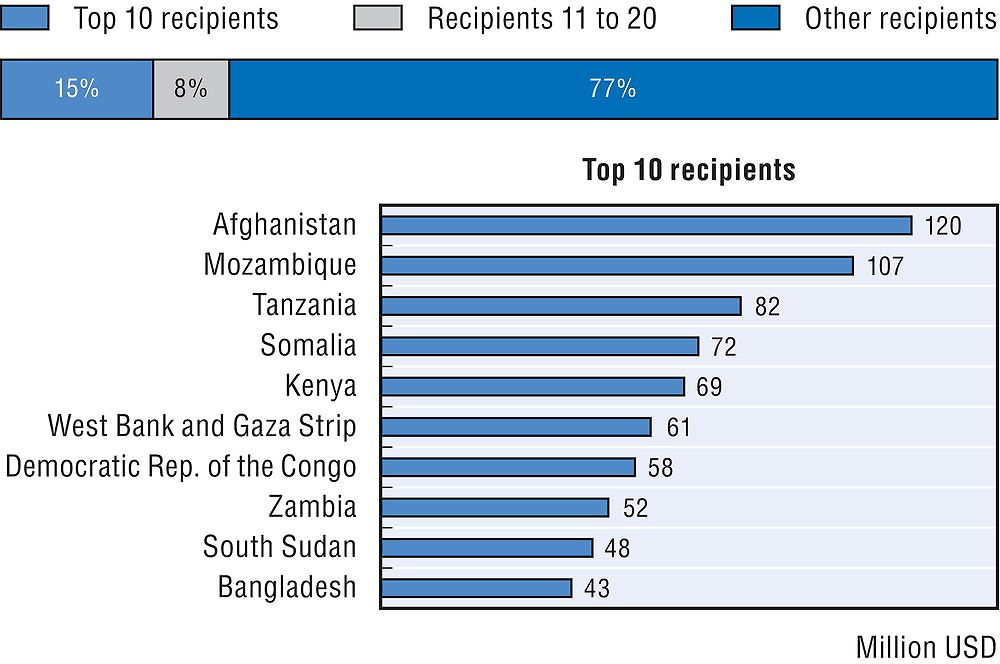
In 2015, 13.7% of bilateral ODA went to Sweden’s top 10 recipients. All of its top 10 recipients are priority partners for Sweden. In 2015, its support to fragile contexts reached USD 1.1 billion (23.1% of gross bilateral ODA).
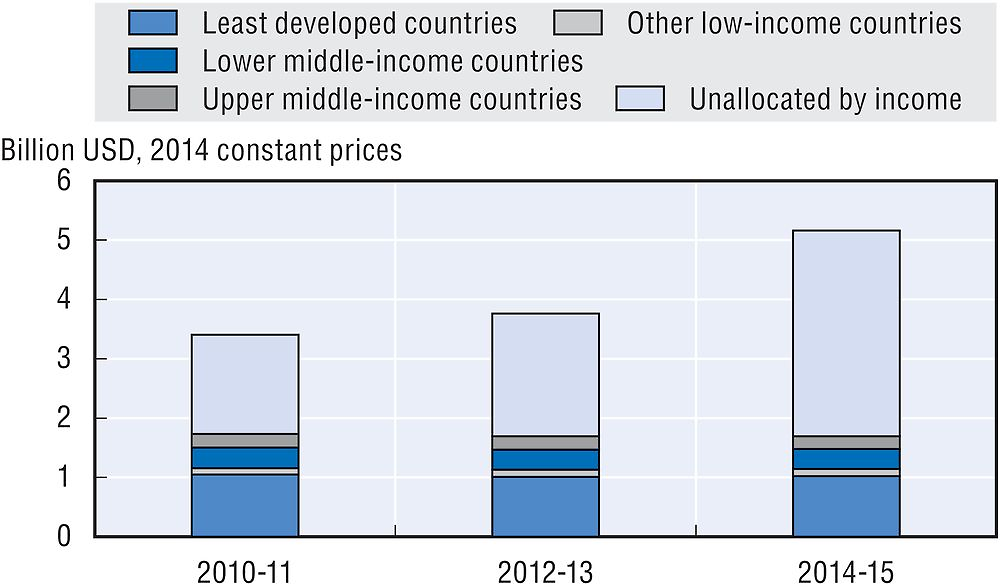
In 2015, 17.8% of bilateral ODA (USD 875.6 million) was allocated to least developed countries (LDCs). This is a decrease from 22.5% allocated to LDCs in 2015, and is lower than the DAC average of 24.3%. LDCs received the highest share of bilateral ODA in 2015, noting that 71.5% was unallocated by income group.
At 0.29% of GNI in 2015, total ODA to LDCs exceeds the UN target of 0.15% GNI.
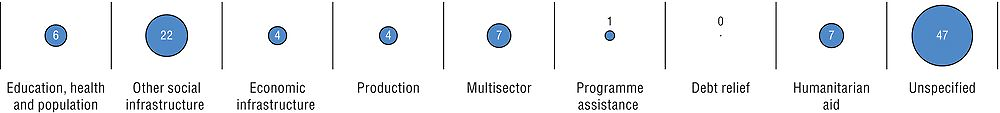
In 2015, 22.2% of bilateral ODA was allocated to social infrastructure and services, for a total of USD 958.5 million, with a strong focus on support to government and civil society (USD 673.2 million). Humanitarian aid amounted to USD 128.1 million.
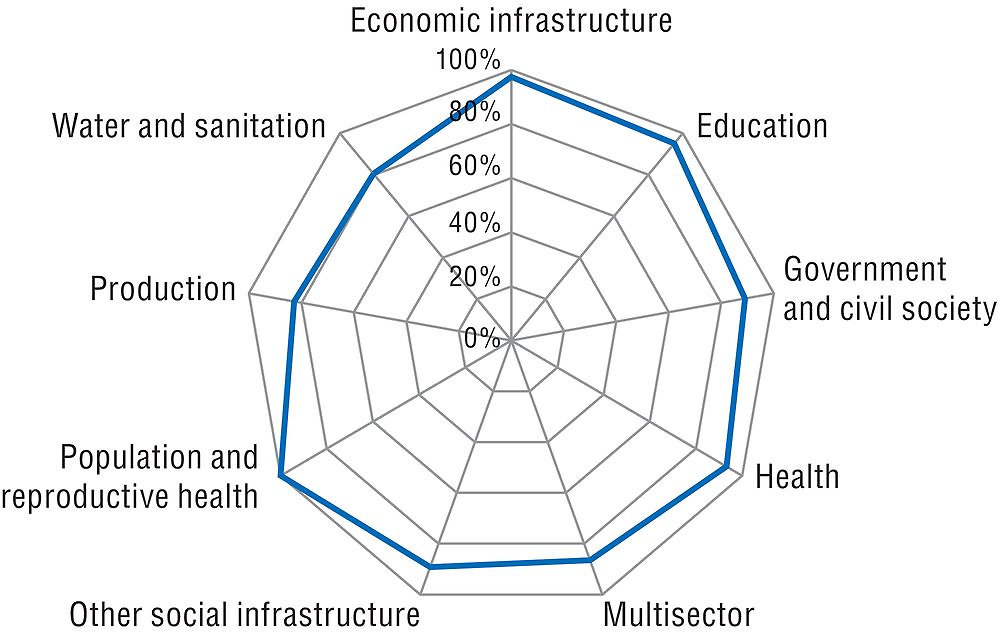
USD 1.5 billion of bilateral ODA supported gender equality in 2015. Gender equality has been solidly integrated into Sweden’s projects and programmes (OECD, 2014) as a cross-cutting thematic priority. In 2015, 88.8% of Swedish bilateral sector-allocable aid had gender equality and women’s empowerment as a principal or significant objective (up from 83.9% in 2014), compared with the DAC country average of 36.3%. Sweden’s aid has an important gender focus in all sectors. Sweden has also been striving to promote gender mainstreaming in its multilateral partners’ activities and in global fora. In addition, the Swedish government has adopted a new Feminist Foreign Policy approach, for which development co-operation is a key channel of delivery.
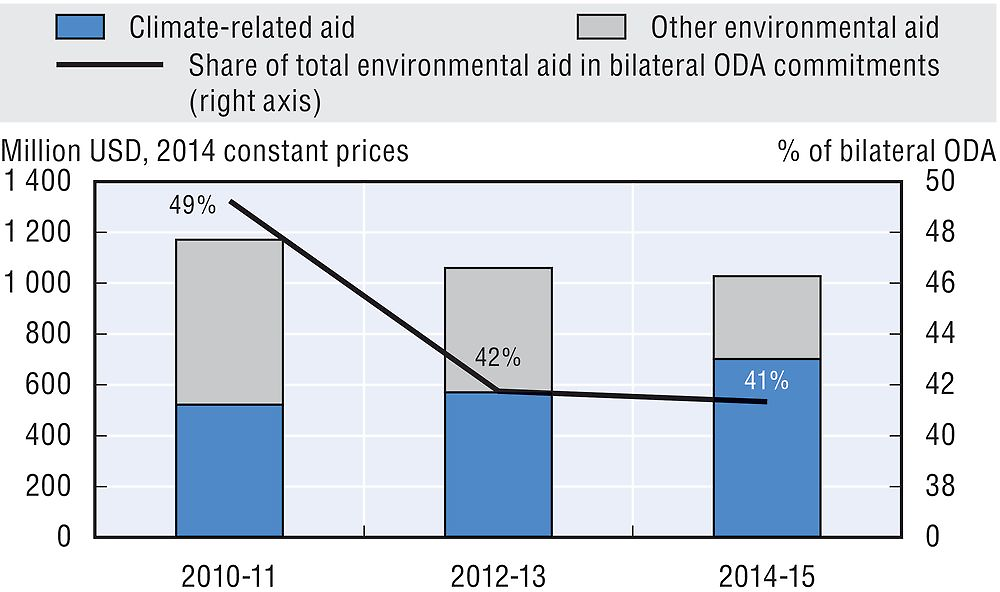
USD 678.2 million of bilateral ODA supported the environment in 2015. Sweden’s new aid policy1 places a greater emphasis on addressing climate change and environmental challenges, in line with its commitment to the 2030 Agenda and the COP 21 Paris Agreement. For example, Sweden is the largest per capita donor to the Green Climate Fund and the Global Environment Facility and also contributes to climate financing in developing countries via the Swedish International Development Co-operation Agency. In 2015, 39.6% of its bilateral allocable aid supported the environment and 27.7% (USD 474.9 million) focused on climate change, compared with the respective DAC country averages of 33.2% and 26.2%.
Note to reader: Annex B provides “Methodological notes on the profiles of Development Assistance Committee members”.
Reference
OECD (2014), OECD Development Co-operation Peer Reviews: Sweden 2013, OECD Publishing, Paris, https://doi.org/10.1787/9789264196254-en.
← 1. Available in Swedish at: www.regeringen.se/rattsdokument/skrivelse/2016/12/skr-20161760.