New Zealand
New Zealand’s contribution to data for development
New Zealand supports statistical capacity building in developing countries with the aim to improve national statistical production and statistical literacy of data users, and to promote the use of data by policy makers, civil society and citizens.
New Zealand engages in strengthening statistical capacities through bilateral initiatives and through funding multilateral and regional (in the Pacific more specifically) initiatives. Support takes the form of technical assistance and funding for equipment but also of direct financial support to national statistical offices or other government departments. An example of a relatively small but successful capacity-building initiative supported by New Zealand is a course offering certificates in official statistics to government officials. The course aims to improve understanding of official statistics, and their use in policy settings. The emphasis on using statistics in planning processes helps drive the demand for statistics, the dissemination of information and to improve the quality from national statistical offices.
According to the 2017 Partner Report on Support to Statistics (PRESS) dataset, New Zealand committed on average USD 0.22 million per year to finance national statistical capacities and systems in developing countries in 2013-15.
Financial flows from New Zealand to developing countries
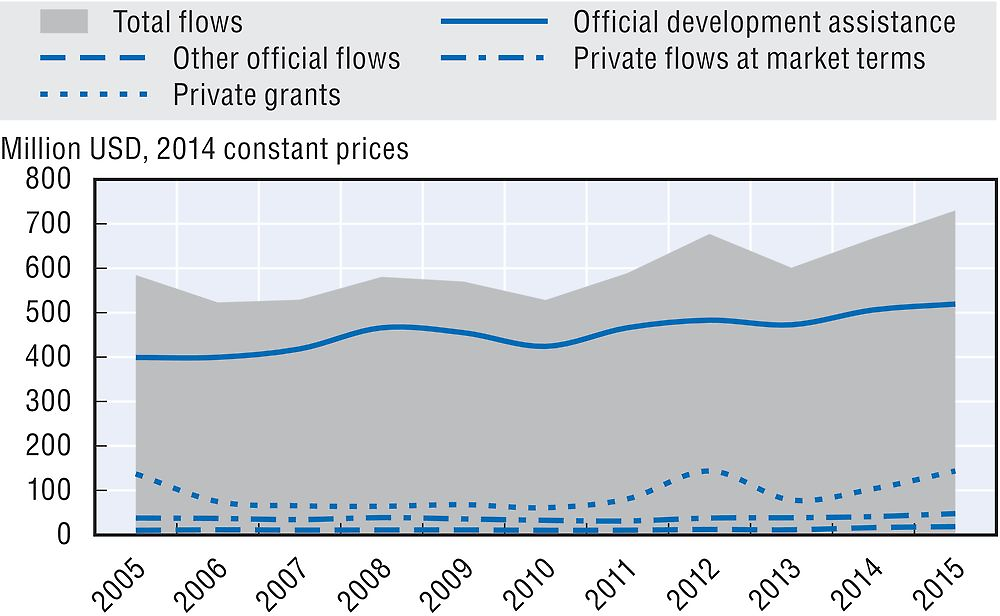
New Zealand’s use of ODA to mobilise other resources for sustainable development
-
USD 135.2 million of ODA (-19.6% in real terms from 2014) was committed to promote aid for trade and improve developing countries’ trade performance and integration into the world economy in 2015.
New Zealand’s performance against commitments for effective development co-operation
New Zealand’s official development assistance
In 2016, New Zealand provided USD 438 million in net ODA (preliminary data), which represented 0.25% of gross national income (GNI) and a decrease of 2.5% in real terms from 2015, due to annual fluctuations in its increased three-year aid budget. New Zealand has committed to a NZD 220 million increase in ODA over the 2015/16-2017/18 triennium. New Zealand’s share of untied ODA (excluding administrative costs and in-donor refugee costs) was 84.7% in 2015 (up from 81.8% in 2014), compared with the DAC average of 78.1%. The grant element of total ODA was 100% in 2015.
In 2016, in-donor refugee costs were USD 17 million, a decrease of 1.4% in real terms over 2015, and represented 3.8% of New Zealand’s total net ODA.
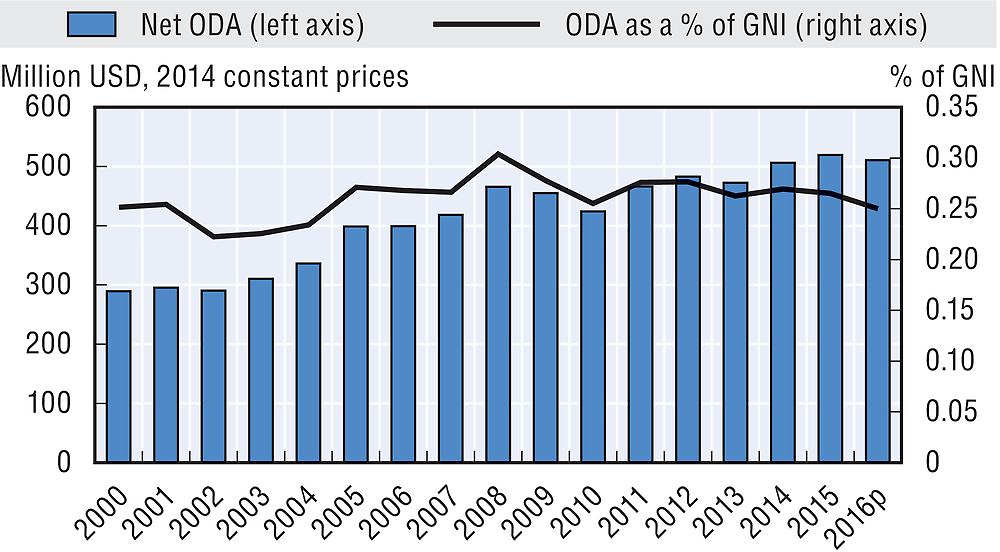
p: Preliminary data.
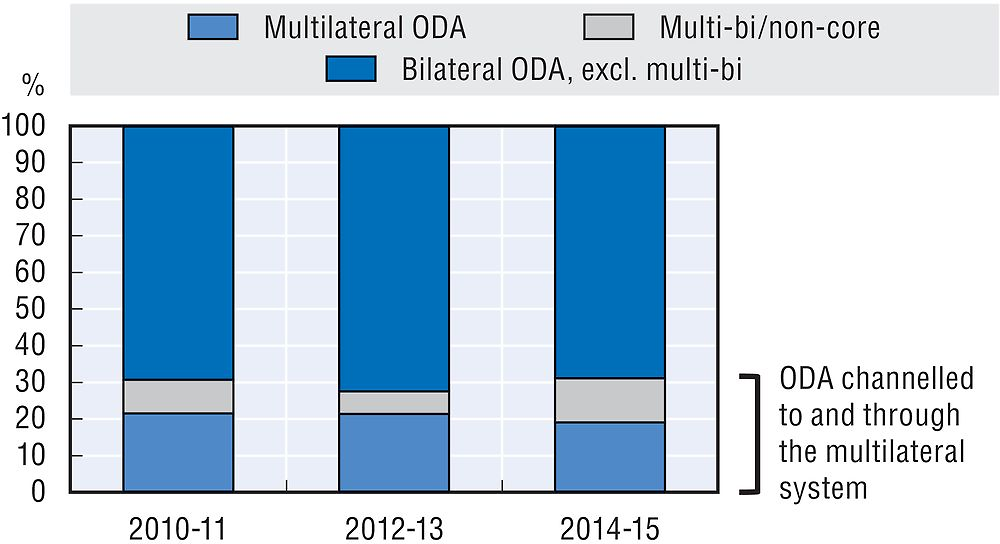
In 2015, 81.1% of ODA was provided bilaterally. New Zealand allocated 18.9% of total ODA as core contributions to multilateral organisations, compared with the DAC country average of 26.2%. In addition, it channelled 12.6% of its bilateral ODA for specific projects implemented by multilateral organisations (multi-bi/non-core contributions).
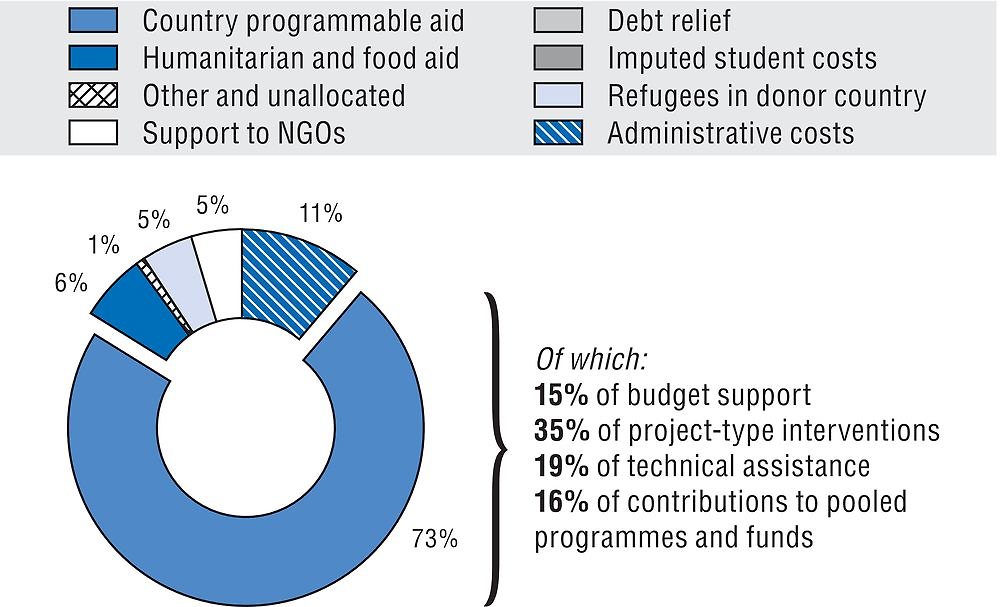
In 2015, New Zealand programmed 72.6% of bilateral ODA with partner countries. New Zealand’s share of country programmable aid was above the DAC country average 48.8% in 2015. Project-type interventions accounted for 35% of this aid.
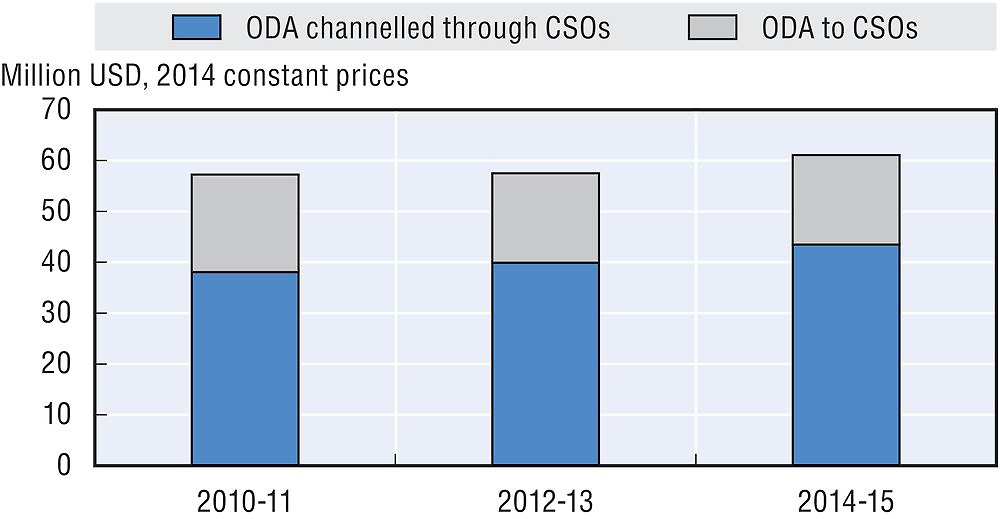
In 2015, USD 48.6 million of bilateral ODA was channelled to and through civil society organisations (CSOs). ODA channelled to and through CSOs decreased between 2014 and 2015 in terms of volume (-12%) and as a share of bilateral ODA (from 15.9% in 2014 to 13.6% in 2015). This share was lower than the 2015 DAC country average of 16.9%.
Bilateral ODA was strongly focused on Oceania and Asia. In 2015, USD 227.7 million was allocated to Oceania and USD 54.8 million to Far East Asia.
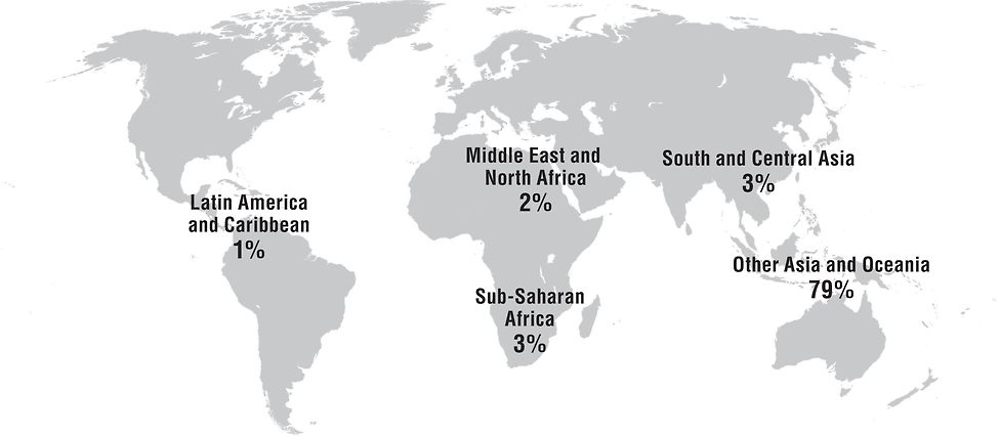
Note: 12% of bilateral ODA allocated was unspecified by region in 2014-15. This share is not represented on the map.
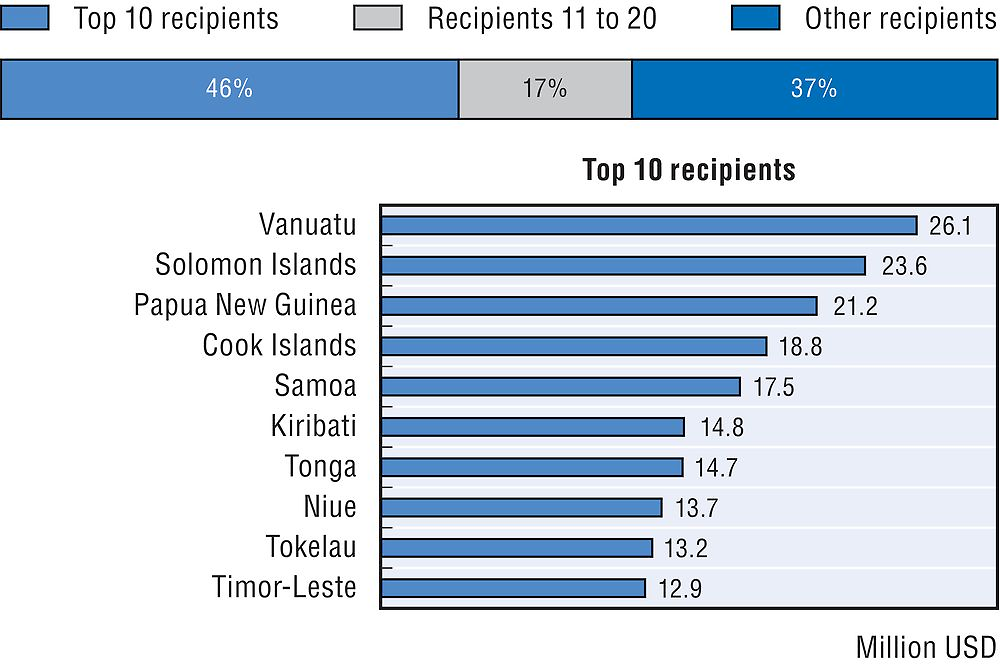
In 2015, 47.5% of bilateral ODA went to New Zealand’s top 10 recipients. All of its top 10 recipients are priority partner countries. Its support to fragile contexts reached USD 82.2 million in 2015 (22.9% of its gross bilateral ODA).
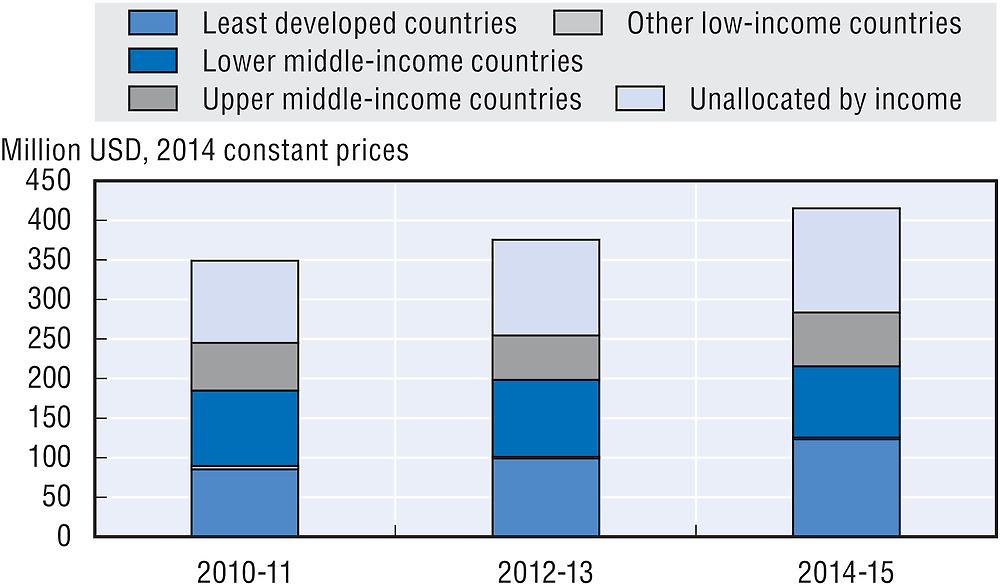
In 2015, 31.7% of bilateral ODA was allocated to least developed countries (LDCs), reaching USD 113.4 million. This is an increase from 27.7% in 2014 and is higher than the 2015 DAC average of 24.3%. Compared with other income groups, LDCs received the highest share of bilateral ODA in 2015, noting that 30.9% was unallocated by income group.
At 0.08% of New Zealand’s GNI in 2015, total ODA to LDCs was lower than the UN target of 0.15% of GNI. This reflects the geographical focus of New Zealand’s ODA on small island developing states in Oceania and Asia, many of which are not LDCs.
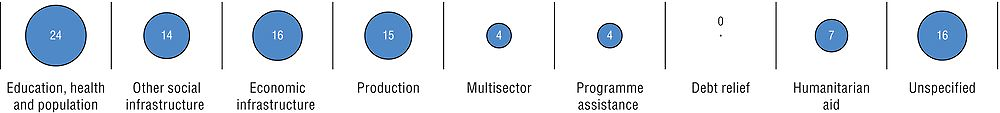
In 2015, 39% of bilateral ODA was allocated to social infrastructure and services, representing USD 139.7 million, with a strong focus on education (USD 74 million) and government and civil society (USD 35.7 million). USD 62.5 million was allocated to production sectors, in particular to agriculture (USD 32.3 million) and tourism (USD 16.4 million). USD 21.9 million was allocated to humanitarian aid.
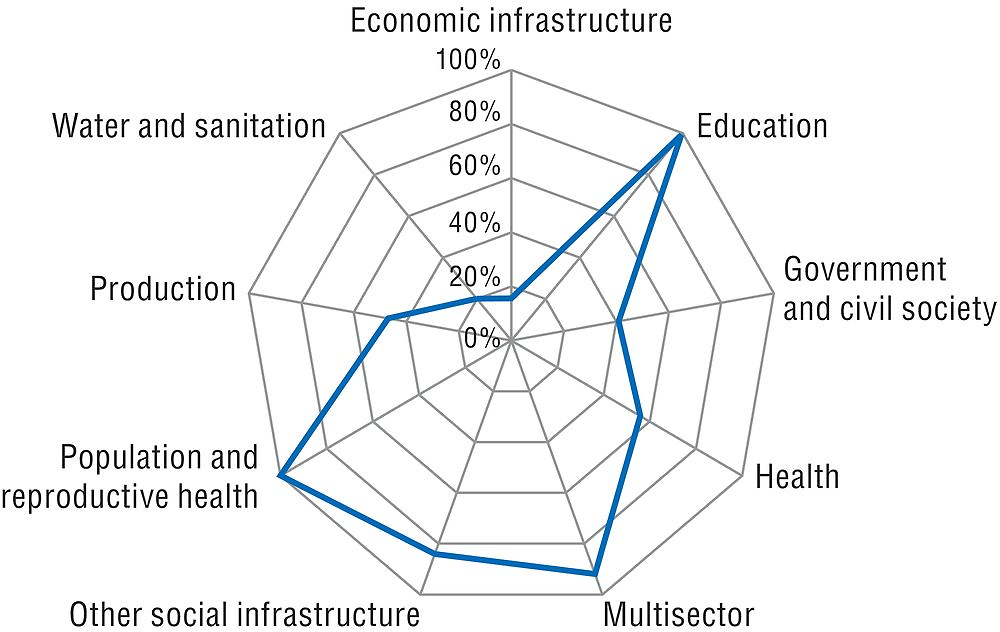
USD 174.6 million of bilateral ODA supported gender equality. In 2015, 58% of New Zealand’s bilateral allocable aid had gender equality and women’s empowerment as a principal or significant objective, compared with the DAC country average of 36.3%, reversing the decline observed since 2007-08. New Zealand’s aid to population and reproductive health and education focuses on gender.
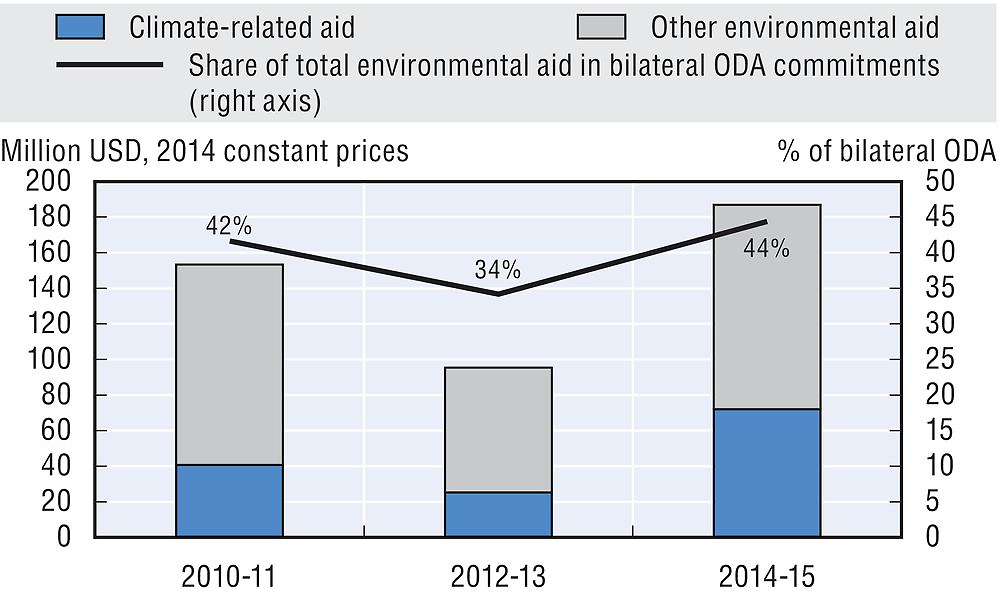
USD 138.6 million of bilateral ODA contributed to environmental outcomes in 2015. The share of New Zealand’s bilateral allocable aid that focused on the environment was 46% and 15% (USD 45.1 million) concentrated on climate change (mostly on adaptation), compared with the respective DAC country averages of 33.2% and 26.2%.
Note to reader: Annex B provides “Methodological notes on the profiles of Development Assistance Committee members”.