Canada
Canada’s contribution to data for development
Canada believes that national statistical systems that provide quality and disaggregated data for evidence-based decision making are a cornerstone of good governance and strong democratic institutions. It supports statistical production; data dissemination; use of data by policy makers, civil society and citizens; and capacity to measure progress, including towards the Sustainable Development Goals. Support is provided mainly in the form of technical assistance.
Canada’s capacity building in the health sector focuses on information management systems and civil registration and vital statistics. It supports partner governments to strengthen nutrition surveillance, tracking of vaccination coverage, pandemic preparedness and evaluation platforms. Canada has also established a global network of partners around the Open Data for Development initiative. Through the International Aid Transparency Initiative, it works to make more and better data available on development co-operation and promotes the use of data for results.
Statistics Canada is actively involved in statistical capacity building. For instance, it provides technical assistance to the National Agency of Statistics and Demography of Senegal to improve the quality of statistics.
According to the 2017 Partner Report on Support to Statistics (PRESS) dataset, Canada committed on average USD 52.28 million per year to finance national statistical capacities and systems in developing countries in 2013-15.
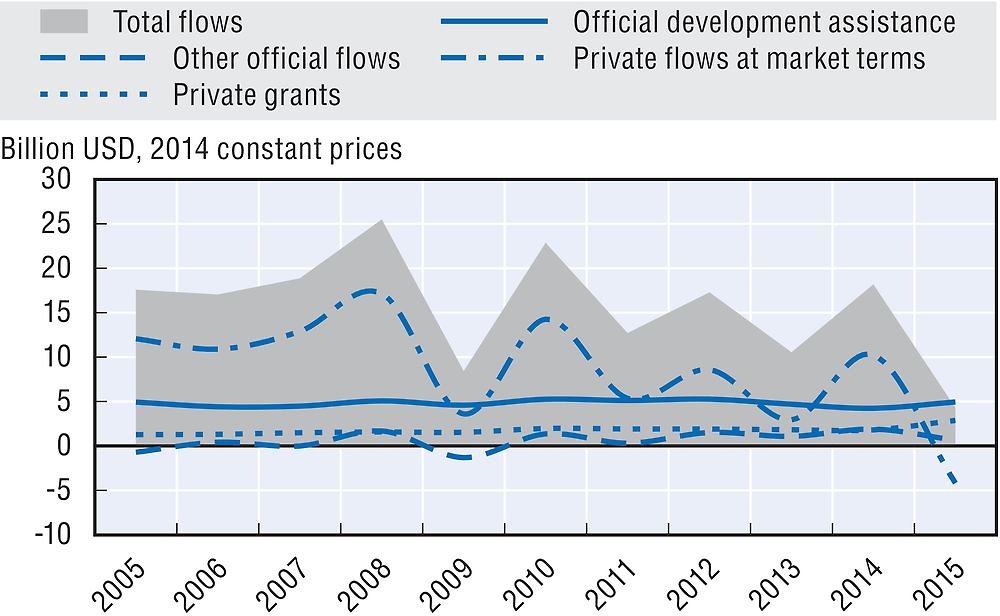
Financial flows from Canada to developing countries
Canada’s use of ODA to mobilise other resources for sustainable development
-
USD 4.5 million of official development assistance (ODA) was committed to the mobilisation of domestic resources in developing countries, e.g. to support the development of their tax systems, in 2015.
-
USD 713.2 million of ODA (+78.3% in real terms from 2014) was committed to promote aid for trade and improve developing countries’ trade performance and integration into the world economy in 2015.
Canada’s performance against commitments for effective development co-operation
Canada’s official development assistance
In 2016, Canada provided USD 4 billion in net ODA (preliminary data). This represented 0.26% of gross national income (GNI) and a decrease of 4.4% in real terms from 2015 due to the timings of payments, although it has increased support to in-donor refugees. The 2016 budget allocated an additional CAD 256 million for 2016-17 and 2017-18. Canada’s share of untied ODA (excluding administrative costs and in-donor refugee costs) was 98.5% in 2015 (up from 93% in 2014), which is above the DAC average of 78.1%. The grant element of total ODA was 97.3% in 2015.
In 2016, in-donor refugee costs were USD 390 million, an increase of 89.2% in real terms over 2015, and represented 9.9% of Canada’s total net ODA.
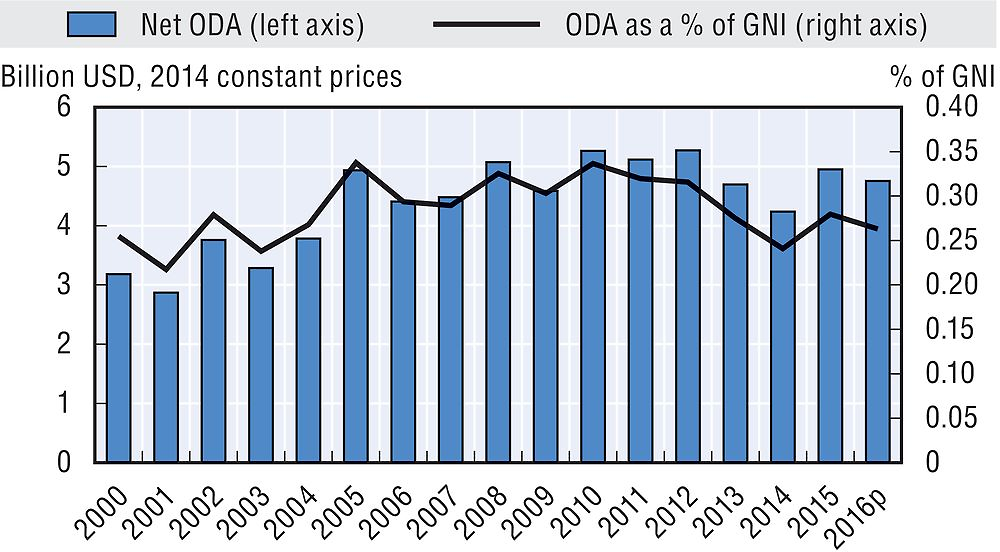
p: Preliminary data.
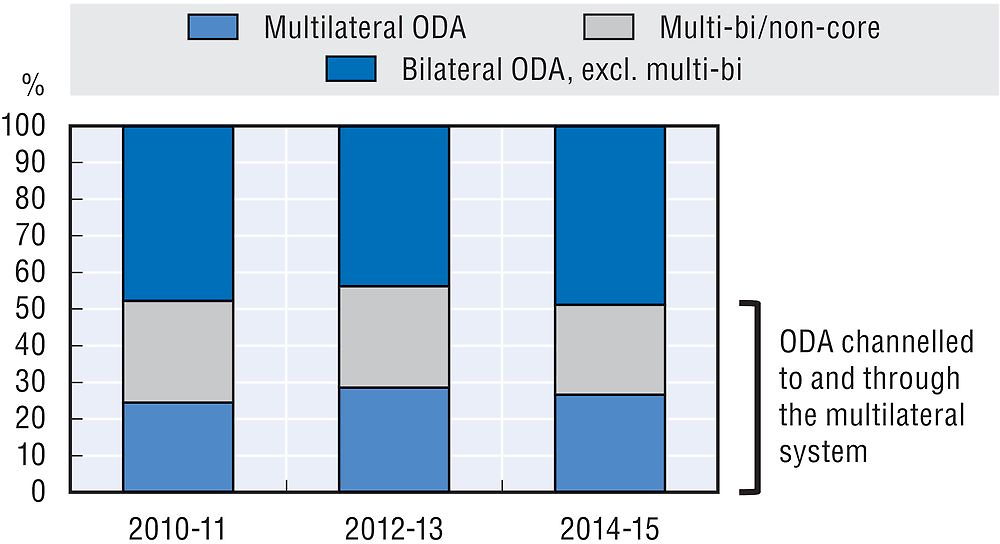
In 2015, 69.8% of bilateral ODA was provided bilaterally. In 2015, Canada allocated 30.2% of total ODA as core contributions to multilateral organisations, compared with the DAC country average of 26.2%. In addition, it channelled 34.3% of its bilateral ODA for specific projects implemented by multilateral organisations (multi-bi/non-core).
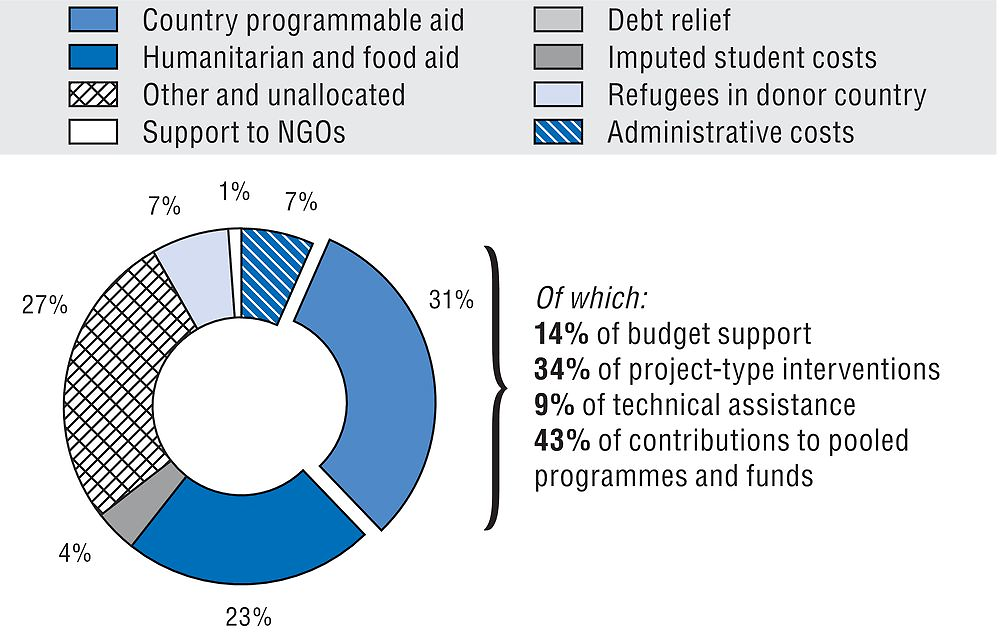
In 2015, 31.2% of bilateral ODA was programmed with partner countries. Canada’s share of country programmable aid was lower than the DAC country average (48.8%) in 2015 and contributions to pooled programmes and funds accounted for 43% of this aid. Twenty-seven per cent of Canada’s bilateral ODA was categorised as “other and unallocated”.
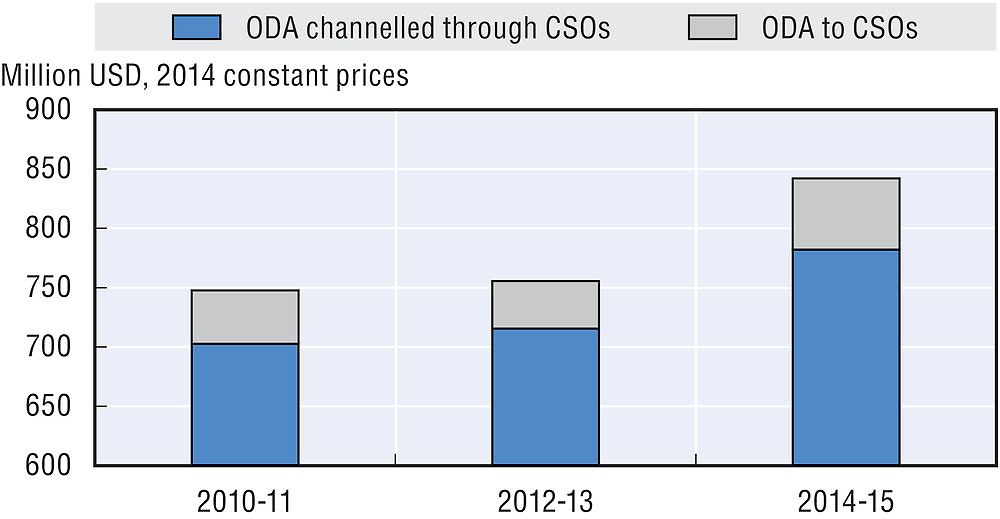
In 2015, USD 750.3 million of bilateral ODA was channelled to and through civil society organisations (CSOs). Aid channelled to and through CSOs increased between 2014 and 2015 in terms of volume (+6.6%) and remained stable as a share of bilateral ODA (it was 24.5% in 2014 and 24.9% in 2015). This share was higher than the DAC country average of 16.9%.
In 2015, bilateral ODA primarily focused on sub-Saharan Africa and the Middle East. USD 944.3 million of bilateral ODA was allocated to sub-Saharan Africa, and USD 379.4 million to the Middle East.
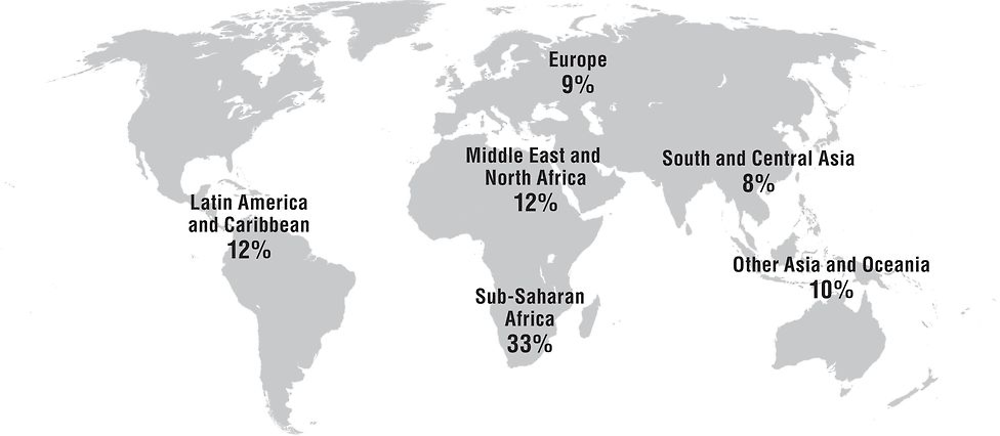
Note: 16% of bilateral ODA allocated was unspecified by region in 2014-15. This share is not represented on the map.
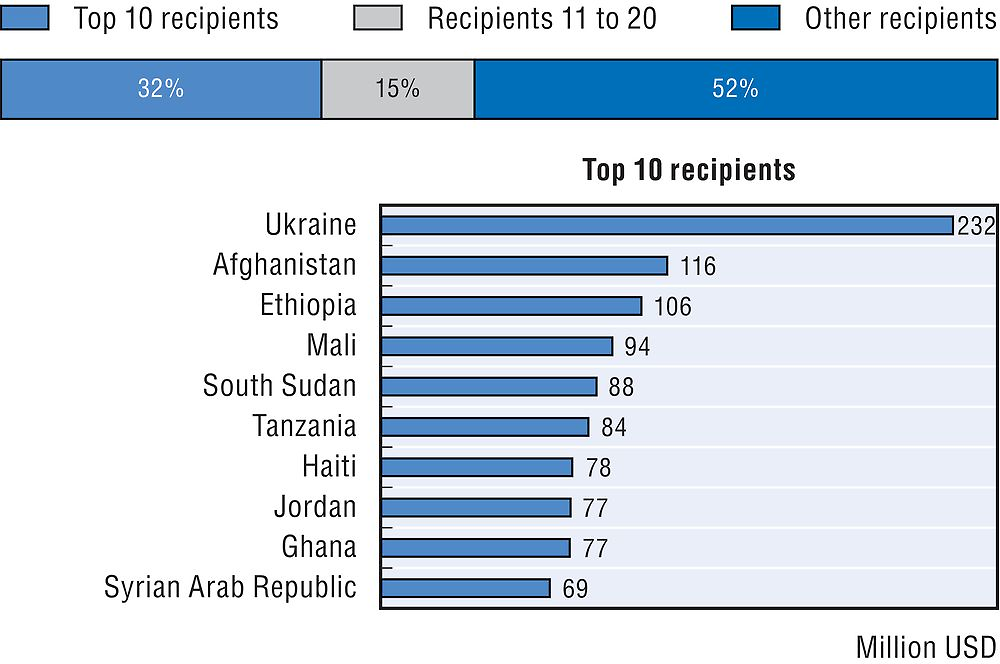
In 2015, 34.9% of bilateral ODA went to Canada’s top 10 recipients. Nine of the top 10 recipients of Canadian aid were from Canada’s 25 “countries of focus”. Its support to fragile contexts reached USD 1.2 billion (40.9% of gross bilateral ODA) in 2015.
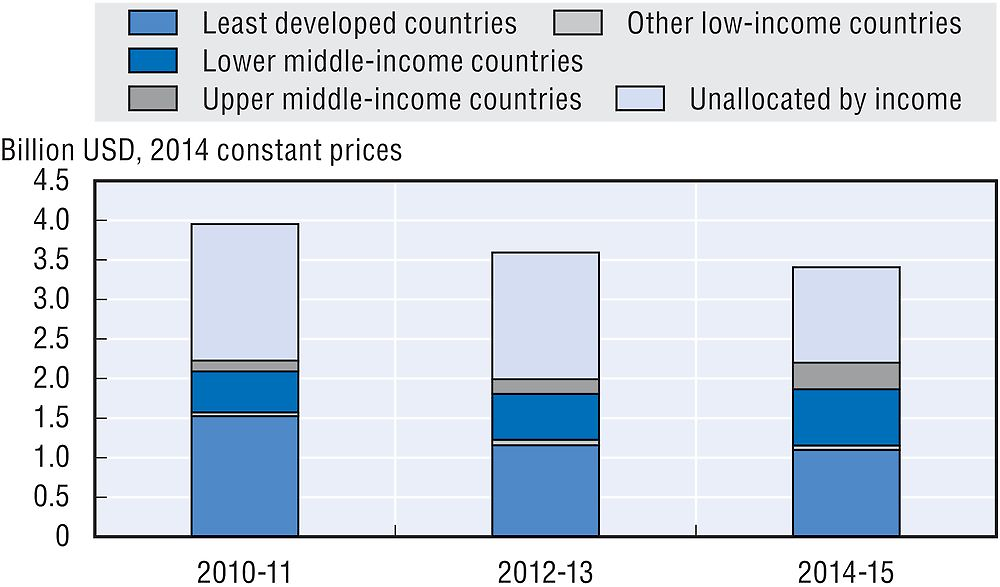
In 2015, 33.1% of bilateral ODA was allocated to least developed countries (LDCs), amounting to USD 998.4 million. The share has increased from 31.3% in 2014 and remains higher than the 2015 DAC average of 24.3%. LDCs received the highest share of bilateral ODA in 2015, noting that 32.9% was unallocated by income group.
At 0.1% of GNI in 2015, total ODA to LDCs was lower than the UN target of 0.15% of GNI.
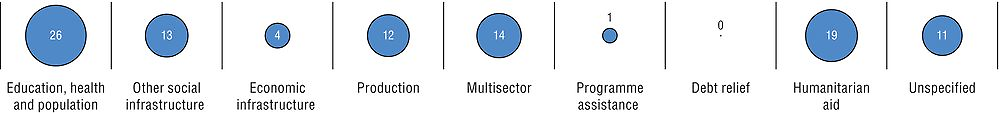
In 2015, 39.7% of bilateral ODA was allocated to social infrastructure and services, amounting to USD 1.4 billion. There was a strong focus on support to health (USD 471 million), government and civil society (USD 351.9 million), and education (USD 292.2 million). Humanitarian aid amounted to USD 631.4 million.
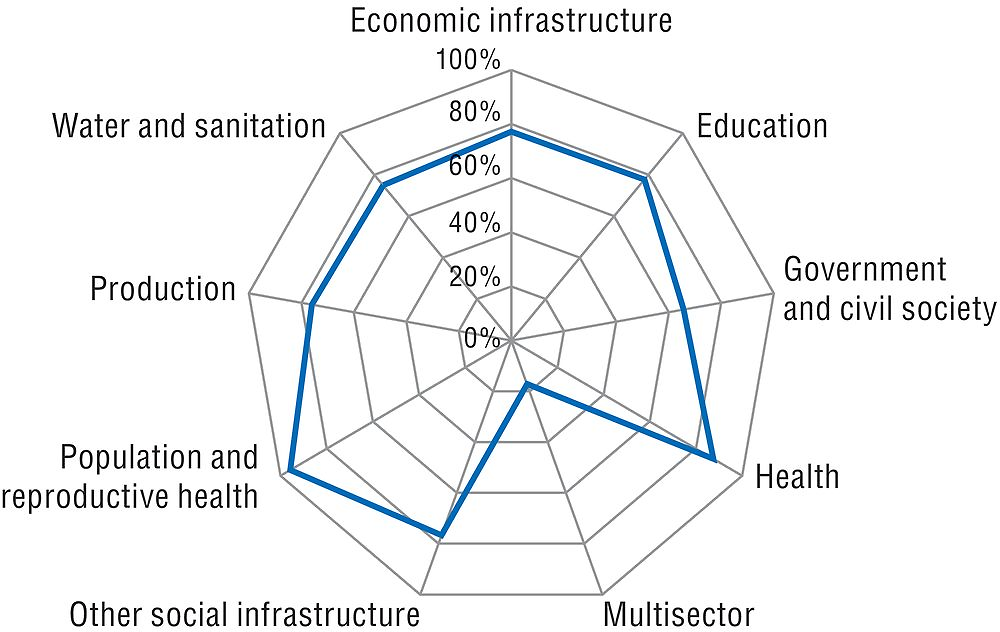
USD 2.2 billion of bilateral ODA supported gender equality and the empowerment of women and girls in 2015. Canada has a long track record of mainstreaming gender equality across its programmes and raising the issue in policy dialogue with partners. In 2015, 71.7% of its bilateral allocable aid had gender equality and the empowerment of women and girls as either a principal or significant objective (up from 60.2% in 2014), compared with the DAC country average of 36.3%. Moving forward, Canada is committed to taking a feminist approach to international assistance, by putting gender equality and the empowerment of all women and girls at the heart of its efforts. A high share of Canada’s aid to population and reproductive health focuses on gender.
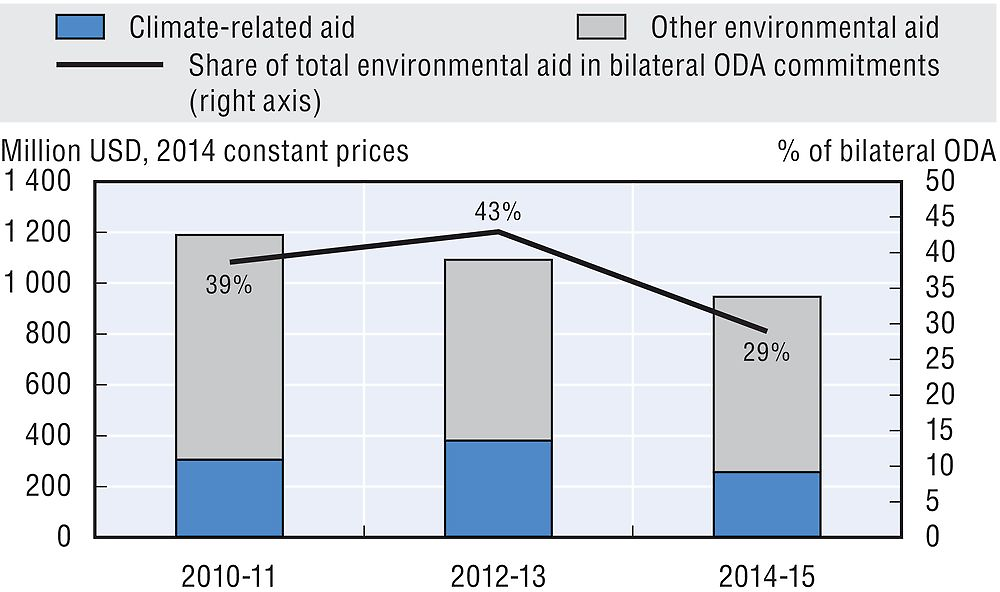
USD 885.6 million of bilateral ODA supported the environment in 2015. Environmental sustainability is a cross-cutting priority for Canada. In 2015, 28.5% of Canadian bilateral allocable aid supported the environment and 10.6% (USD 328.3 million) focused particularly on climate change (up from 4.5% in 2014), compared with the respective DAC country averages of 33.2% and 26.2%.
Note to reader: Annex B provides “Methodological notes on the profiles of Development Assistance Committee members”.