Australia
Australia’s contribution to data for development
Australia focuses on collecting and using quality data to inform decision making. Its capacity building, including through the Pacific Islands Statistics Strengthening Programme, focuses on improving statistical production and literacy and strengthening data dissemination and use by policy makers, civil society and citizens. Australia works with national statistics offices and other actors to build comparable data that enables global dialogue and better targeting of resources.
On gender statistics, Australia invests in the enabling environment for accessible data, in developing gender-sensitive and multidimensional measures of poverty as well as indicators on the prevalence of violence against women and girls and on unpaid work. It advocates for the need to interrogate household-level data, build capacity to analyse and use data on violence against women, and invest in disability statistics.
Its regional and bilateral sector programmes provide targeted capacity building for relevant ministries to collect, manage and disseminate data to inform decision making. In collaboration with partners, Australia is also working with big data, using mobile technology to collect vital health data.
According to the 2017 Partner Report on Support to Statistics (PRESS) dataset, Australia committed on average USD 12.4 million per year to finance national statistical capacities and systems in developing countries in 2013-15.
Financial flows from Australia to developing countries
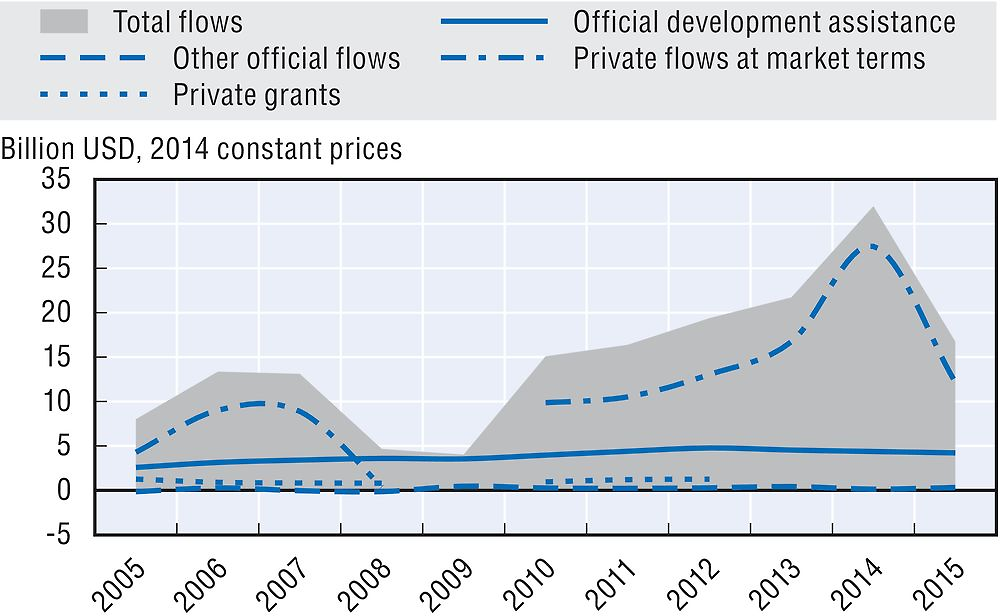
Note: Data on private flows at market terms are not available for 2009. Data on private grants are not available for 2009 or 2013-15.
Australia’s use of ODA to mobilise other resources for sustainable development
-
USD 7.7 million of official development assistance (ODA) was committed to the mobilisation of domestic resources in developing countries, e.g. to support the development of their tax systems, in 2015.
-
USD 386 million of ODA (+21.5% in real terms from 2014) was committed to promote aid for trade and improve developing countries’ trade performance and integration into the world economy in 2015.
Australia’s performance against commitments for effective development co-operation
Australia’s official development assistance
Australia provided USD 3 billion in net ODA in 2016 (preliminary data), which represented 0.25% of gross national income (GNI) and a fall of 12.7% in real terms from 2015, due to cuts in the bilateral aid programme. Australia’s share of untied ODA (excluding administrative costs and in-donor refugee costs) was 100% in 2015 (up from 89.1% in 2014), while the DAC average was 78.1%. The grant element of total ODA was 99.9% in 2015.
Australia did not report expenditure on in-donor refugee costs as ODA in 2016. It considers that its processing of irregular migrants does not align with DAC rules for in-donor refugee costs.
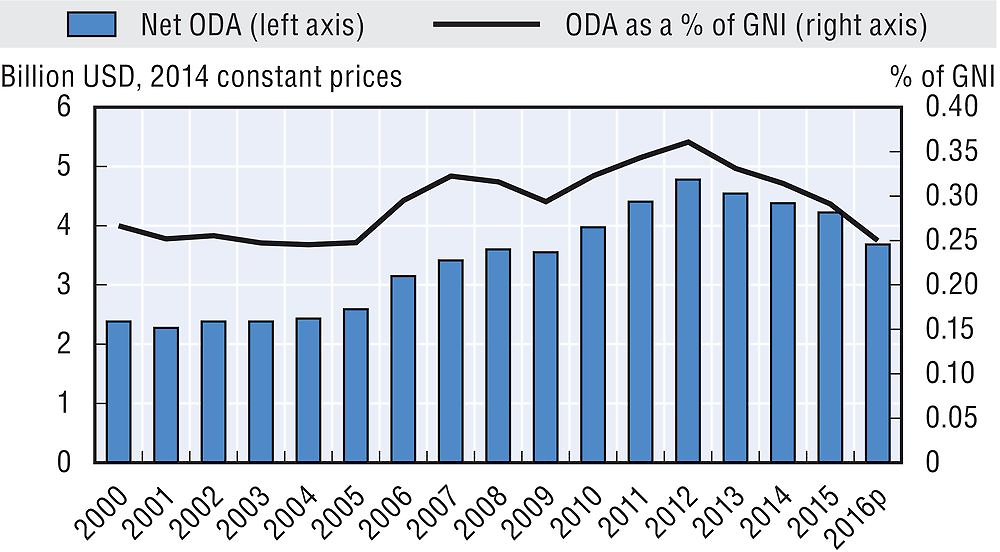
p: Preliminary data.
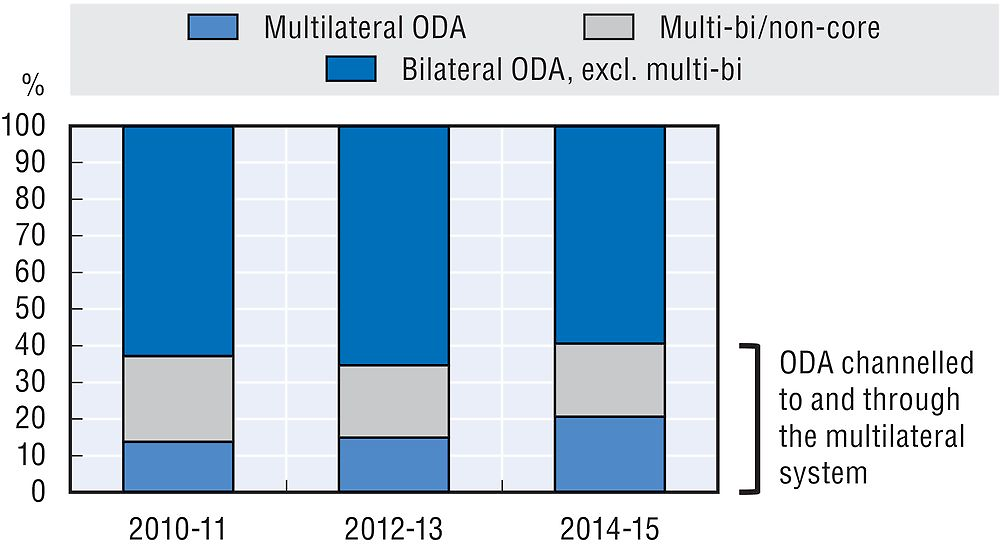
In 2015, 78.8% of ODA was provided bilaterally. Australia allocated 21.2% of total ODA as core contributions to multilateral organisations, compared with the DAC country average of 26.2%. In addition, it channelled 23.2% of its bilateral ODA for projects implemented by multilateral organisations (multi-bi/non-core).
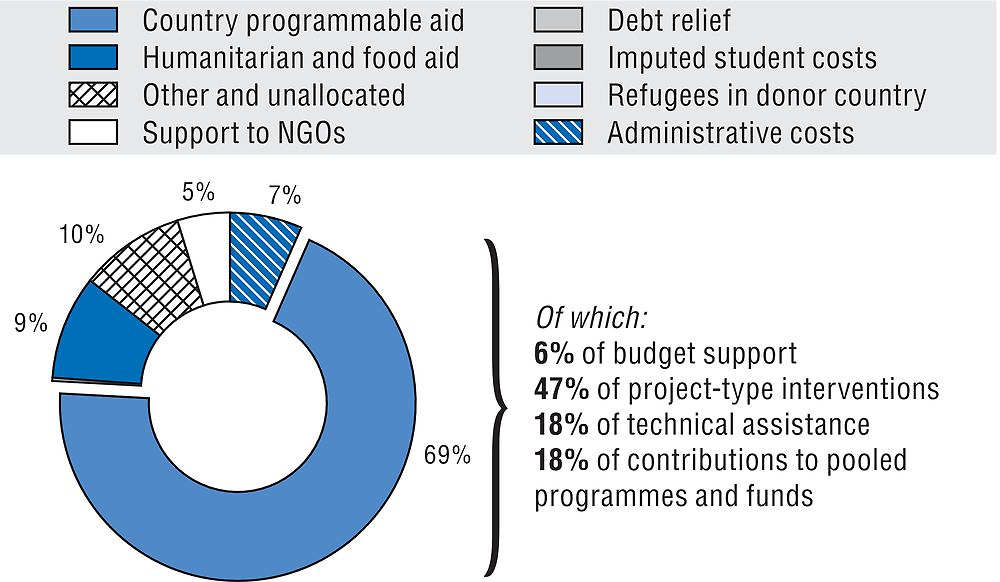
In 2015, 69.3% of bilateral ODA was programmed with partner countries. Australia’s share of country programmable aid was above the DAC country average (48.8%) and 47% of this aid consisted of project-type interventions.
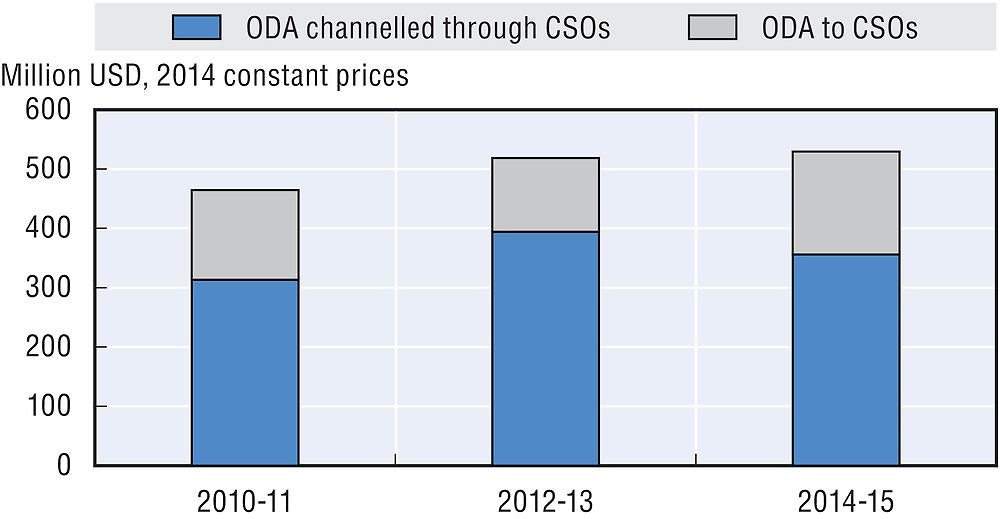
In 2015, USD 406.6 million of bilateral ODA was channelled to and through civil society organisations (CSOs). This was equivalent to 14.8% of bilateral ODA, compared with the DAC average of 16.9%. Aid to and through CSOs has decreased since 2014, both in volume (-13.2%) and as a share of bilateral ODA (from 16.1% to 14.8%).
In 2015, bilateral ODA was primarily focused on Asia and Oceania. USD 852.1 million was allocated to Oceania, USD 759.8 million to Far East Asia, and USD 329 million to south and central Asia. USD 91 million was allocated to sub-Saharan Africa. Bilateral allocations to sub-Saharan Africa are decreasing in line with government policy.
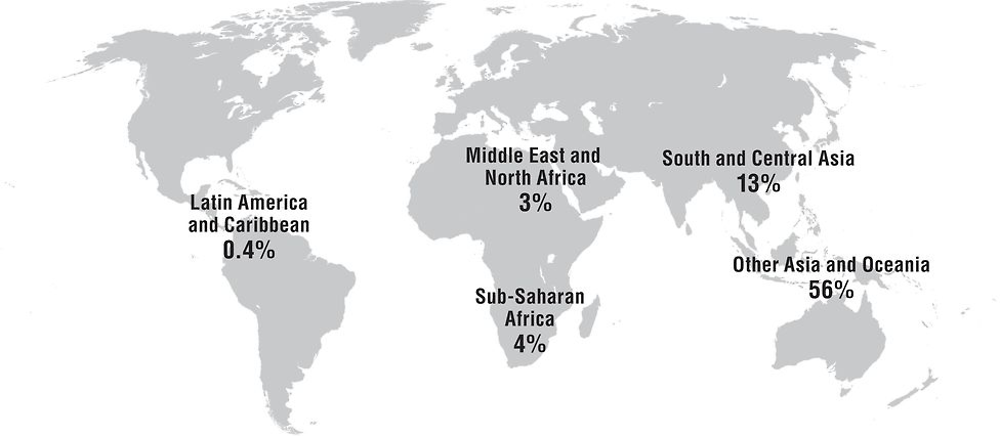
Note: 23% of bilateral ODA allocated was unspecified by region in 2014-15. This share is not represented on the map.
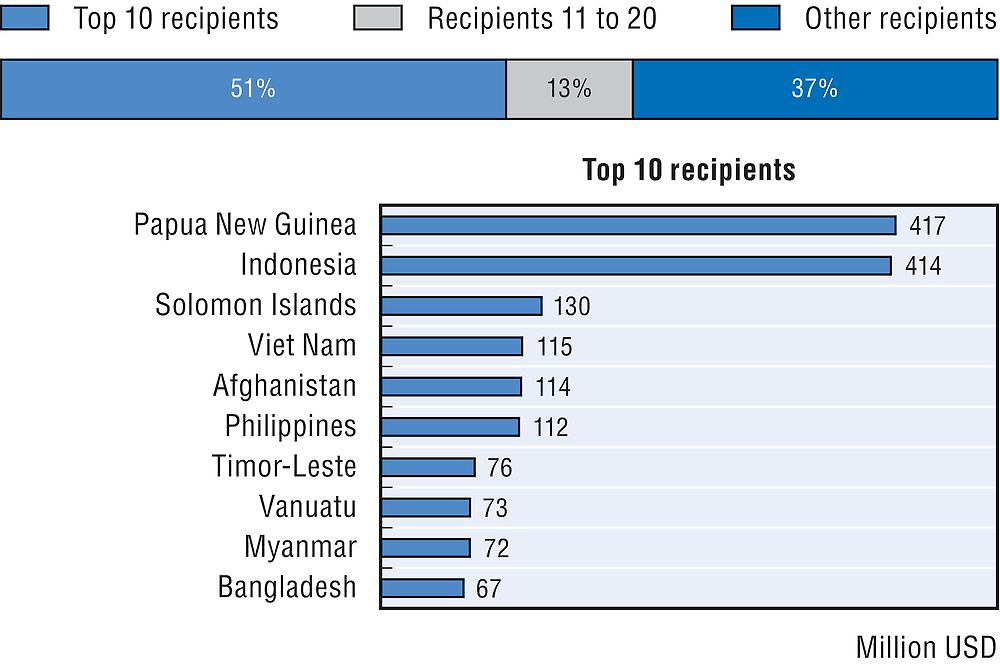
In 2015, 52.5% of bilateral ODA went to Australia’s top 10 recipients. Its top 10 recipients are in the Asia-Pacific region, where Australia has programmes with 25 countries, in line with its focus on its immediate neighbourhood. Its support to fragile contexts reached USD 1.1 billion in 2015 (38.6% of gross bilateral ODA).
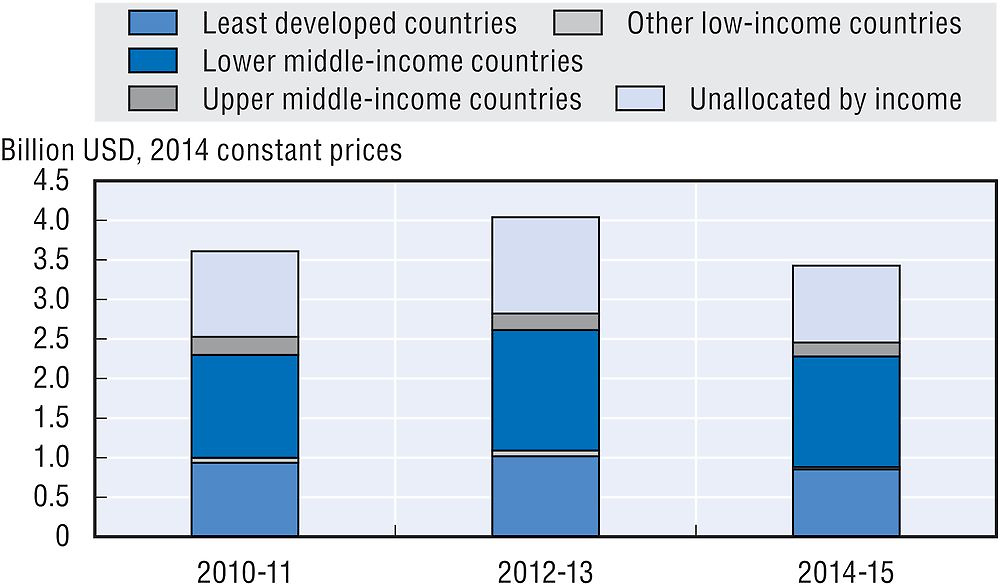
In 2015, 24.6% of Australia’s bilateral ODA was allocated to least developed countries (LDCs), corresponding to USD 678.8 million. This is down from 25.2% in 2014 and is in line with the DAC average of 24.3%. Lower middle-income countries received the highest share of bilateral ODA in 2015 (42.1%).
At 0.08% of GNI in 2015, total ODA to LDCs was lower than the UN target of 0.15% of GNI.
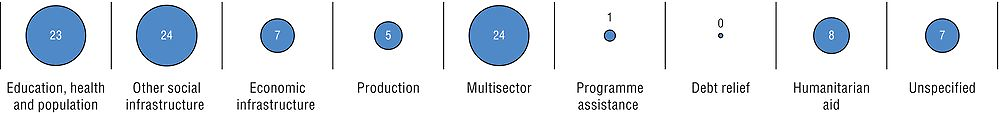
In 2015, 45.3% of bilateral ODA was allocated to social infrastructure and services, representing USD 1.2 billion. There was a strong focus on support to government and civil society (USD 512.6 million), education (USD 333.5 million), and health (USD 166.2 million). Humanitarian aid amounted to USD 238.7 million.
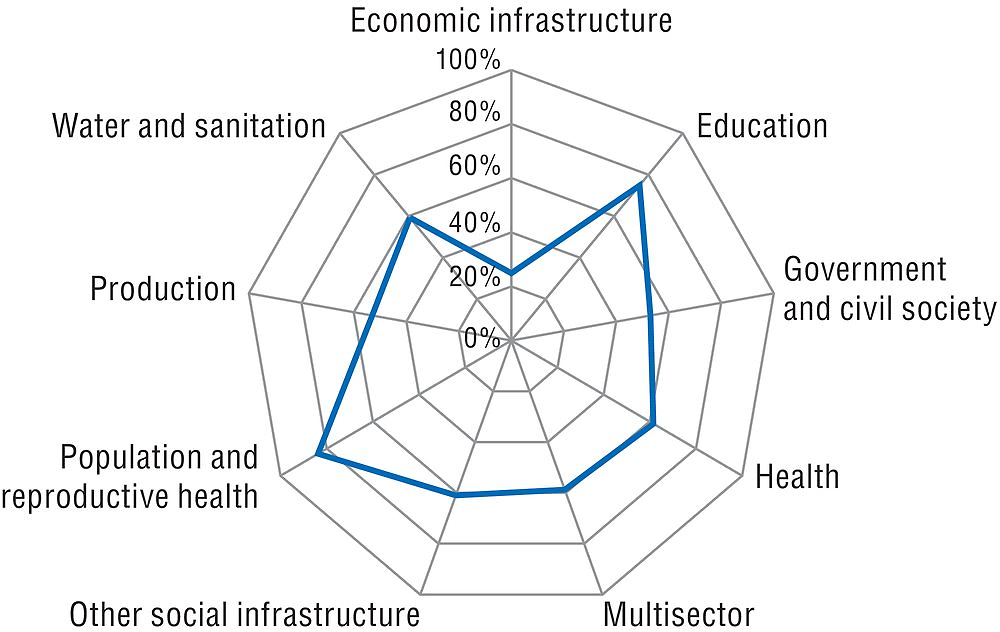
USD 1.3 billion of bilateral ODA supported gender equality in 2015. Empowering women and girls and promoting gender equality are central to Australia’s development co-operation and international diplomacy. Australia has a strategic target of 80% of investments performing satisfactorily on gender equality, as measured through its aid quality check process. In 2016, it rated 78% of aid investments as effectively addressing gender equality in their implementation. OECD data show that in 2015, 54.1% of Australia’s bilateral allocable aid had gender equality and women’s empowerment as a principal or significant objective. This is lower than the 2014 level of 57% but remains higher than the 2015 DAC country average of 36.3%. Australia’s aid to population, reproductive health and education focuses on gender.
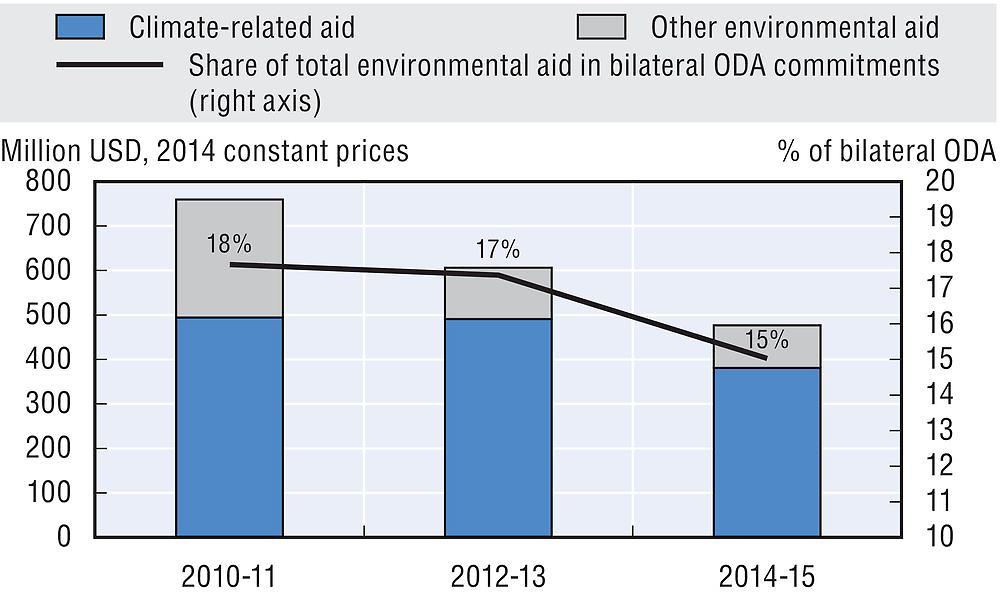
USD 378 million of bilateral ODA supported the environment in 2015. Australia’s development policy commits Australia’s aid programme to “… actively manage risk by mitigating adverse environmental and social impacts in the aid programme through the application of mandatory safeguard policies…” (Commonwealth of Australia, 2014). In 2015, 14.7% of its bilateral allocable aid focused on the environment, compared with the DAC country average of 33.2%. In 2015, 13% of Australian bilateral allocable aid (USD 334.7 million) focused particularly on climate change, compared with the DAC country average of 26.2%.
Note to reader: Annex B provides “Methodological notes on the profiles of Development Assistance Committee members”.
Reference
Commonwealth of Australia (2014), Australian Aid: Promoting Prosperity, Reducing Poverty, Enhancing Stability, Department of Foreign Affairs and Trade, Canberra, www.dfat.gov.au/about-us/publications/Documents/australian-aid-development-policy.pdf.