2. Building an inclusive social protection system
South Africa has an incomplete social protection system without a mandatory pension savings scheme. Designing a universal insurance pension system would allow to reduce the important government funded pension grant system and ensure that the old-age population has decent income. Only 40% of employees are contributing to a form of saving-retirement scheme, with often a low pension. Moreover, South Africa has a dual, public and private, health care system. Half of the country’s health-care spending goes to the private sector, which covers only 16% of the population. Moreover, the health care system fails to deliver affordable quality services. The COVID-19 pandemic has highlighted the unequal distribution of health care services between public and private health providers. Around 70% of critical care beds available were in the private health care sector. Finally, the sizeable unconditional cash transfer system though reaching a large share of the population fail to lift many children in the poorest families above the poverty line.
South Africa has made important progress in broadening social assistance since 1994. The social grants programmes are reaching over 17 million beneficiaries and around half of all South African households. Social grants are the main government instrument to reduce poverty, and inequality and remedy the long-lasting effects of the apartheid era. However, South Africa still lacks a comprehensive social protection system. There are various inadequacies between the provisions of the current system and the situation and risks faced by different population groups. Social assistance targets a mix of age-related needs (child and old age grants) and disease-related needs (disability and care dependency). However, there are important gaps in the coverage and provision of social protection (Box 2.1).
Firstly, there is no mandatory pension coverage (Table 2.1). The absence of mandatory pension coverage has led to the development of many private and occupational pension schemes that are only partially fulfilling the need for longevity risk coverage. Secondly, unemployed adults aged 18–59 are not covered by the social assistance or insurance schemes. Moreover, the duration of the unemployment benefits is short and unemployed individuals financial position deteriorates quickly thereafter, when they are not covered anymore. Thirdly, health care access is almost universal and provided by the government but due to poor delivery, many people revert to private health insurance and facilities leading to significant inequalities in health care access and outcomes.
Fragmentation of the management of the social protection system between different government departments and of the delivery between different agencies and bodies is undermining efficient delivery. At least seven government departments are involved in the policy development of social protection and different agencies are responsible for the delivery of the different grants and funds.
The main challenge of the social protection system has been the growing number of beneficiaries and the incapacity of the system to lift them all above the poverty line. Priority has been given to raise the number of beneficiaries of the different grants, in particular of the old age grant.
The current financing of the overall social protection systems also presents some gaps and may pose sustainability risks in the future. The government funds social grants and public health care entirely through tax revenue. Combined, they represent around 24% of government spending. The prospects of further expansion of social assistance coverage and spending are limited though in the current fiscal juncture and any improvement in life expectancy will push up social assistance spending.
According to official projections, future social and health spending does not threaten the sustainability of public finances (Department of Social Development, 2016b). However, in a tight fiscal situation due to low growth, it crowds out other spending, such as on education and infrastructure, which would undermine growth prospects further. It is thus necessary to rethink the financing of social protection, in particular, with respect to the agenda of introducing mandatory pension schemes and national health insurance.
In the following sections, the four main components of social protection are reviewed: social assistance, pension insurance, health care and unemployment benefits. Health care, longevity and unemployment are the main financial risks workers and individuals face. However, these risks are not well covered in the South African social protection system. Moreover, low coverage pushes up spending on social assistance (old age grant) and on private insurance (private health schemes and private provident pension funds). Against this background, the government has published a discussion paper to reform social protection (Box 2.1).
Comprehensive social security in South Africa (released in November 2016)
Background
There is no mandatory pension. About 2.7 million formal sector workers – primarily low-income earners – are excluded from occupational pension schemes.
Members of private retirement funds rarely receive a sufficient income in retirement, in part because they do not preserve their savings throughout their career and in part, because their savings are eroded by high administrative costs.
Social assistance does not reach all target groups and its cash payment system is expensive.
There is insufficient policy coordination between social insurance funds such as the Unemployment Insurance Fund, workers’ Compensation Fund and the Road Accident Fund. The funds also have separate systems and administration, resulting in high costs and increasing the scope for fraudulent claims.
Main proposals
Establishment of a social security fund: introduce a public fund to provide pensions, death and disability benefits and unemployment benefits.
Extending social assistance: a universal child, disabled and old age grant is proposed, replacing tax rebates for high-income families.
Enhancing social insurance funds: institutional consolidation is proposed by merging the departments or entities managing social assistance and social security programmes in the different ministries.
Regulatory reforms of the pensions and life insurance industry are also proposed (prudential, governance, fiduciary responsibility, transparency and control of costs).
Better policy co-ordination between the proposed department of social security and the department of labour including sharing facilities at the territorial level.
Alignment of social security with National Health Insurance (NHI) issues include:
The role of earnings-related contributions as a financing mechanism;
The tax treatment of medical expenses and associated risk-pooling arrangements;
The alignment of medical benefits provided by compensation funds and the RAF with the NHI system.
Source: Comprehensive social security in South Africa, released in November 2016, South Africa Government. https://www.gov.za/sites/default/files/gcis_document/201611/comprehensivesocialsecurityinsouthafricaa.pdf
Develop active labour market policies to complete the unemployment insurance scheme
The public Unemployment Insurance Fund (UIF) is the largest of the three social insurance programmes (Compensation Fund and Road Accident Fund). It provides short-term benefits to workers when they become unemployed or are unable to work due to illness, maternity leave or adoption leave. It also provides a death benefit to the dependents of a deceased contributor. The UIF is funded entirely through contributions from employers and employees and the returns generated on investments. The contribution rate is 2% of wages equally paid by the employee and the employer. Contributions to the UIF are subject to a maximum earnings ceiling (SARS, 2017). The UIF has accumulated a substantial surplus, which is managed by the Public Investment Corporation (National Treasury, 2019a).
The total number of claims has been increasing since 2015/16, driven by rising unemployment (Figure 2.1). In 2018/19, around 770 000 claims were received (Department of Labour and UIF, 2019). The UIF is effective in terms of service delivery and has improved the processing times for claims (Department of Labour and UIF, 2018), but many of the unemployed do not receive unemployment benefits.
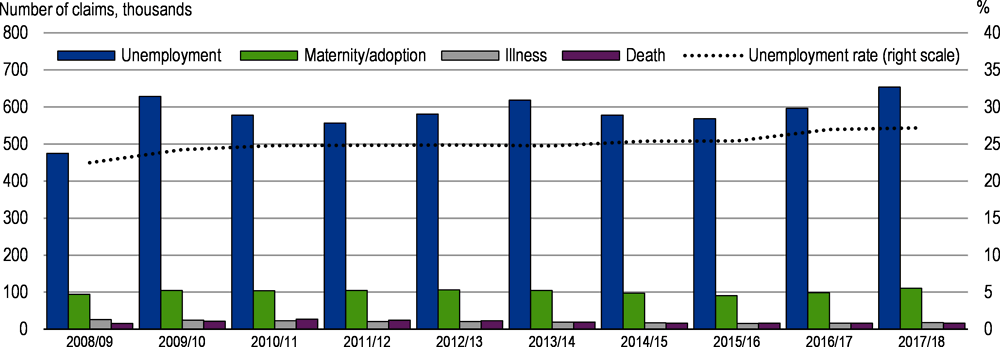
Note: Claims data taken from the Unemployment Insurance Fund Annual Report 2018. Official unemployment rate is an average over four quarters corresponding to the reporting periods of the UIF.
Source: (Department of Labour and UIF, 2018; Statistics South Africa, 2018c).
The Unemployment Insurance Amendment Act of 2016, which came into effect in 2019, expanded the level and reach of benefits. In particular, after becoming unemployed, workers have one year instead of currently 6 months to claim their benefits. The benefit duration is increased from eight months to a year. Civil servants and students completing apprenticeships or vocational education and training programmes are covered. Finally a better coverage of maternity leave is provided (66% replacement rate up to a maximum benefit of ZAR 17 712 per month). Income from contributions and investments should be sufficient to cover the expanded benefit pay-outs.
In response to the global financial crisis, the Labour Activation Programmes (LAP) Unit was established within the UIF. This unit provides training and reskilling opportunities for unemployed UIF beneficiaries to enable them to either start their own business or re-enter the labour market. In 2017, 11 744 unemployed UIF beneficiaries participated in various skill training programmes conducted in partnership with TVET colleges and Sector Education and Training Authorities (SETAs) (Department of Labour and UIF, 2018). The Labour Activation Programmes should be scaled up by considerably increasing the number of individuals participating in skills development and training programmes. There is a need to develop specific training and employment programmes such as the public employment programme for long-term unemployed.
To respond to the impacts of the COVID-19 pandemics and the ensuing lockdown, the government established a Temporary Employee/Employer Relief Scheme (TEERS) within the UIF. It covers people who test positive for COVID-19 or need to be quarantined as a result of exposure, reduced work time and unemployment benefits. This benefit is applicable to contributing employers to the UIF. The minimum benefit payable is equal to the national minimum wage of ZAR 3 500 per employee, or the sectoral minimum wage and a maximum benefit of ZAR 6 370. It was payable for the duration of the national lockdown or up to three months, whichever period is the shortest. As of end June 2020, the UIF had paid a total of ZAR 28 billion to over 4 million employees under this benefit.
Overview of cash transfers
South Africa has an extensive and well-functioning means-tested cash-transfer system, which the government has progressively scaled up since the end of Apartheid. Cash transfers form the backbone of South Africa’s overall social protection system. The social assistance programme (i.e. social grants) provides income support for the elderly, children, people with disabilities and social relief for individuals and households that experience sudden income distress (Table 2.2). Around 17.5 million out of 57 million South Africans now receive social grants – the majority of which are children and the elderly, with little support for the unemployed. Social assistance plays a critical role in reducing poverty, inequality and protecting vulnerable households from economic shocks. Social grants are funded from tax revenues, are non-contributory and unconditional. They comprise the largest segment of social protection expenditure at around 84%. However, poverty incidence remains relatively high at 26% for the entire population (measured as revenue below 50% of the median income).
The South African Social Security Agency (SASSA) was established in 2006 to administer and pay social grants on behalf of the Department of Social Development, which is responsible for policy and legislation. There have been significant improvements in SASSA’s administration of grants, which now works with the South African Post Office (SAPO) and commercial banks to provide social grant payments using biometric data. However, many remote areas lack adequate infrastructure so that cash payments lead to higher operating costs (Department of Social Development, 2016c). Leveraging the extensive infrastructure coverage of the postal service can improve the reach of the rural poor, who are often excluded from grants because of geographical barriers.
The economic restrictions due to the COVID-19 pandemic have led to severe distress for households that lack income and savings. Between three and five million informal-sector workers and their families are particularly vulnerable. As many of these workers live with grant recipients, government has used the existing grant system to support those most vulnerable. The government has augmented the social grants budgets by ZAR 25 billion to assist vulnerable groups (National treasury, 2020). Existing social grants are temporarily increased and a new social relief of distress grant for unemployed adults is being introduced (Table 2.2). Lengthy administrative procedures, such as registering new beneficiaries and checking their incomes, are required before the new grant can be paid.
Steady increase in the number of grant beneficiaries
The number of beneficiaries has steadily increased from around 2.5 million people in 1998 to approximately 11 million in 2006 and reached 17.5 million in 2017/18 (SASSA, 2018). The increase in beneficiaries has mainly been driven by the expansion of the child support grant, reaching almost 12.3 million children in 2017/18 (Figure 1.2). The number of children receiving the child grant increased rapidly during the 2000s due to increased take- up and an increase in the upper age limit from 7 to 14 years (Samson et al., 2008). The age limit was further raised to include all children under 18 years in later years.
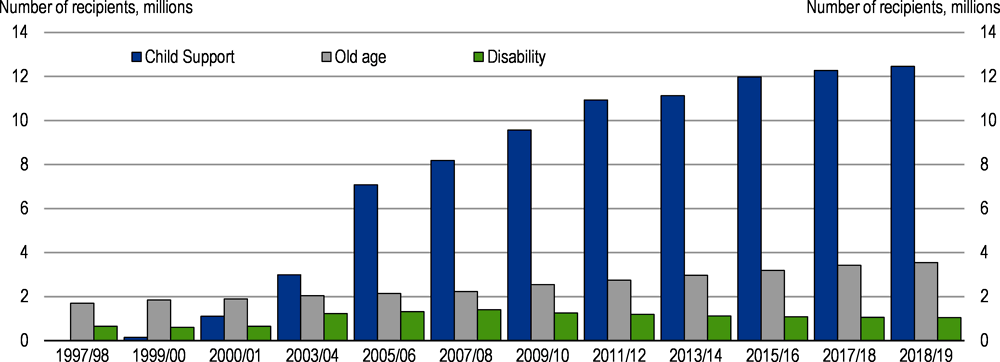
Note: Recipients are only able to claim for one grant at any given time.
Source: South African Social Security Agency: Annual Report 2008/09; South African Social Security Agency: Annual Report 2018/19.
Coverage rates have improved
The coverage of social grants has improved thanks to a combination of policy changes, outreach campaigns to raise awareness and service delivery improvements. Coverage rates across the poorest 60% of the population is far above average coverage rates of other upper-middle income countries (World Bank, 2018a). According to the General Household Survey 2017, the percentage of individuals in the population that benefited from social grants increased from 12.8% in 2003 to 30.8% in 2017 (Statistics South Africa, 2018a). At the same time, the percentage of households that received at least one social grant increased from 30.8% in 2003 to 43.8% in 2017.
The composition of social assistance has shifted
Public expenditure on social assistance programmes is relatively high in South Africa compared with other low to upper-middle-income countries (Figure 2.3). In 2015, government expenditure on social assistance programmes amounted to 3.3% of GDP. This compares with 1.4% in Brazil, 1.5% in India, 1.9% in Russia and 2.7% in the OECD (World Bank, 2018b). The composition of social assistance spending has shifted towards old age and child support grants (Figure 2.4). In 2019/20, the value of the child support grant will increase by 4.9% to ZAR 425 per month, from ZAR405 per month in 2018/19. The old age grant will increase by 5% from ZAR 1 695 per month to ZAR 1 780 per month for beneficiaries up to 75 years. Annual adjustments to the value of social grants are made to compensate for projected inflation.
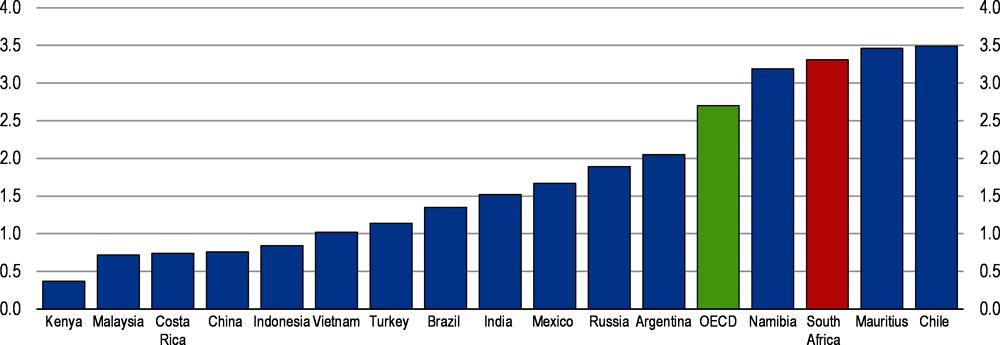
Note: Malaysia, Costa Rica, Turkey refer to 2013; China and Namibia refer to 2014; Kenya and India refer to 2016. Social assistance programmes are defined as non-contributory interventions designed to help individuals and households cope with chronic poverty, destitution, and vulnerability. Examples include unconditional and conditional cash transfers, non-contributory social pensions, food and in-kind transfers, school feeding programmes and public works (World Bank, 2018b).
Source: World Bank ASPIRE database, 2018.
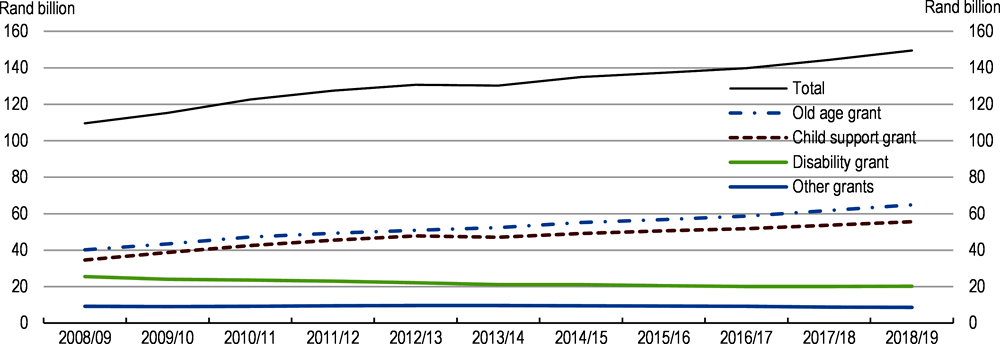
Note: Figures are expressed in 2016 prices (CPI December 2016=100).
Source: Author’s calculations, South African Social Security Agency: Annual Report 2018/19, Statistics South Africa.
The impact of social grants on the poor
Effective at reducing poverty and inequality
There is extensive evidence showing that social grants have been successful in reducing extreme poverty and improving health and education outcomes (Figure 2.5). Social grants dominate the income profile of many poor households, accounting for as much as 71% of total household income for the poorest 20% of the population and is particularly successful in reaching the poorest households (World Bank, 2018a; Woolard and Leibbrandt, 2010). The World Bank estimates that grants and old-age pensions contributed 24% to poverty reduction and 44% to narrowing the poverty gap (distance to poverty line) between 2006 and 2015 (World Bank, 2018a). Social grants are therefore a crucial source of income for poor families and provide a financial lifeline amid high levels of unemployment. However, 21% of people aged 60 and above remain poor.
Cash transfers, particularly the child support grant, are the most progressive of all spending programmes as the poorest 40% of individuals receive 69% of all transfers (Woolard et al., 2015; Inchauste et al., 2014). Furthermore, they augment the incomes of the poorest decile by more than tenfold, far larger than in other middle-income countries such as Argentina, Brazil and Mexico. The Gini coefficient, a measure of income inequality, is reduced from 0.715 for household market income to 0.623 after taxes and transfers (OECD Income Distribution and Poverty Dataset).
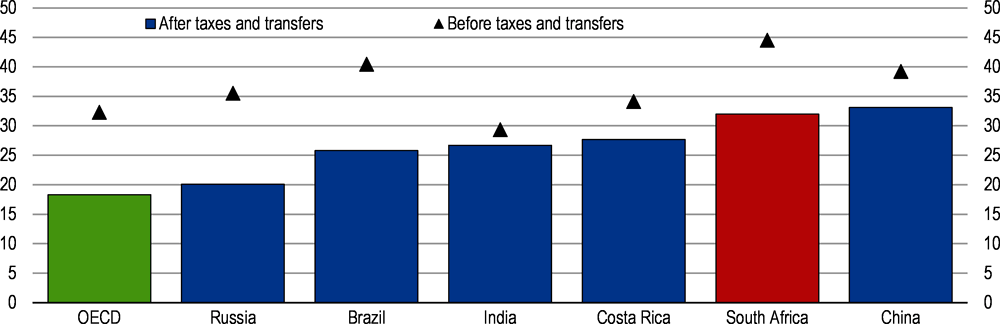
Note: Data for South Africa are for 2015 and provisional, Costa Rica for 2018, Brazil for 2013 and China and India are for 2011.
Source: OECD Income Distribution Database.
Child support grants improve child well-being and support human capital development
South Africa’s child support grant is one of the largest unconditional cash transfer programmes for children in the world. It is widely regarded as one of the government’s most successful interventions, particularly due to its high take-up and extensive coverage (Samson et al., 2008). Between 70 and 80% of children in the bottom six income deciles benefit from the grant (Grinspun, 2016). For poor families, the child grant is an important source of financial support, providing basic needs such as food, schooling and health care (Zembe-Mkabile et al., 2015).
The grant increases the nutritional well-being of recipient children as indicated by improved height-for-age scores (Coetzee, 2013). It reduces child hunger and the likelihood of illness and improves school attendance for pre-school, early grades and adolescents (Samson et al., 2008; DSD, SASSA and UNICEF, 2012). Children that receive the grant are also found to progress through the schooling system faster, with studies showing a lower likelihood of repetition and improved maths and reading scores (Coetzee, 2013; DSD, SASSA and UNICEF, 2012). Receipt of the grant has been shown to increase labour-seeking behaviour in recipient households, and generate a range of positive impacts for adolescents. Eyal and Woolard (2011) find that mothers who receive the child support grant in their 20s have significantly higher labour force participation and employment probabilities.
The old age pension grant affects labour force participation among adults and child outcomes positively
For nearly 75% of South Africans over the age of 60, the old age grant is the main source of income. While technically a cash transfer for older persons, extensive evidence points to the majority of recipients, especially women, sharing the pension within households (Ralston et al., 2015; Strijdom, Diop and Westphal, 2016). This is because household structures are often multigenerational, largely due to segregation policies of the apartheid era (lack of enough housing) and the high HIV/AIDS prevalence. Estimates indicate that one grant reaches up to six persons in a recipient’s household (Strijdom, Diop and Westphal, 2016). The grant can have a positive impact on the well-being of children through higher school attainment and primary school completion rates, decline in hours worked by children and improved health indicators (Budlender and Woolard, 2006; Van Biljon, 2017). Research has also shown that there is a positive correlation between households with an old age grant recipient and women living in that household participating in the labour force.
Issues of concern and proposals for broadening the social protection
Universalising the child support and old age grants
Many eligible children are excluded from receiving the child support grant. The two most common reasons given by caregivers for not applying for the grant were that they believed their income was too high and that they did not have the correct documentation. Problems around infrastructure, understaffed offices, complicated and lengthy application processes and a lack of awareness about eligibility impeded the rollout of the grant during the initial years (Eyal and Woolard, 2011). A recent study estimates that almost 18% of eligible children are not receiving the child grant (DSD, SASSA and UNICEF, 2016).
Universal or near-universal provision of child and family benefits is a reality in many high-income OECD countries, while in other parts of the world coverage tends to be targeted, usually towards poor families (International Labour Office: Social Protection Department, 2015). Some middle-income countries have made great progress towards achieving universal coverage, for instance Argentina in 2009 with Asignación universal por hijo. In South Africa, an upward adjustment in the means-test threshold at regular intervals since 2008 has opened up access to more poor households (Grinspun, 2016).
Universalising the child support grant would reduce the administrative burden and cost of means testing for both the state and caregivers and enable all children to access the benefit regardless of the caregivers’ income (Delany, Proudlock and Lake, 2016). The Inter-department Task Team on Social Security and Retirement Reform (IDTT) proposed that social grants be aligned with the personal income tax rebate structure to allow the means tests to be phased out and reach universal coverage (Department of Social Development, 2016c).
In general, universal pensions provide flat-rate benefits for all elderly people, while means-tested pension systems provide benefits to the poor who are usually not covered by other contributory elements of the pension system (World Bank, 2018b). Means-tested pensions are the most common in most regions (Pension Watch, 2019).
Universal and means tested old age pensions have clear trade-offs in terms of efficiency, cost, and effectiveness of implementation (World Bank, 2018b). Fiscal costs, sustainability and duplication of benefits present major challenges to the roll-out of a universal social pension (Guven and Leite, 2016). Universal social pensions are also argued to be less cost-effective at fighting poverty compared to poverty-targeted cash transfer programmes. Dorfman (2015) shows that social pension systems targeted at the elderly poor have been found to reduce national poverty at almost twice the rate of a universal approach.
Social pensions certainly have a role to play in closing the old-age security gap for those not covered by contributory schemes. Changes in the old-age grant should be linked to the planned introduction of a mandatory contributory pension scheme, depending on the complementary role it may play for individuals to reach the targeted income replacement rate (see Section 3).
The value of the child support grant is argued to be too low
There are concerns that the child support grant is too low. Evidence shows that the grant is not adequate on its own to meet even the most basic needs of its beneficiaries (i.e. food costs) and is insufficient for providing greater dietary diversity (Zembe-Mkabile et al., 2015). Food insecurity, stunting and child malnutrition remain significant challenges, and have deteriorated since 2012 despite more than 12 million children receiving the grant (World Bank, 2018a).
In 2018, the national food poverty line was ZAR 547 per person per month. People living below this line are considered to live in extreme poverty. The child grant (ZAR 445 per month in 2020/21) lies well below the food poverty line (for adults).
Proponents for increasing the child grant argue that a larger impact can be realised if the amount is increased. Budlender (2016) proposes that the grant should as a first step be set at the official food poverty line, which would not require any changes to the current administration of the grant. The government allocated ZAR 65 billion for the child support grant in 2019/20. If the grant were increased from ZAR 425 to ZAR 547, it would require an additional allocation of approximately ZAR 20 billion per year, which is hardly possible in the current budgetary situation.
However, instead of increasing the child support grant to the food poverty line, particularly in the case that it is universalised, the government could consider an additional means test for extremely poor households. For example, only households with a revenue such that the whole family lies below the food poverty line would receive extra-support. The value of such an extra-amount should be decided taking into account budget constraints.
Extending the cut-off age for the child support grant to 21 years
A criticism of South Africa’s social assistance programme is that it does not address poverty and unemployment among adults, particularly the vulnerable youth. Unemployment amongst the youth (15–24 years) was at 52.8% in 2018, compared to 27.5% for the full working age population (15–64 years) (Statistics South Africa, 2018c). Arguments to increase the cut-off age of the child grant are based on the lack of adequate social security coverage for young people who are either still completing secondary education, or are unable to find work or do not have the financial means to study further.
The child support grant terminates in the month that the child turns 18, with no consideration of the child’s education status. This often disrupts the financial stability of households, particularly where there are children who do not pass secondary education by the time they turn 18. In 2018, only 48.1% of students that were enrolled for Grade 10 in 2016 wrote the final secondary examination in 2018 (i.e. 512 735 of 1 067 075 students). Of this group, 78.2% passed. This means that from the Grade 10 class of 2016, around 660 000 children either dropped out of the system without finishing secondary education or are repeating certain years after they have turned 18, when they are no longer eligible to receive the child grant. Raising the age of the child grant does not address the underlying structural failures in the secondary education system. It may also create perverse incentives for beneficiaries to not complete secondary education by the age of 18 in order to continue receiving the grant up to the higher cut off age limit.
The government is gradually rolling out a fully subsidised fee-free higher education and training to all current and future undergraduate university and Technical and Vocational Education and Training (TVET) college students from poor and working-class families (National Treasury, 2018). The employment tax incentive aimed at addressing unemployment and the lack of skills amongst the youth, has been extended. Raising the age of the child grant may render these measures redundant, and limit the ability to serve other priorities.
Broadening coverage of informal workers
At 32%, the informality rate in South Africa is considerably lower than the Latin American and Caribbean average (51%). Registration of firms is high in South Africa, almost 91% according to the World Bank. Employment status is less compliant, leaving space for informal employment. Informal employment represents a third of employment in South Africa (Figure 2.6). Informal employment recovers different types of situation including subsistence informality, voluntary informality and informality induced by regulations. The most prevalent type of informality in South Africa is subsistence informality mainly amongst those with low levels of education and those living in non-urban areas (Fernandez et al. 2017).
According to the National Statistics’ classification, about 74% of workers were working in the formal sector. Almost one million South African working in registered firms are informally employed, representing one fifth of the total informal workers. As a consequence, these workers are mostly not covered by pension provisions and unemployment benefits. As shown in Figure 2.6, medical coverage and pension coverage provided through employment packages are very low for informal workers. This is the case partly because pension insurance is not mandatory and provision of private health insurance by employers is not available in all firms, in particular in small size enterprises.
Therefore, working age informal workers do not directly benefit from social transfers (old-age and child grants, with exception of the disability grant) and are poorly covered for retirement income. However, they have access to health care provided by public health care service. In fact, as social protection benefits (health and pensions) are not systematically linked to employment it limits the incentives for the informally employed in registered firms to stand for their formalisation as they benefit from escaping income tax. The proposed reforms of introducing mandatory pension schemes and new health care system provides an opportunity to reduce informal employment. The financing and the conditions to be enrolled in these new schemes should include incentive mechanisms as subsidies and linking benefits to registration that reduce informal employment.
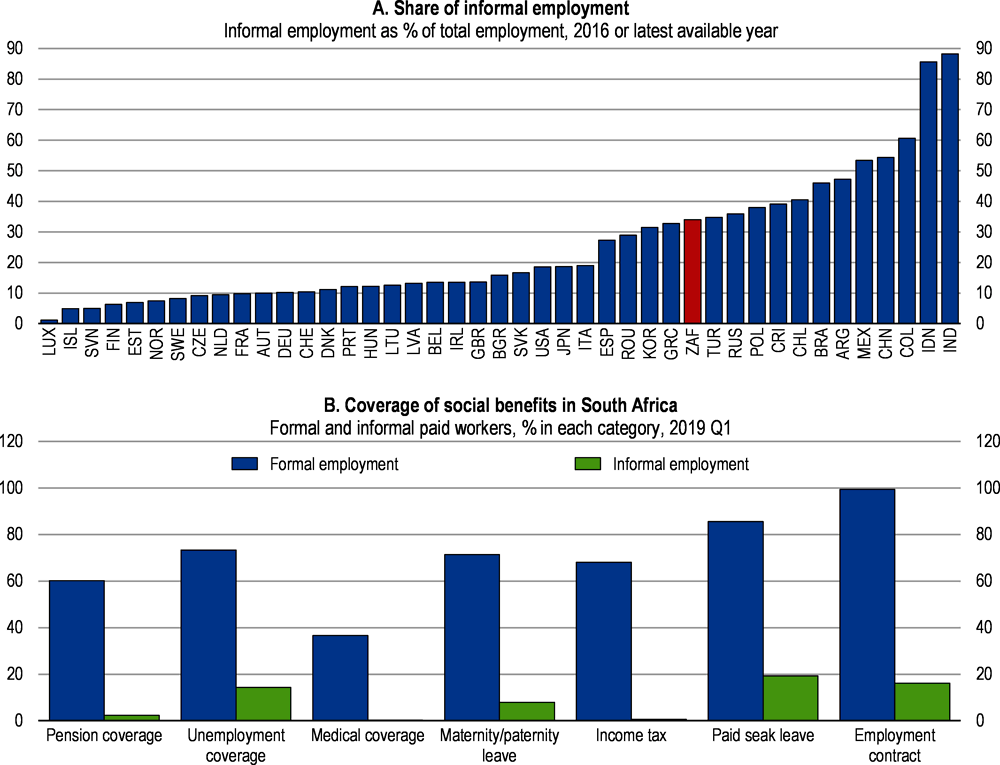
Source: ILO (2018), Women and men in the informal economy: a statistical picture (third edition); Statistics South Africa, Quarterly Labour Force Survey, Quarter 1: 2019.
South Africa is lacking a mandatory pension insurance. Rather than benefitting from potential savings during working life, retirees often fall back into the old-age grant system. Therefore, the social protection system, based only on old-age grant, does not protect financial risk associated with longevity and old-age revenue losses. This has led to an extensive old-age grant system and disincentives for long run savings, in particular for lower to middle-income people. Indeed, in many segments of the population, individuals are under-saving or dis-saving before retirement or using their savings in a sub-optimal way to access the old-age grant. South Africa is with New Zealand and Ireland among the few countries that do not have a mandatory pension insurance neither public nor private.
The current pension system is not adequate in reducing the risk of old-age poverty
Coverage is modest
Pension coverage is not satisfactory. It is difficult to gauge exactly the number of formal workers covered by any form of retirement saving provisions. Indeed, in the absence of mandatory pension insurance, businesses and trade unions have established retirement savings and insurance arrangements for their employees and members. According to the Quarterly Labour Force Survey (QLFS) about 6.5 million workers representing 40% of employees were contributing to a pension scheme in December 2018 (Statistics South Africa, 2018d).
The Government Employees Pension Fund (GEPF) is the largest occupational pension fund. It covers retirement, death and disability benefits of government employees. In 2018, the GEPF received contributions from 1.2 million active members and provided benefits to 450 322 pensioners or beneficiaries. Members with less than 10 years of contributions receive a lump sum at retirement while those with more than 10 years of contributions and above retirement age receive a lump sum and a monthly pension (annuity) (GEPF, 2018). In addition, workers resigning or leaving the public service can withdraw their accumulated contributions without any obligation to transfer it to another pension fund.
Private sector workers are covered by occupational pension plans. Coverage varies according to a worker’s income, the sector of employment and the degree of unionisation in that sector. Low-income workers are mostly not covered (Department of Social Development, 2016a). Self-employed and informal workers can contribute to private pension funds but coverage is low. Among the 40 private sector bargaining councils, 29 offer a savings and insurance arrangement covering around 2.5 million workers. Unions govern many savings-retirement funds, often called provident funds.
In 2018, there were 5 118 registered retirement funds of which 1 647 funds are active (a fund with members for whom it receives contributions and/or pays benefits). They cover around 11 million active contributors and 5.5 million pensioners, dependants and unclaimed benefit members. However, there is some double counting, as some individuals are members of more than one fund (FSCA, 2018).
Pension revenues are low, increasing the risk of old age poverty
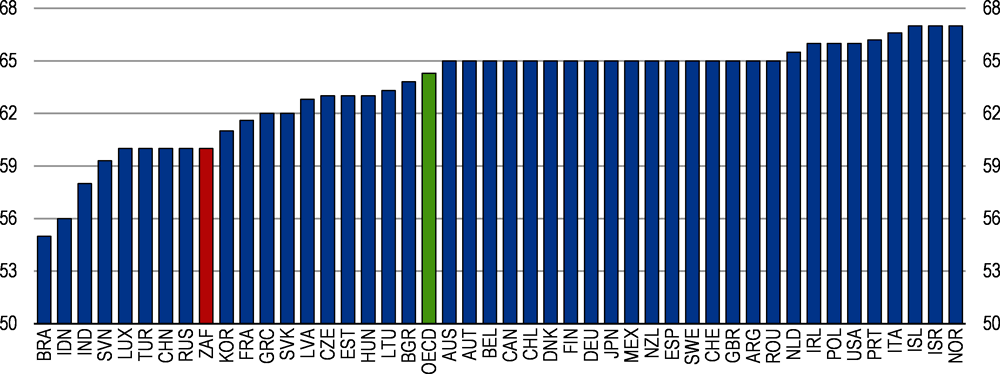
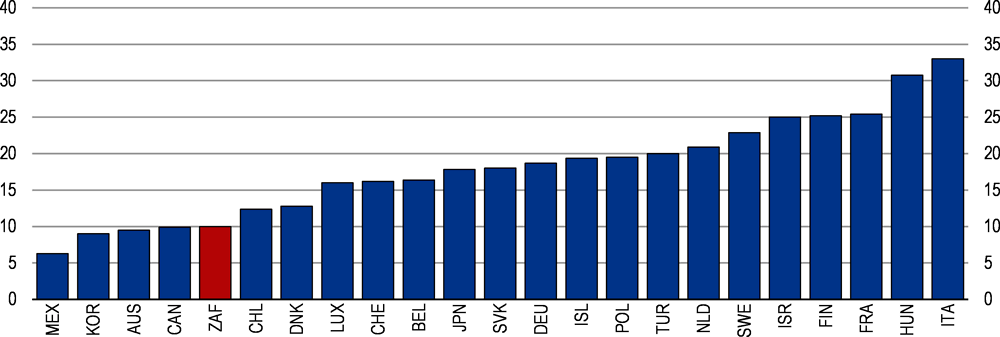
Pension revenues are not adequate, contributing to old-age poverty. South Africa’s poverty rate is relatively high when compared with OECD and emerging countries (Balestra et al., 2018). The old-age poverty rate is 21% compared with 26% for the entire population (measured as revenue below 50% of the median income) (OECD, Income distribution database, 2018). South Africa has the lowest gross replacement rate across OECD and partner countries based on mandatory schemes (Figure 2.7). The gross replacement rate is defined as future gross pension entitlement divided by gross pre-retirement earnings for someone currently entering the labour market at age 20. The gross replacement rate appears low because in the GEPF, as well as in most of the occupational and savings-retirement funds, workers can partially withdraw their funds at retirement in a one-off payment. The absence of medium-term saving vehicle explains partly these withdrawals on retirement funds. For example, civil servants affiliated with the GEPF have a theoretical 50% replacement rate, but due to the option of opting out and receiving a lump-sum payment, the effective replacement rate can differ substantially.
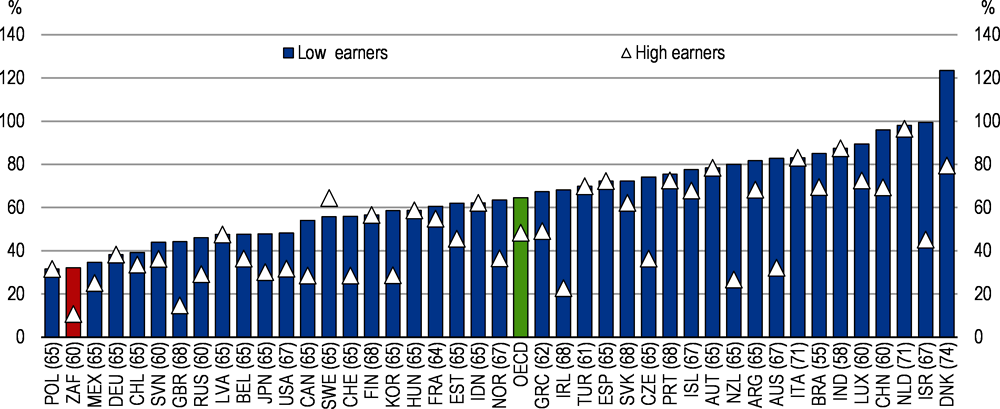
Note: Expected retirement age in year 2070 reported in parenthesis.
Source: OECD (2017), OECD Pensions at a Glance 2017.
Issues with the current retirement fund industry
There are some issues with the current retirement fund industry, which contribute to the low adequacy of the pension system. The large number of pensions and savings-retirement funds, more than 5 000, is not efficient. Around a third of the funds are dormant and not receiving pension contributions anymore (FSCA, 2018). The Financial Sector Conduct Authority (FSCA) is in charge of licencing, supervising and verifying that retirement funds fulfil their promises and preserve individual financial interests.
The government has already introduced measures to reform South Africa’s retirement industry and improve coverage. Substantial changes to the regulation of the financial sector were introduced recently to address some of the shortcomings of the retirement industry (see Box 2.2). However, there is room to improve the effectiveness of the pension industry further. For instance, retirement funds not receiving a contribution for three years in a row should see their portfolio transferred to another retirement fund. In addition, retirement funds not reaching a minimum size should be closed or required to merge with other existing funds.
Many savings-retirement beneficiaries do not claim their benefits partly due to financial illiteracy and lack of knowledge of their rights. In 2018, 3.6 million pension accounts were not claimed, representing around ZAR 34 billion. An individual may have many pension accounts, for instance, in the case they often switched their employer. The FSCA has initiated a campaign to inform people and has put in place a register where people can verify whether they have a pension account. Retirement funds should be required to do more to track their beneficiaries and to inform them about their entitlements when they are close to retirement age.
Many retirement funds charge high administration and asset management costs that erode the value of workers’ accumulations. Some also deliver a poor investment return. The FSCA has identified numerous supervisory issues related to boards’ roles and costs, high remuneration, failure to submit annual financial statements and valuation reports in some retirement funds. These observations call for giving more power to the FSCA to sanction or impose measures to address these issues.
In 2013 and 2015, the government introduced several reforms to the retirement fund industry to strengthen its governance, to harmonise tax deductions across retirement schemes, guarantee the preservation of retirement benefits and incentivise the annuitisation of pensions.
2013: Governance of retirement funds and taxation of pension contributions
The FSCA is given responsibility to monitor trustees’ appointments and ensure that boards and trustees meet and fit proper requirements; and to supervise that they are independent and free of conflicts of interest.
Whistle-blowing protection for Board members, valuators, principal/deputy officers, and employees who disclose material information to the Registrar (FSCA).
Fund board members/trustees to attain skills and training as prescribed by the Registrar, within 6 months.
Criminalisation and extending personal liability to employers in respect of non-payment of pension contributions to a pension fund.
Protection for board members/trustees from joint and several liability, if they act independently, honestly and exercise their fiduciary obligations.
Require pension funds to notify the Registrar of their intention to submit an application to register prior to commencing the business of a pension fund.
Same tax deductions for all contributions into retirement funds (retirement annuities, pension funds and provident funds).
Introduced partial annuitisation of benefits from provident funds, finally delayed to 2021.
Threshold to purchase an annuity increased from ZAR 75 000 to ZAR 150 000.
Tax-free lump sum at retirement increased from ZAR 315 000 to ZAR 500 000 in 2014.
Taking effect from March 2016, tax deduction on employer and employee contributions to a pension fund, provident fund or retirement annuity fund up to 27.5% of the higher between remuneration and taxable income. A ceiling of ZAR 350 000 per annum applies.
2017 Regulation of pension funds
A default in-fund preservation arrangement (conservation of savings until retirement) to members who leave the services of the participating employer before retirement.
A default investment portfolio to contributing members who do not exercise any choice regarding how their savings should be invested.
Incentivising for annuity payment within retirement funds.
However, the most important issue with private retirement funds is the early withdrawals from retirement funds during a worker’s career, which is the primary cause for low replacement rates. Many workers liquidate their funds each time they change their job. The government has already introduced different provisions to limit withdrawals of workers’ accumulated contributions and to incentivise workers to receive their pension in an annuity instead of a lump sum (see National Treasury 2017 and 2018b). For instance, if more than one third of the accumulated fund is withdrawn, tax applies, incentivising to transfer retirement savings to another retirement fund. Indeed, when workers transition to a new employer with a different retirement fund, contributions are often withdrawn. This is particularly true for provident funds. To transform these savings-retirement funds into a real retirement income, preservation of funds until retirement age and at least partial annuitisation should be mandatory as a counterpart to the tax deduction on contributions.
Reforming the pension system
Rationales for setting up a mandatory pension insurance scheme
The low level of retirement income and coverage call for reforming the pension system. The fragmentation of the pension system with important variations in pension coverage provisions across sectors argue for a consolidation of pension provision rules. The arguments for a mandatory pension scheme include protection against old age income poverty risk, better risk pooling and higher economic efficiency (Barr, 2012). The Taylor committee report has already recommended the establishment of a comprehensive pension system (Taylor Vivienne, 2002). Based on the interdepartmental task team report on social security, the government published in November 2016 a discussion paper recommending the establishment of a mandatory pension scheme. The aim is to establish a comprehensive social security system which comprises a three-tier system: universal old age grant, a mandatory pension scheme and voluntary pension funds.
Moreover, the timing for introducing a mandatory pension scheme is favourable given the current demography. The current retirement age at 60 years in many pension schemes and 65 years for civil servants is adequate when compared to emerging and OECD countries (Figure 2.8). The current retirement age may seem high because of the low survival probability during old age (Figure 2.9) (Balestra et al., 2018). However, the survival rate will pick up progressively as cohorts highly affected by the HIV/AIDS disease fade out. Moreover, the average survival rate masks important dispersion in life expectancy linked to race, education and employment status. Therefore, in designing the mandatory pension scheme, the needs of low-income workers who tend to have a lower life expectancy should be taken into account through death/survivor benefit provisions.
Note: The current retirement age is calculated assuming labour market entry at age 20.
Source: OECD (2017), OECD Pensions at a Glance 2017.
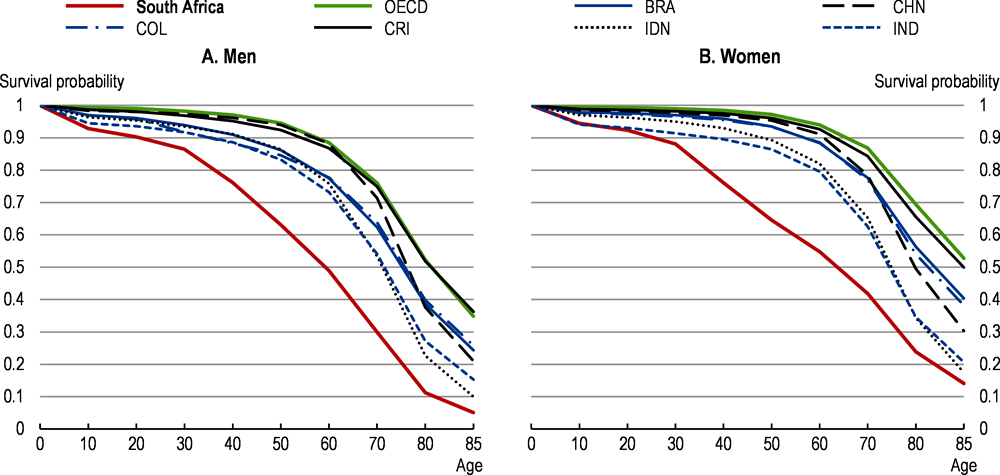
Source: Balestra et al. (2018), “Inequalities in emerging economies: Informing the policy dialogue on inclusive growth”, OECD Statistics Working Papers, 2018/13.
The evolution of the dependency ratio is favourable for setting up a mandatory pension scheme now as it will mature before the arrival of large cohorts in retirement age. As seen in Figure 2.10, South Africa has the lowest dependency ratio (percentage of individuals above retirement age per working age population) among OECD and emerging economies. In 2050, the dependency ratio will remain favourable while by 2075, the dependency ratio will have caught up with the 2015 OECD average. It takes 35–40 years for a pension scheme to mature as the first cohort of workers with full contribution duration reaches retirement age.
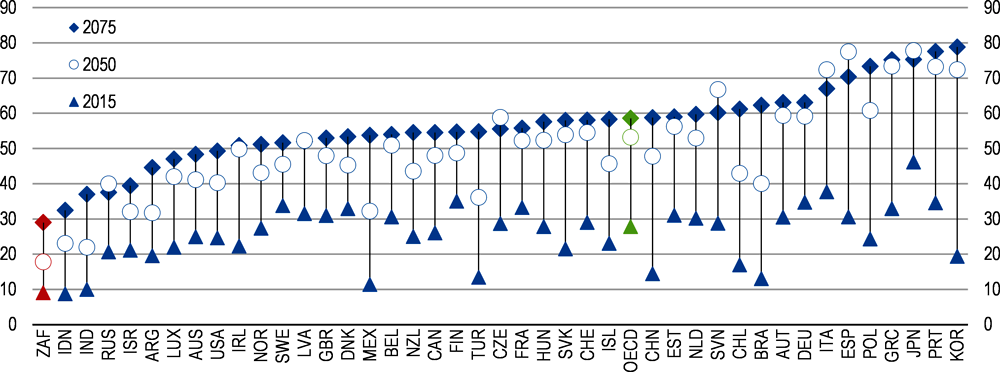
Note: The demographic old-age dependency ratio is defined as the number of individuals aged 65 and over per 100 people of working age defined as those aged between 20 and 64.
Source: OECD (2017), Pensions at a Glance 2017.
Policies to safeguard and build robust pension schemes
Automatic adjustment mechanisms
Automatic adjustment of pension system parameters allows pension financing to be closely aligned with demographic and economic trends. Like other pre-commitment mechanisms in economic policymaking – in monetary and fiscal policy, for example – it is designed to enhance credibility and provide assurance that public pension schemes will not place an unexpected burden on public finances in the future. Given the difficult process of pension reform, many countries have introduced automatic adjustment mechanisms to cope with trend changes or shocks that threaten the actuarial equilibrium (Fall and Bloch, 2014). For instance, pension benefits can be reduced through automatic sustainability factor, which take into account financial imbalances (Canada, Germany, Japan, and Sweden). Many countries have introduced adjustment mechanisms to take into account changes in life expectancy. The adjustment can link the pension level, the retirement age or the contribution period to life expectancy. In South Africa, introducing a regular analysis of the evolution of life expectancy (every five years for instance) to decide whether the parameters of the mandatory pension schemes need to be adjusted would reinforce the sustainability of the scheme.
Automatic enrolment in occupational pension plans
Occupational pensions will play an important role for middle and high-income earners to reach a decent replacement rate. In most of the existing occupational plans, enrolment is automatic and comes with the labour contract. However, as a mandatory pension scheme is introduced, enrolment in occupational plans may not be automatic any more.
Introducing automatic enrolment has increased coverage of private pension in many countries (Figure 2.12). The default rate at which contributions should be set in an automatic enrolment scheme depends on how the private pension system interacts with the public PAYG pension system. In the case of South Africa, in addition to the basic contribution rate, higher contribution rates could be considered for high income earners to ensure that the targeted replacement rate is met for different income levels.
Financial and non-financial incentives can be used to encourage automatically enrolled workers to stay enrolled and to not opt out. Historically, tax deductions and tax relief have been the main type of financial incentives provided by governments to promote private pensions (OECD, 2014a). However, the largest coverage gaps are concentrated among lower and middle-income households who may draw little benefit from these tax incentives. In order to encourage people in such households to stay enrolled, countries often provide other kinds of financial incentives: matching contributions (from the employer and/or the state), government flat subsidies and guarantees.
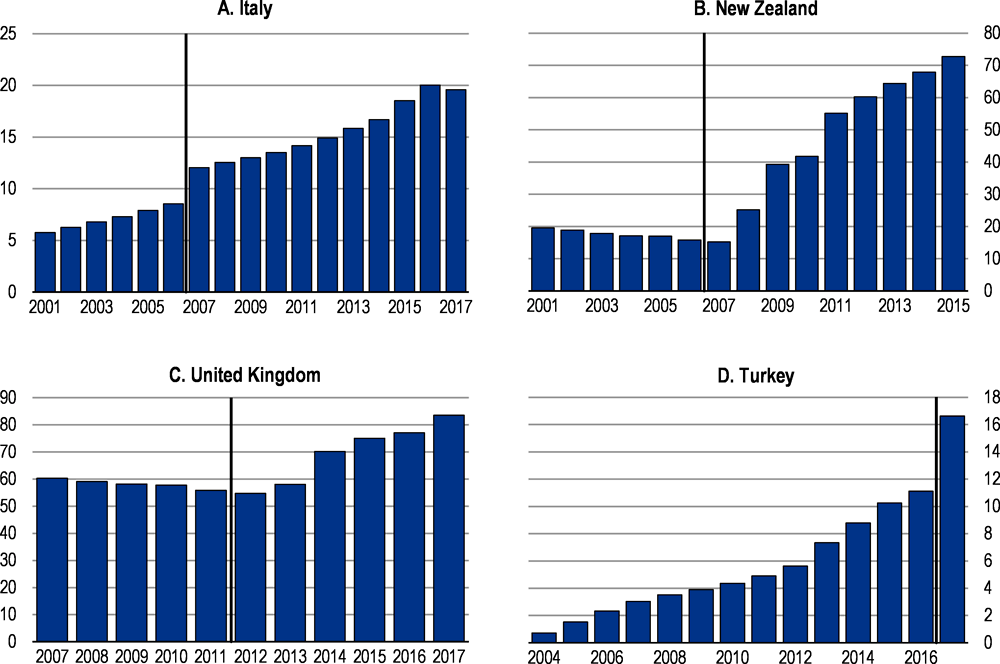
Note: Participation is measured as the number of members enrolled in a pension plan (i.e. having assets or accrued benefits in a plan). It is expressed as a percentage of the working-age population (15-64) in the case of Italy and Turkey; as a percentage of people under age 65 in the case of New Zealand; as a percentage of eligible employees in the case of the United Kingdom. Vertical lines represent the dates when the automatic enrolment scheme was established.
Source: OECD (2019), Inclusiveness and Finance, www.oecd.org/daf/fin/financial-markets.
Building on the proposals of the government discussion paper
A three level pension system
The South African government proposes a three-level pension system in its discussion paper on social security. The old-age grant would be generalised to all individuals aged 60 years and above or 65 years and above (also envisaged as retirement age). The second pillar would be the new mandatory pension scheme managed through the National Social Security Fund (NSSF). Finally, occupational and voluntary retirement funds will serve as complementary retirement insurance (Box 2.3).
The objective of the new pension system is to target a minimum replacement rate of 40% through the combination of the old-age grant and the mandatory pension scheme for revenues up to an income ceiling (ZAR 178 464 applied in the unemployment insurance fund). For individuals earning more than the income ceiling (around 20–25% of workers), it is necessary to complement mandatory savings with an occupational pension plan and/or a private pension plan.
The government’s targeted replacement rate is based on simulation made in 2012 before the introduction of a minimum wage in January 2019 amounting to around ZAR 42 000 annually, which will be progressively expanded to all sectors. Therefore, all workers in the formal sector should qualify for the mandatory pension schemes, which will reinforce the coverage of the pension system. However, a specific enrolment system should be designed for self-employed and informal workers, in particular for their participation in the second tier of the mandatory system. In particular, the contribution subsidy considered in the proposal should specifically target informal workers and low earning self-employed but will need strong enrolment efforts.
The Government Employee Pension Fund (GEPF) covers civil servants. The contribution rate is 20.5% for employees and employers combined and 23.5% for members of the army and intelligence service while for the NSSF the proposed contribution rate is 10% plus 2% for the unemployment insurance fund (as now). The targeted replacement rate of the GEPF is 50%. For instance, for the inclusion of civil servants in the NSSF, their current contributions could be separated in two parts: 12% going to the NSSF with mandatory enrolment and the rest going to an occupational account managed by the GEPF. A transition period should be put in place. For example, only workers with less than 20 years of contribution would be enrolled in the NSSF and new civil servants, which leaves enough time to accumulate pension rights in the new system. Such a mechanism would preserve retirement plans of workers leaving the public service soon and ease the transition between private and public service.
A related issue is the management of the mandatory pension scheme. As the proposed mandatory pension scheme is a pay-as-you-go (PAYG) system and will need adjustments of the parameters because of the ageing of the population, a public entity with clear a governance structure is better suited to manage the system. A public entity or agency should manage the mandatory pension scheme. However, the governance of the public entity should be transparent and its management duly selected. First, the board composition should be broadened to include representatives of private sector employees and employers. Second, a specific body should be established and tasked to review the parameters of the system with regard to life expectancy evolution, labour market dynamics, etc. That body would make recommendations to the government for the evolution of the parameters of the scheme to guarantee its adequacy, funding and sustainability.
Introducing a mandatory pension scheme with a 10% contribution rate will affect the structure of the retirement fund industry. Indeed, a 10% contribution rate will crowd out part of actual contributions to occupational pension and provident plans. Provisions should be adopted guaranteeing that existing plans will not be dismantled for workers above 50 years (less than ten years to retirement age) that would not be covered by the new mandatory scheme. Moreover, there should be mandatory negotiations between workers’ representatives and employers in firms or sectors providing occupational plans to set up continuation conditions of occupational plans so that workers can complement the mandatory retirement benefit. Finally, as already mentioned, incentives to consolidate the retirement industry should be provided to raise efficiency.
The NSSF will also provide disability and survivor benefits. Part of the contributions to the NSSF will cover risk benefits. A clear distinction between disability and survivor benefits should be made and between events happening during working age and retirement. During the working-age period, disability provisions should be further consolidated with existing risk funds (the Compensation fund). Whereas the disability and survivor benefit provisions seem reasonable, their funding scheme with regard to pension financing is not clear. As pension liabilities will grow overtime, a clear separation of pension provisions including pension survivor benefits from disability benefits is important for monitoring pension liabilities and financing needs.
Choosing the main parameters of the mandatory pension scheme
The government proposal has opted for a defined benefit pay-as-you go scheme (PAYG). Some parameters are key for the financial sustainability and adequacy of defined benefit schemes (Fall and Bloch, 2014). In particular, the robustness of PAYG defined benefit schemes to macroeconomic trend changes (productivity, ageing or migration) will depend on the capacity to adjust key parameters such as contribution rates, retirement age or the accrual rate (Fall, 2014).
The contribution rate to the NSSF is proposed to be 12% decomposed as 2% for the unemployment insurance and 10% for the retirement and risk benefits (disability and survivor benefits). The 10% contribution rate is not particularly high when compared to the OECD average (Figure 1.11). Canada and Australia have a pension scheme that is close to that proposed in South Africa. The public pension in Canada targets a 25% replacement rate for a 9.9% contribution rate. However, in Canada and Australia, occupational pensions and capital income constitute an important share of old-age income. Moreover, many old-aged people have to rely on work income in these countries. Work income represents 26% and 24% of the income of old people in Australia and Canada respectively (OECD, 2017b).
Note: In some cases, pension contribution revenues have been calculated assuming that the revenues are split between different social security programmes in the same proportion as the contribution rates. The total contribution includes payments from people who are not employed (principally the self-employed). In Denmark the ATP contribution is expressed as percentages of AW earnings of DNK 412 555.
Source: OECD (2017), OECD Pensions at a glance 2017 and OECD calculation.
The adequacy of the proposed pension scheme relies heavily on the old-age grant and the length of the contribution period. OECD simulations show that for a 0.6% accrual rate per year of contribution, a 24% replacement rate (out of average career wage) is reached only after 40 years of contributions (see Fall and Steenkamp, 2020, Table 1).
If the accrual rate is 1% per year then the replacement rate reaches 20% for 20 years of contributions and 40% for 40 years of contributions (see Fall and Steenkamp, 2020, Table 1, Scenario B and C). The overall replacement rate depends on the old age grant, which all workers will receive if universalised. Therefore, to reach the targeted average 40% replacement rate, there is a trade-off between 0.6% accrual rate plus a universal old-age grant and a 1% accrual rate without an old-age grant.
An important dimension to take into account when setting the parameters of the scheme is the evolution of life expectancy. South Africa’s demography is favourable for setting up a PAYG pension scheme, as overall life expectancy is low. However, life expectancy of participants in the pension scheme (workers and high-income earners) is higher than the average (Balestra et al., 2018). Old age longevity is expected to improve over time and could accelerate as well as survival probabilities at all age, as health delivery and living conditions improve.
Simulation of an ageing scenario where South Africa reaches the old age survival probabilities of Brazil shows that the individual actuarial balance of the scheme becomes highly favourable to individuals and may threaten its sustainability (see Fall and Steenkamp, 2020, Ageing scenario, Table 2 vs scenario D, Table 2.4). It means that a mechanism to adjust regularly the parameters of the scheme should be established from the beginning to guarantee the sustainability and adequacy of the pension scheme with regard to demographic evolutions.
Overview of health outcomes, healthy life styles and preventive policies
Although many health outcomes have improved significantly over the last decade, there is ample room for improvement. Life expectancy has increased in the last ten years from 54 to 63 years (Figure 2.13). The infant mortality rate has decreased from 39 to 23 infant deaths per 1 000 live births between 2009 and 2017; it is, however, still high by OECD standards. Prevention and treatment of tuberculosis and diseases of the respiratory system also show noticeable progress. However, tuberculosis remains a challenge, with a high number of new cases and multi-drug-resistant cases.
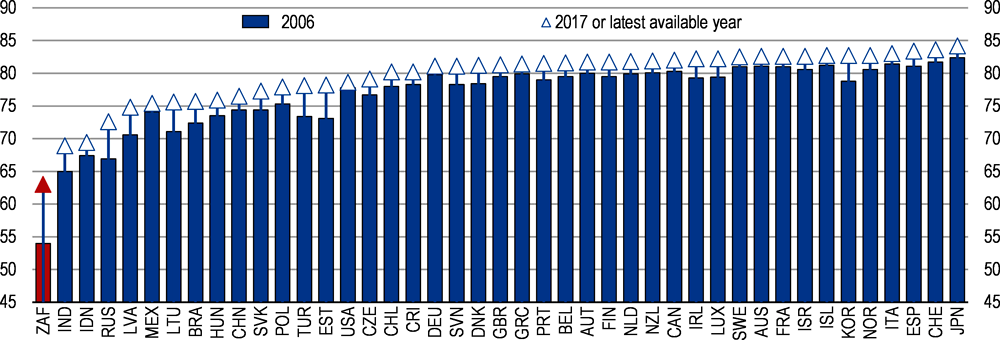
Source: OECD Health Statistics; Statistics South Africa.
The improvement in life expectancy is also a result of important government investment in the ARV programme that is now funding treatment for 4.6 million people. While deaths related to HIV/AIDS have more than halved since 2006, it is expected to contribute to further improvements of life expectancy (Figure 2.14). However, several diseases still cause high death rates, which are above OECD standards. In particular, diseases of the respiratory system, cancer and cerebrovascular disease's display high death rates (Figure 2.14). Diabetes treatment has seen no progress in the last ten years.
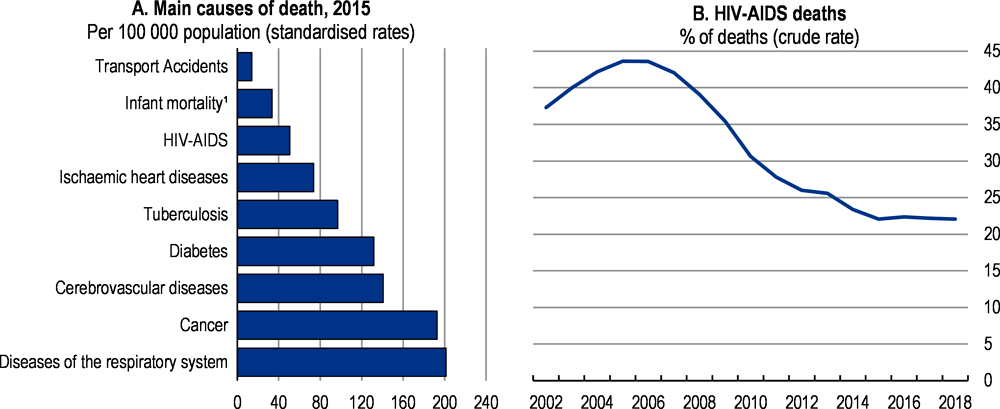
1. Deaths per 1 000 live births.
Source: OECD Health Statistics; Statistics South Africa.
A strict national March 26 at the strictest level (5). The lockdown was alleviated on the June 1 and put in level 3, giving more freedom of movement. The Level 3 allows persons to leave their place of residence to travel to work, buy goods and services, to move children or attend a school or learning institutions for instance. The nationwide lockdown was accompanied by a public health management programme. The initial strategy has focused mainly on behaviour change (for example, social distancing, wearing masks and not going to work when sick), early detection of cases through community screening and testing, contact tracing, disease surveillance and public health campaigns to reduce transmission of the virus in communities. By end of June, 1.630 million tests were conducted, 151 thousands positive cases identified and 2 657 deaths.
The national institute for communicable diseases (NICD) reported 10 700 COVID-19 admissions from 269 facilities (71 public sector and 198 private sector) between March 5 and June 21, 2020. These were the key findings:
Among 8 245 (77%) patients with data on co-morbid conditions, 2 810 (34%) had one co-morbid condition and 3126 (37%) had two or more co-morbid conditions.
Of the 5 836 patients who had a co-morbid condition, the most commonly reported were hypertension 3419 (59%) and diabetes 2813 (48%); and there were 1 116 (19%) patients admitted with HIV, 240 (4%) with active tuberculosis (TB) and 579 (10%) patients with previous history of tuberculosis.
Obesity, while not consistently recorded for all reported COVID-19 admissions, was noted by clinicians as a risk factor in 297 (3%) patients.
Some of the factors associated with in-hospital mortality were older age groups; male sex; and having co-morbid hypertension, diabetes, chronic cardiac disease, chronic renal disease, malignancy, HIV and obesity.
As the pandemic evolves, the strategy has shifted towards managing the increased volumes of patients that require hospital care. The objective is to rapidly scale up the capacity of hospitals to treat COVID-19 patients, including within intensive-care units. It is planned to set up field hospitals and other temporary facilities, procure equipment, recruit staff and buy medicines.
In response to the COVID-19 crisis, closer co-operation and pooling of available resources between the public and private sectors has been initiated. Most of the intensive/critical care beds are in the health private sector. Estimates vary widely. In April, the ministry of health estimated the total number of critical beds at around 3 300, with two-thirds of those in the private sector. However, healthcare provider Netcare estimates there are some 6 000 beds, with around 3 800 in private hospitals. Early June, the government and the health private sector representatives agreed on a daily fee of up to 16,000 rand ($950) for COVID-19 patients that get treated in critical care beds in private hospitals.
The government has increased financial support to the health sector to cope with the pandemic. In the June Supplementary Budget, ZAR 25 billion has been allocated to the health sector to cope with expenses related to the pandemic. In addition, ZAR 445 million has been allocated through the disaster funds mainly for personal protective equipment for health workers.
Source: National Treasury, Supplementary Budget, June 2020 and Ministry of Health, press release.
Despite formal equal access, health outcomes vary significantly by socio-economic status. There are still substantial differences in life expectancy and health status according to race, education and income (Statistics South Africa, 2018b). High-income individuals report having a better health status than low-income individuals, as in all countries. However, the difference between the two groups in South Africa is not as large as in many OECD countries (Figure 2.15, Panel A). The gap between the share of individuals reporting a disability amongst tertiary educated people and those with primary education is the highest among OECD and emerging countries (Figure 2.15, Panel B). These disparities may be explained by differences in the quality of health care accessed, financial access barriers, in living and working conditions, and in smoking and other risk factors.

Note for panel B: Data are pooled across all available years 2006-2015.
Source: OECD (2017), OECD Better Life Index; Balestra, C., et al. (2018), "Inequalities in emerging economies: Informing the policy dialogue on inclusive growth", OECD Statistics Working Papers, No. 2018/13, OECD Publishing, Paris, https://doi.org/10.1787/6c0db7fb-en.
The government has devoted important efforts to stop the HIV/AIDS pandemics, treat millions of individuals, prevent the mother-to-child transmission of the disease and develop preventive policies. Efforts preventing non-communicable diseases and strengthening the promotion of a healthier lifestyle have to be strengthened.
Obesity rates have reached alarming levels in South Africa. 37.3% of adult women are obese; this is the third highest rate among OECD and partner countries, just below Mexico and the United States (Figure 2.16, Panel C). As obesity is linked to the prevalence of diabetes and chronic diseases, it drives negative health outcomes and also increases in related health costs. Obesity is linked to co-morbid diseases like diabetes, hypertension, diseases of the respiratory system and cerebrovascular diseases that have a high mortality incidence in South Africa (Figure 2.14). In particular, type 2 diabetes is highly prevalent among obese black women in South Africa (Kruger et al., 2005).
The government has developed a national health promotion policy and a strategy for the prevention and control of obesity in South Africa (2015–2020). These programmes include actions targeting weight goals, healthy eating, physical activity and behavioural change (Department of Health, 2015a). The strategy identifies community services and primary health care services as the key actors for prevention and early detection. The implementation of these actions should be scaled up. South Africa has introduced a tax on sweetened beverages. The sale of sweetened beverages in school should be banned and preventive health messages linked to their advertisement.
Early school-based prevention programmes to promote a healthy lifestyle can reduce the prevalence of diabetes, whereas early control, counselling and quality management in the primary care sector can avoid high costs due to chronic complications that are common for diabetes when left untreated or poorly controlled (OECD, 2014b). South Africa has already a health programme targeting schools. It should be generalised to all schools and used to interact with parents to raise awareness of the risks linked to obesity, provide advice on diet and sports activity.
General practitioners and medical schemes should be incentivised to take on a greater role in prevention and chronic disease management as a fundamental part of their role as primary care provider. For example, they could act as main co-ordinator between primary and specialist care, while also supporting the patient through patient education and strengthening self-management practices (OECD, 2014b).
Tobacco consumption remains high, as 19% of the adult population are daily smokers. The rate of smokers is particularly high among men at 31% (Figure 2.16). Deaths related to tobacco consumption are high (Fuchs et al., 2018). Since 1994, the government has raised the tax on tobacco significantly. The combined excise tax and the value added tax was increased from 32% of the retail price to reach 50% by 1997. In 2006, the total tax target was increased to 52%. However, the tax burden of 52% (i.e. excise tax plus VAT) of the retail selling price of the most popular brand in each tobacco product category was changed in Budget 2015 to focus on excise tax component alone (i.e. removed the VAT component) to equate to 40%. Since 2017, tax on tobacco has further increased every year.
The authorities’ efforts to reduce tobacco consumption have shown effects as the proportion of regular smokers among adults in South Africa has declined markedly over the past two decades (31.0% in 1994 and 19% in 2016). The tobacco tax policy is credited for the decrease in tobacco consumption (Van Walbeek, 2002). (Stacey et al., 2018) argue that a more aggressive excise tax policy could lead to improvements in health and raise revenue. They estimate that an excise rate of 60% on tobacco would result in a gain of 858 923 life years (Stacey et al., 2018). Efforts to reduce tobacco consumption should be pursued both by further increasing taxes and specific information and education campaigns. The draft tobacco bill presented by the government in May 2018 to further regulate sale and advertising of tobacco products and packaging is a move in the right direction.
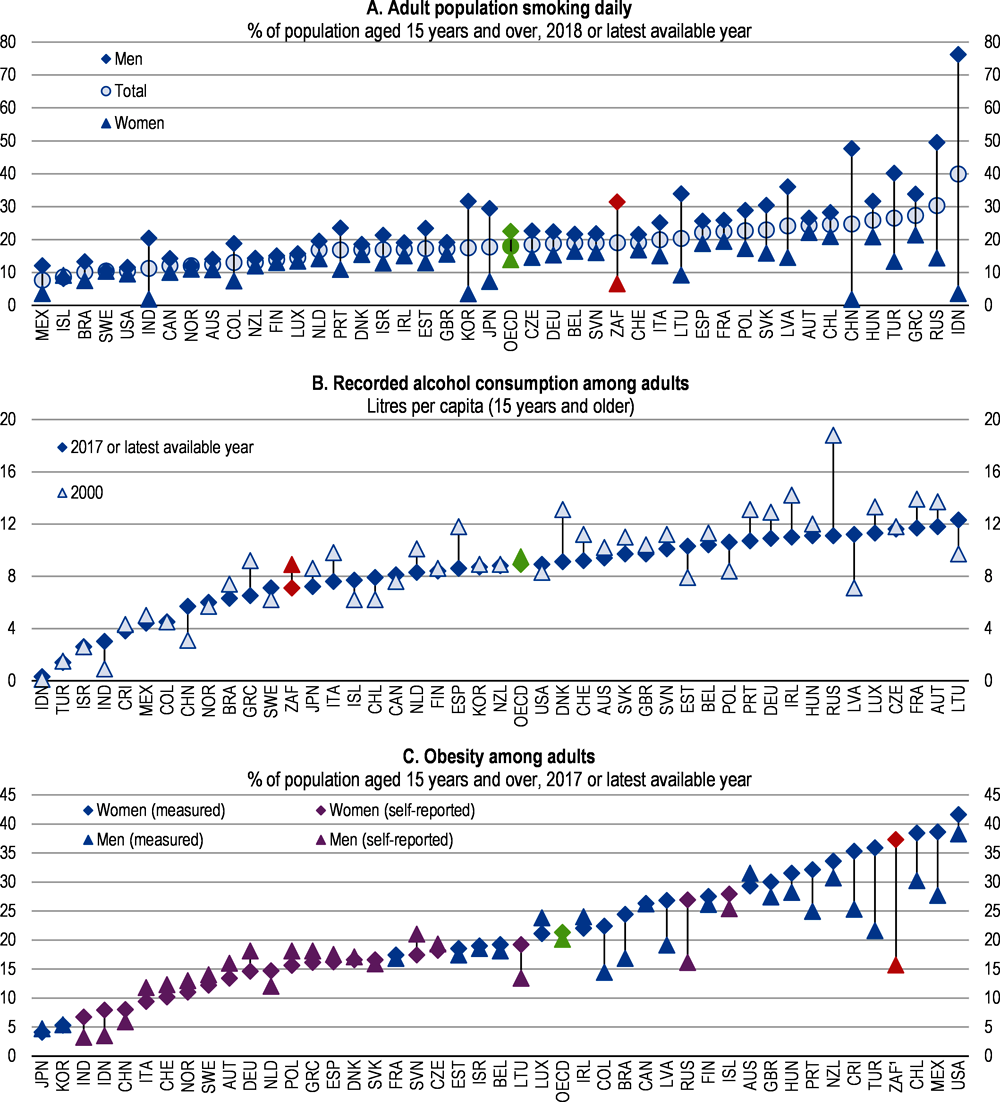
Note: Self-reported.
Source: OECD Health Statistics Database.
Alcohol consumption is high. 33.1% of above 15 years olds reported drinking alcohol and 15.9% and 2.7% of men and women respectively are alcohol dependent (Health System Trust, 2018). Moreover, of all drinkers, 43% reported binge drinking representing 14.1% of the total population. The average quantity of alcohol drunk per adult, at 7.5 litres, is below the OECD average, but still high (Figure 2.16).
Since 2002, South Africa has been increasing the tax on alcoholic beverages. In 2012, the alcohol tax burden as a percentage of the weighted average retail selling prices for wine, beer and spirits were 23, 35 and 48% respectively (National Treasury of South Africa, 2014). However, the tax burden (i.e. excise tax plus VAT) was changed in Budget 2015 to focus on excise tax component alone (i.e. removed the VAT component) to equate to 11%, 23% and 36% for wine, beer and spirits respectively. In almost all the following years, the tax on alcoholic beverages was raised with a different treatment for local beer with low alcohol content and wine, to limit the impacts on low-income individuals and on wine producers.
Policy measures targeted to reduce alcohol consumption should follow an integrated approach that extends beyond price incentives, including educational and preventive programmes. These include measures targeting underage drinking, drinking during pregnancy, drunken driving, and alcohol abuse behaviour such as binge drinking. Additional measures to reduce alcohol consumption could therefore include the banning of advertisement, restricting places of sale as well as strengthening preventive programmes targeted at vulnerable population groups, which tend to consume more alcohol (National Treasury of South Africa, 2014).
Improving the coherence and organisation of the health care system
Inefficient health spending structure
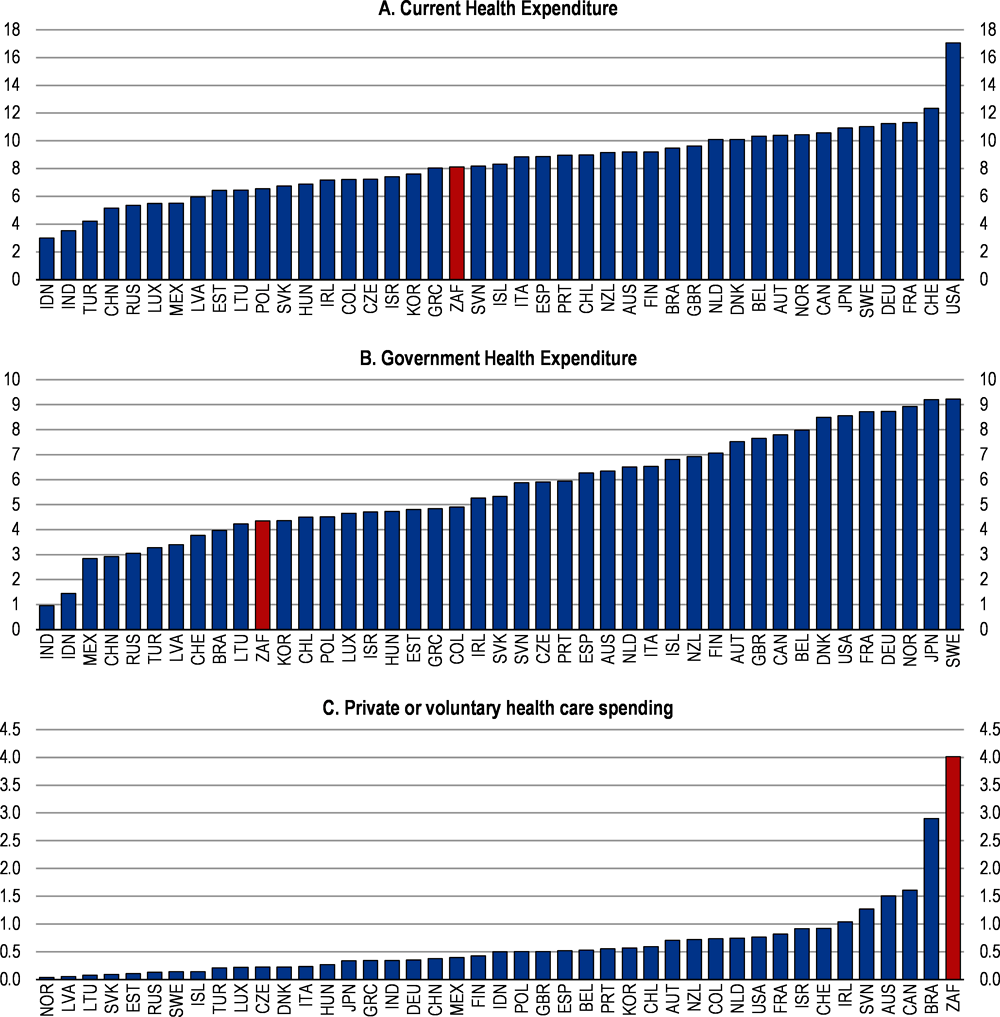
At 8.1 % of GDP in 2016, health spending seems high for an emerging economy and is comparable to the OECD average (Figure 2.17, Panel A). However, the total spending masks an unbalanced structure and important inefficiencies. In particular, government spending is low while private spending is the highest amongst OECD and emerging countries (Figure 2.17, Panel B and C). Government health spending has been increasing only slowly since 2010 by 0.1% of GDP per year and most of the increase has been due to wages and HIV/AIDS treatment.
The unbalanced private and public structure of spending accentuates inequalities. Public health services cover all citizens but some people above a means-tested income threshold are subject to co-payments. However, private voluntary health insurance covers 16.9% of individuals, but amounts to half of the country’s health spending (Statistics South Africa, 2018b).
Many households not holding a private insurance use private facilities instead of free access to public facilities, because of perceptions of poor quality of health services and difficult access (waiting time and unsatisfactory conditions) of public health-care facilities. 27.4% of households indicated that they would go to private doctors, clinics or hospitals, even though they do not have a private insurance (Statistics South Africa, 2018b). This indicates that there is room to improve health spending. Inefficiencies are also high in the private health sector where unregulated price increases are not related to the quality of services (Competition Commission, 2018) (see section 2.4.3 below).
Source: WHO Global health expenditure Database.
Within the public sector, there is room to improve the allocation and execution of health spending (James et al., 2018). South Africa has a three-level government structure (National, 9 provinces and 278 municipalities). Public providers owned by provinces and municipalities deliver most government health services. Provincial health budgets are transferred from national government, on average 80% from the allocation formula and the other 20% are conditional grants based on priority areas as HIV/AIDS interventions, infrastructure projects and are needs based (James et al., 2018). The allocation of conditional grants is the responsibility of the Department of Health and reflects differences in provincial needs.
Most of the inefficiencies in public health spending lie at the provincial level. The use of the budget allocated to the health sector at the provincial level is entirely a province-level decision. There are important disparities in the amount spent on health across provinces not necessarily related to health needs. More transparency is needed at the provincial level on the budget allocation to the different health care sectors to guarantee that the health sector is appropriately financed. Health facility budgets are not standardised across provinces (James et al., 2018). Regularly updating the budget allocation process at the provincial level will help to better match the needs of the different sectors. Developing diagnosis-related groups will help in assessing the needs of health care providers and give incentives to managers for better performance. Moreover, improving the capacity of district hospitals and managers of district health offices in budgeting would be an important first step to ensure their needs are better reflected in the budgets.
Finally, the wage bill and its strong increases are a binding constraint on public health providers’ activities. The growing number of personnel and substantial wage increases drive the rise in the wage bill, while the budget allocation by central and local government has not matched these increases in the recent years, crowding out maintenance of facilities and now freezing employment.
Challenges related to introducing a National Health Insurance scheme
The dual health system is not optimal in terms of funding arrangements and use of health facilities. While public health providers are for the benefit of all citizens, they receive those that are most exposed to diseases and the most fragile segments of the population. The lack of coordination between public and private health care facilities creates an overuse of public facilities while the prices of private facilities are high, due in part to lower volume.
To address the failure of the current health system, the Department of Health has initiated an overhaul of the health system through the introduction of a National Health Insurance (NHI) fund. A white paper on the introduction of the health insurance fund was published for comments in 2015 and 2017 and a draft bill in July 2018. The NHI fund aims to provide universal health coverage. Tax revenues and mandatory contributions would finance the NHI. In the white paper, different financing scenarios have been considered, including a payroll tax, VAT and a supplementary income tax earmarked for health spending (Department of Health, 2015b). Further analyses of the financing of the NHI initiatives with the introduction of a mandatory pension schemes are provided in section 5 below.
The NHI fund would contract with public and private health care providers based on a large basic basket of health benefits including primary care, emergency and hospital-based services. It would act as a single buyer and provider of health care, excluding the existing 80 private insurance schemes (medical schemes). Such a player should have the capacity to better negotiate prices –provided public tenders are fair and competitive-, ensure risk pooling and generate efficiency gains.
There are many controversies and concerns around the introduction of the national health insurance initiative. One of the major issue is the co-existence of private health insurers with the NHI. Indeed, the introduction of the health insurance fund has strong implications for the private insurance industry. There are three options:
First, the NHI is the only player and private insurance schemes are given no role in the NHI. In this case, employees while contributing to the NHI may still revert to medical schemes or private health care providers for any need not covered by the NHI or if they are not satisfied with the service provided by the NHI. This option would take no advantage of the skills, infrastructure and knowledge of the existing insurance industry to run a complex mandatory public provision and private health delivery relationships. Also, private health spending is a voluntary contribution decided by individuals or through collective agreements provided by the employers. The failure of the public service to deliver quality health care has led to individuals opting for private insurance despite the higher contributions. Therefore, unless the quality of public health services is improved, the introduction of the NHI may not eliminate the need for private insurance. However, the introduction of mandatory contributions to the NHI will limit the affordability of private insurance for households.
Second, there is a complementary role left for private insurance as the scope of coverage of the NHI is then focused on primary care and a prescribed minimum basket. The complementary role can have two dimensions, one is to top up the share of payments not covered by the NHI and the other to cover treatments not offered through the NHI.
The third option is to allow individuals to decide which medical scheme, including the NHI, will administer their NHI contract. In that case, individuals are entitled a NHI coverage/contract with an annual value and a defined benefit package and they choose among health insurers one administrator of their insurance. The NHI would be in charge of collecting contributions, defining the benefit package and the pricing of included health services. The health insurers would compete to attract members without the possibility to charge any additional fees for the services included in the benefit package.
The government has decided to increase finance to public health and to roll out progressively the NHI. It means that for a long time the NHI will coexist with private insurance schemes. Individuals would eventually renounce to their private insurance only if the quality of care and the administrative efficiency of the NHI are substantially higher than current performance of the public health care. In the meantime, the scope of private health insurers to set multiple benefit options and supplementary benefits and premiums leading to risk selection and small, fragmented risk pools should be limited and regulated. The benefit package of the NHI contract should be clearly defined and a ceiling in administration costs set.
The introduction of the NHI is in its second preparatory phase. It is crucial to build administrative capacities for performance-based management, including the introduction of diagnostic-related group pricing mechanisms for hospital and specialised services and capitation for primary care. An important part of the role of the NHI will be to control cost developments to ensure affordability of health care and incentives for investing in equipment and new efficient treatments. Moreover, the distinction between national health policy and related programmes and their financing and health care services through NHI should be clarified.
The health insurance market
The private health sector represents half of the health spending, but caters to only 16% of the population. The private sector has two components: the medical insurance schemes that provide health coverage to insured individuals and their relatives and private health care providers such as private doctors, clinics and hospitals. In 2017, there were 21 schemes open to all individuals and 59 restricted schemes mostly sponsored through employment (Table 2.4). Some schemes are small: 34 schemes have below 15 000 beneficiaries. On average, one member covers 1.2 dependents. Most of the schemes offer more than two benefit options, which leads to a segmented market. The Prescribed Minimum Benefit (PMB) package, defined by the government and monitored by the Council for Medical Schemes, is the only common feature.
The main concern in the private sector has been the rising tariffs of health care reflected in medical scheme contribution increases for comparable or lower health care benefits. Contributions and spending have been increasing steadily in the last decade (Figure 2.18). The average contribution rate increase across the medical scheme industry was 11.3% between 2016 and 2017 and 7.2% between 2017 and 2018 while inflation was 6.4% in 2017 and 4.7% in 2018 (Council for Medical Schemes, 2018). OECD analyses found that South Africa’s hospital prices are high and comparable to advanced countries like the United Kingdom, Germany and France (Lorenzoni and Roubal, 2016). Apart from health care prices, among the factors that may explain the rise of the cost of medical insurance are the low degree of competition in the market, the cost of administration, the role played by the prescribed minimum benefit package and the number of options.
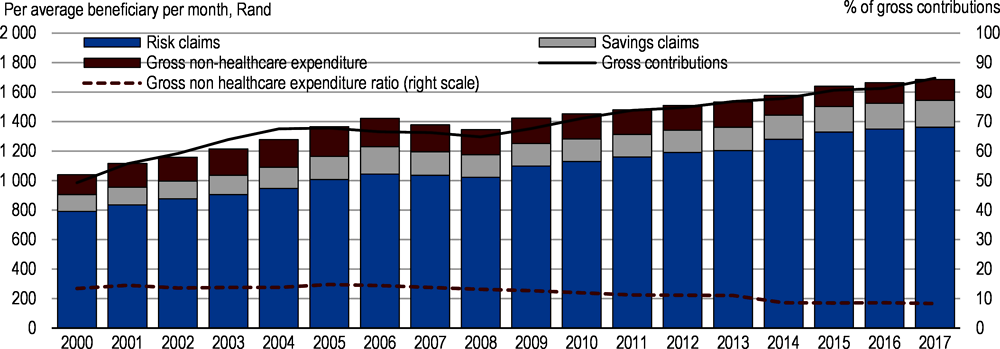
Source: Council of Medical Schemes, 2018 annual report.
The low number of actors in the medical insurance industry can explain the rising tariffs (Figure 2.19). In the open schemes market, the market share of the biggest scheme is 55% and the top three represent 75% of the market. In the restricted schemes market, the market share of the biggest scheme is 47% and the top three represent 66% of the market. The preliminary conclusions of the assessment conducted by the Competition Commission point to regulatory barriers (minimum size for starting, reserve ratio, financing conditions) that limit entry in the market and no vigorous competition between open schemes (Competition Commission, 2018). The Competition Commission recommends facilitating the entry of regionally based schemes. However, medical schemes are non-profit organisations. Therefore, the room for competition is linked to the administration fees, the quality of care and the client-relationship management. It is not clear that more medical schemes will bring value and may reduce risk pooling.
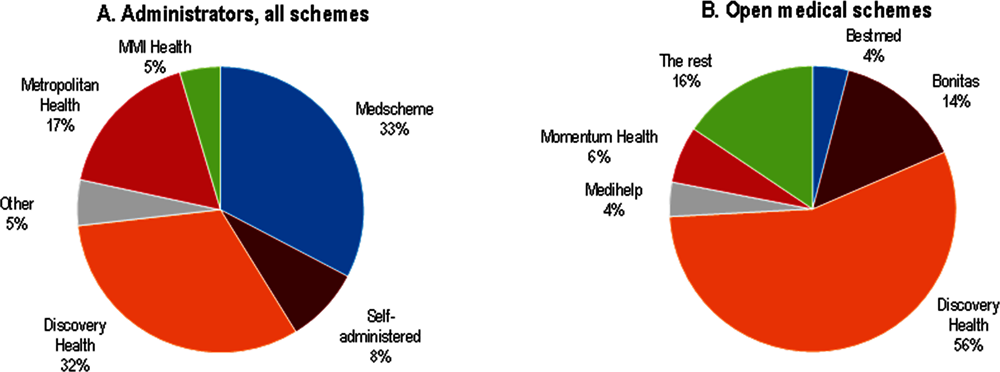
Source: Council of Medical Schemes, Annual Report 2018, https://www.medicalschemes.com/files/Annual%20Reports/CMS_AnnualReport2017-2018.pdf.
Administrators covering 91.5% of beneficiaries manage most of the medical schemes. Administrators are for profit organisations that operate medical contracts on behalf of medical schemes and receive management fees. The top three administrators cover 81.7% of beneficiaries. The self-administered medical schemes only cover 8.5% of beneficiaries. The fees paid to these administrators represented on average 7% of the gross contribution income in 2017, with open schemes incurring higher administration fees. Moreover, brokers intervene in the market, with ambiguous relationships with medical schemes. Fees paid to brokers represented 1.2% of the gross contribution income but they also pay some affiliation royalty fee to medical schemes. The Competition Commission found that the interests of the for-profit administrators are dominant and scheme members and trustees are too weak or disempowered to force administrators to deliver value for money. Non-healthcare expenditure represented 8% of gross contribution income in 2017 and for the 10 largest schemes it ranges from 7.4% to 11.9% of gross contribution income compared to only 3% on average for OECD countries (Council for Medical Schemes, 2018). As medical schemes are non-profit organisation and members’ contributions are subsidised, the government could put a ceiling on the share of fees paid to administrators. This ceiling could be determined by comparing the administration cost of the different schemes, referring to international best practices and set in a range between 3 and 5% including brokers’ fees.
The number of options in the medical schemes increases the complexity for clients and limits the risk pooling. On average, open schemes had 6.5 options per scheme and an average of 17 272 members per option. Restricted schemes had an average of 2.4 options per scheme, with an average of 11 677 members per option. The number of options per scheme should be limited to three (basic, middle and high) with a basic option corresponding to a revised prescribed minimum benefits package (PMB). The system of options confuses clients on the benefits provided by the prescribed minimum benefits package (Competition Commission, 2018). Moreover, the PMB could contribute to rising health costs, although the Competition Commission did not find convincing evidence that the PMB is driving up costs. However, the Competition Commission observed a shift in diagnosis patterns from non-PMB to PMB diagnoses by all medical service providers, but particularly by medical specialists. This may reflect practitioners’ abuse of coding and supply-induced demand behaviour.
The NHI framework plans to reform the prescribed minimum benefits to provide a broader coverage. Broadening the coverage of the PMB will limit the need for extra-options. However, it would require strengthening the control of the pricing of services covered by the PMB and the referral system of care. In particular, it should cover for more out-patient care to limit the admission of patients to hospitals, which often comes at a higher cost. Moreover, currently, medical schemes have little or no bargaining power over prices once a treatment is classified as covered by PMB package. This incentivises health providers to prescribe more services if the patient can access PMB benefits. Also, the access and implementation of the PMB is considered overly complex. The revised form of the PMB should be simple, easy to implement and requires defining clear guidance classification of health care services and developing a universal and agreed coding system.
Improving the delivery of health care
Reforming the primary and outpatient care sector
Developing a well-performing primary health care system is recognised as key for the success of the NHI and better health outcomes (Department of Health, 2015b). South Africa has chosen a decentralised management system of health care with the district health system being the level at which delivery of primary care is organised. The primary health care system has been seriously challenged by the emergence of the HIV/AIDS epidemic, and associated tuberculosis, as well as the quadruple burden of this disease, which includes violence and injuries, maternal and child mortality, and chronic non-communicable diseases (NCDs).
As part of the NHI initiative, a reorganisation and reinforcement of the primary health care system is underway. A list of national norms and standards has been established in part informed by the Ideal Clinic Project pilots. The objectives are to improve infrastructure and patient experience. Many clinics in the 10 NHI pilot districts are at various stages of infrastructure replacement, backlog maintenance and refurbishment in order to qualify for the Ideal Clinic status. Also, district clinical specialist teams have been set up to deliver maternal and child health care. Community-orientated primary care has also been implemented in some districts, where teams of community health workers, supported by nurses, take responsibility for addressing health needs of a designated group of households.
However, there are still many shortcomings in the delivery of primary health care leading to poor health outcomes and long waiting times for hospital services. Access to primary care facilities is uneven across provinces and districts contributing to congestion in hospital services. In rural areas access can be difficult due to long distances to public health facilities (Mcintyre and Ataguba, 2017). Public clinics are the first level health facilities, but the quality is uneven among provinces (Table 2.5). Among the public clinics, only 43.5% qualify for ideal clinics with important disparities among the provinces. (Health System Trust, 2018). The government should accelerate the upgrading of public clinics, which are essential for better primary health care delivery and the success of the NHI.
The low number of health professionals and their distribution across provinces and between public and private facilities restricts access to quality care in many districts (Table 2.5). The number of doctors and nurses is low, in particular when compared with OECD countries (Figure 2.20). Moreover, private doctors and specialists outnumber the public health practitioners. This contributes to the lack of doctors in rural areas and in primary care facilities. As a consequence, first-contact primary care is mainly offered by nurses in 80% of all consultations in the public sector and there is evidence that nurses struggle to substitute for medical generalists (Mash et al., 2016).
The low number of health practitioners leads to a high workload, in particular in public health facilities. The average number of patients seen per professional nurse and clinical doctor per workday is 25.4 and 21 respectively (Health System Trust, 2018). The high number of patients weighs heavily on the quality of care and satisfaction of patients in the public service. Moreover, the distribution of associated practitioners, such as retail pharmacists, is also uneven and contributes to low access (Mcintyre and Ataguba, 2017). The government has initiated programmes to increase the number of doctors by sending many students to Cuba and urging national universities to increase study places for doctors and nurses. More effort and financing should be devoted to medical faculties to increase their capacities. Increasing the number of health practitioners is key for better health care delivery and would raise competition in the private sector and limit price increases.
There are no information systems in the public and private sector to track the quality of health care delivered. This is harmful to public health care facilities as perceptions determine people’s view of the quality of care. In 2017, 55.1% of patients were ‘very satisfied’ and 26.7% ‘somewhat satisfied’ with public sector health services, whereas the corresponding figures for private-sector health care were 91.5% and 5.8% (Statistics South Africa, 2018b). Sanitary conditions, waiting times and the lack of appropriate drugs are key determinants of low satisfaction (Mcintyre and Ataguba, 2017). The quality of care is affected by low availability of drugs (Bheekie and Bradley, 2016). The government has introduced the Office of Health Standards Compliance (OHSC), through the 2013 National Health Amendment Act, to assess health facilities. However, the OHSC inspections focus mostly on structural measures of the quality of care, such as the availability of physical, administrative and other infrastructure of facilities. An information system should be put in place to oversee the technical application of protocols and measure health outcomes. Such a system would incentivise managers and practitioners to provide better care quality.
South Africa needs to better co-ordinate the total existing general practitioners in the primary care service. There are around 19 000 established medical practitioners, working as primary care doctors in the private or public sector. A better co-ordination and contracting with private doctors is necessary to guarantee access to doctors in primary care. In the NHI framework, a mapping of private doctors with primary care facilities should be introduced. For instance, contracting private general practitioners to serve one or two days per week in public clinics will ease the burden for public hospitals. Moreover, the general practitioners should play a mandatory gate-keeping role. That would reserve hospital services for emergency and acute diseases. However, to make a significant contribution, these doctors need to be re-orientated and upskilled for their role in the future primary healthcare system (Mash et al., 2016).
The contract to attract private general practitioners to serve part-time in public facilities should be a mix of capitation fees and fee-for-service. For both GPs and specialists, the remuneration should include more quality-based components. Developing e-health and including incentives for GPs and specialists to co-operate through an electronic health system would also increase efficiency.
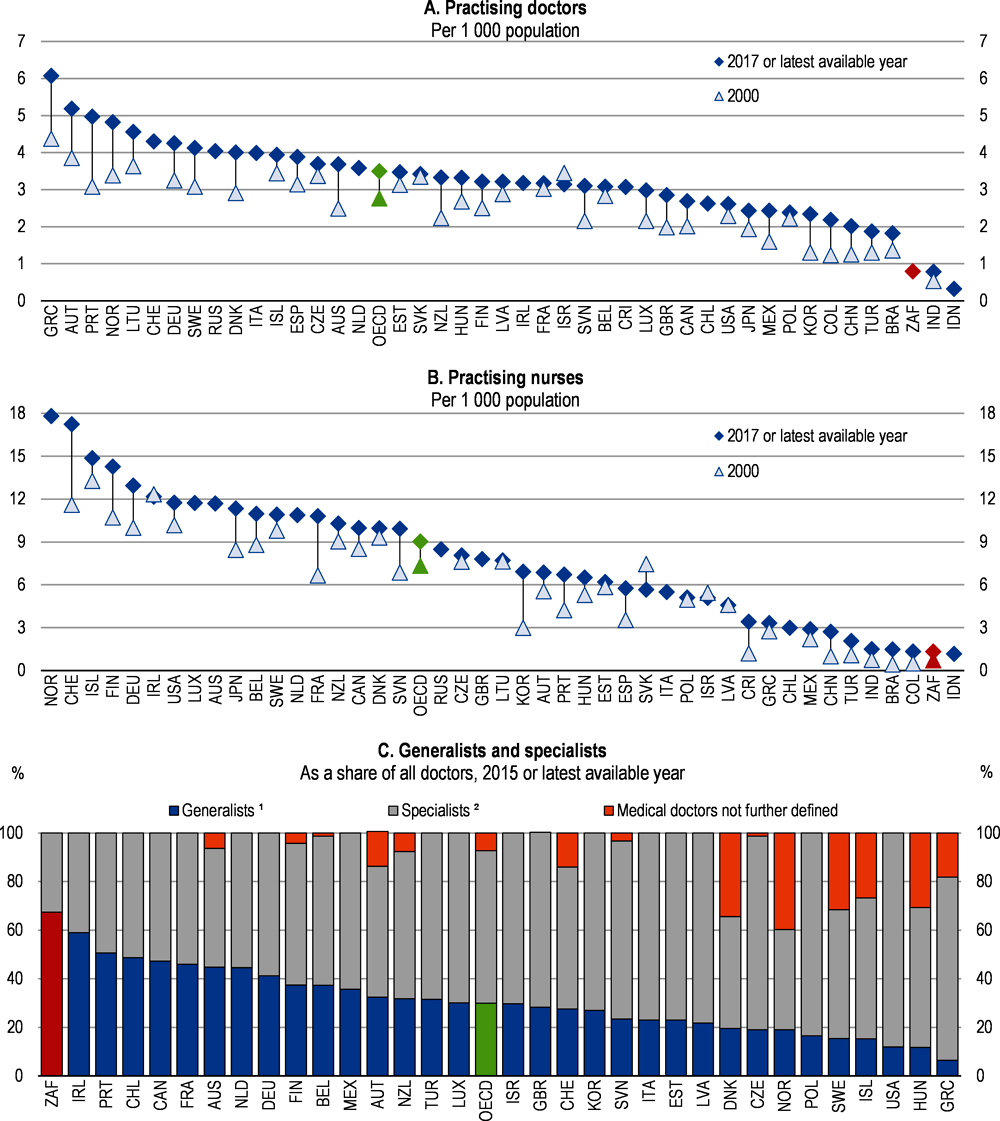
1. Generalists include general practitioners/family doctors and other generalist (non-specialist) medical practitioners.
2. Specialists include paediatricians, obstetricians/gynaecologists, psychiatrists, medical, surgical and other specialists.
Note for panel A: Data Chile, Greece, and Portugal refer to all doctors licensed to practise, resulting in a large over-estimation of the number of practising doctors (e.g. of around 30% in Portugal). Data for Canada, France, Iceland, Slovak Republic and Turkey include not only doctors providing direct care to patients, but also those working in the health sector as managers, educators, researchers, etc. (adding another 5-10% of doctors).
Note for panel B: Data for France, Iceland, Ireland, Portugal, Slovak Republic, Turkey, the United States, include not only nurses providing direct care to patients, but also those working in the health sector as managers, educators, researchers, etc. Austria and Greece report only nurses employed in hospital. Data in Chile refer to all nurses who are licensed to practise.
Note for panel C: In Ireland and Portugal, most generalists are not GPs ("family doctors"), but rather non-specialist doctors working in hospitals or other settings.
Source: OECD Health Statistics Database; OECD (2017), Health at a Glance 2017: OECD indicators; South Africa Health Review, 2018.
Reforming hospital management and in-patient care
South Africa had 658 hospitals in 2018 among which 260 are private hospitals. The spatial distribution of public hospitals is quite even but KwaZulu Natal has more public hospitals than other provinces when population size is taken into account (Table 2.7). Private hospitals are mostly in urban and metropolitan areas. Moreover, the number of hospital beds is low when compared with OECD standards (Figure 2.21, Panel A). However, the relatively low average length of stay in hospitals helps to ease access (Figure 2.21, Panel B). The average length of stay in hospitals is often regarded as an indicator of efficiency. But it should not come at the expense of early discharge of people. The absence of performance indicators does not allow to assess the relevance of this indicator. However, new medical technologies – in particular the diffusion of less invasive surgical interventions – and better anaesthetics have made day care interventions possible, and reduced the unit cost per intervention by shortening the length of a hospital stay (OECD, 2017a). More use of these ambulatory procedures can help to reduce the average length of stay.

Note for panel B: Data for Canada, Japan and Netherlands refer to average length of stay for curative (acute) care (resulting in an underestimation). In Japan, the average length of stay for all inpatient care was 28 days in 2017 (down from 39 days in 2000).
Source: OECD Health Statistics Database.
Hospital facilities are overused contributing to the low quality perception. Indeed, the majority of use of health services occurs in the public sector, both for out-patient services (over 70%) and even more for in-patient care (over 80%) (Mcintyre and Ataguba, 2017). Public hospitals provide care to the 84% of South Africans (even if almost everyone has access) who are uninsured, albeit with approximately 70% of the country’s hospital beds (Ranchod et al., 2017). Both low- and high-income people use public hospital services. Figure 2.22 indicates that while 98% of the lowest quintile turn to public facilities for out-patient care, 37% of the highest quintile did use public services (Statistics South Africa, 2018b). Figure 2.22 also suggests high out-patient care in public hospitals. While out-patient care tends to be more cost effective than in-patient care, it is an inefficient use of hospital resources when it substitutes for in-patient and primary care. Hospital resources should be devoted primarily to acute care. Through the NHI framework, out-patient care should be shifted mostly to primary care and private general practitioners.
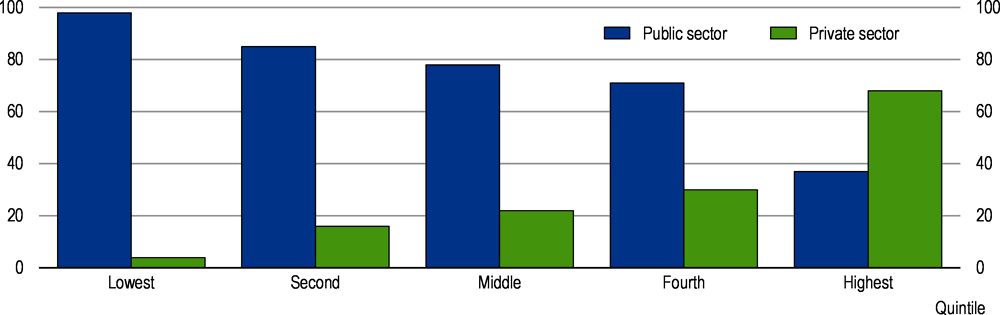
Source: Statistics South Africa (2019), South Africa Demographic and Health Survey 2016.
The allocation of resources, the effectiveness of treatments and the appropriateness of care received are important parameters for the efficiency of hospitals. There are different ways to optimise hospital care, for example by streamlining procedures, adjusting treatment methods or creating economies of scale through co-ordinated care provision. However, there is no comparable information system to monitor quality of care and outcomes in the public and private system (Ranchod et al., 2017). There is currently no legislative requirement nor is there a dedicated agency with a mandate to manage and improve the access to more sophisticated information beyond pure clinical coding for reimbursement purposes. Moreover, there is no electronic health record systems, which would be used for quality of care evaluation. These factors present in the private and public sectors hinder the development of genuine pay for performance reimbursement contracts or allocation of resources.
Quality-improvement institutions that work across both the public and private sectors are essential. The Office of Health Standards Compliance (OHSC) is an important first step, but a further focus on both accountability and quality improvement (as opposed to measurement) is required. The OHSC should be mandated to require the necessary improvement in care strategies and to publish comparable quality indicators to develop accountability.
The remuneration scheme should be used to incentivise hospitals to search for efficiency gains. Developing a Diagnosis-Related Group (DRGs) system will allow to benchmark hospital performance in terms of efficiency and best practices and select the sub-group that is used to set prices including case payments and allocation of global budgets. A mix of capitation and fee-for-service payments for hospital out-patient care could also be developed. Though remuneration of health practitioners in the hospital system is lower than in private facilities, the remuneration level is not low and tends to be high with seniority and management responsibilities (Department of Public Service and Administration, 2018).
Giving more responsibility to hospital managers is essential to drive efficiency and better performance. Within the NHI framework, it is proposed to introduce Contracting Units for Primary Health Care (CUP) at the decentralised level. The management authority will be given to individual public hospitals and organisational entities such as CUPs. While the CUPs would be the providing body, hospital managers should be given leeway to allocate their resources efficiently. OECD analysis found that it could help health facilities to increase their responsiveness to changing needs during the fiscal year – and consequently ensure better budget execution (James et al., 2018). Delegating more power to hospital managers should be accompanied by more accountability whereby managers could lose their job if they misappropriate funds. Programmes to raise management skills of hospital directors should be put in place to handle increased devolution of responsibilities.
Regulating the private health care sector
The pricing of private health care and the volume of activity are the key element for a sustainable private health industry, affordable health care and access for low-income people to private health care. Moreover, it will play an important role in the NHI framework. OECD analyses found prices in the private sector particularly high for an emerging country (Kumar et al., 2014, Barber et al., 2018, and Lorenzoni and Roubal, 2016). However, spending in the private sector has also been driven by increasing consumption of health services.
There is currently no binding tariff regulation in South Africa. This is the result of successive decisions and lack of legislative provisions and implementation. In 2004, the competition authority prohibited a process of collective bargaining with tariff schedules defined by the main actors in the private health industry (medical schemes, association of private hospitals and the medical association). Then, in 2009 the Council for Medical Schemes provided reference prices for healthcare goods and services through a National Health Reference Price List (NHRPL). Following this initiative, the Department of Health initiated a process to determine a binding reference price list, which was challenged and struck down by the courts.
The absence of price regulations has led to important increases in out-of-pocket payments, which is a concern for access to health care. In 2017, the level of out-of-pocket expenditure represented at least 19.8% of total health care expenditure among medical scheme beneficiaries. The bulk of out-of-pocket payments were for out-of-hospital medicine claims (33%).
Since 2010, prices are set following two processes. Formal annual negotiations take place between medical schemes (often represented by their administrators) and corporate providers (hospital groups, pathology groups, etc.). These negotiations take the form of bilateral agreements regarding tariffs for mostly fee-for-service and some reimbursement contracts. As healthcare professionals (including GPs, specialists, and allied professionals) practice independently, medical schemes generally determine annual increases in underlying fee-for-service tariffs for individual health professionals by inflating the prior year’s tariffs close to inflation. Individual health professionals are free to accept these tariffs, or to charge any other tariff, opening room for out-of-pocket payments. These prices do not consider quality of care, nor tackle supply-induced demand behaviour.
For a financially sustainable private health sector and an affordable national health insurance including private health providers, it is essential to introduce a pricing system that contains health cost increases. The competition commission has ruled out returning to a collective bargaining system. Therefore, it is necessary to build a price reference system that guides price setting.
A price schedule provides a basis for reimbursement of health care providers and brings predictability. Such a system is necessary for the introduction of the NHI as it will allow comparing public and private providers and defining the reimbursement level for the different types of health care. Across OECD countries, price-setting norms and institutions have developed over a long period of time and are, in many cases, the outcome of negotiations between the health sector and government (Barber et al., 2018). South Africa needs to develop a national coding system combined with disease classifications, commonly agreed with all health actors that serve as the common language by which medical services are recorded and billed. Several OECD countries have established hospital pricing schedules that incorporate relative cost weights and allow for the comparison of resource intensity and complexity of most hospitals (and in some cases, out-patient) services (Barber et al., 2018).
OECD analysis recommends that the process of going from codes to price schedules be entrusted to an independent body to guarantee integrity and independence (Barber et al., 2018). Also the competition commission has recommended to set up such an independent body with the participation of physicians’ associations, hospitals and other health professionals, along with medical schemes and the government. More precisely, the competition commission recommends that an independent supply-side regulator be established to oversee and manage functions related to healthcare capacity planning, economic value assessments, the determination and implementation of appropriate payment mechanisms, and outcome measurement, registration, and reporting (Competition Commission, 2018).
The price schedule would then serve as the basis for negotiations to set reimbursement rates. Schemes and hospitals would then focus on negotiating overall price levels, accounting for geography and specialised functions (such as emergency departments, trauma and cancer centres). Such benchmarks will also allow competition authorities and courts to assess situations of unwarranted and excessive charging behaviour, and strengthen patient protection.
However, as reimbursement of treatments covered by the prescribed minimum benefits package are mandatory, setting binding prices for these treatments are necessary for predictable costing and funding. Within the NHI framework with a broader treatment coverage, such binding pricing is essential to assess the financing needs of the NHI.
Moreover, most of the remuneration of private providers is based on fee-for-service models. The fee-for-service model is known to increase the volume of activity at the expense of quality and to inflate health cost. In this model, insurers and patients bear the entire financial risk. It has led to the development of important out-of-pocket payments and a low level of reimbursement of certain treatments. Price schedules combined with prospective budgets can help counter the tendency for over-provision. A better combination of capitation and fee-for-service payment will help to guarantee value-for-money and predictability.
South Africa has an ambitious reform agenda on social protection. The introduction of a government sponsored mandatory pension and health insurance schemes will represent an important transfer from privately financed social protection to publicly funded provisions.
The government discussion paper on social security reform proposes a 10% contribution rate on wages for pension provisions, which corresponds approximatively to 5% of GDP. However, the increase on government revenues would not necessarily corresponds to net increases for workers and households, as they would substitute partially for current private or occupational contributions for health and retirement.
Wage based pension contributions is common as it ties pension levels to contribution levels and periods. However, a one-off 10% increase on labour cost could hamper employment. It is then essential that this contribution at least partially substitute for current contributions to pension schemes. Moreover, the low growth environment is not favourable for introducing mandatory social security contributions. However, the low level of social contributions and the overall low level of the tax wedge leave room for introducing social contributions on the payroll in the future. South Africa has a low tax wedge at 15.3% of labour costs at the average wage level compared with the OECD average at 36% and to Brazil (32.5%) or China (32.9%) (Table 2.6). The tax wedge measures the difference between the labour costs to the employer and the corresponding net take-home pay for the employee and takes into account employee and employer social security contribution and the personal income tax. However, given the progressivity of income tax, the tax wedge in South Africa increases to 20.9% for a single earner at 167% of the average wage. This is still lower than the OECD average at 40.4% or for Brazil and China at 36.3% and 35.2% respectively for the same level of earnings (Table 2.7). Moreover, the average wage in South Africa is particularly high resulting from a highly unequal wage distribution; it is about five times higher than the median wage. The low income tax base is the result of a highly skewed wage income distribution and of a high income threshold for beginning to pay tax (OECD, 2015a). The threshold was equivalent to 36% of average earnings in 2017/18.
The funding of the NHI must be adequate to deliver good quality health services for all citizens. The current cost of private health care in South Africa is high and should not be taken as a benchmark for costing the needs of the NHI (Lorenzoni and Roubal, 2016). However, as the range of benefits and coverage would be extended, public health spending NHI would need to rise. Moreover, not all the current 4.4% of GDP government health spending can be transferred to the NHI fund. The government will continue to finance the development of health facilities and specific programmes. Initial estimate of the NHI financing needs amounted to 6% of GDP that is an additional 2% of GDP of public health spending. A higher estimate of a total substitution of private spending by public spending would amount to 4% of GDP (current private health spending). An estimation of the funding necessary to cover health benefits offered by the NHI is necessary to properly design the funding mechanism of the NHI. There is detailed information on the cost of private health care that could be used to estimate the cost of the NHI package if provided by the private sector. The government should develop a detailed information system to estimate the cost of the NHI reform when delivered by public sector health facilities.
In the current low growth environment, introducing social contributions on payroll for pensions would make hardly possible to increase government tax revenues to finance the NHI. In the white paper, three income sources were considered for NHI financing: value added tax, personal income tax and payroll social security contributions, or a combination of them. Figure 2.23 shows the size of different source of government revenues compared to health spending. Taxes on income, profits and capital gains of individuals and value added taxes are the two primary sources of government revenues while social security contributions are negligible.
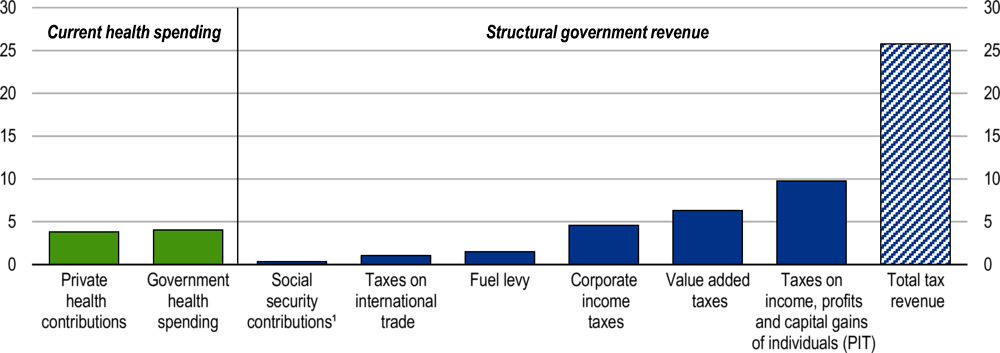
Note: Social security contributions refer to the Skills Development Levy.
Source: National Treasury Budget Review, 2019.
OECD calculations show that the value added tax rate would increase by 4.5 or 9 percentage points from 15% to 19.5% or 24% to match 2% or 4% of GDP in additional revenues respectively (Table 2.8). Such an increase is hardly feasible unless it is phased in progressively and may have VAT evasion effect. Estimation using the total wage bill of workers in the formal sector indicates that an 4% or 8% social security contribution rate on the gross wage would raise the needed additional financing for the NHI. Such payroll social contributions for health have to be compared with actual private contributions to insurance schemes. The gross contribution to insurance schemes per average beneficiary per month was ZAR 1 695 in 2017 (Council for Medical Schemes, 2018). The effective contribution amount per member is higher as members contribute for their relatives. Given the monthly ZAR 3 500 minimum wage and that around half of workers earn below the minimum wage, the government will have to subsidise at least partially low-income workers’ contributions. Also, the government will have to cover non-contributors as the unemployed, retirees, students and all other non-earners for their enrolment in the NHI.
The simulation in Table 2.9 shows the increase in tax rates for the different income brackets if additional 2% or 4% of GDP are raised through personal income tax and the amount is distributed proportionally across the different brackets. It indicates that effective tax rates would increase from 0.8 and 1.5 percentage point for the lowest bracket to 8.6 and 17.3 percentage points for the highest bracket for 2% and 4% of GDP additional tax respectively.
Additional financing the national health insurance of 2% or 4% of GDP is hardly feasible in the current low growth environment. However, increasing the budget of public health spending would allow to improve the delivery of health care in the public sector and level-up public health facilities. A small scale NHI could be considered to put in place the basis for a more ambitious NHI. As the economy recover and trust in government capacity to deliver proper health care increase, a combination of social security contributions, VAT and personal income tax seems appropriate to finance the NHI.
References
Balestra, C. et al. (2018), “Inequalities in emerging economies: Informing the policy dialogue on inclusive growth”, OECD Statistics Working Papers, No. 2018/13, OECD Publishing, Paris, https://dx.doi.org/10.1787/6c0db7fb-en.
Barber, S. et al. (2018), “Harnessing the private health sector by using prices as a policy instrument: Lessons learned from South Africa”, Health Policy, Vol. 122/5, pp. 558-564, https://doi.org/10.1016/J.HEALTHPOL.2018.03.018.
Barr, N. (2012), The economics of the welfare state, Oxford University Press, https://books.google.fr/books/about/Economics_of_the_Welfare_State.html?id=DOg0BM1XiqQC&redir_esc=y (accessed on 23 January 2019).
Bheekie, A. and H. Bradley (2016), “Re-engineering of South Africa’s primary health care system: where is the pharmacist?”, South African Family Practice, Vol. 58/6, pp. 242-248, https://doi.org/10.1080/20786190.2016.1186365.
Budlender, D. (2016), “Increasing the amount of the Child Support Grant”, in South African Child Gauge 2016, Child’s Institute, University of Cape Town, http://www.ci.uct.ac.za/sites/default/files/image_tool/images/367/Child_Gauge/2006/Child_Gauge_2016-increasing_the_amount.pdf (accessed on 18 January 2019).
Budlender, D. and I. Woolard (2006), The impact of the South African child support and old age grants on children’s schooling and work, International Labour Office, Geneva, http://www.ilo.org/ipecinfo/product/download.do?type=document&id=4464.
Coetzee, M. (2013), “Finding the benefits: Estimating the impact of the South African child support grant”, South African Journal of Economics, Vol. 81/3, pp. 427-450, https://onlinelibrary.wiley.com/doi/epdf/10.1111/j.1813-6982.2012.01338.x.
Competition Commission (2018), HEALTH MARKET INQUIRY, http://www.compcom.co.za/wp-content/uploads/2018/07/Health-Market-Inquiry-1.pdf (accessed on 6 February 2019).
Council for Medical Schemes (2018), ANNUAL REPORT: A Healthy Industry for all, https://www.medicalschemes.com/files/Annual%20Reports/CMS_AnnualReport2017-2018.pdf (accessed on 8 February 2019).
Delany, A., P. Proudlock and L. Lake (2016), Social assistance: Investing in children, Children’s Institute, University of Cape Town, http://www.ci.uct.ac.za/sites/default/files/image_tool/images/367/Child_Gauge/2006/Child_Gauge_2016-Policy_Brief_2016_highres_final.pdf (accessed on 18 January 2019).
Department of Health (2015a), Strategy for the prevention and control of obesity in South Africa 2015-2020, https://www.health-e.org.za/wp-content/uploads/2015/12/National-Strategy-for-prevention-and-Control-of-Obesity-4-August-latest.pdf (accessed on 19 February 2019).
Department of Health, R. (2015b), White Paper: National Health Insurance Policy, https://www.mm3admin.co.za/documents/docmanager/f447b607-3c8f-4eb7-8da4-11bca747079f/00124581.pdf (accessed on 6 February 2019).
Department of Labour and UIF (2019), Unemployment Insurance Fund (UIF) Annual Report 2019, Department of Labour, Pretoria, https://www.sassa.gov.za/annual%20reports/Documents/SASSA%20Annual%20Report%202018-2019.pdf (accessed on 30 June 2020)
Department of Labour and UIF (2018), Unemployment Insurance Fund (UIF) Annual Report 2018, Department of Labour, Pretoria, http://www.labour.gov.za/DOL/downloads/documents/annual-reports/unemployment-insurance-fund/2018/uif2018AR.pdf (accessed on 1 February 2019).
Department of Public Service and Administration (2018), Salary scales, with translation keys, for employees on salary levels 1 to 12 and those employees covered by Occupation Specific Dispensations (OSDs), http://www.saou.co.za/wp-content/uploads/2016/04/18_1_p_20_06_2018_Appendices_A.pdf
Department of Social Development (2016a), Comprehensive social security in South Africa Discussion document, https://www.gov.za/sites/default/files/gcis_document/201611/comprehensivesocialsecurityinsouthafricaa.pdf.
Dorfman, M. (2015), “Pension Patterns in Sub-Saharan Africa”, https://openknowledge.worldbank.org/handle/10986/22339 (accessed on 17 January 2019).
DSD, SASSA and UNICEF (2016), Removing barriers to accessing Child Grants: Progress in reducing exclusion from South Africa’s Child Support Grant, UNICEF South Africa, Pretoria, http://www.dsd.gov.za (accessed on 18 January 2019).
DSD, SASSA and UNICEF (2012), The South African Child Support Grant Impact Assessment: Evidence from a survey of children, adolescents and their households, UNICEF South Africa, Pretoria, https://www.unicef.org/southafrica/SAF_resources_csg2012s.pdf (accessed on 14 January 2019).
Eyal, K. and I. Woolard (2011), Female labour force participation and South Africa’s Child Support Grant, http://microdata.worldbank.org/index.php/citations/7189 (accessed on 14 January 2019).
Fall, F. and A. Steenkamp (2020). “Building an Inclusive Social Protection System in South Africa”, OECD Economics Department Working Papers, forthcoming.
Fall, F. (2014), “Comparing the Robustness of PAYG Pension Schemes”, OECD Economics Department Working Papers, No. 1134, OECD Publishing, Paris, https://dx.doi.org/10.1787/5jz158w3ghmx-en.
Fall, F. and D. Bloch (2014), “Overcoming Vulnerabilities of Pension Systems”, OECD Economics Department Working Papers, No. 1133, OECD Publishing, Paris, https://dx.doi.org/10.1787/5jz1591prxth-en.
FSCA (2018), 2018 Annual Report, https://www.fsca.co.za/Annual%20Reports/FSCA%20Annual%20Report%202018.pdf (accessed on 15 January 2019).
Fuchs, A. et al. (2018), “Long-Run Impacts of Increasing Tobacco Taxes Evidence from South Africa”, No. 8369, World Bank, http://econ.worldbank.org. (accessed on 18 February 2019).
GEPF (2018), Annual Report 2018, http://www.gepf.gov.za/uploads/annualReportsUploads/AR_2018_(20181128)_Final_Submitted-min.pdf (accessed on 15 January 2019).
Grinspun, A. (2016), No small change: The multiple impacts of the Child Support Grant on child and adolescent well-being, Children’s Institute, University of Cape Town, http://www.ci.uct.ac.za/sites/default/files/image_tool/images/367/Child_Gauge/2006/Child_Gauge_2016-no_small_change.pdf (accessed on 14 January 2019).
Guven, M. and P. Leite (2016), Benefits and Costs of Social Pensions in Sub-Saharan Africa, World Bank, http://documents.worldbank.org/curated/en/325281469593828257/pdf/107234-WP-add-series-PUBLIC.pdf (accessed on 17 January 2019).
Health System Trust (2018), South African Health Review 2018, http://www.hst.org.za/publications/South%20African%20Health%20Reviews/SAHR%202018.pdf
Inchauste, G. et al. (2014), South Africa Economic Update: Fiscal Policy and Redistribution in an Unequal Society, World Bank Group, Washington DC, http://documents.worldbank.org/curated/en/933231468101334970/pdf/921670WP0P131400SAEU60for0web01029b.pdf (accessed on 11 January 2019).
International Labour Office: Social Protection Department (2015), “Social protection for children:Key policy trends and statistics”, ILO, Geneva, https://www.social-protection.org/gimi/RessourcePDF.action?ressource.ressourceId=51578 (accessed on 16 January 2019).
James, C. et al. (2018), “Health financing and budgeting practices for health in South Africa”, OECD Journal on Budgeting, Vol. 2017/3, https://www.oecd-ilibrary.org/docserver/budget-17-5j8sd88t3sr3.pdf?expires=1549561403&id=id&accname=ocid84004878&checksum=63E3A184A0BB7A8E188F8FA6A0CF0DA1 (accessed on 7 February 2019).
Kruger, H. et al. (2005), “Obesity in South Africa: challenges for government and health professionals”, Public Health Nutrition, Vol. 8/05, pp. 491-500, https://doi.org/10.1079/PHN2005785.
Kumar, A. et al. (2014), “Pricing and competition in Specialist Medical Services: An Overview for South Africa”, OECD Health Working Papers, No. 70, OECD Publishing, Paris, https://dx.doi.org/10.1787/5jz2lpxcrhd5-en.
Leibbrandt, M. et al. (2010), “Trends in South African Income Distribution and Poverty since the Fall of Apartheid”, OECD Social, Employment and Migration Working Papers, No. 101, OECD Publishing, Paris, https://dx.doi.org/10.1787/5kmms0t7p1ms-en.
Lorenzoni, L. and T. Roubal (2016), “International Comparison of South African Private Hospital Price Levels”, OECD Health Working Papers, No. 85, OECD Publishing, Paris, https://dx.doi.org/10.1787/5jrrxrzn24wl-en.
Mash, R. et al. (2016), “Strengthening primary health care through primary care doctors: the design of a new national Postgraduate Diploma in Family Medicine”, South African Family Practice, Vol. 58/1, pp. 32-36, https://doi.org/10.1080/20786190.2015.1083719.
Mcintyre, D. and J. Ataguba (2017), Access to quality health care in South Africa: Is the health sector contributing to addressing the inequality challenge?, https://www.parliament.gov.za/storage/app/media/Pages/2017/october/High_Level_Panel/Commissioned_reports_for_triple_challenges_of_poverty_unemployment_and_inequality/Diagnostic_Report_on_Access_to_Quality_Healthcare.pdf (accessed on 11 February 2019).
National Treasury (2020a), Budget Review 2020, National Treasury, Pretoria, http://www.treasury.gov.za/documents/national%20budget/2019/review/FullBR.pdf (accessed on 20 June 2020).
National Treasury (2020b), Supplementary Budget 2020, National Treasury, Pretoria, http://www.treasury.gov.za/documents/national%20budget/2020S/review/FullSBR.pdf (accessed on 29 June 2020)
National Treasury (2019a), Budget Review 2019, National Treasury, Pretoria, http://www.treasury.gov.za/documents/national%20budget/2019/review/FullBR.pdf (accessed on 25 February 2019).
National Treasury (2019b), Estimates of National Expenditure 2019, National Treasury, Pretoria, http://www.treasury.gov.za/documents/national%20budget/2019/ene/FullENE.pdf (accessed on 25 February 2019).
National Treasury (2018a), Estimates of National Expenditure 2018, National Treasury of the Republic of South Africa, Pretoria, http://www.treasury.gov.za/documents/national%20budget/2018/ene/FullENE.pdf (accessed on 17 January 2019).
National Treasury (2018b), Taxation laws, Amendment bill, National Treasury of the Republic of South Africa, Pretoria, http://www.treasury.gov.za/legislation/bills/2018/[B38-2018]%20(Taxation%20Laws).pdf
National Treasury (2017), Taxation laws, Amendment bill, National Treasury of the Republic of South Africa, Pretoria, http://www.treasury.gov.za/legislation/bills/2017/[B27-2017]%20(Taxation%20Laws).pdf
National Treasury of South Africa (2014), A Review of the Taxation of Alcoholic Beverages in South Africa, A Discussion Document, http://www.treasury.gov.za/public%20comments/Alc/Alcohol%20Tax%20Review%20-%20May%202014%20Discussion%20Paper.pdf (accessed on 18 February 2019).
OECD (2017a), Health at a Glance 2017: OECD Indicators, OECD Publishing, Paris, https://doi.org/10.1787/health_glance-2017-en.
OECD (2017b), Pensions at a Glance 2017: OECD and G20 Indicators, OECD Publishing, Paris, https://dx.doi.org/10.1787/pension_glance-2017-en.
OECD (2016), OECD CORE PRINCIPLES OF PRIVATE PENSION REGULATION, https://www.oecd.org/daf/fin/private-pensions/Core-Principles-Private-Pension-Regulation.pdf (accessed on 30 January 2019).
OECD (2015), OECD Economic Surveys: South Africa 2015, OECD Publishing, Paris, https://dx.doi.org/10.1787/eco_surveys-zaf-2015-en.
OECD (2014a), OECD Pensions Outlook 2014, OECD Publishing, Paris, https://dx.doi.org/10.1787/9789264222687-en.
OECD (2014b), OECD Reviews of Health Care Quality: Czech Republic 2014: Raising Standards, OECD Reviews of Health Care Quality, OECD Publishing, Paris, https://doi.org/10.1787/9789264208605-en.
Pension Watch (2019), What and where? | Social pensions database | Pension watch, http://www.pension-watch.net/social-pensions-database/social-pensions-around-the-world/ (accessed on 17 January 2019).
Ralston, M. et al. (2015), “Who Benefits--Or Does not--From South Africa’s Old Age Pension? Evidence from Characteristics of Rural Pensioners and Non-Pensioners.”, International journal of environmental research and public health, Vol. 13/1, p. 85, https://doi.org/10.3390/ijerph13010085.
Ranchod, S. et al. (2017), “South Africa’s hospital sector: old divisions and new developments”, in South Africa Health Review, http://www.hst.org.za/publications/South%20African%20Health%20Reviews/10_South%20Africas%20hospital%20sector_old%20divisions%20and%20new%20developments.pdf (accessed on 13 February 2019).
Samson, M. et al. (2008), Quantitative Analysis of the Impact of the Child Support Grant, UNICEF, Cape Town, https://www.unicef.org/southafrica/SAF_resources_qachildsupport.pdf (accessed on 14 January 2019).
SARS (2017), Unemployment Insurance Fund, http://www.sars.gov.za/TaxTypes/UIF/Pages/default.aspx (accessed on 30 January 2019).
SASSA (2019), South African Social Security Agency: Annual Report 2018/19, http://www.sassa.gov.za/index.php/knowledge-centre/annual-reports.
SASSA (2018), South African Social Security Agency: Annual Report 2017/18, http://www.sassa.gov.za/index.php/knowledge-centre/annual-reports.
Stacey, N. et al. (2018), “Simulating the impact of excise taxation for disease prevention in low-income and middle-income countries: an application to South Africa”, BMJ Global Health, Vol. 3/1, p. e000568, https://doi.org/10.1136/bmjgh-2017-000568.
Statistics South Africa (2018a), General Household Survey 2017, Statistics South Africa, Pretoria, http://www.statssa.gov.za/publications/P0318/P03182017.pdf (accessed on 10 January 2019).
Statistics South Africa (2018c), Quarterly Labour Force Survey: Quarter 3 2018, Statistics South Africa, Pretoria, http://[email protected] (accessed on 18 January 2019).
Strijdom, J., O. Diop and T. Westphal (2016), Older person’s grant: South Africa, ILO Social Protection Department, Geneva, https://www.social-protection.org/gimi/RessourcePDF.action?ressource.ressourceId=53790
Taylor Vivienne (2002), Report of the Committee of Inquiry into a Comprehensive System of Social Security for South Africa, http://www.cdhaarmann.com/Publications/Taylor%20report.pdf (accessed on 22 January 2019).
Unemployment Insurance Fund (2018), Annual Performance Plan, Unemployment Insurance Fund (UIF), Pretoria, http://pmg-assets.s3-website-eu-west-1.amazonaws.com/UIF_MTEF_AND_ANNUAL_PERFORMANCE_PLAN_2018_-_19_Edited__Corrected.pdf (accessed on 30 January 2019).
Van Biljon, C. (2017), The effect of old age pensions on child deprivation: revisiting the role of gender The effect of old age pensions on child deprivation: revisiting the role of gender The effect of old age pensions on child deprivation: revisiting the role of gender Chloé van Biljon, University of Stellenbosch, Stellenbosch, http://www.ekon.sun.ac.za/wpapers/2017/wp132017http://resep.sun.ac.zawww.ekon.sun.ac.za/wpaper.
Van Walbeek, C. (2002), “Recent trends in smoking prevalence in South Africa: Some evidence from AMPS data”, South African medical journal, Vol. 92 (6), pp. 468–72, https://www.researchgate.net/publication/11236719.
Woolard, I. and M. Leibbrandt (2010), “The Evolution and Impact of Unconditional Cash Transfers in South Africa. A Southern Africa Labour and Development Research Unit Working Paper Number 51”, A Southern Africa Labour and Development Research Unit Working Paper Number 51, No. 51, SALDRU, University of Cape Town, http://www.saldru.uct.ac.za.
Woolard, I. et al. (2015), How much is inequality reduced by progressive taxation and government spending?, http://www.econ3x3.org/sites/default/files/articles/Woolard%20et%20al%20%202015%20Fiscal%20policy%20progressivity%20FINAL4_0.pdf (accessed on 14 January 2019).
World Bank (2018a), South Africa Poverty and Inequality Assessment 2018. Overcoming Poverty and Inequality in South Africa: Drivers, Constraints and Opportunities, World Bank, Washington DC, http://documents.worldbank.org/curated/en/530481521735906534/pdf/124521-REV-OUO-South-Africa-Poverty-and-Inequality-Assessment-Report-2018-FINAL-WEB.pdf
World Bank (2018b), The State of Social Safety Nets 2018, https://doi.org/10.1596/978-1-4648-1254-5.
Zembe-Mkabile, W. et al. (2015), “The experience of cash transfers in alleviating childhood poverty in South Africa: Mothers’ experiences of the Child Support Grant”, Global Public Health, Vol. 10/7, pp. 834-851, https://doi.org/10.1080/17441692.2015.1007471.
This document, as well as any data and map included herein, are without prejudice to the status of or sovereignty over any territory, to the delimitation of international frontiers and boundaries and to the name of any territory, city or area. Extracts from publications may be subject to additional disclaimers, which are set out in the complete version of the publication, available at the link provided.
https://doi.org/10.1787/530e7ce0-en
© OECD 2020
The use of this work, whether digital or print, is governed by the Terms and Conditions to be found at http://www.oecd.org/termsandconditions.