
6. Technology for reducing and managing losses and damages
Technology is essential for effective risk governance, especially for the complex and potentially systemic hazards stemming from climate change. An understanding of the risks and current and future impacts of climate change is needed before developing and implementing approaches to reduce and manage the associated risks of losses and damages. Observation and modelling of the climate system and forecasting capabilities can inform the characterisation of risks. Technologies will provide the underpinning for evaluating risks, as well as developing approaches to reduce and manage those risks. As risks are always evolving, an iterative process of monitoring, evaluation and learning can inform both understanding and management of the risks over time.
Technologies are fundamental to reducing and managing the risks of losses and damages from climate change. When decisions are made under uncertainty, a risk governance process must facilitate continuous monitoring, evaluation and learning. Such iterative processes can be guided by i) clear characterisation and ii) evaluation of the risks, complemented by iii) development and implementation of approaches to reduce and manage the risks. Technology is vital for each of the three components of risk governance. This chapter highlights some such technologies without trying to be comprehensive.
Technology for characterisation of the risks
Understanding climate variability and change is a complex scientific challenge. Development in technologies such as space observation equipment, high computing power, mapping software and telecommunication systems has provided tools essential for improving understanding of the climate system and characterising the risks. Inclusive stakeholder engagement – including Indigenous and local knowledge – can complement scientific knowledge on the drivers of risks that data observations may miss. Globally, such collaboration can facilitate the sharing of data, information and modelling capacities that may not be available to individual countries.
Weather and climate information services (WCIS) are essential for identifying and assessing options for reducing and managing the risks of losses and damages, and for monitoring their performance. Early and sustained engagement with different users of the services can help ensure that data and information are decision-relevant. Improved data assimilation, such as deterministic forecasts of cyclone trajectories, can play a vital role in improving decision making. There is, however, a significant gap in the WCIS in many Least Developed Countries (LDCs) and Small Islands Developing States (SIDS). Furthermore, while weather services are well established, those to inform actions on longer timescales are less common, despite major progress in recent years. Continued improvements in provider-user engagement and the way in which information is conveyed are needed to ensure that such climate services are demand-driven and are both usable and useful.
Understanding exposure and vulnerability to climate-related hazards requires granular socio-economic data and an understanding of how risks impact on people’s livelihoods, health and their communities at large. Much of these data may not be easily quantifiable. In evaluating exposure to climate-related hazards, technologies are needed to facilitate the provision of high-resolution data on the characteristics of the natural and built environments. Geospatial technology and data products can provide insights on the overlaps of hazard, exposure and vulnerability. Such products provide improved granularity and relevance of risk assessments for specific locations and socio-economic groups over time. Surveys and predictive analytics (e.g. modelling, machine learning and data mining) coupled with the use of social media can also provide valuable information about the diversity and intensity of risk perceptions, concerns and potential impacts.
Technology for evaluation of the risks
Information from risk characterisation can inform the evaluation of the risks, allowing decision makers to identify actions in reducing and managing emerging risks. For example, WMO Global Producing Centres for Annual to Decadal Climate Predictions draw on scientific expertise and computer modelling from world-leading climate centres to produce actionable information for decision makers.
Technologies for monitoring and modelling the climate system will also be essential for characterising how hazards may evolve over time and space. This can inform early warning systems and contribute to an understanding of the multiple, and potentially cascading, impacts of climate change. This will be particularly important in the face of emerging hazards should one or more climate tipping points be triggered. Evaluation of risk tolerance on different timescales will be challenging, going far beyond evaluation of individual climate-related disasters familiar in the current climate.
Technology for development, implementation and evaluation of approaches to reduce and manage the risks
Decisions on which risks to address, how, to what extent and when will be political or personal. However, implementation of those choices may sometimes depend on availability of technologies and technological capacity (e.g. infrastructure or skills). For example, to limit the creation of hazards, deep and rapid reductions in greenhouse gases are required. Low-emissions pathways must scale up the use of low-carbon technologies and redesign systems to limit the growth in energy and materials demand. This will avoid risky reliance on technologies to remove carbon dioxide from the atmosphere later this century. Such technologies might put at risk other goals (food security, reversing biodiversity loss). Technologies for limiting exposure and reducing vulnerability to climate-related hazards include early warning for climate hazards, among others. Such systems must consider a range of timescales and potential hazards. These include slow-onset changes, extreme events and the potential triggering of climate tipping points, even at levels of warming likely this century.
Technologies also underpin innovations that can reduce losses and damages in the event of a disaster. For example, they can accelerate financial payments to help individuals, communities and countries to recover through parametric insurance. In addition, blockchain technologies have the potential to reduce costs of remittances.
The availability of technologies will in many cases rely on local, regional, and international co-operation to address diffusion challenges and capacity constraints. Closer co-operation across countries, regions and at the global level on major investments such as high-performance computers, satellites and state-of-the-art modelling and forecasting capabilities is particularly important. International support is also important in addressing capacity constraints (financial, technical and organisational) and in supporting technology development and innovation in many developing countries. Partnerships and international initiatives can support the collection and sharing of observational data, climate monitoring and modelling and weather forecasting needs. Local community inclusion is needed in the decision making process to understand local context and capacity for improved technology diffusion.
The identification and effective implementation of approaches to reduce and manage the risks of losses and damages from climate change relies on different types of input. This includes local and Indigenous knowledge, data and information from natural and social sciences, and a diverse stakeholder engagement process. Chapter 4 highlighted the need for risk governance processes that recognise the importance of, and include, mechanisms that facilitate continuous, monitoring, evaluation and learning when decisions are made under uncertainty (Klinke and Renn, 2012[1]), such as climate change. This process can either be informed by lessons learned from the management of previous or similar risks, or by drawing on emerging understanding of the risks and related technologies as they become available. Such iterative processes to managing risk can be guided by three closely linked components:
These components are closely aligned with the National Adaptation Plan process established by the United Nations Framework Convention on Climate Change (UNFCCC). The process highlights the important steps of first acquiring information, then reviewing preparatory elements for planning design, before developing long-term implementation strategies (UNFCCC, 2012[2]). Each component is supplemented by a number of cross-cutting elements, including transparent and inclusive communication and accounting for the societal context.
The management of risk governance should be guided by a transparent and inclusive process that facilitates the engagement of different perspectives to understand the risks (Schweizer and Renn, 2019[3]; IRGC, 2017[4]). Decision making must consider the broader social, institutional, political and economic contexts. The organisational capacity of key actors – government, businesses and individuals – affects levels of risk tolerance and trust in the process. Therefore, decision making must recognise the capability of key actors within the risk governance framework to fulfil their roles (IRGC, 2017[4]).
This chapter discusses the role of technology in relation to the three components of the risk governance process. It recognises that technology is only one determining factor that guides the process. The chapter also highlights how technologies can support cross-cutting aspects of governance, such as stakeholder engagement and communication. In this context, technology refers to both a physical piece of equipment (such as a satellite) and more broadly a technique, practical knowledge or skill needed to support a particular activity (Boldt et al., 2012[5]).
The rest of this chapter is structured around the three components of the risk governance process summarised above. Section 6.2.1 explores the role technology can play in informing the characterisation of risks. Section 6.2.2 focuses on the role of technology in evaluation of risks and subsequent decision-making processes that determine what risks are addressed, how, when and to what extent. Section 6.2.3 then examines the role of technology in the development, implementation and evaluation of approaches to reduce and manage the risks. Section 6.2.4 reviews important criteria for creating an enabling environment for technology diffusion. Table 6.1 summarises key issues and highlights considerations when exploring the role of technology in Small Island Developing States (SIDS) and Least Developed Countries (LDCs).
This section examines the three components of the risk governance approach summarised in Section 6.1. For each component, it highlights the role technology can play in supporting these risk governance approaches. The application of technology will be most effective when complemented with transparent communication, ongoing engagement with stakeholders and capacity development.
6.2.1. Technology for characterising the risks of losses and damages
Understanding the climate, let alone climate variability and change, is a complex scientific challenge (see discussion in Chapter 2). Improving understanding of the atmosphere and its interdependencies with the other components of the climate system can help prepare for, manage and reduce risk effectively. Development in technologies, such as space observation equipment, high computing power, mapping software and telecommunication systems, has provided tools essential to improve understanding of the climate system, and to advance observational data collection and climate modelling. Such technological developments have been fundamental to understanding the nature of climate change and climate-related hazards. They will continue to underpin further improvements in understanding and responses. Large volumes of data generated by Earth observation technologies, such as satellites and remote sensing, have become increasingly available and are growing exponentially (Reichstein et al., 2019[7]).
Engagement with stakeholders can help policy makers learn about their risk perspectives and how climate-related hazards adversely impact their livelihoods. This will contribute to a comprehensive analysis that will inform the characterisation of the risks for a given location or community. Such analysis reveals how those hazards play out in the socio-economic context with the aim of informing decision-making processes on whether and how to reduce and manage resulting risks. As set out in Chapter 1, climate risk is a function of hazard, the exposure of people and assets to the hazard, and their vulnerability to that particular hazard. This section discusses how technology can support such assessments, exploring in turn hazards, exposure and vulnerability.
Hazard assessment
Hazard assessment is the process of identifying hazards and evaluating their risk. Hazard data constitutes the input needed to make estimates about the magnitude and frequency of meteorological events. The weather and climate information services (WCIS) value chain (Figure 6.1. ) must deliver high-quality knowledge for accurate information on trends and projections. This section highlights some prominent elements of this process without attempting to be comprehensive.

Source: Adapted from (WMO, 2015[8]; CIF, 2020[9]).
WCIS are critical to decision making (Allis et al., 2019[10]), providing the necessary information on past, present and future states of the atmosphere across different timescales. They provide the information needed for assessing the potential impacts of hazards for a particular geographic area. Aspects of the underpinning infrastructure include data gathering instruments; systems to collect, preserve and manage data; and processes for developing and delivering weather and climate services. Research suggests that weather services are well established, but climate services to inform actions on longer timescales are less so, despite major progress in recent years (Hewitt et al., 2020[11]). This has contributed to calls for the continued need to improve provider-user engagement and ensure information is both usable and useful for end-users.
WCIS can improve understanding of weather and climate hazards, enabling government, businesses, and individuals to better anticipate and implement actions to reduce and manage risks. For instance, data on tides, wind and atmospheric pressure interacting with coastal features can improve understanding of hurricane and flooding hazards (Alley, Emanuel and Zhang, 2019[12]). Millions of people already live in flood-prone basins across the globe. Improved weather forecasting can help track the scale and intensity of the hazard events to lessen the harm, and potential losses and damages to people in such exposed areas (Zhang and Weng, 2015[13]).
Components of the WCIS value chain comprise diverse sets of stakeholders and service platforms. They include activities in meteorological and hydrological observation stations; data and information management and research; forecasting and modelling products; and service development and dissemination (WMO, 2015[8]). Each component generates value, connecting production of services to stakeholders’ decision-making processes. Reliability and accuracy of weather observations will only be beneficial if systems can translate them into information that can inform decisions-making processes (WMO, 2020[14]). Therefore, continued investments in the WCIS value chain are necessary to ensure reliability and delivery of weather and climate information products. Such products must remain relevant, accessible and credible to a wide audience of decision makers, clients and communities (WMO and GFCS, 2019[15]).
Observation and monitoring
At the most fundamental level, a network of weather stations provides direct measurements of key meteorological variables at a sufficiently granular level. This is critical for establishing reliable time series to climatic variability and change, including the frequency and occurrence of extreme events, and for calibrating models and the outputs of remote sensing instruments. However, the current network is sparse, particularly in developing countries. For example, air temperature is a key variable to assess climate change. However, observations of air temperature are only available from a limited number of weather stations distributed mainly in developed countries (WMO, 2015[8]). Furthermore, observations – particularly in developing countries – often have gaps in time and space, reporting time series with missing variables. Satellites, conversely, can measure temperature from land surface more continuously. In this way, they can develop a dataset in which air temperature is predicted from land surface temperature (Hooker, Duveiller and Cescatti, 2018[16]).
A range of technologies beyond standard meteorological instruments can inform a better understanding of climate-related hazards (UNCTAD, 2021[17]). For example, precipitation measurements are vital input for hydrological and ecological models. Gauge observations can measure precipitation at the Earth’s surface. However, they can be incomplete in aerial coverage because of limitations of surface stations (see Chapter 2 and Box 6.3). To improve accuracy, gauge observations can be combined with satellite observations, for example, which are more spatially homogenous (Sun et al., 2018[18]). Data from air- and seaborne sensors and space satellites also provide a wealth of information that can shed light on changes, such as to Arctic sea ice. Many of these instruments can provide nearly real-time data to monitor the atmosphere, oceans and land surface, including the effects of climate variability and change.
Earth observations from satellites play an important role as a global tool for forecasting weather and observing climate change. Observations of climate rely on a complementary mix of satellites and surface-based measurements to provide the needed coverage. The ability of satellites to monitor the environment from space can support developing countries that may lack their own monitoring capacity. For instance, the World Meteorological Organization (WMO) Global Observing System (GOS) encompasses both surface- and space-based observations, essential for enhancing understanding the Earth system and facilitating production of WCIS. Satellite data from the WMO GOS provide 90% of the data for Global Numerical Weather Prediction, which underpins most Earth system modelling approaches (ITU, 2020[19]).
Wireless sensor networks (WSNs) are sensor nodes that can collect real-time data on the surrounding environment, such as temperature, water pressure and smoke-impacted geographical areas (ADB/OECD, 2020[20]). With the Internet of things (IoT),1 for example, WSNs can be deployed in urban environments to detect and measure levels of greenhouse gas (GHG) emissions and air pollution, which can then be used for environmental monitoring (Khan, Gupta and Gupta, 2020[21]). In the agricultural sector, they can monitor water quality or soil moisture (ITU, 2016[22]). For example, in Rwanda, tea plantations are distressed from drought, flooding, soil erosion, pests and diseases. WSNs provide tea farmers with a cost-effective alternative, compared to expensive space technologies, to monitor soil conditions (e.g. humidity, acidity) and the surrounding environment. These WSNs are powered through solar panels and the data are transmitted wirelessly (ITU, 2016[22]).
Data and information management
The different data collected on the Earth system come from various sources and can range in time and spatial scales, data type and physical processes. With the plethora of data available, there is ample opportunity to advance scientific discovery. As such, the management of data is essential to research, forecasting and climate modelling. Data management from various centres all bear responsibilities for the stewardship of data to serve the GOS for the climate (WMO, 2015[23]). These include international data centres, national centres, real-time monitoring centres, delayed-mode analysis centres and reanalysis centres. Improved climate monitoring depends on better data management capacity (i.e. tools, methods and infrastructure). Improved capacity would support the storage and exchange of data, allowing the regular flow of data to the user community, monitoring of data streams and provision of long-term preservation of data for future use (WMO, 2015[23]). Box 6.1 discusses the importance of National Meteorological and Hydrological Services (NMHSs) in this context.
National Meteorological Hydrological Services (NMHSs) are the primary source of weather, water and climate data and information in many countries. Their mandate often includes design, operation and maintenance of national observation, monitoring, modelling and forecasting systems. Further, it entails data processing, management, exchange and dissemination of related products (OECD, 2021[24]).
Hydro-meteorological information plays a significant role in supporting different stakeholders affected by climate risks (e.g. agriculture, energy, transport, health and water). NMHSs can, for example, support early warnings and land-use planning. With increasing demand for NMHSs, the need for additional investments is rising. Such investment is needed, for example, to obtain comprehensive and high-quality observation network, efficient data collection and management, state-of-the-art computing facilities, sophisticated data-analysis schemes, improved research and efficient dissemination (WMO, 2015[8]).
NMHSs are publicly funded entities. Having to compete for state budgets, NMHSs in many developing countries are often relatively poorly resourced. This adversely affects technological and human capacity (both in terms of the number of staff and their technical skills to maintain equipment and process data and information) (OECD, 2021[24]). While there are various ways to strengthen processes of NMHSs, depending on the regional or country context, recommendations include the following (Hewitt et al., 2020[11]; Bruno Soares, Daly and Dessai, 2018[25]; WMO, 2015[8]):
Improve collaboration with sectoral partners and key stakeholders to coproduce tailored services on impacts, risks and strategies. International collaboration can inform knowledge sharing to countries that may face similar climate challenges.
Develop a portfolio of funding from diverse investors to support necessary resources and scientific and technical developments. This will require co-ordination and working closely with donors and development banks to avoid fragmented implementation.
Support LDCs with better access to climate models, observational data and advanced computational power, enabling their NMHSs to provide better forecasts at the granularity needed for informed decision-making approaches.
Create better communication strategies to show the benefits of NMHSs. This can justify public expenditure for secured and sustained public investments through, for example, valuation studies to show potential returns on investments.
Advanced data assimilation techniques and computing resources permit assimilation of large, high-resolution observations of environmental flows from remotely sensed sources on the ground. These flows can then be analysed and forecasted in climate models (Zhang and Weng, 2015[13]). Consistently and continually running models over time with diverse observations has revolutionised predictions of hazard events. There are now more timely and accurate weather forecasts in hazards, including hurricanes, blizzards and flash floods (Alley, Emanuel and Zhang, 2019[12]). A hurricane, for instance, is a large-scale event. However, it depends strongly on smaller-scale processes that are nonlinear and harder to observe and predict. The assimilation of high-resolution, remote sensing observations of the characteristics of the hurricane’s structure provide a more realistic vortex in modelling for improved deterministic forecasts (Zhang and Weng, 2015[13]). Another example is the assimilation of high-resolution radar reflectivity of cloud properties obtained from remote sensing data. These data combined with satellite data improve modelling of forecasts for catching early developments of storm events (Jones et al., 2015[26]).
Supporting the provision and application of climate services, data management tools can help countries with less advanced technological and digital capacities. Such tools include open source and cloud-based systems for data collection, storage, processing and forecasting. Only 3 of 28 major modelling groups contributing to the international climate modelling inter-comparison project (CMIP6) are from developing countries: the People’s Republic of China (hereafter “China”), India and Thailand (CIF, 2020[9]). Access to open source databases will not require license extensions going forward, which makes it easier to systematically access data and information to feed as inputs into models. This is especially beneficial for researchers and government institutions in LDCs and SIDS that may have limited institutional and technical capacity to collect and model data. Despite the enthusiasm for open source data in developing countries, ownership, co-authorship and location of data holdings might raise propriety concerns (Brönnimann et al., 2018[27]).
Several of these databases and platforms are available to researchers and decision makers. The European Space Agency’s Earth Observation for Sustainable Development, for example, provides a large database of open access Earth observation data. It also provides users with access to a library of tools and software resources to visualise, analyse and process observational data (ESA, n.d.[28]). The Copernicus Climate Change Service (C3S) is a regional and global resource that offers open access to climate data and tools, such as Application Programming Interface (API) reference library and tutorials for various applications (Copernicus, n.d.[29]). The Oasis Loss Modelling offers open-source catastrophe modelling that unites multinational public-private-partnerships from insurers, reinsurers, businesses and weather modellers to make insurance modelling more accessible and transparent to the public. The platform is designed for developing countries to provide insights to modelling and improve interoperability (Oasis, 2021[30]).
Climate research, forecasting and modelling
To understand important features of the Earth’s climate quantitatively, physical theories and observations must be turned into models to represent key features and interactions. The sheer complexity of the system means that some fundamental dynamics need to be approximated and biases corrected. In addition, the spatial and temporal scales of the chosen model must be in line with the capacities of the computer, which may be constrained. Some key processes on smaller scales than the model resolves (such as cloud formation) therefore need to be described by estimated parameters rather than by explicit calculation. These features may affect important aspects of model behaviour, resulting in widely differing projections for some climate phenomena in some regions (Shepherd, 2014[31]; Bony et al., 2015[32]).
Understanding the uncertainties arising from the availability of observational data (Chapter 2) can help improve performance of climate models. Advances in machine-learning approaches can identify model uncertainties and provide key insights of spatial-temporal features from very large, evolving and complex datasets of the Earth’s variables. Uncertainties related to seasonal or inter-annual variations, which can vary considerably by region and over time (see Chapter 2), are one challenge for climate models. Machine-learning techniques, such as artificial neural network, can filter out the noise in data and predict seasonal variations. For example, such techniques may be able to extract patterns of respiration in the spring due to root growth, leaf expansion and high soil moisture. Such features were formerly not well represented in carbon cycle models (Papale and Valentini, 2003[33]).
Deep learning, a machine-learning approach, can be used to extract features and insights from large and complex datasets to classify, identify and predict weather patterns from spatial and temporal details (Reichstein et al., 2019[7]). For example, it can be used to detect hurricanes by extracting spatial features based on their characteristics (e.g. pressure levels, spatial shapes, spiral flows) to define and classify the type of extreme event (Liu et al., 2016[34]). Accurate characterisation of extreme events in climate simulations and observational data archives is important to understanding trends to detecting extreme events across geographic scale (Reichstein et al., 2019[7]). Deep learning has also been applied to modelling short-term regional sea-level variability by exploiting key ocean temperature estimates. This can provide a promising tool for anticipating sea-level changes for near-term decision-making processes (Nieves, Radin and Camps-Valls, 2021[35]).
Building data science capacity, along with theory-based knowledge, is a necessary skill to handle and interpret observational data. While machine-learning applications present opportunities, they could be limited due to a number of challenges. These include interpretability; dynamic and changing physical variables over time; and uncertainty and complexity of observational data. For example, deep-learning approaches can be accurate when applied to modelling. However, predictions are only as good as the quality of observational data provided to the algorithm (UNCTAD, 2021[17]; Reichstein et al., 2019[7]). The training dataset that is used to train an algorithm to predict an outcome can be derived from observations that are not a true representation of the model, especially if the training set is small (Karpatne et al., 2017[36]). If there is bias in the training dataset, machine-learning models may end up replicating those biases. Furthermore, due to changing climate dynamics and physical processes, long-term predictions may be implausible (Karpatne et al., 2017[36]). New approaches to analyse scientific datasets combining theory-driven knowledge, physical modelling and algorithms that can learn from biased labels, will be key to extracting value from observational datasets of the Earth system (Bergen et al., 2019[37]).
Developing climate models is resource-intensive, requiring multiple actors to develop and make available critical data and information. The WMO Global Data-processing and Forecasting System has several integral components. The WMO, for example, has designated Global Producing Centres for Long-Range Forecasts (GPCLRFs) across the globe (WMO, n.d.[38]). These centres support WMO Regional Climate Centres (RCCs), as well as NMHSs. For example, the European Centre for Medium-Range Weather Forecasts provides global forecasts and climate analysis and datasets that can support different users’ needs. These data can be complemented by the Global Producing Centres for Annual to Decadal Climate Predictions that. These centres draw on expertise from renowned climate scientists and recent computer modelling from world-leading climate centres to produce updates on actionable information for decision makers across the globe (WMO, 2020[39]). The RCCs organise Regional Climate Outlook Forums to achieve consensus – from national, regional, and international climate experts – on relevant climate outlook products, such as regional climate outlooks. These forums support co-ordinating operations for seasonal forecasts and tailored products to support country-level service delivery by NMHSs. They ensure consistency in the access to, and interpretation of climate information (WMO, n.d.[40]).
Service development and delivery
Effective WCIS can help decision makers reduce and manage the risks of losses and damages. Society has yet to benefit optimally from the available WCIS for better informed decisions (Hewitt et al., 2020[11]). WCIS are most useful when tailored to the needs of decision makers and society, and deliver relevant, accessible and credible information (WMO and GFCS, 2019[15]). However, it is hard to identify users and determine how to engage with them, which makes active and rigorous user engagement difficult (Hewitt et al., 2020[11]). Reducing vulnerability and exposure of lives and livelihoods to weather and climate hazards requires a good understanding of the socio-economic context. As such, fostering interdisciplinary teams of researchers, communication specialists and social scientists that bring different expertise can deliver WCIS appropriate for specific institutions and sectors. This can bring value to service development and delivery by accounting for diverse social structures, behaviours and contexts, while considering the technical capabilities of users (Shove, 2010[41]).
Investments in human skills can promote understanding of climate processes. This investment can manifest through education, training and mentoring in multidisciplinary topics such as science, data analytics and artificial intelligence. Climate science and information tend to produce outputs that are complex to interpret. Non-scientists may lack both the technical capacity to interpret outputs and the predictive skills to support decision making (Bruno Soares, Daly and Dessai, 2018[25]). The capacity to manage climate-related risks for relevant countries and sectors will require improved climate literacy, access to climate information and the capacity to interpret WCIS. Exploiting such capacities could then help improve climate-smart decision making, modelling and risk management options (WMO, 2015[8]).
Capacity constraints for characterising the risks of losses and damages from climate change
WCIS can be an effective tool for climate risk governance for several reasons. First, it can help protect lives by, for example, supporting early warning systems (EWS). It can also enable anticipatory and preventive action to reduce and manage losses and damages (Hallegatte, 2012[42]). However, a significant gap in WCIS exists in LDCs and SIDS, which are also the most vulnerable to the impacts of climate variability and change (WMO, 2020[14]). Space technologies and in-situ instruments can be very costly for many LDCs and SIDS. Moreover, many lack the supporting infrastructure, governance and digital capacity to implement and operationalise observation and monitoring equipment. For example, countries in sub-Saharan Africa lack access to stable electricity and basic telecommunication network coverage. In such situations, simpler resources may prove more cost effective (ITU, 2016[22]). Section 6.2.4 discusses in further detail the challenges of technology dissemination.
Global partnerships and international collaboration are key to exchanging and helping obtain high-quality observational data for countries with limited domestic capacity. Blending data from the national observation network with satellite and climate reanalysis, and elevation maps, can enhance availability of data. For example, this process helped produce spatially complete time series of 30 years of rainfall and 50 years of temperature at a 4-km grid across Africa. These time series significantly improved the characterisation of climate risk information at local scales (Dinku et al., 2017[43]).
Artificial intelligence can support efforts to blend data from different sources (Gil et al., 2018[44]). The International Research Institute for Climate and Society initiated the Enhancing National Climate Services initiative to help African countries improve the gaps and quality of observational data. This could then improve time series data. Box 6.2 lists similar initiatives that both support data production and help build knowledge of climate risks through various risk assessment tools.
Notwithstanding, local-level data availability remains a challenge. Understanding local-level impacts is especially critical as communities may be facing a rise in different types of climate-related hazards occurring one after the other (e.g. heavy floods followed by droughts) (Mohanty, 2020[45]). Scarcity of local-level risk data prevents localised risk assessments, which hinders informed planning and strategies to reduce the scale of losses and damages. Datasets of climate variables from organisations such as the World Bank, European Centre, National Oceanic and Atmospheric Administration and NatCatService are most often available in meta or spatial format. This format is complex, requiring technical skills in data analysis or use of geospatial software to inform risk assessments. Mohanty (2020[45]) describes a methodology used in India for creating micro-level gridded hazard data, or a climate risk atlas. This can identify risk at high resolution to enhance preparedness and enable effective climate policies. Decadal analysis using micro-level hazard mapping can inform the compounded impacts that occur in specific local regions and reveal any shifts in microclimate zones.
Several platforms address the challenges of building capacity for quantitative risk assessments at the regional and country level. Such platforms can empower decision makers through improved understanding of the climate risks and approaches to manage them (GFDRR, 2016[46]). Examples include:
The Integrated Database for African Policymakers (IDAPs) cumulates relevant datasets related to climate, crops, hydrology and livelihoods on a cloud-based platform. The information translates hazard scenarios to the projected impact on people’s livelihoods in a format that is easy for non-specialists to understand (Cornforth, Petty and Walker, 2021[47]). IDAPs allows local decision makers to create and explore their own scenarios in adaptation planning.
The Netherlands Red Cross 510 offers digital risk assessment tools and impact-based forecasting that predicts impending disasters that may affect vulnerable communities to implement anticipatory action plans (Red Cross 510, 2021[48]).
Pacific Catastrophe Risk Assessment and Financing Initiative (PCRAFI) programme provides disaster risk assessment tools to help understand, model and assess risk for 15 Pacific Island countries with information available for regional assessments. PCRAFI collects, processes and develops georeferenced data of hazards and socio-economic information for risk modelling. The data are stored and accessible through the Pacific Risk Information System (PCRAFI, n.d.[49]).
Central American Probabilistic Risk Assessment provides tools to Central American government institutions, academics and practitioners for strengthened capacity in assessing, understanding and communicating disaster risk. The platform provides specialised software applications, consultancy, advisory services and training to support risk management and risk financing strategies (CAPRA, n.d.[50]).
World Bank Urban Risk Assessment provides a flexible approach for city managers to identify cost-effective measures to assess a city’s risks. The project focuses hazard impacts assessments, institutional assessments and socio-economic assessments (Dickson et al., 2012[51]).
Lack of hydro-meteorological observations can have implications at regional and global scales. Global efforts, such as the WMO’s Global Framework of Climate Services, aims to address and reduce the data gaps in LDCs and SIDS. However, they can also have positive benefits for the rest of the world. As part of this initiative, the Indian Meteorological Department has shared its weather prediction technology and advisory service with many vulnerable countries that lack hydro-meteorological services (Biswas, 2016[52]). The Alliance for Hydromet Development has also successfully united international development, humanitarian agencies and finance institutions to improve weather, climate and related environmental information services. The Alliance’s partnership with numerous institutions, such as the Climate Investment Funds, Adaptation Fund, Asian Development Bank and Green Climate Fund, share approaches to co-ordinate and design investments to support vulnerable countries. Their collaboration and diagnostic tools help support the operating environment of NMHSs by improving capacity, developing high-quality weather forecasts, EWS and climate information (Alliance, 2021[53]). The Alliance also supports the WMO’s Systematic Observations Financial Facility to help countries generate observational data critical for improved weather forecasts and climate services (see Box 6.3).
Gaps in global surface-based data-sharing reduce the accuracy of weather forecasting and climate analysis from the local level to global levels. Small Island Developing States (SIDS) and Least Developed Countries (LDCs) lack the capacity to operate and maintain observation infrastructures. Improved quality of weather forecasts from LDCs and SIDS will improve medium- to long-range forecasts globally; and inform better informed climate action in those countries.
The Global Basic Observing Network (GBON) established by the World Meteorological Organization (WMO) requires WMO members to collect and share internationally surface-based observational data with a minimum level of spatial resolutions and time frequency. A fully implemented GBON in SIDS and LDCs requires around 2 300 functioning network of surface-based stations. In order to meet this requirement, 2 000 observations stations will need to be rehabilitated or installed. Furthermore, strengthened capacity coupled with substantial and continued investments will be needed to help operate and maintain weather and climate services.
The WMO created the Systematic Observations Financial Facility (SOFF) to help close the capacity gap on high-quality weather forecasts and climate services. It will provide long-term financing and technical assistance to help vulnerable countries meet internationally agreed metrics required by GBON. In its first five years, SOFF aims to help 68 SIDS and LDCs become GBON-compliant and access improved weather and climate information. Ultimately, this will scale up 10 times more observations generated from upper air stations and 20 times more data from weather stations to be shared globally. Improved observations from across the globe will benefit local forecasting and climate analysis in any given location.
Source: (WMO, 2020[14]; WMO, 2020[54]).
Exposure and vulnerability assessment
In addition to technologies for observational data collection and monitoring, technologies for the collection of data on exposure and vulnerability also help build a comprehensive picture of climate risks. In many cases, data on hazards are more available and accessible than those on exposure and vulnerability. This suggests that vulnerability and exposure assessments must be complemented by stronger identification of the socio-economic context (OECD, 2021[24]). Several elements should guide vulnerability and exposure assessments. These include knowledge; bottom-up qualitative approaches, such as causal inference network in the storyline approach (Chapter 4); and stakeholder engagement, which can inform quantitative processes to support exposure and vulnerability assessments.
Understanding societal vulnerability requires granular socio-economic data and assessments of the impact of risks on people’s livelihoods, health and their communities at large. Much of this is often not directly quantifiable. Adverse impacts will disproportionately affect the most vulnerable segments of society, magnifying social inequalities. For example, people on limited income in coastal areas may have limited opportunities for relocating or rebuilding their homes after a disaster (Bell et al., 2021[55]). Using geospatial technology and data products allows for overlaps of hazard, exposure and vulnerability data. These insights can improve the granularity and relevance of risk assessments for specific locations and socio-economic groups over time. As an example, a study combined data on surface urban heat stress intensity (SUHI) with georeferenced census data. It found that in major American cities an average person of colour and those living below the poverty line lived in areas with higher SUHI (Hsu et al., 2021[56]; Chakraborty et al., 2020[57]). Remote sensing and geospatial information systems data can be combined with mobile phone network data to create a predictive poverty map that is more timely than census-based methods.
Smartphone technologies can be leveraged to crowdsource granular vulnerability data in a cost-effective manner; such data are difficult to capture with traditional methods (e.g. Earth observations) (Salvati et al., 2021[58]). Smartphone ownership has increased in all countries, allowing more opportunities for people to help collect relevant data. For example, data on the physical characteristics of buildings (e.g. construction material or location) are needed to monitor their vulnerability to climate-related hazards. Such data provide input to the development and implementation of local climate and civil protection plans (Salvati et al., 2021[58]). The Italian city of La Spezia, for example, is exposed to a number of geo-hydrological hazards including floods, flash floods and landslides. By drawing on data crowdsourced from smartphones, researchers gathered information on the physical characteristics of buildings that could help assess their vulnerability to geo-hydrological events (Salvati et al., 2021[58]).
Mobile apps may also allow people to upload photos and report damages on infrastructures to gain insights on flood risks in a given location. These can be used for subsequent flood management and geo-localised water assessments (Frigerio et al., 2018[59]). Such crowdsourced data can improve accuracy in identifying areas impacted by hazards. This can be used to provide benefits for products that rely on vulnerability and exposure data for forecasting. For example, a global study involving the application of an algorithm to social media posts developed real-time and historic database of flood events. This can be used to validate flood risk models; task satellites (allowing for collection of remote sensing data of exposures to individual events); improve early warning and situational awareness to reduce impacts of extreme floods; and improve applications that depend on historical data (e.g. forecast-based financing schemes) (de Bruijn et al., 2019[60]).
Data with high resolution and coverage on characteristics of the natural and built environments can assist in various components of climate risk management. Advanced remote sensing methods, such as Light Detection and Ranging (LiDAR) and Synthetic Aperture Radar (SAR), can penetrate cloud cover to identify building and construction materials, building heights and topographic features (ADB/OECD, 2020[20]). LiDAR and SAR scanners have been used to produce high-resolution hazard maps because they can collect data at a very fine resolution. Such maps can then can be used for preparedness and mitigation strategies (Yu, Yang and Li, 2018[61]). For example, in the Philippines, LiDAR scanners were used to identify structural damage from flooding in rapidly urbanising areas of low-lying land (Bragais et al., 2016[62]). They also helped detect transport network obstruction after Hurricane Katrina in the United States to help emergency crews (Kwan and Ransberger, 2010[63]). SAR data can be used for preparedness strategies such as flood risk reduction planning and flood disaster management (Rahman and Thakur, 2018[64]).
Airborne sensors can capture aerial imagery at finer resolutions and supply real-time situational information to respond to hazardous events. Such events include detecting areas exposed to forest fires, as well as helping characterise the hazard by size and proximity from inhabited areas, among other areas. Aircrafts equipped with infrared sensors can detect hotspots at low elevation, record the data and transfer them directly to firefighters on the ground (Marder, 2019[65]). The data collected can be used to improve and develop protocols and strategic plans, including development of real-time maps for future fire risk management. They can also be used as an advanced level tool for detecting fine cracks and damages in structures for post-disaster assessments (Sarker et al., 2020[66]).
Unmanned aerial vehicles (UAVs or drones) can be more cost effective than aerial images from aircraft. UAVs can collect ground surface data at high resolution, and make them more accessible to different stakeholders (Minges, 2019[67]; ADB/OECD, 2020[20]). UAVs can carry various types of sensors, including cameras, videos, infrared, radiation sensors and weather sensors. In Tanzania, for example, UAVs periodically survey urban neighbourhoods to create detailed maps for local governments on exposure of flood risk (Ackerman and Koziol, 2019[68]). Farmers have used UAVs with digital cameras attached to monitor the health of crops, as well as detect damage done by drought, hailstorms and floods (Michels, von Hobe and Musshoff, 2020[69]). In the United States, during Hurricane Florence in 2018, researchers used underwater UAVs to measure ocean heat that was fuelling the hurricane. This filled in gaps in satellite images, improving hurricane modelling (Minges, 2019[67]).
Deciding how to respond to climate-related hazards will require a good spatial and temporal understanding of both exposure and vulnerability. This will require the sorts of geospatial data, analysis and visualisation tools described above. They will need real-time capabilities to monitor the exposure of people to a given hazard and to facilitate communications between responsible authorities and the affected population. The technologies discussed above – mobile communications, social media and the use of satellite imagery and UAVs to carry out rapid assessments – will be of particular value. The latter will require advanced data processing capacities. High-resolution geospatial data on the patterns of exposure and vulnerability coupled with artificial intelligence capabilities will also help guide the choice of response and its implementation. Issues of data confidentiality and trust will need careful consideration when using mobile communications applications, including for data collection in affected populations (Arendt-Cassetta, 2021[6]).
Inclusive stakeholder engagement for informing risks
Stakeholder engagement is a cross-cutting component of the risk governance process. It recognises that stakeholder groups will have different values, concerns and views of risk, both within and across countries. This may be due to their socio-economic situation; past experience of risks; or differences in their perception of the cause and nature of the hazard and its consequences. Differences may also be due to political and wider public discourse about the risk; a person’s social networks; an individual or group’s ability to influence outcomes (e.g. through social media); or broader attitudes and views towards nature (Brody et al., 2007[70]).
Public or individual perceptions may be as, or more, important as scientific risk assessments in motivating action to address risks. Social circumstances may exclude vulnerable communities from discussions on the evaluation of risks. Policy makers may therefore have to engage with them deliberately to ensure that their views can inform decision-making processes. For example, local and Indigenous knowledge may provide valuable insights to complement observational data on widespread risks that communities have dealt with over generations (see Box 6.4). Private sector representatives can provide an alternative perspective of the risks that can inform research, technology development and communication of the risks, among others.
Survey applications, focus groups and predictive analytics (e.g. modelling, machine learning and data mining) coupled with use of social media can provide valuable information about the diversity and intensity of risk perceptions, concerns and potential socio-economic impacts. The use of geographic information systems and spatial analysis can also shed light on how vulnerability and exposure influences perceived risks (Brody et al., 2007[70]). These technologies can be combined with stakeholder engagement processes to inform their perspective or risks. Such approaches may be highly relevant for assessing options because perceptions are likely to affect willingness to support policy interventions. They may also influence exposure and vulnerability, such as the likelihood that stakeholders will build a house in a high-risk zone.
Local knowledge refers to the understanding and skills developed by the individuals and the populations, specific to a given place. Indigenous knowledge refers to the understanding, skills, and philosophies developed by societies with long histories of interaction with their natural environment (IPCC, 2019[71]). Many communities have well-established traditions of responding to changes in the environment that are passed down over generations through oral history (Granderson, 2017[72]).
In the Pacific island of Vanuatu, Indigenous knowledge in observing and forecasting climate variability has been practised and passed down orally for generations. In combination with science, Indigenous knowledge on bioclimatic patterns enhanced climate monitoring and modelling of hazards. For example, it provides insight into the links between cloud formation, wind direction, tides and other environmental conditions with changes in plant and animal behaviour (Granderson, 2017[72]).
In the United States, firefighters in California are engaging with Native American tribes, who have practised techniques for thousands of years to protect their land and prevent wildfires from spreading across mountains (Sommer, 2020[73]). In the Hawai’ian islands, a project to create hazard maps used a participatory modelling approach with rural community members, incorporating expertise from kupuna (elders). In this way, Indigenous knowledge of communication networks informed spatial adaptation planning (Baudoin et al., 2016[74]).
6.2.2. Technology for evaluating the risks of losses and damages
Acceptability of different risks is often determined by stakeholders’ understanding of those risks. As described in Chapters 2 and 3, the level of knowledge varies. It can depend on the type of hazard considered, as well as understanding of related exposures and vulnerabilities, timescale and what is at stake. This section highlights some technologies that inform risk governance, such as developments in climate monitoring and modelling, predictive analytics and evaluation tools. The process of assessing the tolerability and acceptance of risks can be structured into two distinct components that separates the evidence-based (knowledge characterisation) component and the value-based (risk evaluation) component for making necessary judgments.
Knowledge characterisation
Climate risks are complex and can take on different dimensions, influencing approaches to reduce and manage them. The knowledge acquired during the risk characterisation phase can help categorise understanding of the risks on a decision-making spectrum (see Section 4.2). The extreme ends of the spectrum are defined as full certainty or total ignorance. In between are levels of uncertainty ranging from a clear future; a few possible futures relatively well understood; many plausible futures; or unknown futures. Given the characterisation of hazards, and thus how to address them, can vary widely.
Climate monitoring and modelling, as well as weather forecasting, can show decision makers how hazards may evolve over time. This, in turn, can inform strategies to reduce and manage losses and damages of systems at risk. The risk is characterised in a multidimensional profile before its acceptability is assessed (discussed below). The characterisation of risks can change over time as understanding of the hazards evolves. This highlights the importance of approaches to decision-making under uncertainty that perform well under different climate futures as discussed in Chapter 4.
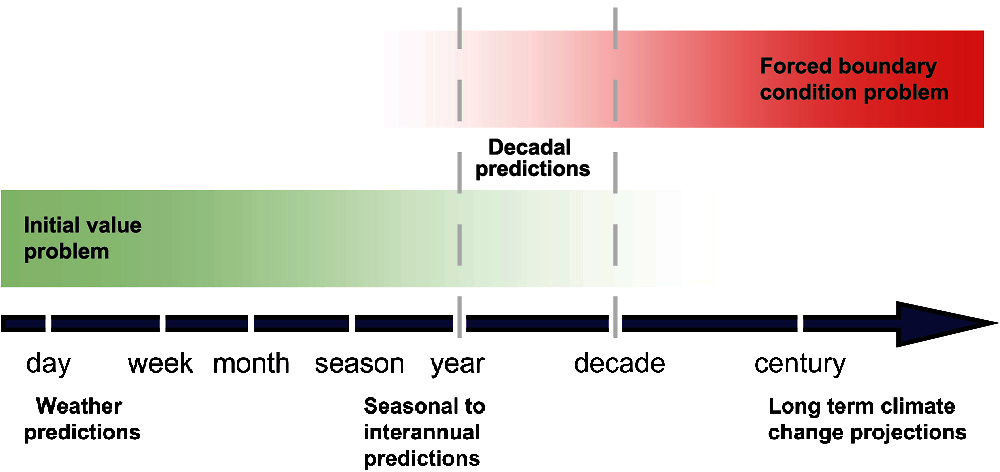
Forecasts of weather and climate-related hazards have long aspired to be seamless across the range of relevant timescales (Shukla et al., 2010[75]). Hoskins (2012[76]) argues there can in principle be predictive power on all timescales. Indeed, he argues this can occur despite the chaotic nature of the atmosphere and the transfer of uncertainty from the smallest scale to the global scale. There are well-developed monitoring systems for short-term forecasts of hazards (e.g. up to a week). These have been extensively discussed above and need no further elaboration here.
Models on slightly longer timescales (e.g. up to a month) do not predict hazards well because they fail to adequately represent the tropics (both in terms of convection and patterns of climate variability). Such models, nonetheless, are crucial for many developing countries and SIDS. On a seasonal timescale, the powerful El Niño Southern Oscillation (ENSO) provides predictive power to models for timescales up to a year ahead. It can do this because ENSO evolves slowly on a monthly timescale and its influence on regional weather across the globe is well understood – though not deterministic (Hoskins, 2012[76]). The inertia in sea-surface temperatures and the persistence of some modes of variability over several years could provide a basis for forecasts up to a decadal timescale. There is also hope for predictive power beyond decadal timescales. Key factors include external conditions like changes in solar energy flux hitting the Earth; volcanic aerosols and projected human-caused GHG and aerosol emissions; and persistent oscillatory modes in the Atlantic and Pacific oceans (Hoskins, 2012[76]).
A World Climate Research Programme Grand Challenge aims to improve multi-year to decadal climate predictions and their usefulness to decision makers for near-term planning activities (e.g. urban planning, agriculture). Researchers must consider different underlying drivers from both climate projection and climate prediction. While climate projections carry out global mean of anthropogenic-forced climate starting from the past, climate predictions are initialised using the current climate system. Together, they enable multi-year decadal climate predictions and regionally-specific information (see Figure 6.2) (IPCC, 2013[77]). WMO Global Producing Centres for Annual to Decadal Climate Predictions now draw on scientific expertise and computer modelling from world-leading climate centres to produce actionable information for decision makers around the world (WMO, 2021[78]). As discussed in Chapter 2, the different sources of uncertainty are likely to contribute differently to different climate-related hazards.
Part of knowledge characterisation is understanding ambiguity stemming from divergent perspectives on a given risk. For climate change, the ambiguity (and controversy) stemming from differing economic and ethical perspectives is well known. The IPCC’s latest statement is tremendously important in that context. According to the IPPC, “(i)t is unequivocal that human influence has warmed the atmosphere, ocean and land. Widespread and rapid changes in the atmosphere, ocean, cryosphere and biosphere have occurred” (IPCC, 2021[79]). Ambiguity also stems from the uncertainty in projections of extreme events by climate models, as discussed extensively in Chapter 2. Approaches for acting in the face of such uncertainties are discussed in Chapter 4; successful approaches need to be dynamic, adaptive and iterative.
Monitoring efforts to reduce climate-related hazards, such as GHG emissions, contributes to a global public good. Monitoring reduces the scale of climate-related hazard faced by everyone, whether a country, company, community or individual. Furthermore, it quantifies the potential release of GHG emissions more effectively. This will improve researchers’ understanding of how emissions contribute to observed changes in major ecosystems, as well as to where future tipping points might lie (Lenton et al., 2019[80]). The incentives for each type of action are therefore different.
Technologies that can support effective measuring, reporting and verification of efforts to reduce GHG emissions will tend to encourage greater co-operation. Examples include Earth observations to detect and monitor GHG emissions and associated land and ocean carbon sinks globally. Japan’s Greenhouse Gases Observing Satellite, for example, senses infrared radiation reflected and emitted from the surface of the Earth and atmosphere. This provides global coverage over a three-day period, complementing ground and air-based measurement networks (Stokke and Young, 2017[81]; Faiyetole, 2018[82]). The Group on Earth Observations is an intergovernmental partnership working to improve availability, access, and use of global observation systems to support the implementation of the Paris Agreement including in relation to national reporting (GEO, 2018[83]).
The evaluation of risks for reducing and managing losses and damages must consider both slow-onset changes and extreme events. A deeper knowledge of past extreme events and related factors influencing them could inform understanding and preparedness for future extreme events and help quantify losses and damages (Clarke, Otto and Jones, 2021[84]). Further, evaluation of the risks must also consider the possibility of the abrupt, nonlinear and cascading high-impact phenomena of tipping points. Once an irreversible global tipping point has been passed, the system cannot revert back to its original state, despite lessoning and reversing strategies (Lenton et al., 2019[80]). Many systems are near their tipping points or will reach them. Examples include the loss of ice sheets in the West Antarctic, the shutdown of the global Atlantic Meridional Overturning Circulation (see Chapter 3), disappearance of alpine glaciers or the die-off of coral reefs. Understanding the proximity of reaching the crucial threshold for different systems will require improvements in process-based understanding of the risks each system face (Swingedouw et al., 2020[85]).
Technologies to support understanding, measuring and monitoring tipping elements
The possible crossing of thresholds that will trigger climatic tipping points must be part of risk management (IPCC, 2021[79]). The impacts (globally and regionally) of such tipping points may significantly reduce the effectiveness of adaptation measures to address exposure and vulnerability to climate-related hazards projected in the absence of such tipping points. Technologies for better monitoring and modelling of the climate system, in addition to modelling and data assimilation techniques (Section 6.2.1), will be essential. These need to characterise how climate-related hazards may evolve over time and space and when the system will approach a less habitable climate state. High-quality scientific data on an appropriate frequency are key to understand, monitor and perhaps even achieve early warning for these tipping elements. These include observational data on abrupt climate changes in the geological past to improve the ability of models to capture couplings and feedbacks in the Earth system (Lenton et al., 2019[80]). Deciphering statistical characteristics of variables from hundreds of years of variations can help provide more insights into the probability of reaching threshold level in various systems (Swingedouw et al., 2020[85]). However, detecting early warning signals is challenging and there may be limited ability to predict some of these critical transitions (Ditlevsen and Johnsen, 2010[86]; Lenton, 2011[87]; Swingedouw et al., 2020[85]; Bury, Bauch and Anand, 2020[88]; Rosier et al., 2021[89]). Indeed, the prediction of tipping points remains difficult, mainly due to the need to assess the interaction between natural variability and anthropogenic forcing (Swingedouw et al., 2020[85]).
Remote sensing observations from various sources in combination with longer Earth time series observations of key variables have contributed to the knowledge of different tipping elements in the biosphere, oceans and cryosphere (Swingedouw et al., 2020[85]). Remote sensing observations are crucial for identifying anthropogenic forced variations from natural variability, which improves the modelling of systems. For example, remote sensing tools for ocean network monitoring, such as the Argo Network, use autonomous floats to measure the ocean’s salinity, temperature and strength of gravity of the upper ocean to measure ocean current stability. More than 3 000 free-drifting robot floats operate in the upper 2 000 metres of the ocean (NOAA, n.d.[90]). In order to explain the response of marine species composition and communities from crossing large-scale biodiversity or ecosystem changes, methods to enable quantifiable predictions of space and time patterns with ecological theories will be needed to investigate long-term impacts (Beaugrand et al., 2019[91]).
Techniques for improving the understanding of the proximity of reaching tipping points of various systems are still in their infancy. The state at which tipping points are crossed is difficult to predict. Driving parameters often experience only incremental changes before the state of the system makes sudden or persistent transitions. Early warning indicators (EWI) are one method to help detect early loss of system resilience (Gsell et al., 2016[92]). EWI are statistical metrics that can quantify the loss of temporal or spatial resilience of systems to detect a “regime shift”. In this way, they can signal the proximity to crucial thresholds. Another method is a machine-vision approach to automatically detect edges, which reveals abrupt shifts in climate state and extreme climate events in climate datasets (Bathiany, Hidding and Scheffer, 2020[93]). This approach can quantify the abruptness, provide details to help understand the causes of the shift and assess some uncertainties of climate events. Better monitoring technologies are needed to improve high-level observation of disturbances in spatial patterns related to fragile transitions in systems. An international scientific programme focused on monitoring, modelling and developing potential EWI for a range of tipping elements would have significant global public benefits. Progress in this direction seems to be underway. In early 2021, for example, the ESA Climate Office convened a forum on Remote Sensing of Tipping Points in the Climate System; the forum was hosted by the International Space Science Institute (ESA, n.d.[94]). In addition, the Future Earth AIMES project hold discussion series that brings together representatives of diverse natural and social science communities to advance knowledge about tipping elements, irreversibility, and abrupt changes in the Earth system (AIMES, n.d.[95]).
Risk evaluation
Risk evaluation assesses whether the risk under consideration is acceptable to the decision maker and stakeholders. This is often determined by stakeholders’ understanding of the risks, which includes their values and perspectives. The risks can be analysed at different levels of granularity or on a combination of probability of how likely the risk will occur and its possible impact should it take place. The international community, for example, has decided that the risks posed by climate change are not acceptable and that both mitigation and adaptation measures should be implemented to reduce the risks to a tolerable level. The temperature goal of the Paris Agreement might be seen in this context. It indicates the level of climate change at which the risks are so great that they should be avoided. Figure 6.3 illustrates the different judgements on the acceptability of the risk: acceptable, tolerable and intolerable. The figure displays the combinations of likelihood and extent of consequences that might lead a decision maker to classify a given risk as acceptable (no formal intervention necessary); tolerable (associated benefits are worth the risk but should be complemented with appropriate risk reduction measures); and intolerable (change must simply be prohibited or substituted because risk cannot be avoided) (IRGC, 2017[4]).
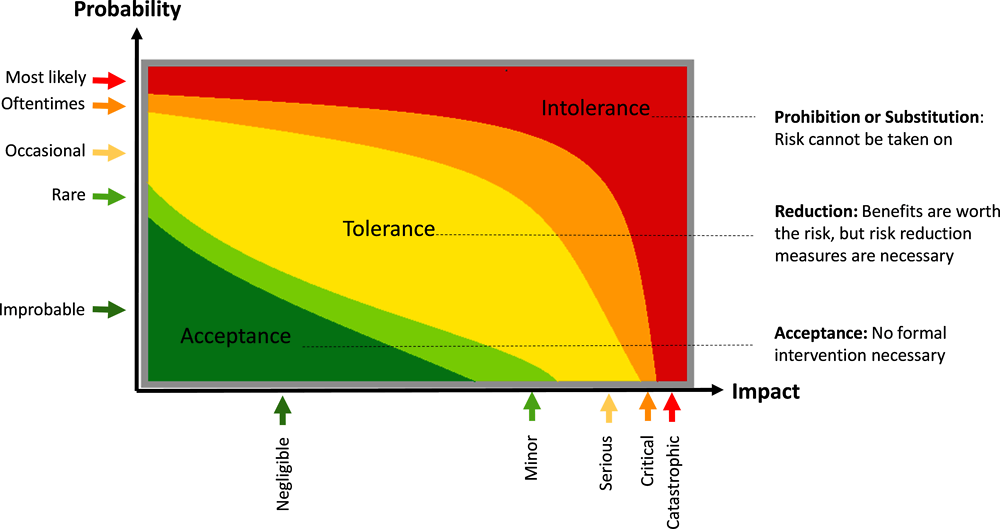
Source: Adapted from (IRGC, 2017[4]).
At the global level, the nature of climate change means the behaviour of individual large-emitting countries will determine whether the goals of the Paris Agreement are met. The level of climate change associated with the Paris Agreement temperature goal has implicitly been agreed as tolerable, provided risk reduction measures are implemented (e.g. mitigation, decarbonisation, enhancing adaptive capacity). However, vulnerable countries may not be in the position (financially, technologically or in terms of capabilities) to implement the necessary measures. Efforts will therefore be needed to reduce the exposure of people and assets to hazards and to reduce vulnerability through approaches discussed in Chapter 4.
Individual risks at a smaller spatial scale and shorter timescale will need a similar assessment process. Some risks, almost by definition, will have extremely serious consequences but may not be avoidable (see Box 1.1). These could include extreme events such as landfall by a major hurricane or cyclone in a highly populated area. In such cases, an effective early warning system and evacuation plan could be prioritised to minimise exposure of people to the hazard. While this may reduce or even eliminate loss of life, it cannot fully prevent economic and psychological losses and damages. As sea level continues to rise, SIDS may well face difficult decisions about whether the risks of losses and damages from climate change remain tolerable (see Chapter 4).
Risk evaluation involves a broader value base, including societal values, economic interests and political considerations, which can influence the judgement of risk. Participatory approaches to, for example, the creation of community risk assessment tools, are critical in risk evaluation. They build a meaningful exchange of information that makes decision makers aware of how society judges risks and bring to light the communities’ perspective of increased climate risks to livelihoods and systems (van Aalst, Cannon and Burton, 2008[96]). The methodology may involve a range of tools, including risk mapping, focus group meetings, surveys and discussions, and interviews.
As an example, digital community risk maps can are easy to share, update, and integrate into other digital applications. The approach facilitates risk-knowledge co-generation and evaluation that can inform adaptation and disaster risk reduction measures. For example, the Risk Geo-Wiki portal established by the International Institute for Applied Systems Analysis, provides a two-way information exchange between local knowledge and expert-sourced knowledge of the risk (Geo-Wiki, n.d.[97]). It incorporates a community-based participatory mapping process where community members provide, for example, existing or hand-drawn maps of the locations of critical infrastructures, emergency shelters, community resources. The information is then digitalised and can be further developed by local stakeholders. Furthermore, the digitalised maps can be overlaid upon satellite imagery to better visualise and aid in planning, designing and developing initiatives. This portal have been used in communities in Nepal, Peru, Mexico (Mechler et al., 2018[98]).
Advances in geospatial technologies have allowed for the input of qualitative local knowledge to be translated into mathematical models to evaluate quantitatively the potential outcomes, such as restoration and protection projects of impacted communities (Hemmerling et al., 2019[99]). The process can map localised knowledge into usable datasets, where it can combine with existing datasets and serve multiple purpose in the planning process. Such quantification can, for example, be utilised to identify and reduce the risk of disproportionate impacts on particular social or cultural groups, and further provide geographically targeted evidence-based planning strategies. This allows policy makers to make informed decisions, whether aimed at a budget, or adoption of new adaptation and resilience plans (Cornforth, Petty and Walker, 2021[47]).
6.2.3. Technology for developing, implementing and evaluating approaches to reduce and manage the risk of losses and damages
This component of the process decides on the most appropriate approaches for climate risk management based on the risk evaluation discussed in Section 6.2.2. The legitimacy and effectiveness of any risk governance process will depend on many non-technical factors, including the trust of stakeholders in the process. Chapters 4 and 5 examined how the risks of losses and damages from climate change can be reduced and managed. This section focuses on how strategies, options and approaches to reduce and manage the risks depend on specific technologies or require technological capacity (e.g. infrastructure or skills). It describes how understanding the risks can help determine a suitable decision-making approach.
Developing management options
The development of approaches to reduce and manage the risks of losses and damages can benefit from a review of the information generated from the different components of the risk governance process, such as risk characterisation and risk evaluation. In the context of climate change, decisions will often be made in the context of uncertainty. In such circumstances, iterative processes to manage the risks will be important. These processes should be informed by continuous monitoring, evaluation and learning, and complemented by adaptive decision-making approaches (see discussion in Section 4.2). Selection of the management option should consider the broader socio-economic.
Decision support tools
As defined in Section 6.1, technology means both a physical piece of equipment and, more broadly, a technique to carry out an activity. Here, decision support tools help evaluate risks to determine priorities for decision-making approaches. Translating information from risk assessments into operationalisation of goals or strategies require good understanding of the broader context, including the various affected systems. This will help limit transfer of risks from one area to another. Decision makers may struggle to navigate the data and information available to assess the risks and formulate actions. Development co-operation can play a valuable role to help vulnerable communities identify suitable approaches. One example is the AGRICA project summarised in Box 6.5.
The Climate risk analysis for identifying and weighing adaptation strategies in sub-Saharan Africa (AGRICA) project is implemented by the Potsdam Institute for Climate Impact Research in co-operation with the German Development Agency on behalf of the German Federal Ministry for Economic Cooperation and Development. Sub-Saharan Africa has limited access to reliable information on climate risks and impacts to inform decision making and adaptation strategies. AGRICA projects focus on the agriculture sector, providing aid to countries in sub-Saharan Africa for identifying adaptation strategies with costed adaptation scenarios.
AGRICA models the full agricultural impact chain and potential adaptation strategies that will support efforts in the sector to cope with a changing climate. The individual climate risk studies are comprised of assessments on impacts. These include examining the interplay of a changing climate, changing water availability and resulting climate impacts on the agriculture sector. Then, based on the impact assessment, suitable adaptation strategies are determined using biophysical, cost-benefit and socio-economic analyses.
The project aims to support governments and development actors in the case study countries. The results of the climate risk analyses, in turn, can feed into national and subnational planning processes, such as Nationally Determined Contributions and National Adaptation Plans. Further, the results can guide development co-operation, both in terms of identifying national priorities but also in limiting exposure to climate risks.
Source: (PIK, n.d.[100]) discussed in (OECD, 2021[24]).
Decision support tools, such as cost-benefit analysis, cost-effectiveness analysis and multi-criteria analysis can be used to screen different options (see Box 6.6). The tools help determine what approaches are cost effective and equitable in reducing and managing the risks of losses and damages given the assumptions. Advancements in techniques and algorithms have improved software capacity to integrate and analyse data from various sources, and add spatial and temporal functions. These improve the ability to visualise and compare different options. Such capabilities provide the evaluation of the performance of different options against various uncertainties and future hazard scenarios. This allows for the measurement of effectiveness of risk reduction options, providing transparent and consistent analysis to support decision making (Newman et al., 2017[101]). Another example of decision support tools to aid in evaluating complex problems involving multiple actors are policy exercises, such as social simulation tools called “serious gaming”. This combines computational models and participation of real actors, to inform different perspectives in situations when decision making requires management of complex social interactions (Mechler et al., 2018[98]).
Cost-Benefit Analysis (CBA) is focused on economic efficiency of a particular strategy or option. It compares costs associated with the option against benefits to calculate the net present value. Ultimately, CBA strives to maximise social welfare against identified climate change impacts. CBA, however, does not consider important aspects of risks, such as levels of uncertainty and ambiguity, distribution and equity, or stakeholder value judgements of projects (see discussion in Section 5.3.1 for the limitations in CBA). Given the long-term scales of some policy measures, CBA applies most to shorter-term options that are straightforward with simple risks.
Cost-Effectiveness Analysis (CEA) compares the attractiveness of different approaches or options through comparison and ranking to achieve a pre-defined target. While costs are assessed in monetary terms, CEA allows benefits to be valued in non-monetary terms. It is most useful when assessing short-term options that are simple, non-technical or “soft”, such as capacity building. CEA requires in-depth work to ensure policies are implemented together to factor in elements that previous assessments may not have considered. This makes it applicable to addressing characteristics of ambiguity.
Multi-criteria Analysis (MCA) uses relative scoring or ranking of different options depending on assessment criteria. MCA considers elements to be weighted based on relative importance. As such, it can be used in cross-sectoral analyses for assessment of strategies that contains a broad range of objectives that are hard to quantify, for example, acceptability, equity, urgency, or co-benefits. The approach works with scenario planning of individual events, which can include options on how to perform against uncertainty. It may also be most suitable for encouraging stakeholder participation in decision making to combine expert judgement and preferences.
Source: (Econadapt, n.d.[102]).
Reducing climate-related hazards through mitigation
Rapid and deep cuts in GHG emissions, including from land-use change, are the most effective action to limit the scale in frequency and intensity of climate-related hazards (IPCC, 2021[79]). The ability to achieve stringent mitigation targets such as those implied by the Paris Agreement fundamentally depends on technology. Indeed, solar, wind and hydro technologies have achieved rapid reductions. These results, alongside the subsequent scaling-up of renewable deployment and generation, are one of the bright spots to achieve rapid and far-reaching emissions reductions. Even here, however, efforts need to be accelerated (IEA, 2021[103]). Moreover, emissions reductions are required right across the economy, even in hard-to-abate sectors such as food production and freight transport. Otherwise, CO2 emissions will need to go net-negative to offset any remaining emissions from such sectors.
This may require the use of carbon dioxide removal (CDR) technologies. The most promising of these technologies is the combustion of biomass with the capture and long-term geological sequestration of resulting CO2 emissions through carbon, capture and storage (CCS) technologies. Atmospheric CO2 concentrations could be reduced over repeated cycles of biomass growth, harvesting and combustion. The required scale of deploying CCS technologies alone in such scenarios would be extremely challenging. Box 6.7 describes the global net CO2 emissions for four pathways. It shows that even if CCS technologies are achievable at large scale, they may still raise concerns for reducing net emissions.
Scenarios with high levels of future energy demand show lower levels of CO2 emissions reductions to 2030; this is in line with the “P4” scenario in Figure 6.4 and IPCC (2018[104]) To achieve a 1.5°C target, such scenarios would require cumulative negative emissions over the century of some 1 200 gigatonnes of CO2 – roughly the equivalent of 30 years of pre-COVID (2019) annual energy-related CO2 emissions (IPCC, 2018[101]). This would require carbon dioxide removal technologies, such as Bioenergy with Carbon Capture and Storage (BECCS), as well as protection and – if possible – enhancement of natural carbon sinks. BECCS is seen as the most plausible technology and modelling approach. The P4 scenario projects that some 7.2 million square kilometres of land would be needed by 2050 for bioenergy crops. This is more than 30 times the area required for the lower demand scenario (moving towards “P1” on the left hand side of Figure 6.4) (IPCC, 2018[104]) and equivalent to almost 15% of the world’s total agricultural land.2
The acceptability of large-scale BECCS deployment, and its technical feasibility on its own, raises significant doubts about the credibility of large-scale CDR. This, in turn, raises more doubts as to whether high-demand scenarios, such as “P4”, are credible potential pathways to achieve the Paris temperature goal. Even if CCS deployment on such a scale were achievable, the sheer scale of land-use for bioenergy in such pathways raises major issues around the competition for land and the potential impacts of climate mitigation on food security and biodiversity loss. Simultaneously ensuring food security and protecting biodiversity will be easier through pathways with low future growth in demand for energy and other resources.

Note: Final energy demand increases from left (P1) to right (P4). These different mitigation strategies can all limit global warming to 1.5°C with no or limited overshoot. All pathways use carbon dioxide removal, but the amount varies along with the relative contributions of Bioenergy with Carbon Capture and Storage and removals in the agriculture, forestry and other land use sector. P1 is a scenario with low-energy demand (Grubler et al., 2018[105]) and reflects literature with a stronger focus on demand-side measures; P2 is a sustainability-oriented scenario (based on SSP1) developed with the AIM mode (Fujimori et al., 2017[106]) l; P3 is a middle-of-the-road scenario (based on SSP2) developed with the MESSAGEGLOBIOM model (Fricko et al., 2017[107]); and P4 is a fossil-fuel intensive and high-energy demand scenario (based on SSP5) developed with the REMIND-MAgPIE model (Kriegler et al., 2017[108]). A description of the different SSP scenario narratives can be found in O’Neill et al. (2017[109]).
Source: IPCC Special report on 1.5°C (IPCC, 2018[104]).
Deep emission reductions will require further technological innovation, development and deployment (e.g. for large-scale energy storage and CCS). They will also require changes in the systems in which technologies are embedded. In this way, they can create dynamic linkages between supply and demand (e.g. through smart grids) but also radically change system design to reduce the energy and materials intensity of economies (Buckle et al., 2020[110]). IPCC (2021[79]) notes that pathways with very low or low GHG emissions would have rapid and sustained effects to limit human-caused climate change compared with scenarios with high or very high GHG emissions. They would also give the best chance of doing so without further undermining the well-being of humans and natural systems.
Reducing exposure and vulnerability to climate-related hazards
Exposure and vulnerability are complex and multidimensional characteristics of socio-economic systems. For example, some types of exposure may only be alterable by interventions on long timescales (e.g. infrastructure or agricultural land). Other types of exposure may be more flexible, even on the scales of hours or days, such as human exposure to extreme events. Technologies and systems underpinning early warning and response systems can reduce exposure of individuals to hazards such as storms, floods and heatwaves through physical relocation. This section examines the role of technology in supporting a small subset of approaches to reduce the exposure and vulnerability of people and livelihoods to climate risks: EWS, sectoral resilience and disaster recovery. An extended discussion on the role of technology in strengthening resilience, including technology transfer and needs assessments, is provided in OECD (2021[24]).
Early warning systems (EWS)
Reducing and managing the risks of losses and damages from climate change requires approaches that protect and prepare communities. Effective preparedness is a long-term, integrated approach to risk governance. In designing strategies for adaptation, deciding how to respond to weather and climate hazards will therefore require a good spatial and temporal understanding of both exposure and vulnerability. The increasing risks of weather and climate hazards makes surveillance imperative. This will require the sorts of geospatial data, analysis and visualisation tools described in Section 6.2.1. This includes real-time capabilities to monitor the exposure of people to the hazards and facilitate communications between authorities responding to a hazard and the affected population.
EWS are integrated systems of hazard monitoring. EWS provides warnings and communicate the risks to the public, government and businesses to inform timely action. Improvement in weather, water and climate observation, as well as in modelling and forecasting capabilities, plays an important role in monitoring hazards, in particular extreme events (e.g. heavy rain, storms, cyclones, heatwaves). Earth observation satellites provide fast and accurate early warning data through dissemination methods and geographic information system mapping tools (UNCTAD, 2021[17]). Technological developments in Earth observations and monitoring (e.g. atmosphere, land and oceans, and elements such as temperature, precipitation, pressure and wind) have enabled the detection of real-time weather and hazard events (e.g. storms, floods, droughts) (Guo, Zhang and Zhu, 2015[111]). For example, the Earth observation-based Information Products for Drought Risk Reduction at the National Level project by the Centre for Remote Sensing of Land Surfaces in Germany provides early warning risk information on drought hazards in South Africa and Ukraine (ZFL, 2021[112]). Earth observation-based methods monitor soil moisture, precipitation and vegetation to assess drought risk (UN, 2021[113]).
Technology advances have also contributed to increased optimisation and accuracy in EWS co-ordination. However, longer-term hazard forecasting (rather than weather forecasting or climate projections) needs more operational capacity. Observational monitoring of key systems affecting hazards at these longer timescales (e.g. Antarctic ice shelves, permafrost melt and ocean circulation) is also needed both remotely and in-situ. EWS may also be feasible for some climate tipping points (Lenton, 2011[87]); see Swingedouw (2020[85]) for a discussion of the use of Earth observation in providing early warning for such tipping points.
Different countries have different capacities and needs to deliver EWS effectively. Examples from different country contexts include:
In Ethiopia, the semi-subjective climate modelling methodology was replaced with a new objective approach based on climate science. This allows improved seasonal forecast to help the country advance in mitigating and anticipating losses from extreme climate events (WMO, 2020[114]).
In Mongolia, extreme climate conditions have caused many herding households to lose their livestock. A joint partnership between the government and FAO-WFP Crop and Food Security Assessment allowed overlaying monitoring and forecasting with socio-economic indicators to help target vulnerable families to provide anticipatory action (WMO, 2020[114]).
In Nepal, early warning delivered to the community was not well received due to poor radio connectivity and a gap in the community’s understanding of the level of flood severity. Working closely with community members in co-designing EWS helped ensure that messages are suitable and well understood by the community (Shrestha et al., 2021[115]).
In Japan, a centralised platform for EWS delivers information regarding safety and security details, evacuation plans and post-disaster recovery. This approach distributes the same information to all stakeholders, including the media, municipality and utility companies (GFDRR, 2019[116]).
With EWS, it is essential to engage with community stakeholders, especially marginalised or vulnerable segments. Reaching marginalised and vulnerable members can be challenging due to physical location, social norms or technological barriers. For instance, in some cultures, women are not encouraged to participate in capacity building training (Shrestha et al., 2021[115]). Creative methods to increase inclusion of all stakeholders should be part of plans to ensure delivery of EWS protocols. In some rural communities with little to no communication infrastructures, information comes from members within the community. In Sri Lanka, for example, many communities are situated in remote locations. In response, EWS capacity building through assigning leadership roles empower community members to inform vulnerable groups about hazard risks (Baudoin et al., 2016[74]).
The role of technology in financing disaster recovery
Vulnerability arises from a range of factors. These include levels of development, inequality and geographic location alongside individual characteristics (gender, age, health, social status, ethnicity and class). These factors influence levels of access to assets and income, where people live and their access to essential services, including housing and health care. Chapter 5 discusses financial mechanisms, including social protection and insurance programmes. Such programmes support individuals, households or businesses to reduce the risks of losses and damages from climate-related hazards, as well as to manage exposure and vulnerability to climate risks. Technological innovations underpin many of these financial services. Box 6.8 illustrates the potential for blockchain technologies to significantly reduce the costs of international remittance payments from family members, which globally far exceed the value of official development assistance.
Remittances play an important role in development, amounting to over three times the level of official development assistance in 2018. They provide low- and middle-income countries with a stable source of finance. However, transferring remittances is expensive, with a global average cost for sending them to low-and middle-income countries of 6.9% of the remittance value (Rühmann et al., 2020[117]). The cost of South-South remittances reaches 18.7% on average within sub-Saharan Africa, three times higher than the global average (Rühmann et al., 2020[117]).
Blockchain offers an innovative approach to sending and receiving remittances faster and cheaper, and to reach areas underserved by formal financial systems. Blockchain is based on a distributed ledger technology that provides a way to record data across multiple ledgers, which are maintained and controlled by a decentralised (distributed) network of computer servers (Rühmann et al., 2020[117]). The technology offers an approach to send and receive remittances in digital forms of money through a novel payment infrastructure, cutting out intermediaries, to enable peer-to-peer transfer. Blockchain can offer quicker and more affordable cross-border payments than traditional cash transfer systems and help ensure payments are made for their intended purposes. Blockchain technology may be more accessible to users through smartphone technology (World Bank, 2019[118]). In low-income countries where many adults do not have access to banking services, smartphones offer an alternative to receiving payments. In Latin America and the Caribbean, for instance, 90% of adults who do not have banking services have mobile phones (World Bank, 2019[118]).
However, Rühmann et al. (2020[117]) outline several limitations, including data privacy issues, regulatory uncertainties and last-mile delivery in cash. Blockchain use is unlikely to solve the last-mile problem as converting digital currency to cash can be difficult, even large banking institutions have failed to deliver cash conversions.
Insurance can provide vital access to finance to households adversely impacted by climate change (see discussion in Chapter 5). Emerging technologies and innovations offer opportunities for more effective target insurance products. Such technologies provide new sources of data on hazard, exposure and vulnerability (e.g. Earth observation, crowdsourced imagery) and tools for analysing them (e.g. artificial intelligence, machine learning). In this way, they expand the availability of affordable coverage for climate-related hazards. New technologies and tools, for example, can be used to reduce the cost of insurance underwriting, a process that typically accounts for as much as 20-25% of gross premium cost. For instance, an insurance company integrated risk scoring with artificial intelligence in assessing wildfire risk. It found secondary factors that decrease households’ risk, such as landscaping and fire-resistant buildings, in addition to distance from high-risk vegetation, lowered the cost of insurance for those living in high-risk fire zones (Sams, 2020[119]). These same technologies can also be applied to claims settlement and contribute to lower loss adjustment expenses. Online insurance distribution and innovations such as smart contracts could potentially provide further efficiency gains (Goldby et al., 2019[120]).
These innovations in financing disaster recovery could play a particularly important role in addressing gaps in commercial catastrophe modelling coverage. This, in turn, would allow insurance companies to make coverage available in countries where data and risk analytics tools are more limited. For example, in Zambia, a partnership between the national bank and an insurance institution has led to a creation of an affordable property insurance coverage for micro, small and medium enterprises. It insures against storm, fire and flood by leveraging a digital software-as-a-service platform to underwrite and price coverage (Inclusivity Solutions, 2020[121]). These technologies and innovations can also expand the ability of insurance companies to offer innovative insurance coverages such as parametric insurance or weather-based insurance (Box 6.9).
Smallholder farmers are vulnerable to climate shocks. Weather index insurance is a financial risk transfer product that can overcome the problems of traditional insurance schemes. Traditional crop insurance schemes typically pay out to farmers after the growing season for verifiable loss. Conversely, weather index insurance uses an index composed of rainfall patterns, temperature and other indicators. These work as a proxy for risk and translate extreme weather fluctuations as an indicator for crop failure (Bettini, Gioli and Felli, 2020[122]). This provides farmers pay-out tied to risk instead of individual losses. Because neither the farmer nor insurer can manipulate rainfall measurements, the weather index approach reduces issues of information asymmetry. Losses are no longer tied to payments, which eliminates the moral hazard problem as farmers will not gain anything if their crops fail. It also eliminate home visits to verify insurers’ crop loss. In this way, premiums are kept more affordable (Bettini, Gioli and Felli, 2020[122]).
Technology has helped overcome several unresolved problems associated with weather index. Weather index requires a dense network of weather stations, which are sparse in many parts of the world. This is especially the case in developing countries where smallholder farmers will benefit most from weather index insurance. Although satellite data have become more available, weather index insurance can benefit more for local-level observations. To overcome this, several countries have adopted different strategies.
In Tanzania and Mozambique, machine learning was used to build a dynamic index that links local meteorological records with user-generated weather observations, farmers’ reports on crop yield losses and global market prices data. This provides a more refined crop loss and risk management strategies (Biffis and Chavez, 2017[123]).
In Rwanda, solar-powered weather stations collect weather data every 15 minutes. Data are aggregated and compared with historical weather data at the end of the growing season. Payments are then calculated and sent, along with weather information, via mobile phones. This reduces delivery and administrative costs (ITU, 2016[22]).
In Kenya, InsuResilience Solutions Fund and the Kenyan Ministry of Agriculture, Livestock and Fishery have partnered on a climate-smart insurance strategy for smallholder farmers. It combines two technological innovations in climate risk insurance: soil moisture index and a picture-based loss verification tool, which minimises the cost of loss verification. Versatile climate-smart advisory services to farmers and decision support also complemented the insurance programme (InsuResilience, 2021[124]).
In Bangladesh, Nigeria and Sri Lanka, use virtual sensing technique with commercial microwave links to collect ground-level measurements. Commercial microwave links are ground-level radio connections used in mobile telecommunication networks. During rainfall, the signal strength can be analysed and converted to accurate rainfall measurements. This essentially turns mobile networks into a virtual network of rain gauges. (Raithatha and Tricarico, 2019[125]).
Monitoring and review
Adaptive or iterative approaches of risk governance call for mechanisms that facilitate continuous monitoring, evaluation and learning when decisions are made under uncertainty. Monitoring and review are needed in all components of risk governance. Capacity and governance processes must be continuously strengthened to create a systematic practice to deliver knowledge among key organisations, private and public entities, and decision makers. Furthermore, transferring knowledge compatible with the capacities of intended users will support their understanding of the issues, and in turn their confidence in utilising climate risk information to act (Weaver et al., 2017[126]; Butler et al., 2015[127]; Street et al., 2019[128]).
Inventories of extreme weather events and impacts can provide useful information and exploration of unprecedented events. It identifies damaging hazardous events, and the vulnerabilities and exposure characteristics associated with those hazardous events over time. This allows the exploration of lessons learned from past events that may inform policy processes in response to similar events in the future or benefit other regions that may encounter similar situations. However, even the most comprehensive and systematic hazard databases are not designed to understand the factors influencing the severity of past disasters (including exposure and vulnerability) nor to quantify losses and damages related to an event in part or wholly caused by anthropogenic climate change (Clarke, Otto and Jones, 2021[84]). Clarke, et al. (2021[84]) set out a framework for recording the details of high-impact events on a national scale. Underpinning the development of such database requires collating vast amount of data from various sources, data analysis, machine learning techniques, in addition to best practices and methodologies.
6.2.4. Creating an enabling environment for technology diffusion
Climate risk management relies on the functionality of technologies (i.e. equipment and skill) and their ability to diffuse. In many cases, technology could be developed, available and effective to one context (country, society, socio-economic), but produce different diffusion results in another (OECD, 2021[24]). Failed attempts of technology diffusion are partly due to lack of understanding of local needs. Simply put, access to technology will not ensure local actors have the capacity or the skills to absorb and use the technology. In some cases, the intended user may not fully comprehend how the new technology will benefit risk management. Understanding and accessing the societal context and availability of local resources needed are critical to supporting adoption and absorption of technology. Table 6.2 lists some criteria to consider when selecting specific technologies to underpin risk governance processes. This is followed by a discussion on approaches to address barriers to diffusion to effective implementation and development of technologies.
Accessibility
The losses and damages from climate change will continue to worsen. Access to technologies can support countries in reducing and managing the risks more effectively. Without such access, vulnerable communities may have to implement largely imitation-type technologies (Homberg and McQuistan, 2018[129]), or choose other means that are simple, non-technological and more affordable (Dechezleprêtre et al., 2020[130]). For example, crowdsourced data might be more cost effective in collecting local data for flood maps compared with satellites and remote sensors. However, they are not as reliable for collecting continuous observations. Failure to address this technology gap leads to an incomplete understanding of local exposure and vulnerability to risks. Even though technologies initially may be expensive, they can become more cost effective over time if they benefit from sufficient dissemination (OECD/IEA, 2003[131]). The Santiago Network, established at COP 25 as part of the Warsaw International Mechanism, aims to support developing countries in addressing losses and damages through technical assistance (UNFCCC, n.d.[132]). Developed countries will need to provide financial support to ensure the network can serve developing countries effectively.
Data access might in some cases be restricted by government regulation or commercial copyright, such as privacy protection, data localisation requirements (ADB/OECD, 2020[20]). As such, government investments in data collection infrastructures such as NMHS (see Box 6.1) or initiatives that encourage collaboration between public and private entities could support data needs. Some developing countries may require support in access to data processing and analytical capacity to improve risk management.
Inequality gap
International patent registrations show that innovation in adaptation is concentrated in high-income economies and China (Dechezleprêtre et al., 2020[130]). This suggests that diffusion of innovation and technology is driven by the ability of countries to absorb the technology or innovation (Dechezleprêtre et al., 2020[130]). Some countries most vulnerable to climate change, including LDCs and SIDS, often lack institutional and financial capacity. This leads to limits in research and development opportunities, knowledge sharing and new innovation to address climate risks and the risks of losses and damages (Izumi et al., 2019[133]). Improvements in technological capabilities and infrastructures to uptake and develop technologies in developing countries can be scaled up, ensuring inclusion of vulnerable communities. This will provide society with the backbone needed to prepare for the onset of technological developments to tackle climate risks.
Digital divide
Action such as improving telecommunication networks and infrastructure can help reduce the digital divide. This, in turn, can improve capabilities for countries to uptake technology. Building the physical infrastructure will support uptake of specific technologies and facilitate their diffusion and adoption through various channels over time. For example, the expansion of infrastructures for information communication technologies to improve broadband coverage in developing countries can support observational data collection, early warning communications or facilitate the transfer of financial support via mobile devices in the case of a hazardous event. In Latin America, Brazil, Chile and Colombia have proposed nationwide Wi-Fi access hot spots to ensure digital inclusion (OECD et al., 2020[134]).
Instituting policy and finance mechanisms that support business models that enable a changing technological landscape, can support future technological adaptation. This could include training programmes for individuals and businesses on digital tools available and a focus on strengthening their technical capacity. Supporting climate technology incubators and accelerators can support entrepreneurs in developing business strategies, market connections, and provide sources and procedures to access finance (UNFCCC, 2020[135]).
Technology transfer
Governance arrangements should facilitate inclusive access to technologies and knowledge to reduce and manage losses and damages. International partnerships, trade policies and special trade agreements can provide support for dissemination of technologies across borders (Boldt et al., 2012[5]). For instance, South-South3 and triangular cooperation4 can play a vital role in accelerating climate action and supporting technology and knowledge transfer amongst developing countries. Technologies originating from developing countries may be more suitable and cost-effective for other developing countries as they tend to be attuned to similar local conditions (UNFCCC, 2017[136]). As one strategy, technologies that support climate risk management could be linked with sustainable development strategies and National Adaptation Plans to align technology transfer with broader development goals.
Another option is to tap into new markets or exploit existing markets where developing countries can manage and absorb developing technology (Homberg and McQuistan, 2018[129]). International technology transfers are critical for closing the technology gap between developed and developing countries, including for climate change. However, this approach requires caution. Such increased investments may lead to commercial models that could have disadvantages for SIDS and LDCs (Hewitt et al., 2020[11]). Closer co-operation across countries, regions and at the global level can provide economies of scale to major investments such as high-performance computers, satellites and state-of-the art modelling and forecasting capabilities in LDCs. Such co-operation creates opportunities for learning.
International co-operation
International co-operation and collaboration can support LDCs and SIDS in building their capacity – financial, technical and organisational – to produce WCIS and to develop and adapt approaches to reduce and manage the losses. Development co-operation, for example, can support LDCs and SIDS through capacity development initiatives focused on the collection of observational data, or by sharing data, methods and tools. Further, international partnerships can support governments in integrating climate change considerations – and those related to reducing and managing the risks of losses and damages – into broader development and sectoral policies and practice. International community members may have knowledge and insights of the risks and how technologies were used to address them, information they can share with the countries they are collaborating with. This will increase national capacity to better understand the risks and reduce and manage those risks effectively. It will also create value in climate services, which justifies new investments in those services in different sectors.
Funding
Technological development and dissemination can be supported through funding possibilities within various technology mechanisms. These include the Climate Technology Centre and Network, UNFCCC Technology Executive Committee, South-South and Triangular Co-operation or the Santiago Network for Loss and Damage (part of the Warsaw International Mechanism). These programmes provide expertise and support for vulnerable countries and LDCs through a variety of means. Examples include technical assessments related to technology needs; development and transfer; provisions of funding, training, management; and identification of technology barriers (UNOSSC, n.d.[137]; UNFCCC, n.d.[132]; CTCN, n.d.[138]; UNFCCC, n.d.[139]). Supporting technology diffusion and technological innovation in many developing countries is essential to reduce and manage the risks of losses and damages.
References
[68] Ackerman, E. and M. Koziol (2019), “Tanzania Builds a Drone Industry From Local Know-How and Bamboo”, webpage, https://spectrum.ieee.org/robotics/drones/tanzanias-homegrown-drone-industry-takes-off-on-bamboo-wings (accessed on 30 April 2021).
[20] ADB/OECD (2020), Leveraging Technology and Innovation for Disaster Risk Management and Financing, Asian Development Bank, Manila, https://doi.org/10.22617/tcs200393-2.
[95] AIMES (n.d.), “Analysis, Integration, and Modeling of the Earth System”, webpage, https://aimesproject.org/ (accessed on 18 Oct 2021).
[12] Alley, R., K. Emanuel and F. Zhang (2019), “Advances in weather prediction”, Science, Vol. 363/6425, pp. 342-344, https://doi.org/10.1126/science.aav7274.
[53] Alliance (2021), “Country Hydromet Diagnostics”, webpage, https://alliancehydromet.org/country-hydromet-diagnostics/ (accessed on 15 September 2021).
[10] Allis, E. et al. (2019), “The future of climate services”, No. 68, WMO Bulletin, World Meteorological Organization, Geneva, https://public.wmo.int/en/resources/bulletin/future-of-climate-services.
[6] Arendt-Cassetta, L. (2021), “From digital promise to frontile practice: New and emerging technologies in humanitarian action”, Policy Brief, UN Office for the Coordination of Humanitarian Affairs, New York.
[93] Bathiany, S., J. Hidding and M. Scheffer (2020), “Edge detection reveals abrupt and extreme climate events”, Journal of Climate, Vol. 33/15, pp. 6399-6421, https://doi.org/10.1175/jcli-d-19-0449.1.
[74] Baudoin, M. et al. (2016), “From top-down to ’community-centric’ approaches to early warning systems: Exploring pathways to improve disaster risk reduction through community participation”, International Journal of Disaster Risk Science, Vol. 7/2, pp. 163-174, https://doi.org/10.1007/s13753-016-0085-6.
[91] Beaugrand, G. et al. (2019), “Prediction of unprecedented biological shifts in the global ocean”, Nature Climate Change, Vol. 9/3, pp. 237-243, https://doi.org/10.1038/s41558-019-0420-1.
[55] Bell, A. et al. (2021), “Migration towards Bangladesh coastlines projected to increase with sea-level rise through 2100”, Environmental Research Letters, Vol. 16/2, p. 024045, https://doi.org/10.1088/1748-9326/abdc5b.
[37] Bergen, K. et al. (2019), “Machine learning for data-driven discovery in solid Earth geoscience”, Science, Vol. 363/6433, p. eaau0323, https://doi.org/10.1126/science.aau0323.
[122] Bettini, G., G. Gioli and R. Felli (2020), “Clouded skies: How digital technologies could reshape ’loss and damage’ from climate change”, WIREs Climate Change, Vol. 11/4, https://doi.org/10.1002/wcc.650.
[123] Biffis, E. and E. Chavez (2017), “Satellite data and machine learning for weather risk management and food security”, Risk Analysis, Vol. 37/8, pp. 1508-1521, https://doi.org/10.1111/risa.12847.
[52] Biswas, P. (2016), “India’s Met model for world: Bhutan, 7 others to replicate tech-based advice”, 16 October, The Indian Express, https://indianexpress.com/article/india/india-news-india/indias-met-model-for-world-bhutan-7-others-to-replicate-tech-based-advice-3729310/.
[5] Boldt, J. et al. (2012), Overcoming Barriers to the Transfer and Diffusion of Climate Technologies, TNA Guidebook Series, Risø DTU National Laboratory for Sustainable Energy, UNEP Risø Centre on Energy, Climate and Sustainable Development, https://unepdtu.org/publications/overcoming-barriers-to-the-transfer-and-diffusion-of-climate-technologies/.
[32] Bony, S. et al. (2015), “Clouds, circulation and climate sensitivity”, Nature Geoscience, Vol. 8/4, pp. 261-268, https://doi.org/10.1038/ngeo2398.
[62] Bragais, M. et al. (2016), “Vulnerability assessment using Lidar data”, The International Archives of the Photogrammetry, Remote Sensing and Spatial Information Sciences, Vol. XLI-B8, pp. 1397-1401, https://doi.org/10.5194/isprs-archives-xli-b8-1397-2016.
[70] Brody, S. et al. (2007), “Examining the relationship between physical vulnerability and public perceptions of global climate change in the United States”, Environment and Behavior, Vol. 40/1, pp. 72-95, https://doi.org/10.1177/0013916506298800.
[27] Brönnimann, S. et al. (2018), “A roadmap to climate data rescue services”, Geoscience Data Journal, Vol. 5/1, pp. 28-39, https://doi.org/10.1002/gdj3.56.
[25] Bruno Soares, M., M. Daly and S. Dessai (2018), “Assessing the value of seasonal climate forecasts for decision‐making”, WIREs Climate Change, Vol. 9/4, https://doi.org/10.1002/wcc.523.
[110] Buckle, S. et al. (2020), “Addressing the COVID-19 and climate crises: Potential economic recovery pathways and their implications for climate change mitigation, NDCs and broader socio-economic goals”, OECD/IEA Climate Change Expert Group Papers, No. 2020/04, OECD Publishing, Paris, https://dx.doi.org/10.1787/50abd39c-en.
[88] Bury, T., C. Bauch and M. Anand (2020), “Detecting and distinguishing tipping points using spectral early warning signals”, Journal of The Royal Society Interface, Vol. 17/170, p. 20200482, https://doi.org/10.1098/rsif.2020.0482.
[127] Butler, J. et al. (2015), “Integrating top-down and bottom-up adaptation planning to build adaptive capacity: A structured learning approach”, Coastal Management, Vol. 43/4, pp. 346-364, https://doi.org/10.1080/08920753.2015.1046802.
[50] CAPRA (n.d.), “CAPRA Probabilistic Risk Assessment Platform”, webpage, https://ecapra.org/ (accessed on 17 August 2021).
[57] Chakraborty, T. et al. (2020), “A spatially explicit surface urban heat island database for the United States: Characterization, uncertainties, and possible applications”, ISPRS Journal of Photogrammetry and Remote Sensing, Vol. 168, pp. 74-88, https://doi.org/10.1016/j.isprsjprs.2020.07.021.
[9] CIF (2020), Strengthening Weather and Climate Information Serices: Highlights from PPCR Supported Projects, Climate Investment Funds, Washington, DC, https://www.climateinvestmentfunds.org/sites/cif_enc/files/knowledge-documents/ppcr_resilience_series_weather_and_climate_information_services.pdf.
[84] Clarke, B., F. Otto and R. Jones (2021), “Inventories of extreme weather events and impacts: Implications for loss and damage from and adaptation to climate extremes”, Climate Risk Management, Vol. 32, p. 100285, https://doi.org/10.1016/j.crm.2021.100285.
[29] Copernicus (n.d.), “Copernicus Key Products and Services”, webpage, https://climate.copernicus.eu/ (accessed on 26 July 2021).
[47] Cornforth, R., C. Petty and G. Walker (2021), “Supporting climate-resilient planning at national and district levels: A pathway to multi-stakeholder decision-making in Uganda”, in Climate Risk in Africa, Springer International Publishing, Cham, https://doi.org/10.1007/978-3-030-61160-6_8.
[138] CTCN (n.d.), “About the Climate Technology Centre and Network (CTCN)”, webpage, https://www.ctc-n.org/about-ctcn (accessed on 22 September 2021).
[60] de Bruijn, J. et al. (2019), “A global database of historic and real-time flood events based on social media”, Scientific Data, Vol. 6/1, https://doi.org/10.1038/s41597-019-0326-9.
[130] Dechezleprêtre, A. et al. (2020), Invention and Global Diffusion of Technologies for Climate Change Adaptation: A Patent Analysis, International Bank for Reconstruction and Development/World Bank, Washington, DC.
[51] Dickson, E. et al. (2012), Urban Risk Assessments: Understanding Disaster and Climate Risk in Cities, World Bank, Washington, DC, https://www.worldbank.org/en/topic/urbandevelopment/publication/urban-risk-assessments.
[43] Dinku, T. et al. (2017), “Enhancing National Climate Services (ENACTS) for development in Africa”, Climate and Development, Vol. 10/7, pp. 664-672, https://doi.org/10.1080/17565529.2017.1405784.
[86] Ditlevsen, P. and S. Johnsen (2010), “Tipping points: Early warning and wishful thinking”, Geophysical Research Letters, Vol. 37/19, https://doi.org/10.1029/2010gl044486.
[102] Econadapt (n.d.), “Econadapt Toolbox, Methods”, webpage, https://econadapt-toolbox.eu/methods (accessed on 21 September 2021).
[28] ESA (n.d.), “Earth Observation Information Discovery Platform”, webpage, https://earth.esa.int/eogateway (accessed on 4 June 2021).
[94] ESA (n.d.), “Remote Sensing Of Tipping Points In The Climate System”, webpage, https://climate.esa.int/en/news-events/remote-sensing-tipping-points-climate-system/ (accessed on 18 Oct 2021).
[82] Faiyetole, A. (2018), “Potentialities of space-based systems for monitoring climate policies and mitigation of climate process drivers”, Astropolitics, Vol. 16/1, pp. 28-48, https://doi.org/10.1080/14777622.2018.1436329.
[107] Fricko, O. et al. (2017), “The marker quantification of the Shared Socioeconomic Pathway 2: A middle-of-the-road scenario for the 21st century”, Global Environmental Change, Vol. 42, pp. 251-267, https://doi.org/10.1016/j.gloenvcha.2016.06.004.
[59] Frigerio, S. et al. (2018), “Hands-on experience of crowdsourcing for flood risks. An android mobile application tested in Frederikssund, Denmark”, International Journal of Environmental Research and Public Health, Vol. 15/9, p. 1926, https://doi.org/10.3390/ijerph15091926.
[106] Fujimori, S. et al. (2017), “SSP3: AIM implementation of Shared Socioeconomic Pathways”, Global Environmental Change, Vol. 42, pp. 268-283, https://doi.org/10.1016/j.gloenvcha.2016.06.009.
[83] GEO (2018), Geo Work Programme and The Paris Agreement, UNFCCC, Geneva, https://unfccc.int/sites/default/files/resource/2.30%20GEO-WP.pdf.
[97] Geo-Wiki (n.d.), “Risk Geo-Wiki”, webpage, https://geo-wiki.org/branches/risk/ (accessed on 18 Oct 2021).
[116] GFDRR (2019), Information and Communication Technology for Disaser Risk Managment in Japan, World Bank, Washington, DC.
[46] GFDRR (2016), Solving the Puzzle: Innovating to Reduce Risk; Written Contributions, World Bank, Washington, DC.
[44] Gil, Y. et al. (2018), “Intelligent systems for geosciences”, Communications of the ACM, Vol. 62/1, pp. 76-84, https://doi.org/10.1145/3192335.
[120] Goldby, M. et al. (2019), “Triggering innovation: How smart contracts bring policies to life”, Emerging Risks Report 2019, Lloyd’s and Centre for Commercial Law Studies, London, https://assets.lloyds.com/assets/pdf-triggering-innovation-how-smart-contracts-bring-policies-to-life/1/pdf-triggering-innovation-how-smart-contracts-bring-policies-to-life.pdf.
[72] Granderson, A. (2017), “The role of traditional knowledge in building adaptive capacity for climate change: Perspectives from Vanuatu”, Weather, Climate, and Society, Vol. 9/3, pp. 545-561, https://doi.org/10.1175/wcas-d-16-0094.1.
[105] Grubler, A. et al. (2018), “A low energy demand scenario for meeting the 1.5 °C target and sustainable development goals without negative emission technologies”, Nature Energy, Vol. 3/6, pp. 515-527, https://doi.org/10.1038/s41560-018-0172-6.
[92] Gsell, A. et al. (2016), “Evaluating early-warning indicators of critical transitions in natural aquatic ecosystems”, Proceedings of the National Academy of Sciences, Vol. 113/50, pp. E8089-E8095, https://doi.org/10.1073/pnas.1608242113.
[111] Guo, H., L. Zhang and L. Zhu (2015), “Earth observation big data for climate change research”, Advances in Climate Change Research, Vol. 6/2, pp. 108-117, https://doi.org/10.1016/j.accre.2015.09.007.
[42] Hallegatte, S. (2012), A Cost Effective Solution to Reduce Disaster Losses in Developing Countries: Hydro-Meteorological Services, Early Warning and Evacuation, World Bank, Washington, DC, https://openknowledge.worldbank.org/bitstream/handle/10986/9359/WPS6058.pdf?s.
[99] Hemmerling, S. et al. (2019), “Elevating local knowledge through participatory modeling: active community engagement in restoration planning in coastal Louisiana”, Journal of Geographical Systems, Vol. 22/2, pp. 241-266, https://doi.org/10.1007/s10109-019-00313-2.
[11] Hewitt, C. et al. (2020), “Making society climate resilient: International progress under the Global Framework for Climate Services”, Bulletin of the American Meteorological Society, Vol. 101/2, pp. E237-E252, https://doi.org/10.1175/bams-d-18-0211.1.
[129] Homberg, M. and C. McQuistan (2018), “Technology for climate justice: A reporting framework for loss and damage as part of key global agreements”, in Loss and Damage from Climate Change, Climate Risk Management, Policy and Governance, Springer International Publishing, Cham, https://doi.org/10.1007/978-3-319-72026-5_22.
[16] Hooker, J., G. Duveiller and A. Cescatti (2018), “A global dataset of air temperature derived from satellite remote sensing and weather stations”, Scientific Data, Vol. 5/1, https://doi.org/10.1038/sdata.2018.246.
[76] Hoskins, B. (2012), “The potential for skill across the range of the seamless weather-climate prediction problem: A stimulus for our science”, Quarterly Journal of the Royal Meteorological Society, Vol. 139/672, pp. 573-584, https://doi.org/10.1002/qj.1991.
[56] Hsu, A. et al. (2021), “Disproportionate exposure to urban heat island intensity across major US cities”, Nature Communications, Vol. 12/1, https://doi.org/10.1038/s41467-021-22799-5.
[103] IEA (2021), Financing Clean Energy Transitions in Emerging and Developing Economies, IEA, Paris.
[121] Inclusivity Solutions (2020), Hollard Insurance and FNB Zambia Unveil New Insurance Product to Protect Small Businesses from Economic Shocks, https://inclusivitysolutions.com/hollard-insurance-and-fnb-zambia-unveil-new-insurance-product/.
[124] InsuResilience (2021), “Crop Insurance Program for Smallholder Farmers in Kenya”, webpage, https://www.insuresilience-solutions-fund.org/news-events (accessed on 15 September 2021).
[79] IPCC (2021), Climate Change 2021: The Physical Science Basis. Contribution of Working Group I to the Sixth Assessment Report of the Intergovernmental Panel on Climate Change, Masson-Delmotte, V. et al. (eds.), Cambridge University Press, Cambridge, United Kingdom, https://www.ipcc.ch/report/ar6/wg1/downloads/report/IPCC_AR6_WGI_Full_Report.pdf.
[71] IPCC (2019), Climate Change and Land: an IPCC special report on climate change, desertification, land degradation, sustainable land management, food security, and greenhouse gas fluxes in terrestrial ecosystems, Intergovernmental Panel on Climate Change, Geneva.
[104] IPCC (2018), IPCC Special Report Global Warming of 1.5 ºC, Intergovernmental Panel on Climate Change, Geneva.
[77] IPCC (2013), Climate Change 2013: The Physical Science Basis. Contribution of Working Group I to the Fifth Assessment Report of the Intergovernmental Panel on Climate Change, Cambridge University Press, Cambridge, United Kingdom, https://www.ipcc.ch/report/ar5/wg1/.
[4] IRGC (2017), Introduction to the IRGC Risk Governance Framework, revised version, EPFL International Risk Governance Center, Lausanne, https://doi.org/10.5075/epfl-irgc-233739.
[19] ITU (2020), Space Science for Achieving the Sustainable Development Goals, International Telecommunication Union, Geneva.
[22] ITU (2016), Harnessing the Internet of Things for Global Development, International Telecommunication Union, Geneva, https://www.itu.int/en/action/broadband/Documents/Harnessing-IoT-Global-Development.pdf.
[133] Izumi, T. et al. (2019), “Disaster risk reduction and innovations”, Progress in Disaster Science, Vol. 2, p. 100033, https://doi.org/10.1016/j.pdisas.2019.100033.
[26] Jones, T. et al. (2015), “Simultaneous radar and satellite data storm-scale assimilation using an Ensemble Kalman Filter approach for 24 May 2011”, Monthly Weather Review, Vol. 143/1, pp. 165-194, https://doi.org/10.1175/mwr-d-14-00180.1.
[36] Karpatne, A. et al. (2017), “Theory-guided data science: A new paradigm for scientific discovery from data”, IEEE Transactions on Knowledge and Data Engineering, Vol. 29/10, pp. 2318-2331, https://doi.org/10.1109/tkde.2017.2720168.
[21] Khan, A., S. Gupta and S. Gupta (2020), “Multi-hazard disaster studies: Monitoring, detection, recovery, and management, based on emerging technologies and optimal techniques”, International Journal of Disaster Risk Reduction, Vol. 47, p. 101642, https://doi.org/10.1016/j.ijdrr.2020.101642.
[1] Klinke, A. and O. Renn (2012), “Adaptive and integrative governance on risk and uncertainty”, Journal of Risk Research, Vol. 15/3, pp. 273-292, https://doi.org/10.1080/13669877.2011.636838.
[108] Kriegler, E. et al. (2017), “Fossil-fueled development (SSP5): An energy and resource intensive scenario for the 21st century”, Global Environmental Change, Vol. 42, pp. 297-315, https://doi.org/10.1016/j.gloenvcha.2016.05.015.
[63] Kwan, M. and D. Ransberger (2010), “LiDAR assisted emergency response: Detection of transport network obstructions caused by major disasters”, Computers, Environment and Urban Systems, Vol. 34/3, pp. 179-188, https://doi.org/10.1016/j.compenvurbsys.2010.02.001.
[87] Lenton, T. (2011), “Early warning of climate tipping points”, Nature Climate Change, Vol. 1/4, pp. 201-209, https://doi.org/10.1038/nclimate1143.
[80] Lenton, T. et al. (2019), “Climate tipping points – too risky to bet against”, Nature, Vol. 575/7784, pp. 592-595, https://doi.org/10.1038/d41586-019-03595-0.
[34] Liu, Y. et al. (2016), “Application of deep convolutional neural networks for detecting extreme weather in climate datasets”, Computer Vision and Pattern Recognition, https://arxiv.org/abs/1605.01156.
[65] Marder, J. (2019), “NASA Tracks Wildfires From Above to Aid Firefighters Below”, webpage, https://www.nasa.gov/feature/goddard/2019/nasa-tracks-wildfires-from-above-to-aid-firefighters-below (accessed on 21 June 2021).
[98] Mechler, R. et al. (2018), “Supporting Climate Risk Management at Scale. Insights from the Zurich Flood Resilience Alliance Partnership Model Applied in Peru & Nepal”, in Loss and Damage from Climate Change, Climate Risk Management, Policy and Governance, Springer International Publishing, Cham, https://doi.org/10.1007/978-3-319-72026-5_17.
[69] Michels, M., C. von Hobe and O. Musshoff (2020), “A trans-theoretical model for the adoption of drones by large-scale German farmers”, Journal of Rural Studies, Vol. 75, pp. 80-88, https://doi.org/10.1016/j.jrurstud.2020.01.005.
[67] Minges, M. (2019), Disruptive Technologies and their Use in Disaster Risk Reduction and Management, International Telecommunication Union, Geneva, https://www.itu.int/en/ITU-D/Emergency-Telecommunications/Documents/2019/GET_2019/Disruptive-Technologies.pdf.
[45] Mohanty, A. (2020), Preparing India for Extreme Climate Events: Mapping Hotspots and Response Mechanisms, Council on Energy, Environment and Water, New Delhi, https://www.ceew.in/sites/default/files/CEEW-Preparing-India-for-extreme-climate-events_10Dec20.pdf.
[101] Newman, J. et al. (2017), “Review of literature on decision support systems for natural hazard risk reduction: Current status and future research directions”, Environmental Modelling & Software, Vol. 96, pp. 378-409, https://doi.org/10.1016/j.envsoft.2017.06.042.
[35] Nieves, V., C. Radin and G. Camps-Valls (2021), “Predicting regional coastal sea level changes with machine learning”, Scientific Reports, Vol. 11/1, pp. 358-361, https://doi.org/10.1038/s41598-021-87460-z.
[90] NOAA (n.d.), “Argo Center”, webpage, https://www.aoml.noaa.gov/phod/argo/ (accessed on 21 September 2021).
[109] O’Neill, B. et al. (2017), “The roads ahead: Narratives for shared socioeconomic pathways describing world futures in the 21st century”, Global Environmental Change, Vol. 42, pp. 169-180, https://doi.org/10.1016/j.gloenvcha.2015.01.004.
[30] Oasis (2021), “An Open Source Catastrophe Modelling Platform”, webpage, https://oasislmf.org/ (accessed on 7 May 2021).
[24] OECD (2021), Strengthening Climate Resilience: Guidance for Governments and Development Co-operation, OECD Publishing, Paris, https://dx.doi.org/10.1787/4b08b7be-en.
[134] OECD et al. (2020), Latin American Economic Outlook 2020: Digital Transformation for Building Back Better, OECD Publishing, Paris, https://dx.doi.org/10.1787/e6e864fb-en.
[131] OECD/IEA (2003), Technology Innovation, Development and Diffusion, OECD Publishing, Paris, https://www.oecd.org/env/cc/2956490.pdf.
[33] Papale, D. and R. Valentini (2003), “A new assessment of European forests carbon exchanges by eddy fluxes and artificial neural network spatialization”, Global Change Biology, Vol. 9/4, pp. 525-535, https://doi.org/10.1046/j.1365-2486.2003.00609.x.
[49] PCRAFI (n.d.), “Pacific Risk Information System Community”, webpage, http://pcrafi.spc.int/ (accessed on 17 August 2021).
[100] PIK (n.d.), “AGRICA - Climate Risk Analyses for Identifying and Weighing Adaptation Strategies in sub-Saharan Africa”, webpage, https://www.pik-potsdam.de/en/institute/departments/climate-resilience/projects/project-pages/agrica/agrica-sv-giz-climate-project (accessed on 25 September 2020).
[64] Rahman, M. and P. Thakur (2018), “Detecting, mapping and analysing of flood water propagation using synthetic aperture radar (SAR) satellite data and GIS: A case study from the Kendrapara District of Orissa State of India”, The Egyptian Journal of Remote Sensing and Space Science, Vol. 21, pp. S37-S41, https://doi.org/10.1016/j.ejrs.2017.10.002.
[125] Raithatha, R. and D. Tricarico (2019), Mobile Technology for Rural Climate Resilience: The Role of Mobile Operators in Bridging the Data Gap, GSMA AgriTech Programme, London, https://www.gsma.com/mobilefordevelopment/wp-content/uploads/2019/10/GSMA_AgriTech_Climate_Report.pdf.
[48] Red Cross 510 (2021), “510.Global”, webpage, http://510.global (accessed on 4 June 2021).
[7] Reichstein, M. et al. (2019), “Deep learning and process understanding for data-driven Earth system science”, Nature, Vol. 566/7743, pp. 195-204, https://doi.org/10.1038/s41586-019-0912-1.
[89] Rosier, S. et al. (2021), “The tipping points and early warning indicators for Pine Island Glacier, West Antarctica”, The Cryosphere, Vol. 15/3, pp. 1501-1516, https://doi.org/10.5194/tc-15-1501-2021.
[117] Rühmann, F. et al. (2020), “Can blockchain technology reduce the cost of remittances?”, OECD Development Co-operation Working Papers, No. 73, OECD Publishing, Paris, https://dx.doi.org/10.1787/d4d6ac8f-en.
[58] Salvati, P. et al. (2021), “Acquiring vulnerability indicators to geo-hydrological hazards: An example of mobile phone-based data collection”, International Journal of Disaster Risk Reduction, Vol. 55, p. 102087, https://doi.org/10.1016/j.ijdrr.2021.102087.
[119] Sams, J. (2020), “Not all homes in wildfire zones are uninsurable. Here’s how insurers can tell”, 22 May, Insurance Journal, https://www.insurancejournal.com/news/national/2020/05/22/569684.htm.
[66] Sarker, M. et al. (2020), “Disaster resilience through big data: Way to environmental sustainability”, International Journal of Disaster Risk Reduction, Vol. 51, https://doi.org/10.1016/j.ijdrr.2020.101769.
[3] Schweizer, P. and O. Renn (2019), “Governance of systemic risks for disaster prevention and mitigation”, Disaster Prevention and Management: An International Journal, Vol. 28/6, pp. 862-874, https://doi.org/10.1108/dpm-09-2019-0282.
[31] Shepherd, T. (2014), “Atmospheric circulation as a source of uncertainty in climate change projections”, Nature Geoscience, Vol. 7/10, pp. 703-708, https://doi.org/10.1038/ngeo2253.
[41] Shove, E. (2010), “Beyond the ABC: Climate Change Policy and Theories of Social Change”, Environment and Planning A: Economy and Space, Vol. 42/6, pp. 1273-1285, https://doi.org/10.1068/a42282.
[115] Shrestha, M. et al. (2021), “The last mile: Flood risk communication for better preparedness in Nepal”, International Journal of Disaster Risk Reduction, Vol. 56, p. 102118, https://doi.org/10.1016/j.ijdrr.2021.102118.
[75] Shukla, J. et al. (2010), “Toward a new generation of world climate research and computing facilities”, Bulletin of the American Meteorological Society, Vol. 91/10, pp. 1407-1412, https://doi.org/10.1175/2010bams2900.1.
[73] Sommer, L. (2020), “To manage wildfire, California looks to what tribes have known all along”, 24 August, NPR, https://www.npr.org/2020/08/24/899422710/to-manage-wildfire-california-looks-to-what-tribes-have-known-all-along.
[81] Stokke, O. and O. Young (2017), “Integrating Earth observation systems and international environmental regimes”, in Satellite Earth Observations and their Impact on Society and Policy, Springer Singapore, Singapore, https://doi.org/10.1007/978-981-10-3713-9_16.
[128] Street, R. et al. (2019), “How could climate services support disaster risk reduction in the 21st century”, International Journal of Disaster Risk Reduction, Vol. 24/March, pp. 28-33, https://doi.org/10.1016/j.ijdrr.2018.12.001.
[18] Sun, Q. et al. (2018), “A review of global precipitation data sets: Data sources, estimation, and intercomparisons”, Reviews of Geophysics, Vol. 56/1, pp. 79-107, https://doi.org/10.1002/2017rg000574.
[85] Swingedouw, D. et al. (2020), “Early warning from space for a few key tipping points in physical, biological, and social-ecological systems”, Surveys in Geophysics, Vol. 41/6, pp. 1237-1284, https://doi.org/10.1007/s10712-020-09604-6.
[113] UN (2021), “UN-Spider.org”, webpage, https://www.un-spider.org/projects/evidenz/background-information (accessed on 31 May 2021).
[17] UNCTAD (2021), Exploring Space Technologies for Sustainable Development, United Nations Conference on Trade and Development, Geneva, https://unctad.org/system/files/official-document/dtlstict2021d1_en.pdf.
[135] UNFCCC (2020), Policy Brief: Technologies for Averting, Minimising and Addressing Loss and Damage in Coastal Zones, United Nations, Bonn.
[136] UNFCCC (2017), South–South cooperation and triangular cooperation on technologies for adaptation water and agriculture sectors, UNFCCC, Bonn.
[2] UNFCCC (2012), The National Adaptation Plan Process: A Brief Overview, United Nations Framework Convention on Climate Change, Bonn, https://unfccc.int/files/adaptation/application/pdf/nap_overview.pdf.
[132] UNFCCC (n.d.), “About the Santiago Network”, webpage, https://unfccc.int/santiago-network/about (accessed on 22 September 2021).
[139] UNFCCC (n.d.), “Technology Executive Committee”, webpage, https://unfccc.int/ttclear/tec (accessed on 22 September 2021).
[137] UNOSSC (n.d.), “About South-South and Triangular Cooperation”, webpage, https://www.unsouthsouth.org/about/about-sstc/ (accessed on 22 September 2021).
[96] van Aalst, M., T. Cannon and I. Burton (2008), “Community level adaptation to climate change: The potential role of participatory community risk assessment”, Global Environmental Change, Vol. 18/1, pp. 165-179, https://doi.org/10.1016/j.gloenvcha.2007.06.002.
[126] Weaver, C. et al. (2017), “Reframing climate change assessments around risk: Recommendations for the US National Climate Assessment”, Environmental Research Letters, Vol. 12/9, https://doi.org/10.1088/1748-9326/aa846a.
[78] WMO (2021), “New climate predictions increase likelihood of temporarily reaching 1.5 °C in next 5 years”, 27 May, Press Release, World Meteorological Organization, Geneva, https://public.wmo.int/en/media/press-release/new-climate-predictions-increase-likelihood-of-temporarily-reaching-15-%C2%B0c-next-5.
[114] WMO (2020), 2020 State of Climate Services: Risk Information and Early Warning Systems, World Meteorological Organization, Geneva, https://library.wmo.int/doc_num.php?explnum_id=10385.
[39] WMO (2020), “New climate predictions assess global temperatures in coming five years”, 8 July, News Release, World Meteorological Organization, Geneva, https://public.wmo.int/en/media/press-release/new-climate-predictions-assess-global-temperatures-coming-five-years.
[14] WMO (2020), “The Systematic Observations Financing Facility: How will it work?”, Information Brief, World Meteorological Organization, Geneva, https://library.wmo.int/doc_num.php?explnum_id=10378.
[54] WMO (2020), “The value of Surface-Based Meteorological Observational Data: Costs and benefits of the Global Basic Observing Network”, Information Brief, World Meteorological Organization, Geneva, https://library.wmo.int/doc_num.php?explnum_id=10376.
[23] WMO (2015), Status of the Global Observing System for Climate, World Meteorological Organization, Geneva, https://library.wmo.int/doc_num.php?explnum_id=7213.
[8] WMO (2015), Valuing Weather and Climate: Economic Assessment of Meteorological and Hydrological Services, World Meteorological Organization, Geneva, https://library.wmo.int/doc_num.php?explnum_id=3314.
[38] WMO (n.d.), “Global Producing Centres for Long-Range Forecasts”, webpage, https://community.wmo.int/global-producing-centres-long-range-forecasts (accessed on 23 September 2021).
[40] WMO (n.d.), “Regional Climate Outlook Forums”, webpage, https://public.wmo.int/en/our-mandate/climate/regional-climate-outlook-products.
[15] WMO and GFCS (2019), “2019 State of climate services”, Working Paper, No. 1242, World Meteorological Organization, Geneva, https://library.wmo.int/doc_num.php?explnum_id=10089.
[118] World Bank (2019), “Blockchain: How the Fourth Industrial Revolution can help accelerate progress towards development”, 24 January, World Bank, Washington, DC, https://www.worldbank.org/en/news/feature/2019/01/24/blockchain-como-asegurarse-que-cada-dolar-llegue-a-quien-lo-necesita.
[61] Yu, M., C. Yang and Y. Li (2018), “Big data in natural disaster management: A Review”, Geosciences, Vol. 8/5, p. 165, https://doi.org/10.3390/geosciences8050165.
[112] ZFL (2021), “EvIDENz”, webpage, https://www.zfl.uni-bonn.de/research/projects/ (accessed on 7 June 2021).
[13] Zhang, F. and Y. Weng (2015), “Predicting hurricane intensity and associated hazards: A five-year real-time forecast experiment with assimilation of airborne Doppler radar observations”, Bulletin of the American Meteorological Society, Vol. 96/1, pp. 25-33, https://doi.org/10.1175/bams-d-13-00231.1.
Notes
← 1. IoT is the convergence of networks of physical objects, such as software, sensors and other Internet-connected devices used to exchange and monitor information in real-time e.g. temperature, water quality, emissions, smoke, humidity.
← 2. Using FAO’s figure of around 5 billion hectares of agricultural land globally – see www.fao.org/sustainability/news/detail/en/c/1274219/.
← 3. South–South cooperation is a “broad framework of collaboration among countries of the South in the political, economic, social, cultural, environmental and technical domains. Involving two or more developing countries, it can take place on a bilateral, regional, intraregional or interregional basis. Developing countries share knowledge, skills, expertise and resources to meet their development goals through concerted efforts” (UNOSSC, n.d.[137])
← 4. Triangular cooperation is “collaboration in which traditional donor countries and multilateral organizations facilitate South–South initiatives through the provision of funding, training, management and technological systems as well as other forms of support” (UNOSSC, n.d.[137]).