copy the linklink copied!Annex B. Overview of reviewed countries
copy the linklink copied!Geographical and economic characteristics
Reviewed countries display a wide diversity of size, geographical location, natural conditions and economic situation. They cover all continents except Africa, and represent a variety of OECD, EU and G20 countries (Table A B.1).
Australia and Canada have the lowest population density (less than four inhabitants per km2 on average but the population is highly concentrated in the most hospitable areas), and higher arable land area per capita (Figure A B.1). This facilitated the development of rather land extensive farming systems, with relatively low impact on the environment, although water availability limits agricultural development in some regions of Australia. In some countries with a more sizeable population, like Turkey, Korea and the People’s Republic of China (hereafter “China”), freshwater resources per capita are much smaller than in Australia.
With over 500 inhabitants per km2, population density is the highest in Korea and the Netherlands. As a result, arable land per capita is very limited, and production systems use land intensively. In contrast, countries such as Brazil, Estonia, Latvia and the United States have relatively low population density (less than 40 inhabitants per km2) and high arable land area per capita. In these countries, crop production is relatively extensive, with lower variable input use per ha. This also allows the development of livestock production systems based on grass and own-cultivated feed crops, although non-ruminant production systems based on purchased inputs also exist.
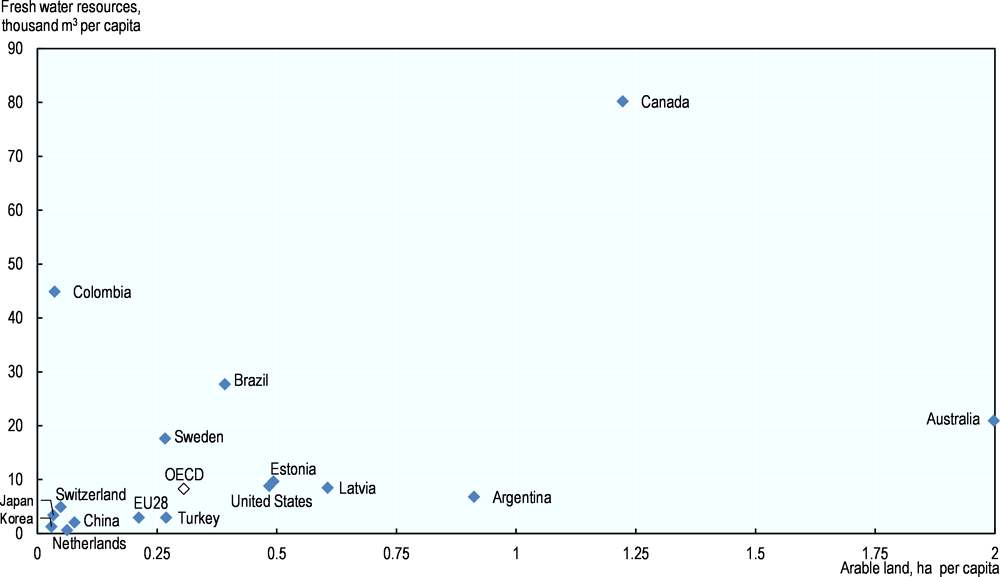
Source: World Bank (2018), World Development Indicators, https://data.worldbank.org.
copy the linklink copied!Food and agricultural structural and trade characteristics
The food and agricultural sectors of the reviewed countries also differ in terms of size and structural characteristics. Primary agriculture accounts for a small share of gross value added (GVA) and employment in most OECD countries (Table A B.2) However, it can be more important in some regions within countries, as outlined in the Australian review. In comparison, agriculture accounts for a larger share of the economy in Turkey, and the two emerging economies reviewed, China and Brazil, in particular when considering its contribution to employment.
Beyond primary agriculture, the whole food and agriculture system has a larger importance for the economy, which is not often measured in official statistics. When the whole supply chain is considered, from input suppliers to agriculture, food processing, wholesaling, and food services, the food system accounts for about 6% of GVA in Canada and the United States, and over 10% in the Netherlands.1 The share of the food system in employment is more substantial because food retailing and food services are labour intensive activities. It reached 12% of total Canadian employment in 2012. However, the extent to which the food wholesale, retail and service sectors rely on domestic agricultural production varies by country and sub-sector. For example in the Netherlands, just over half of the activities of the food system are to a greater or lesser extent directly related to domestic agricultural and horticultural production, and they account for about 15% of the GVA and employment of the whole food system.
Reviewed countries also cover a large range of agro-food trade situations: initially tested on large, competitive exporters of agricultural commodities, the Framework has subsequently been applied to both net exporters and importers of agri-food products (Table A B.1). Among net exporters of agro-food products, Brazil is the country where agro-food products account for the largest share — above one-third in 2016 — of all exports, followed by the Netherlands (18%) and Australia (15%). The share of agro-food imports is usually higher in smaller or northern countries, which do not produce the large range of products that consumers demand, such as Mediterranean and tropical products, and are part of the EU Common market. For example, while the Dutch agro-food trade balance is positive, agro-food products account for 13% of Dutch imports, reflecting the reliance on imported feed for livestock production, and the importance of domestic agro-food processing industries based on imported products (e.g. coffee and cocoa).
In large exporters of agro-food products, primary products for industry often account for a large share of agro-food exports, reflecting the competitiveness of their agriculture (Figure A B.2). A high share of primary products for consumption in exports often reflects fruits and vegetable specialisation as in Colombia, Turkey and China. A number of European and Asian countries that are net importers of agro-food products have a high share of processed products for consumption in their agro-food exports, indicating they are specialised in high value products, which can be based on imported agricultural products.
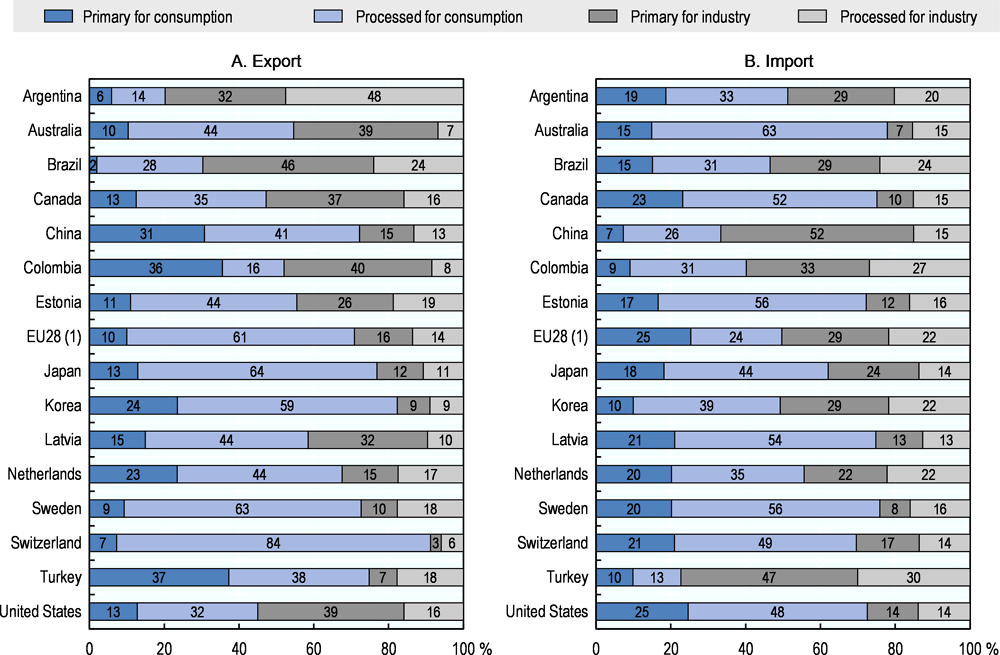
Notes: Numbers may not add up to 100 due to rounding. Agro-food definition does not include fish and fish products. Agro-food codes in H0: 01, 02, 04 to 24 (excluding 1504, 1603, 1604 and 1605), 3301, 3501 to 3505, 4101 to 4103, 4301, 5001 to 5003, 5101 to 5103, 5201 to 5203, 5301, 5302, 290543/44, 380910, 382360.
1. Extra-EU trade.
Source: UN (2018b), ComTrade Database, https://comtrade.un.org/ (accessed August 2018).
Within and across countries, land ownership, farm size and production systems vary widely. Family farms dominate in most countries, although they can be very large, with a complex management and ownership structure, for example in the United States. Large corporate farms are relatively more frequent in the Estonia dairy sector and Latvian crop sector. Farm size varies by region and type of production. For example, in China, Japan and Korea average crop farm size is less than 2 ha, while it reaches about 500 ha in Canada (Figure A B.3).
In many countries, technological advances and increased labour productivity growth have enabled farms to increase scale of operations and consolidate. Farm consolidation has occurred at a fast pace in some countries but remains slow in others. As a result, there are large differences in farm size distribution (Figure A B.3). For crop farms, the mid-point farm size, which is the median of the distribution of land (or production, or livestock numbers) by farm size, increased significantly in the 2000s in all countries for which data are available. In 2010, it ranged from less than 5 ha in Japan and Korea to over 800 ha in Canada, where the size increase has been particularly large.
The growth in dairy farm size, as measured by the number of animals, in the 2000s has been particularly spectacular in the United States, where the mid-point farm size reached 1 140 dairy cows per farm. Significant growth also occurred in many EU Member States, where former EU dairy production quotas were managed flexibly. In Canada, growth in dairy farm size is also significant but not as large as that in crop farms, or in US dairy farms. Despite consolidation, most countries have a wide diversity of farms, in terms of size and production systems. The persistence of smaller farms is observed in countries with no obstacles to structural adjustment, such as the United States,2 and in this case may reflect alternative choices of lifestyle (hobby, part-time) or strategy. As with other structural characteristics, farm size may affect productivity and environmental sustainability performance, as discussed below.
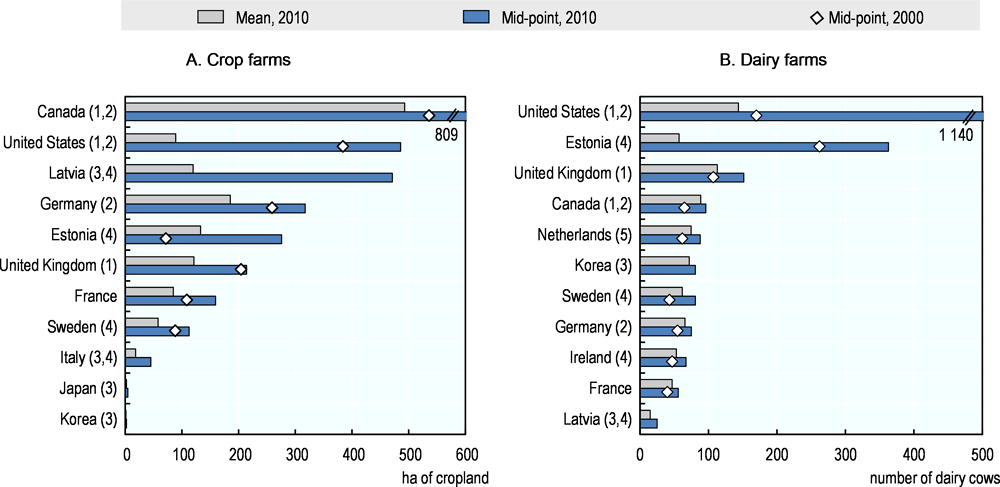
Notes: Panel A: The mid-point farm size applied to crop farms is the hectare-weighted median, which corresponds to a farm size that separates the farm size distribution into two parts: 50% of the total area of the national farmland operated by the crop farms of a larger size and the other 50% by the crop farms of smaller size than the hectare-weighted median. Panel B: The mid-point statistics used to measure the distribution of dairy farm size is the livestock unit-weighted median.
1. 2010 is replaced by the nearest available year: by 2009 for the United Kingdom (England), by 2011 for Canada, and by 2012 for the United States.
2. 2000 is replaced by the nearest available year: by 1997 for the United States, by 2001 for Canada, and by 2003 for Germany.
3. Mid-point 2000 data are not available for Italy, Japan, Latvia and Korea (crop farms); and for Korea and Latvia (dairy farms).
4. Based on sample data. For Latvia and Estonia, it excludes farms with a Standard Output less than EUR 4 000, that is 64% of Latvian farms.
5. For the Netherlands, data are on all farms having cropland, dairy cows and pigs, respectively.
Sources: Bokusheva and Kimura (2016), “Cross-Country Comparison of Farm Size Distribution”, Tables B3 and B4, https://dx.doi.org/10.1787/5jlv81sclr35-en; OECD (2018c), Innovation, Agricultural Productivity and Sustainability in Korea, https://doi.org/10.1787/9789264307773-en.
The agri-food industry also includes a diversity of firms. Structural characteristics of input suppliers and food processing industries also affect the productivity performance of the whole system. Technological, product and marketing innovations are essential to maintain competitiveness along the food chain. In most reviewed countries, open markets facilitate access to good quality inputs and innovative technologies. High and increasing concentration in seed or farm machinery sectors has raised some concerns, although competition authorities have ensured sufficient competition to limit market power. Diverse and competitive food processing companies contributed to agro-food production and export growth in the United States and the Netherlands. However, in other countries like Canada and Estonia, the small scale of food processing companies limits their ability to take further advantage of export markets. Large multinational companies dominate global markets, but they tend to invest in countries with a large market size. In most countries, the retail sector is characterised by high concentration, but alternative channels, such as short supply chains, remain and even develop.
References
Bokusheva, R. and S. Kimura (2016), “Cross-Country Comparison of Farm Size Distribution”, OECD Food, Agriculture and Fisheries Papers, No. 94, OECD Publishing, Paris, https://doi.org/10.1787/5jlv81sclr35-en.
Eurostat (2017), [demo_pjan], https://ec.europa.eu/eurostat/data/database.
FAO (2017), FAOSTAT (database), www.fao.org/faostat/.
OECD (2018a), National Accounts (database), https://stats.oecd.org/.
OECD (2018b), Agricultural Policy Monitoring and Evaluation 2018, OECD Publishing, Paris, https://dx.doi.org/10.1787/22217371.
OECD (2018d), Innovation, Agricultural Productivity and Sustainability in Korea, OECD Food and Agricultural Reviews, OECD Publishing, Paris, https://doi.org/10.1787/9789264307773-en.
OECD (2018d), OECD agri-environmental indicators, www.oecd.org/tad/sustainable-agriculture/agri-environmentalindicators.htm (accessed in April 2018).
UN (2018a), World Population Prospects: The 2017 Revision, https://esa.un.org/unpd/wpp/.
UN (2018b), ComTrade Database, https://comtrade.un.org/ (accessed August 2018)
World Bank (2018), World Development Indicators (database), https://data.worldbank.org/indicator.
Notes
← 1. The share of the agri-food complex in total gross value added was 8% in 2015, www.agrimatie.nl/ThemaResultaat.aspx?subpubID=2232&themaID=2280&indicatorID=2919§orID=2243.
← 2. This is also linked to US farms being broadly defined as any place from which USD 1 000 or more of agricultural products were produced and sold, or normally would have been sold, during the year.
Metadata, Legal and Rights
https://doi.org/10.1787/c9c4ec1d-en
© OECD 2019
The use of this work, whether digital or print, is governed by the Terms and Conditions to be found at http://www.oecd.org/termsandconditions.