
3. What do teachers and schools do that matters most for students' social and emotional development?
This chapter begins by reviewing a broad range of student attitudes, behaviours and aspirations towards school in an attempt to identify those likely to vary significantly between schools. It then focuses on four social-emotional outcomes for further analysis: students’ perceptions of their classroom climate, teachers’ enthusiasm for teaching, test performance, and students’ educational expectations. Using a machine learning technique, lasso, and traditional regression analyses, it then aims to identify teacher and school dimensions that are the most significantly related to these four student social-emotional outcomes. For each of these outcomes, it attempts to identify cross-country patterns and differential teacher and school effects, as well as the mediating effects of classroom composition.
Schools and their teachers can actually make a difference for a wide range of students’ social-emotional outcomes pertaining to student school behaviour, interest in school and well-being. More specifically, data from the nine countries and economies participating in the TALIS-PISA1 link show that schools differ significantly in the way students perceive their classroom climate and their teachers’ enthusiasm for teaching. There are also significant differences between schools in terms of students’ perceptions of the difficulty of the PISA test and their expectations of completing at least a tertiary degree.
A machine learning technique applied to TALIS-PISA link data retains four potential key predictors of these student social-emotional outcomes: teachers’ classroom practices, classroom composition, school culture and school leadership. Variance decomposition analyses further indicate that four other dimensions explain an important part of differences in student social-emotional outcomes between schools: teachers’ use of their working time, teachers’ initial teacher education (both in terms of level and content), teachers’ participation in professional development activities of a certain type and content, and teachers’ well-being at work and their job satisfaction.
On average across TALIS-PISA link countries and economies, students whose classmates include a substantial number of low academic achievers are less likely to expect to complete at least a tertiary education degree. This holds true while controlling for student’s own socio-demographic background.
Students who are enrolled in schools with larger classes tend to have higher educational expectations and to find the PISA test easier. This holds true while accounting for the academic and social-behavioural characteristics of the student’s classmates. This could suggest that the larger the peer group is, the richer and more favourable the social-emotional development of the student. Yet, the presence of a selection bias cannot be ruled out. It is possible that schools implement specific grouping strategies.
The way teachers use and allocate their working time across various professional activities contributes to the way students perceive their learning environment and shapes their educational expectations, at least in several participating countries. Specifically, the more teachers report spending time on marking and correcting student work and engaging in extracurricular activities, the better it is for students’ social-emotional development.
The more teachers there are in a school that hold a master’s or a doctorate degree, the more likely students expect to complete a tertiary degree on average across TALIS-PISA link countries and economies. This might be because these teachers are better informed about the existing tracks for completing a tertiary degree, or because they represent higher educational aspirations for their students. However, highly-educated teachers might also be more likely to be employed in academically ambitious schools.
On average across TALIS-PISA link countries and economies, students tend to find their teachers more interested in their teaching when those teachers report lower levels of work-related stress on average in their school.
The findings highlighted above are established on average across TALIS-PISA link countries and for at least a couple of education systems. They cannot be interpreted as causal but, rather, correlational as TALIS and PISA measure teacher, principal, student and school characteristics in many countries at a single point of time. In addition, it is impossible to determine the sense of the relation, i.e. which factor drives changes in the other factor.
What students experience and feel at school matters. It not only matters for student achievement but also for their well-being at school and beyond. This is primarily a source of concern for parents but also for teachers. The PISA 2018 report on what school life means for students notes that more than students’ success at school it is their social and emotional development that is at the centre of parents’ attention: “When parents around the world are asked what they want for their children, some mention ‘achievement’ or ‘success’, but most reply ‘happiness’, ‘confidence’, ‘friends’, ‘health’, ‘satisfaction’, ‘freedom from bullying’ and the like.” (OECD, 2019, p. 40[1]). Turning to teachers, the TALIS 2018 results indicate that more than 90% of teachers in the OECD became teachers because teaching allowed them to influence the development of children and young people (OECD, 2019[2]). Students’ school life matters for key student outcomes – students’ academic success as well as social and emotional development – as these effects are mutually reinforcing and persist for years (Hoy, Hannum and Tschannen-Moran, 1998[3]).
Chapter 2 of this report has examined how teachers and schools contribute to students’ performance in the PISA test following traditional conceptualisation of student academic achievement and empirical studies on the education production function (Hanushek and Rivkin, 2010[4]; Todd and Wolpin, 2007[5]). However, a substantial body of evidence indicates that student learning is multidimensional. Many factors beyond their core knowledge and skills are important contributors to both short- and long-term success and well-being. For example, psychologists find that personality influences the quality of one’s thinking (Barratt, 1995[6]) and that grit and self-control influence how much a child learns in school (Duckworth et al., 2007[7]; Duckworth, Quinn and Tsukayama, 2012[8]). Longitudinal studies showed that childhood self-control, emotional stability, persistence, and motivation have long-term effects on health and labour market outcomes in adulthood (Borghans et al., 2008[9]; Chetty et al., 2011[10]; Moffitt et al., 2011[11]). Some studies even found that these sorts of attitudes and behaviours are stronger predictors of long-term outcomes like college attendance, earnings, home ownership and retirement savings than test scores (Chetty et al., 2011[10]).
Exactly like learning, teaching and schooling can also be characterised as multidimensional (Blazar and Kraft, 2017[12]). High-quality teachers and schools are expected not only to raise student performance, as measured through PISA and other tests, but also to provide emotionally supportive environments that contribute to students’ social and emotional development (Blazar and Kraft, 2017[12]; Pianta and Hamre, 2009[13]). In recent years, two research approaches have tested this theory using empirical evidence. The first research approach focused on estimating teachers’ contribution to student outcomes, often referred to as “teacher effects” or “teacher value-added” (Chetty, Friedman and Rockoff, 2014[14]; Hanushek and Rivkin, 2010[4]). These studies found that, as with test scores, teachers vary considerably in their ability to impact students’ social and emotional development including a variety of observed school behaviours (Gershenson, 2016[15]; Jackson, 2018[16]; Jennings and DiPrete, 2010[17]; Koedel, 2008[18]; Kraft, 2019[19]; Ladd and Sorensen, 2017[20]; Ruzek et al., 2015[21]). Moreover, these studies also suggest that teachers who make a difference for students’ academic performances are not necessarily equally good at contributing to students’ social and emotional development, hence putting emphasis on the multidimensionality of teaching and schooling. The second research approach focused on observations of classrooms as a means of identifying domains of teaching practice that matter for students’ cognitive as well as social-emotional outcomes (Blazar et al., 2017[22]; Hafen et al., 2015[23]). Several domains, such as teachers’ interactions with students, classroom organisation, and emphasis on critical thinking within specific content areas, are found to support students’ development in areas beyond their core academic skills (Blazar and Kraft, 2017[12]).
A few studies combine both approaches. This is the case of the OECD Global Teaching InSights (formerly referred to as the TALIS Video Study) (OECD, 2020[24]). This study used a pre/post design aimed to measure the impact of the teaching practices observed through videos on student outcomes (OECD, 2020, p. 23[24]). The study was more conclusive regarding what teaching practice matters for student social-emotional outcomes than for student achievement. The report showed that teachers’ practices such as classroom management and the social-emotional support of students were significant predictors of student personal interest and self-efficacy in mathematics in half of countries/economies, even after accounting for students’ prior mathematics performance and other background characteristics. In contrast, the quality of instruction was significantly associated with student achievement in one country only (OECD, 2020, p. 16[24]).
Chapter 3 of this report contributes to this research field by addressing this main research question: what do teachers and schools do that matters most for students' social and emotional development? The chapter’s contribution differs from other research studies of this field in multiple ways. It draws on the rich TALIS-PISA 2018 link dataset of 15-year-old students, their teachers and schools. While most studies of this research field have been conducted mainly on local and state-level datasets in the United States, this chapter presents results at an international scale with data from nine countries and economies from four continents – Australia, Ciudad Autónoma de Buenos Aires (hereafter “CABA” [Argentina]), Colombia, the Czech Republic, Denmark, Georgia, Malta, Turkey and Viet Nam. Unlike past studies that usually focused on kindergarten, pre-primary and primary education, this chapter focuses on 15-year-old students and teachers teaching this age group. In comparison to past studies that usually analysed just a few student outcomes, this chapter reviews a wealth of student-reported indicators on dimensions of social and emotional development that include perceptions of their school’s climate and their own contributions to shaping it, their well-being and their interest in school. All these measures are important outcomes of interest to policy makers, researchers, teachers and parents – see, in particular, Volume III of PISA 2018 Results by OECD (2019[1]). The large set of students’ social-emotional outcomes is complemented by teachers’ and principals’ reports, collected as part of the rich TALIS 2018 questionnaire. These cover not only teaching practices but a wide range of aspects concerning their training, professional practices, working conditions and work environment.
The TALIS-PISA link data also present important limitations. The link between teachers and students is established at the school and not at the class level. In other words, the data do not allow a teacher to be matched with her/his students, but, rather, a sample of teachers teaching 15-year-old students in a school to be matched with a sample of 15-year-old students of that same school. Information on teachers is therefore averaged at the school level to be analysed together with students’ outcomes. Given that teachers of the same school differ significantly in terms of their characteristics and practices, linking data by averaging teachers’ variables at the school level triggers a considerable loss of information.2 Last but not least, the cross-sectional design of the survey prevents the measurement of any teachers’ causal effects. Neither does it allow for short-term effects of teachers and schools on students’ outcomes to be distinguished from long-term ones.
The first section of this chapter reviews a broad range of student social-emotional outcomes to identify those that significantly vary between schools. The second section of the chapter focuses on the four student social-emotional outcomes that present important school variations: student perceptions of the disciplinary climate and their teacher’s enthusiasm in their language-of-instruction lessons, student appreciation of difficulty of the PISA test and student educational expectation. The goal is to identify which teacher and school dimensions are the most significantly related with these four outcomes. To this end, Chapter 3 builds heavily on the conceptual framework and statistical methods presented in Chapter 2. In particular, it uses the same supervised statistical learning method, lasso, to investigate the relationship between teacher and school factors, and student socio-emotional development. It finally attempts to identify cross-country patterns, and differential teacher and school effects depending on the outcome of interest as well as the mediating effects of classroom composition.
Several recent studies on teachers’ “value-added” have documented the magnitude of teacher effects on a range of student outcomes other than test scores (Gershenson, 2016[15]; Jackson, 2018[16]; Jennings and DiPrete, 2010[17]; Koedel, 2008[18]; Kraft, 2019[19]; Ladd and Sorensen, 2017[20]; Ruzek et al., 2015[21]). These studies attempt to isolate the unique effect of teachers on social-emotional outcomes from factors outside of teachers’ control (e.g. students’ prior achievement, gender, socio-economic and cultural status, immigration background) and to limit any bias due to non-random sorting of teachers and students. These studies found small-to-important teacher effects on many kinds of students’ social-emotional outcomes.
This chapter first reviews a broad range of student attitudes, behaviours and aspirations towards school to identify those that are more likely to be affected by what a school, its teachers and its students do. This chapter supplements the conceptual frameworks for school climate and students’ well-being put forward in PISA 2018 Results (Volume III): What School Life Means for Students’ Lives? (OECD, 2019[1]) with a conceptualisation of student interest in school – key to students’ longer-term academic success (Hoy, Hannum and Tschannen-Moran, 1998[3]). Students’ well-being, their interest in school, and perception of school climate and the part they play in it, can all be considered an integral part of students’ social-emotional development. Indeed, the OECD defines social and emotional skills as: “…individual capacities that can be (a) manifested in consistent patterns of thoughts, feelings and behaviours, (b) developed through formal and informal learning experiences, and (c) important drivers of socioeconomic outcomes throughout the individual’s life” (OECD, 2015, p. 35[25]). In this chapter, a forward-looking perspective is taken. It considers the outcomes of interest as indicators, at a given time, of an in-progress development of student social-emotional skills.3
The first part of this chapter maps social-emotional outcomes measured by PISA up against outcomes that studies on teachers’ value-added have identified as being affected by teachers. It then estimates how much of the differences in each student outcome can be attributed to differences between schools. The differences observed between schools can result from different sources: actual differences between schools in their school body and peer-to-peer interactions, in the school’s staff, its working conditions and practices as well as in the school’s characteristics and policies. This first part aims at delimiting what can actually be analysed and concluded from the TALIS-PISA link data, i.e. through a school-level link of cross-sectional data. Indeed, only a few of the 24 student social-emotional outcomes are found to be subject to significant school differences and, even in such cases, school differences remain weak in comparison to differences observed within schools among students. This substantially limits identification of what teachers and schools do that matters for student social and emotional development, and should be borne in mind for the second part of this chapter. The second part strives to identify teacher and school dimensions that matter for the student outcomes retained for analysis.
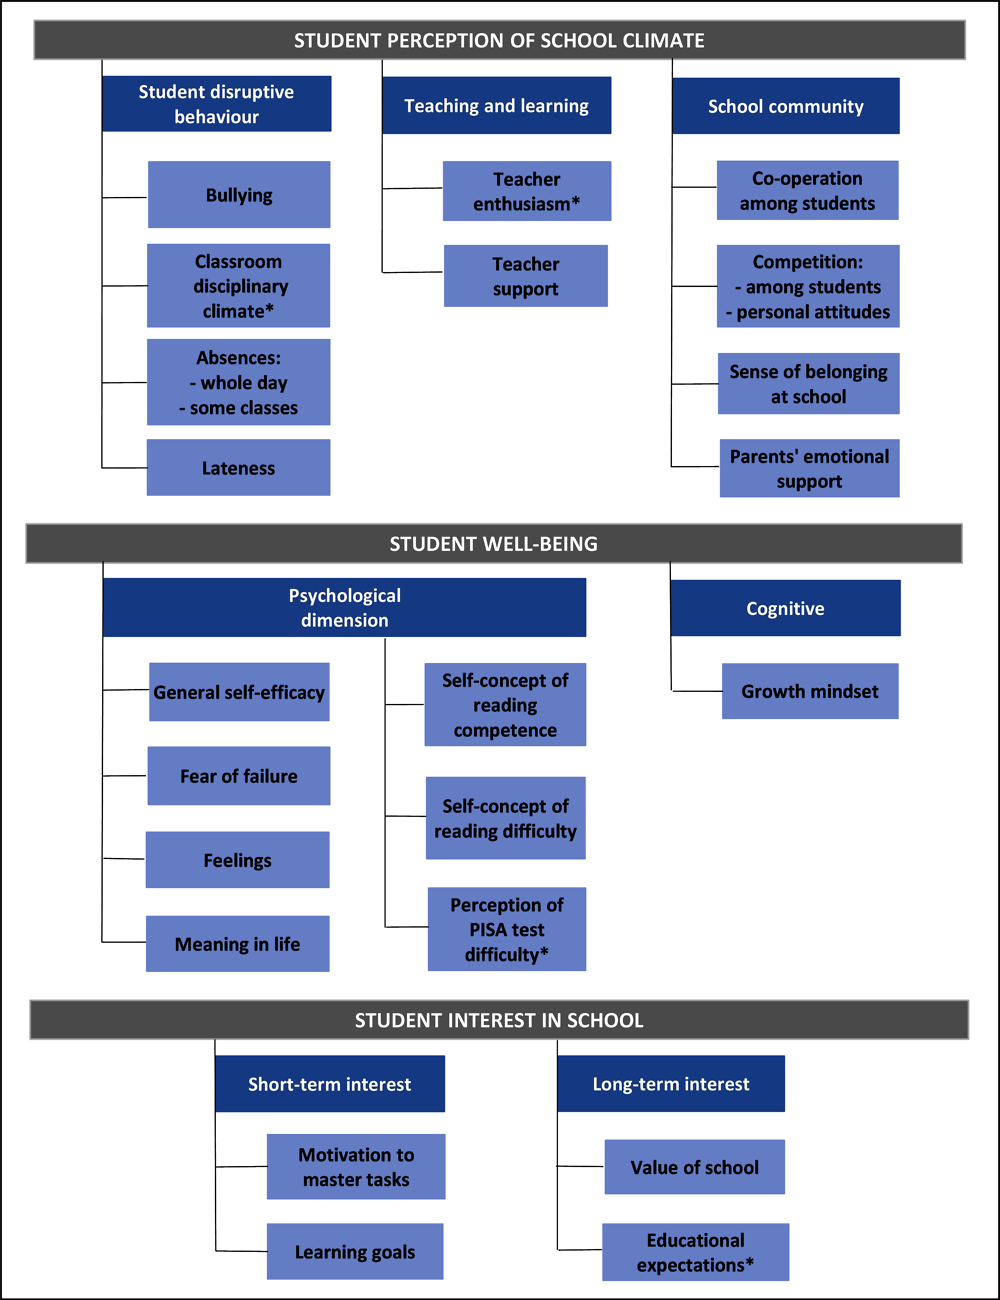
Note: Social-emotional outcomes flagged with an asterisk (*) are those for which a significant share of their total variance (i.e. more than 10% of the total variance) lies between schools in all or almost all participating countries.
Source: Adapted from OECD (2019[1]), PISA 2018 Results (Volume III): What School Life Means for Students’ Lives, PISA, https://dx.doi.org/10.1787/acd78851-en, Figures III.1.1 and III.1.2.
Student perception of and part played in school climate
Among all aspects pertaining to school climate (see the upper part of Figure 3.1), student disruptive behaviour is the one aspect that was found to be subject to teacher effects by past research studies. Some studies did find teachers’ effects on students’ absences (Gershenson, 2016[15]; Jackson, 2012[26]; Ladd and Sorensen, 2017[20]) as well as on students’ behaviour in class and suspensions (Blazar and Kraft, 2017[12]; Jackson, 2018[16]; Ladd and Sorensen, 2017[20]), while Jennings and DiPrete (2010[17]) also found an effect of kindergartens’ staff on children’s self-control. The fact that none of these studies found teacher effects on other indicators of school climate, such as a student’s sense of belonging at school or propensity to co-operate or collaborate, does not necessarily result from the absence of such effects. On the contrary, this can result from a lack of such analysis or data available for these indicators.
The TALIS-PISA link data do not allow measurement of teacher value-added because of their cross-sectional design and school-level link. Yet, the TALIS-PISA link dataset allows identification of the extent to which schools (including what makes up a school – its teacher workforce and its students) differ for a varied range of student outcomes. Analyses conducted on the TALIS-PISA link data indicate that, out of the 12 student outcomes pertaining to school climate, two vary significantly across schools (they are flagged with an asterisk * in Figure 3.1), meaning that a significant share of the total variance in two of these outcomes (i.e. more than 10% of the total variance) lies between schools in all or almost all participating countries (Table 3.1). These are students’ perceptions of classroom disciplinary climate4 and teachers’ enthusiasm for teaching.5
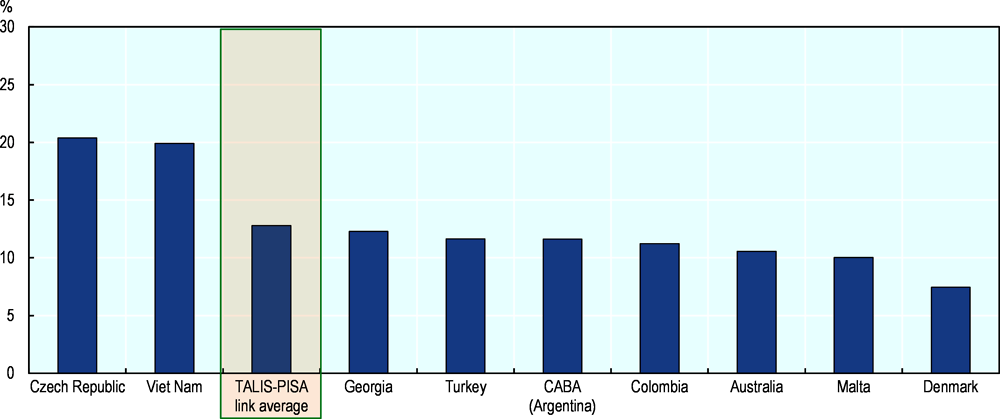
Schools significantly differ in the way students report how they behave in class. The between-school variance of student perception of the classroom disciplinary climate ranges from 11% in Colombia and Viet Nam to 23% in Georgia and even 26% in the Czech Republic (Figure 3.2). This finding resonates with those established by Blazar and Kraft (2017[12]). They found that upper-elementary teachers have large effects on self-reported measures of students’ behaviour in class in four districts on the east coast of the United States. They also estimated that the variation in teacher effects on students’ behaviour in class is of similar magnitude to the variation in teacher effects on mathematics scores. This might suggest that the school differences found in classroom climate for TALIS-PISA link countries and economies result from cumulative teacher effects on student behaviour in class. At the same time, differences in classroom climate between schools relate largely to differences in performances. In the case of the Czech Republic, the large differences observed in disciplinary climate between schools partly result from the tracking structure of the Czech education system with schools in the general tracks enjoying a more favourable school climate than vocational schools.
Schools also significantly differ in the way students perceive their teachers’ enthusiasm for teaching. The between-school variance of this index ranges from 8% in Turkey and 10% in Colombia and Viet Nam to 21% in the Czech Republic (Figure 3.2).
However, the share of between-school variance is relatively low for the other ten social-emotional outcomes, including indicators on the concept of school community (e.g. student co-operation and competition and student sense of belonging at school) (Table 3.1). Also, one could have expected to find significant differences between schools with regard to student truancy, at least for two reasons: some schools could have a higher concentration of students with deviant behaviours than others because of school and residential segregations. Second, important teacher value-added was found in past US studies on student absences, suggesting important school differences in student absences if teachers’ effects add up within schools (Gershenson, 2016[15]; Jackson, 2012[26]; Ladd and Sorensen, 2017[20]). Unfortunately, it is impossible to disentangle the reasons for this unexpected finding.

Note: The figure shows the R² of the linear regression of student perception of classroom climate (respectively of teacher enthusiasm) on school fixed effects.
Countries and economies are ranked in descending order of the percentage of total variance in the index of classroom disciplinary climate, explained at the school level.
Sources: OECD, TALIS 2018 Database; OECD, PISA 2018 Database, Tables 3.2 and 3.4.
Student well-being
In the framework presented in the third volume of PISA 2018 Results on students’ school life (OECD, 2019[1]), student well-being is composed of two sub-dimensions,6 each of which includes several indicators that are relevant to this chapter (see the middle part of Figure 3.1):
psychological dimension: general self-efficacy, self-concept of reading competence and difficulty, perception of difficulty of the PISA test*, fear of failure, feelings and meaning in life
A few past studies examined whether teachers can have an impact on student well-being measures. Using data on upper-primary teachers collected by the National Centre for Teacher Effectiveness, Blazar and Kraft (2017[12]) estimated that the variation in teacher effects on students’ self-efficacy in mathematics is of similar magnitude to the variation in teacher effects on mathematics test scores. They found that the variation of teacher effects on students’ happiness in class is even larger. Using data on upper-primary teachers collected by the Measures of Effective Teaching (MET) Project, Kraft (2019[19]) found significant teacher effects on student growth mindset. Overall, PISA measures of student well-being map well with student outcomes identified by research as influenced by teachers, and even extend their scope.
As mentioned before, the TALIS-PISA link data do not allow measurement of teacher value-added. Yet, it is possible to identify the extent to which schools differ in their students’ well-being. Analyses indicate that of the eight student outcomes related to well-being only students’ perception of the difficulty of the PISA test7 significantly varies between schools (flagged with a * above and in Figure 3.1) (Table 3.1). This means that a significant share of the total variance (i.e. more than 10% of the total variance) lies between schools in all or almost all participating countries.
School differences in the way students perceive PISA test difficulty are the weakest in Malta (6%) and Denmark (7%), culminate at 17% of the total student differences in CABA (Argentina) and amount to around 10% in all remaining countries and economies (Figure 3.3). One may wonder why this student outcome is more subject to differences between schools than others such as student general self-efficacy or growth mindset. A possible explanation for this is that students from the same classes and schools tend to perform similarly – the between-school variance in student performance (around 30%, see Chapter 2) is actually higher than that in student perception of test difficulty. Moreover, students attending the same classes and schools can sit the same school assessments or tend to have similar testing experiences and therefore similar appreciation of the PISA test difficulty. Other indicators of well-being, such as students’ feelings or sense of meaning in life, are not directly related to school, and are general measures of individual well-being. Therefore, they might be less subject to between-school variations. In addition, in comparison to student general self-efficacy or self-concept in reading, the question on the PISA test difficulty asks about a more concrete situation that just happened, and results in more precise estimates of student outcomes at student and school levels, thereby impacting between-school variance.

Note: The figure shows the R² of the linear regression of student perception of difficulty of the PISA test on school fixed effects.
Countries and economies are ranked in descending order of the percentage of total variance in the index of student perception of difficulty of the PISA, explained at the school level.
Sources: OECD, TALIS 2018 Database; OECD, PISA 2018 Database, Table 3.6.
Student interest in school
In addition to the two sets of student outcomes presented above – perception of and participation in school climate and student well-being – this chapter examines student interest in school, which is key to longer-term educational success. This includes the following indicators:
It is possible to map some PISA indicators pertaining to student interest in school to student outcomes that were found to be impacted by teachers from studies on teachers’ value-added. Jennings and DiPrete (2010[17]) estimated the role that teachers play in developing kindergarten and first-grade students’ social and behavioural outcomes, including the child’s attentiveness, task persistence, eagerness to learn, learning independence, flexibility and organisation. They found within-school teacher effects on social and behavioural outcomes that were even larger than effects on students’ academic achievement. In a study of middle-school mathematics teachers, Ruzek et al. (2015[21]) found small but meaningful teacher effects on students’ motivational orientation (mastery and performance achievement goal) among seventh graders. Yet, the analysis suggests less variation in teachers’ contributions to students’ achievement goals than mathematics achievement. A few studies found teacher effects on students’ educational aspirations, especially on female students’ aspirations to pursue studies in science, technology, engineering and mathematics (STEM) (Breda et al., 2020[27]; Carrell, Page and West, 2010[28]). A couple of studies also analysed teacher effects on long-term educational outcomes such as college attendance. Using data from primary teachers, Chetty et al. (2014[14]) found that students assigned to high value-adding teachers are more likely to attend college. Jackson (2018[16]) found that teachers have causal effects on skills not measured by testing, but reflected in absences, suspensions, grades, and on-time grade progression. Teacher effects on these non-test-score outcomes in the 9th grade predict longer-run effects on high-school completion and proxies for college-going above and beyond their effects on test scores. Effects on non-test-score outcomes were found to be particularly important for English teachers.
Analyses conducted on the TALIS-PISA link data indicate that of the four student outcomes pertaining to student interest in school, one of them – students’ educational aspirations (flagged with a * above and in the bottom part of Figure 3.1) – differs significantly between schools (Table 3.1). More specifically, PISA measures education expectations by asking students which educational level they expect to complete. Their responses were used to create a dummy variable that equals 1 if the student expects to complete at least a tertiary degree and 0 otherwise.8
Schools differ more in students’ educational expectations in some countries than in others. The between-school variance9 for this outcome amounts to 7% in Denmark, culminates at 20% in the Czech Republic and Viet Nam, and ranges between 10% and 12% for all remaining countries and economies (Figure 3.4). The large differences observed between schools in the case of the Czech Republic must partly result from the structure of the education system, which enrols 15-year-old students in different tracks that lead students to complete studies differing in length and type of content. Educational expectations are more subject to differences between schools than other measures of students’ interest in school10 (Table 3.1). An explanation for this might be that educational aspirations are more stable in time as they refer more to student long-term interest in school than the determination and motivation students report in pursuing their day-to-day school work. It might also be the case that the question about educational expectations is more concrete than the others as they refer to extant educational degrees rather than values. For both reasons, the indicator of student educational aspirations might yield more precise estimates of student outcomes at the student level and therefore at the school level, which matters for the estimation of the between-school variance.
Note: In the case of binary variables analysed with the help of logistic regressions, an equivalent statistic to R2 does not exist. The goodness-of-fit of logistic regression models is evaluated by pseudo R2. Pseudo R2 is on a similar scale to R2 (ranging from 0 to 1) with higher values indicating better model fit. It is used as a proxy for the percentage of the variance in the dependent variable that the independent variables explain collectively.
Countries and economies are ranked in descending order of the percentage of pseudo R² of the logistic regression of student expectation of completing at least a tertiary degree on school fixed effects.
Sources: OECD, TALIS 2018 Database; OECD, PISA 2018 Database, Table 3.7.
Summary and discussion
Interestingly, the four social and emotional outcomes that present significant differences between schools belong to all of the three general concepts presented above – school climate, student well-being and student interest in school. This shows that teachers and schools can actually matter for a wide range of students’ outcomes. At the same time, only four of the 24 indicators analysed are found to vary significantly across schools. And, even for these indicators, school differences are relatively weak, particularly in comparison with differences in achievement between schools (see Chapter 2). Yet, though school systems and schools may effectively manage students’ social-emotional development, this should not be overstated.
First, research conducted in the United States suggests that teacher effects on student achievement are similar in magnitude if not smaller than teachers effects on certain student attitudes and behaviours (Blazar and Kraft, 2017[12]). Little is known about the way teacher effects aggregate at the school level, i.e. whether they tend to cumulate or cancel each other out within schools, and whether this varies depending on the outcome of interest. A plausible reason why schools appear to differ more with respect to student achievement than student social-emotional outcomes has to do with the fact that student achievement is more precisely measured than student social-emotional outcomes in PISA. While student performances in each domain are evaluated based on at least a half an hour of test-taking, indicators of student social-emotional development are measured based on one question each.11
In the same way, it can be argued that the four social-emotional outcomes that show the largest differences between schools do so because they are more precisely measured. Two of these four outcomes refer to what happens specifically in language-of-instruction lessons. These are students’ perceptions of the classroom disciplinary climate and the teacher’s enthusiasm in language-of-instruction lessons. This might be because students report on aspects pertaining to a collective environment – the classroom and its teacher – and not on their own personal behaviour, beliefs and values. It is thus likely that students’ reports on this shared reality are more similar within schools as students from the same classroom and/or taught by the same teacher can be surveyed by PISA. The other two outcomes specifically refer to more objective evaluation of student self-concept and interest in school: student perception of the PISA test difficulty and student expectation of completing at least a tertiary education degree.
In addition, because these four outcomes are more concrete, they are also less likely to suffer from reference bias (Van de gaer et al., 2012[29]) than the other 20 outcomes under scrutiny. When students rate themselves on statements such as: “I am a good reader”; “I am able to understand difficult texts”: or “I normally feel happy”; “I normally feel proud”, they must interpret the definitions of reading proficiency or happiness, which likely involves comparing themselves with other people, in particular with students from their class or their school. Thus, it is likely that students from different schools have different standards or reference points when answering less concrete questions. In such cases, the differences between schools in the social-emotional outcomes that suffer (the most) from reference bias are underestimated.
Finally, there are some consistent cross-country patterns that emerge from the analyses across these four outcomes. Irrespective of the social-emotional outcome of interest, the Czech Republic and Georgia are consistently among the three countries with the largest school differences. At the other end of the spectrum, Colombia and Denmark are consistently among the four countries showing the smallest school differences (yet still at around 10% of the total variance or above). These cross-country differences may result from two factors that can reinforce or partially mitigate each other: higher segregation of students by prior social-emotional skills and higher variations in school effects on student social-emotional outcomes in the Czech Republic and Georgia in comparison to other countries (especially in Colombia and Denmark). Unfortunately, the TALIS-PISA link data do not allow disentangling these effects. The structure of the education system, in particular the number of education programmes available to 15-year-olds and students’ age at first selection, might explain part of the differences resulting from school segregation. For example, the large differences observed in the Czech Republic might be explained by the fact that 15-year-old students can be enrolled in five different education programmes and they are first selected into these tracks at the age of 11. On the other hand, in Denmark, where small differences are observed between schools, the age at first selection is 16 and all 15-year-old students are enrolled in the same education programme – see OECD (2020[30]), Figure V.3.2.
The following analyses aim to identify teacher and school factors that can explain the differences found between schools in student social-emotional development. These might be considered even more relevant for countries like the Czech Republic and Georgia where those differences are particularly large in comparison with other participating countries and economies.
The remainder of the chapter focuses on the four student social-emotional outcomes that present important school variations: student perception of their language-of-instruction lessons (disciplinary climate and teacher enthusiasm), student perception of PISA test difficulty, and student educational expectation. It now aims at identifying which teacher and school dimensions actually matter for these four outcomes. This section of the chapter builds heavily on concepts and tools presented in Chapter 2. While Chapter 2 focused on student performance, this chapter focuses on student social-emotional outcomes that significantly vary across schools.
Teacher and school factors selected by lasso, a supervised statistical learning method
As in Chapter 2, this section uses a supervised statistical learning method, lasso, to investigate the relationship between teacher and school factors, and student social-emotional outcomes (see Box 2.1 for more information). It also borrows from the conceptual framework presented in Chapter 2 and uses the same list of potential predictors (almost 150 predictors across 18 teacher and school dimensions) to explain the four student outcomes under scrutiny.
Figure 3.5 provides an overview of teacher and school dimensions that are found to be significantly related to the four student social-emotional outcomes by focusing on two groups of teachers: all the teachers of the school irrespective of the subject they teach; and teachers teaching reading, writing or literature (henceforth “reading teachers”). As two of the four student outcomes under scrutiny refer to what happens in language-of-instruction lessons, it makes sense to replicate analyses conducted for all teachers on a sample restricted to reading teachers only. Also, as the major domain assessed in PISA 2018 is reading, it is interesting to replicate analyses of student perception of the PISA test difficulty while focusing on reading teachers only. Analyses of students’ educational expectations are not restricted to the sample of reading teachers as this particular group of teachers is not expected to have a specific role in shaping students’ educational expectations. That said, the remainder of the chapter focuses on the findings observed for the full sample including all teachers of the school as this larger sample of observations (all schools are included regardless of whether at least one reading teacher was surveyed or not) tends to trigger more significant results.
Lasso results suggest that, considering the overall population of 15-year-old students, teachers and principals surveyed within the TALIS-PISA link, none of the 18 teacher and school dimensions examined matter consistently for all four student social-emotional outcomes under scrutiny. This may point to the multidimensionality of teacher and school effects on student social-emotional outcomes since different dimensions of teachers’ work and schools’ practices seem to matter for different student outcomes. Yet the lack of significance in the findings might also result from a lack of statistical power or a loose link between the teachers and their students.
A few indicators are identified consistently by lasso as having a significant association with two to three student social-emotional outcomes (Figure 3.5). These indicators belong to four dimensions: teachers’ classroom practices, classroom characteristics, school culture and school leadership.
Teachers’ classroom practices
Results from lasso indicate that teachers’ classroom practices are important for two of the four student social-emotional outcomes: student perception of classroom disciplinary climate and teacher enthusiasm in language-of-instruction lessons. This finding is aligned with results from past studies that used observation instruments to examine teachers’ roles in supporting students’ social-emotional development. One instrument in particular, the Classroom Assessment Scoring System (CLASS) collects data on aspects of teachers’ instruction: teachers’ social and emotional interactions with students, their ability to organise and manage the classroom environment, and their instructional supports in the delivery of content (Hafen et al., 2015[23]). A number of studies from developers of the CLASS instrument and their colleagues have described relationships between these dimensions and closely related student attitudes and behaviours. In particular, they found that teachers’ classroom organisation predicts students’ engagement and behaviour in class – see Blazar and Kraft (2017[12]) for a short review. The OECD Global Teaching Insights report showed that teachers’ practices such as classroom management and their social-emotional support of students are significant predictors of student personal interest and self-efficacy in mathematics in half of the countries/economies participating in the study, even after accounting for students’ prior mathematics performance and other background characteristics (OECD, 2020[24]).
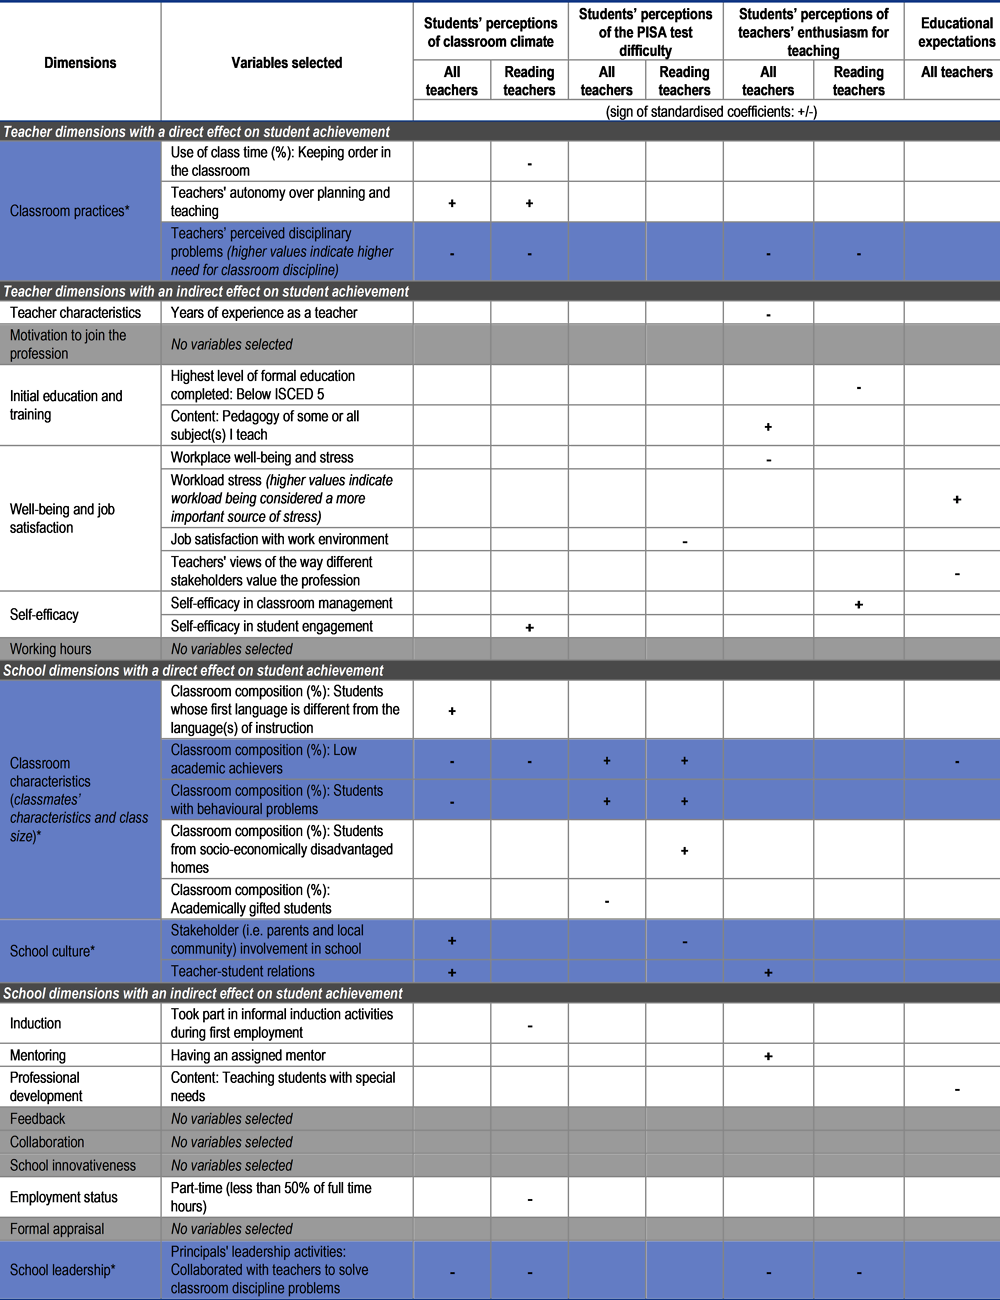
Notes: Country fixed effects and student characteristics, such as gender, immigrant background and index of economic, social and cultural status (ESCS), are always included among the variables selected by lasso.
Teacher variables are averaged at the school level for two different groups of teachers: all teachers in the school and all reading teachers in the school. Thus, the analyses focusing on reading teachers are based on samples restricted to schools with at least one reading teacher participating in TALIS.
Dimensions and variables that are identified consistently by lasso as having a significant association with two to three student social-emotional outcomes are highlighted in blue. Dimensions that are not selected for any of the social-emotional outcomes are highlighted in light grey. Since lasso is applied as a model selection technique it does not provide the standard errors required for performing statistical inference. The interpretation of the estimated standardised coefficients is conditional on the selected model and cannot be interpreted as causal. Moreover, in the presence of correlated explanatory variables, the signs of the coefficient estimates can swing based on which other independent variables are in the model.
For additional information on the full list of potential variables included in the lasso regressions and more generally about lasso, see Annex B.
Sources: OECD, TALIS 2018 Database; OECD, PISA 2018 Database, Table 3.8.
Within this dimension of teachers’ classroom practices, what lasso regressions particularly retain is that teachers’ own perceptions of the disciplinary climate of the classroom is correlated with students’ perceptions of both the classroom disciplinary climate and teachers’ enthusiasm to teach. The more teachers report disciplinary problems in their classroom, the less students speak positively about their classroom disciplinary climate (hence the negative relationship show in Figure 3.5). This suggests that the different stakeholders are aligned in their perceptions of their shared environment but, also, potentially, that there is a virtuous/vicious spiral where perceptions and attitudes of stakeholders mutually reinforce each other. Lasso results focusing on reading teachers also show that the more time reading teachers spend on keeping order in their classroom, the more negative the disciplinary climate in the classrooms is as perceived by students. Lasso results further suggest that teachers who have more autonomy over lesson planning and teaching strategies tend to teach in classrooms with more disciplined students (Figure 3.5).
Classmates’ characteristics and class size
Results from lasso regressions indicate that classroom characteristics are significantly related to three of the four outcomes of interest: the classroom disciplinary climate, students’ perceptions of difficulty of the PISA test and students’ educational aspirations (Figure 3.5). Since the lasso regressions control for students’ own characteristics (gender, socio-economic and immigration background), these findings actually point to important “peer effects” on student social-emotional outcomes.
Low academic achievement and behavioural problems are the academic and socio-behavioural characteristics among classmates that matter the most.12 The higher these shares are, the less disciplined classrooms are and the more students perceive the PISA test as difficult. These findings somewhat echo education research on peer effects (Sacerdote, 2011[31]) although most studies focus on peer effects on student achievement rather than on social-emotional outcomes. For example, Carrell and Hoekstra (2010[32]) showed that the classroom presence of children, in particular boys, exposed to domestic violence not only lowers maths and reading test scores of other children but also raises classroom discipline problems. They found that adding an additional troubled boy to a classroom raises the probability that another boy will commit a disciplinary infraction by 17% (and lowers test scores by two percentile points).
The classroom presence of low academic achievers is also related to students’ own educational expectations. The higher the share of low academic achievers, the fewer the number of students who expect to complete at least a tertiary degree. This is somehow consistent with past research studies finding important peer effects on college completion. In particular, Gaviria and Raphael (2001[33]) found strong peer effects among tenth-graders in the likelihood of dropping out of high school as well as other social behaviour such as drug use, alcohol drinking, cigarette smoking and church going. In other words, students are more likely to engage in these activities the more their classmates do.
Identifying the precise channel(s) through which a given peer effect operates is an impossible task and is too demanding regarding the analytical potential of the TALIS-PISA link data. If a student’s classmates have lower ability and are more disruptive in the classroom, the student herself/himself is more prone to create disruptions in the classroom and teachers may struggle more to keep order in the classroom. Also, if the student’s classmates are low academic achievers, teachers likely teach at a slower pace and have lower expectations of their students’ educational orientation. This, in turn, leads the student to have poorer educational expectations for herself/himself.
School culture and school leadership
Results from lasso regressions indicate that teacher-student relations, and the involvement of parents and the local community in school (Figure 3.5) are the elements of school culture that matter particularly for student social-emotional development. They are particularly associated with ensuring a disciplined classroom climate. Positive teacher-student relations go hand-in-hand with student perception of reading teachers’ enthusiasm for teaching. Students also tend to find the PISA test less difficult when parents and the local community are involved in school (this only holds true when the analyses focus on reading teachers only). Parents’ involvement in school may positively affect students’ self-concept and perceptions of their class and teacher through several channels: greater collaboration between teachers, school staff and parents resulting in more tailored support for student social-emotional development; greater student perception of the value of school; and students’ greater sense of co-operation and belonging to school.
Lasso regressions retain school leaders’ involvement in solving classroom discipline problems as an important covariate of student perception of the disciplinary climate and teacher enthusiasm for teaching compared to other aspects of school leadership. This suggests consistency between students’ and the principal’s perceptions of the overall class and school climate. The more frequently principals report collaborating with teachers to solve discipline problems, the more students report disciplinary issues in their classrooms, and the less enthusiastic teachers are about teaching, according to students. Repeated disciplinary issues may be conducive to discouragement among concerned teachers.
Differences in student social-emotional outcomes explained by teacher and school factors
This chapter aims to identify teacher and school dimensions that matter the most for student social-emotional outcomes. Analysing results from lasso regression is one way to do this (see previous section). Another complementary approach consists of retaining those dimensions that explain the highest shares of variance in student social-emotional outcomes. Obviously, as the factors of interest included in the analyses are introduced at the school level, one can only explain the share of variance in students’ social-emotional outcomes that lies at the school level. School average differences in student social-emotional outcomes across the nine TALIS-PISA link countries and economies represent about 10 to 20% of the total variance in student social-emotional outcomes (Figures 3.2, 3.3 and 3.4). This means that any of the teacher and school dimensions included in the analyses can only explain up to 10-20% of the total variance in student social-emotional outcomes.
The four dimensions previously identified as important for student social-emotional outcomes by lasso regressions also explain a substantial share of the differences between schools in student average social-emotional outcomes (Figure 3.6). Depending on the outcome of interest, the dimension of teachers’ classroom practices explains between 15% (student perception of teacher enthusiasm) and 28% (classroom disciplinary climate) of school differences on average across participating countries and economies. Yet, classroom composition tends to explain a larger share of these differences – up to 55% of the total differences between schools in the share of students expecting to complete at least a tertiary degree. This corroborates lasso findings and past education research indicating important peer effects on students’ social-emotional development. School leadership also explains around 20% of the between-school variance across all four student social-emotional outcomes. Yet, school culture is the one dimension among the four that captures the smallest share of the between-school differences in student social-emotional outcomes, though still above 10%.
Beyond these four dimensions flagged by lasso, there are four other dimensions that are found to explain an important part of the differences between schools in student social-emotional outcomes: teachers’ use of working time; teachers’ initial teacher education in terms of level and content; teachers’ participation in professional development activities of certain type and content; and teacher well-being and job satisfaction (Figure 3.6). All of these dimensions capture a share of between-school variance that is around or above 20%. This warrants a detailed look at the indicators from these additional dimensions. In the next section, student outcomes are regressed on indicators of each teacher and school dimension taken separately.

1. Unlike continuous variables where R² of linear regressions on school fixed effects are used to estimate the share of variance explained at the school level (right-part of the panel), in the case of binary variables analysed with the help of logistic regressions, an equivalent statistic to R² does not exist. The goodness-of-fit of logistic regression models is evaluated by pseudo R². Pseudo R² is on a similar scale as R² (ranging from 0 to 1) with higher values indicating better model fit. It is used as a proxy for the percentage of the variance in the dependent variable that the independent variables explain collectively.
Note: Teacher variables averaged for all teachers within the school.
Values are ranked in descending order of the percentage of variance in the index of classroom disciplinary climate explained at the school level.
Sources: OECD, TALIS 2018 Database; OECD, PISA 2018 Database, Tables 3.2, 3.4, 3.6 and 3.7.
Do teacher and school factors matter equally across student social-emotional outcomes and countries?
This section aims to identify specific indicators of selected teacher and school dimensions that are significantly related with certain student outcomes, using country-level regressions. Only results that hold on average across the TALIS-PISA link countries and for, at least (and in some cases only), a couple of participating countries/economies, are reported. Regression analyses also provide insights into the potential role of confounding factors such as classmates’ academic and socio-behavioural characteristics in the relationship between a teacher or school factor and student social-emotional development. Findings presented above may mask differences across the TALIS-PISA link countries and economies. In particular, relationships found on average across all nine participating countries and economies do not usually hold for every country/economy considered individually. This might be due to a lack of statistical power or simply reflect a true absence of relationship in the considered education system(s). This section therefore highlights the countries/economies in which the relationships identified are significant.
Teachers’ classroom practices
The teacher dimension of classroom practices is consistently highlighted by the lasso regressions, variance decomposition analysis and education research as an important predictor of student social-emotional development. Country-level regression results further show that teachers’ classroom practices are significantly related to student perception of the classroom climate and less so for the other three outcomes of interest in this chapter (Tables 3.9, 3.13, 3.17 and 3.19) (this is consistent with the results from both lasso regressions and variance decomposition analysis). First, there is a clear alignment of teachers’ and students’ perceptions of the classroom climate in all countries and economies. The more teachers report disciplinary issues, the more students report the same (though the relationship is not significant in Georgia and Turkey) (Table 3.9). Country-level regression results also show a mixed pattern regarding the use of cognitive activation (i.e. getting students to evaluate information and apply knowledge in order to solve a problem). The more teachers report using cognitive activation practices, the better the disciplinary climate reported by students in CABA (Argentina) and Turkey. The opposite is found for the Czech Republic and Denmark (for the latter, this holds true after accounting for the classroom composition only [Table 3.11]). While cognitive activation practices have been found to be associated with higher student performance in several countries (Echazarra et al., 2016[34]; Le Donné, Fraser and Bousquet, 2016[35]), this result might suggest that these practices are linked with student behaviour in class and overall with the classroom climate as they may generate more student agitation than other teaching strategies in some countries and less in others.
Classmates’ characteristics and class size
The classroom characteristics dimension explains a high share of school differences in student social-emotional outcomes, and the highest share for students’ educational expectations (Figure 3.6). Lasso regression results identified classmates’ characteristics, and in particular, the share of low academic achievers and students with behaviour problems as among the most important factors related to student social-emotional outcomes (Figure 3.5). Country-level regressions confirm these findings and reveal some other results.
There seems to be a relationship between the presence of high academic achievers in the class and student self-concept (Table 3.21). The more academically gifted students are enrolled in the classroom, the less difficult the student finds the PISA test. This holds true on average across countries and economies, for CABA (Argentina), the Czech Republic, Georgia and Turkey. This may be due to the fact that students attending high-achieving classrooms tend to be exposed to more complex testing situations.
In comparison to lasso results, country-level logistic regressions of student educational aspirations show that not only does the classroom presence of low academic achievers matter in the formation of students’ educational expectations (Figure 3.7), but also that of students from socially disadvantaged homes. As the share of socio-economically disadvantaged students in the classroom increases, student expectation of attending tertiary education tends to decrease. This holds true in Australia, Colombia and Turkey. The fact that it remains true while controlling for students’ own socio-economic background suggests important peer effects on student educational expectations in these countries. This might be because peers’ aspirations influence a student’s aspirations or because the student does not benefit from models of highly-educated adults among other peers’ parents or, by extension, in the local community.
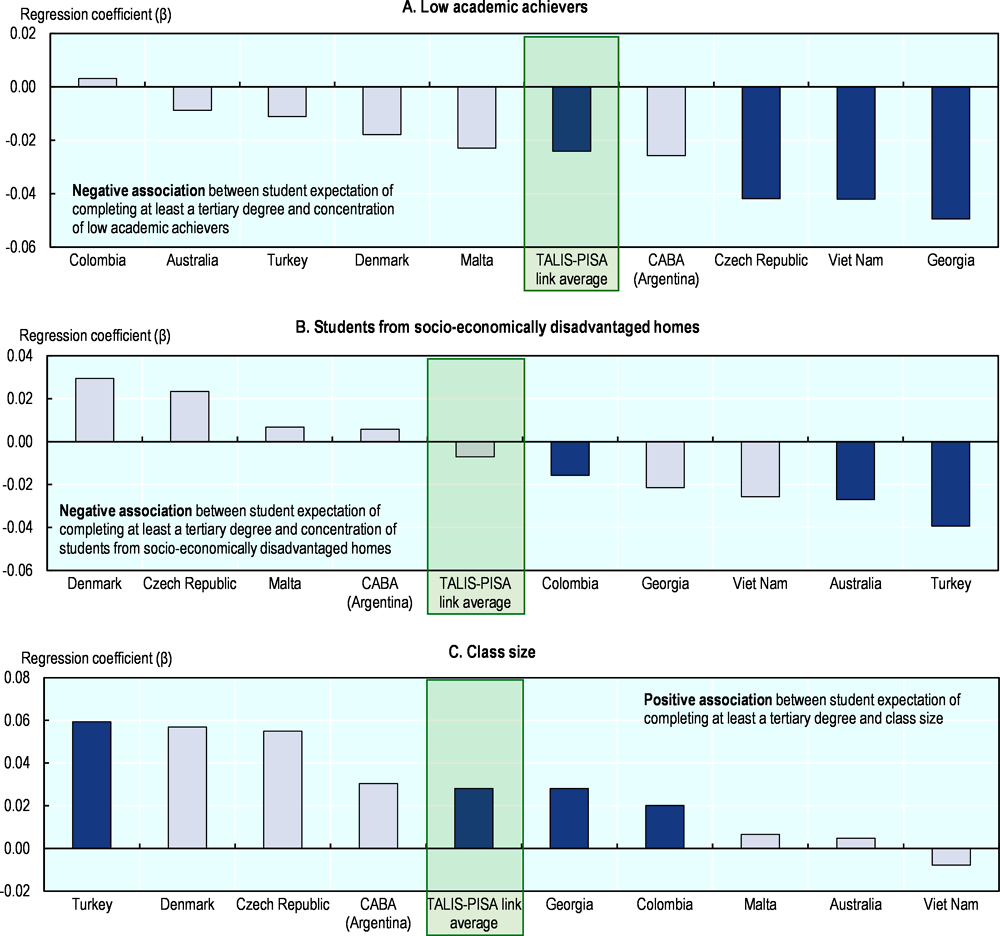
Notes: Results of logistic regressions based on responses of 15-year-old students and teachers. Controlling for the following classroom characteristics: share of students whose first language is different from the language(s) of instruction, low academic achievers, students with special needs, students with behavioural problems, students from socio-economically disadvantaged homes, academically gifted students, students who are immigrants or with a migrant background and students who are refugees; and for the following student characteristics: gender, immigrant background and index of economic, social and cultural status.
Teacher variables are averaged for all teachers within the school.
Statistically significant coefficients are marked in a darker tone (see Annex B).
Countries and economies are ranked in descending order of the expectation of completing at least a tertiary degree.
Sources: OECD, TALIS 2018 Database; OECD, PISA 2018 Database, Table 3.22.
Finally, these multiple regression analyses also highlight the potential role of class size in shaping both student self-concept and student educational aspirations (Tables 3.21 and 3.22). The larger the classes, the more favourable the outcomes (while accounting for classroom composition). The relationship with student perception of PISA test difficulty is significant in Denmark, Malta and Turkey and on average across countries. The relationship with educational aspirations is significant in Colombia, Georgia and Turkey and on average across countries. This suggests that the larger the peer group is, the better it is for student social-emotional outcomes. This might be due to the fact that the larger the class is, the more varied the family background, attitudes, behaviours and aspirations of other classmates are, and the richer and more favourable student social-emotional development is. Yet, most likely, the presence of a selection bias is also partly at play. A school’s average class size partly captures unobserved characteristics about school intake, such as students’ social-emotional skills. These fall outside those reported by teachers and which are accounted for in the regression (students’ academic and socio-behavioural characteristics). It is common practice for schools and school systems to implement specific grouping strategies and adjust class sizes to the needs of their students. A previous PISA report found there was a significant difference of more than three students per class between socio-economically advantaged and disadvantaged schools on average across the OECD, and that such a positive and significant difference was found in 39 education systems (OECD, 2018, p. 89[36]).
School culture and school leadership
Multiple linear regressions show that positive teacher-student relations typically matter for two classroom-related outcomes: student perception of classroom disciplinary climate and teacher enthusiasm (Tables 3.23 and 3.27). The more teachers report getting along with their students, the more disciplined the classrooms are on average across countries and economies, and in Australia, Colombia, Georgia and Turkey (and in Malta when focusing on reading teachers only [Table 3.24]) according to students. After controlling for classroom characteristics, the relationship remains significant in Colombia and Georgia (Table 3.25). Likewise, the more teachers report nurturing good relationships with students, the more students perceive them as enjoying teaching. This holds true on average across participating countries and economies, in Australia, Colombia, Denmark, Georgia and Turkey. It remains significant in Australia, Colombia and Georgia after accounting for classroom characteristics (Table 3.29).
With regard to school leadership, the more frequently principals report collaborating with teachers to solve classroom discipline problems, the less disciplined the classroom climate is as reported by students. This relationship is found to be significant in Colombia, the Czech Republic, Denmark, Georgia and Malta either when focusing on all teachers of the school or on reading teachers only (Tables 3.31 and 3.32). It tends to remain significant after accounting for classroom composition (Tables 3.33 and 3.34).
Teachers’ use of working time
The way teachers use and allocate their working time across various professional activities is related to the way students perceive their learning environment and shape their educational expectations. In particular, the amount of time teachers spend on extracurricular activities is positively related to student perceptions of classroom disciplinary climate and teacher enthusiasm. It is also positively related to students’ educational expectations, at least in a couple of countries (Tables 3.35, 3.39 and 3.43). This is particularly important for classroom disciplinary climate. The more teachers spend time with students on extracurricular activities, the better the classroom disciplinary climate on average across countries, in the Czech Republic, Malta, Turkey and Viet Nam. After accounting for classroom composition, the relationship remains significant except in Viet Nam (Figure 3.8). Extracurricular activities at school usually aim to achieve a broad set of goals, such as physical exercise and health, the development of creativity and practice or appreciation of the arts, or volunteering and engagement with the community (OECD, 2020, p. 146[30]). Past research found that participation in extracurricular activities can help students develop social-emotional skills, such as persistence, teamwork or a stronger sense of belonging at school. A literature review of studies conducted on extracurricular activities in the early 2000s looked at the relationships between adolescents’ participation in extracurricular activities and their academic achievement, substance use, sexual activity, psychological adjustment, and delinquency (Farb and Matjasko, 2012[37]). Yet, this meta-analysis did not emphasise the importance of teachers as important moderators in these relationships. The finding from this report suggests that having the teachers themselves spend time with students outside of the usual lessons is beneficial to the classroom climate and possibly to the overall learning environment and development of students.
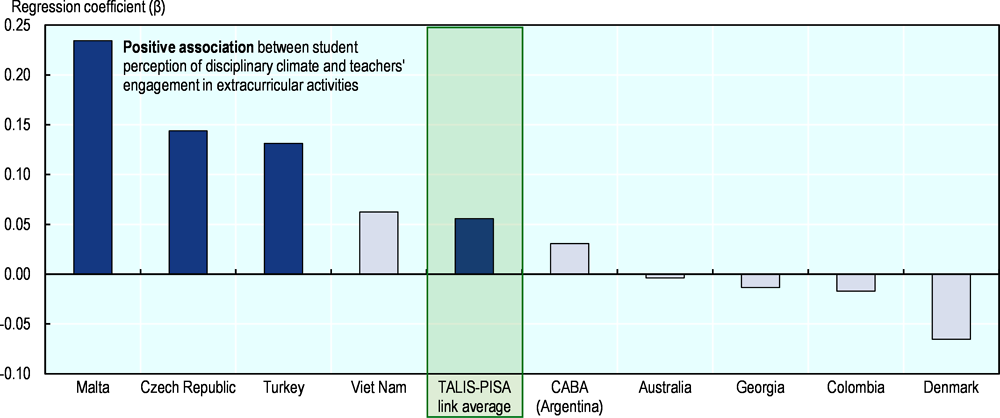
Notes: Results of linear regression based on responses of 15-year-old students and teachers. Controlling for the following classroom characteristics: class size, share of students whose first language is different from the language(s) of instruction, low academic achievers, students with special needs, students with behavioural problems, students from socio-economically disadvantaged homes, academically gifted students, students who are immigrants or with a migrant background and students who are refugees; and for the following student characteristics: gender, immigrant background and index of economic, social and cultural status.
Teacher variables are averaged for all teachers within the school.
Statistically significant coefficients are marked in a darker tone (see Annex B).
Countries and economies are ranked in descending order of the change in the index of student perception of the classroom disciplinary climate.
Sources: OECD, TALIS 2018 Database; OECD, PISA 2018 Database, Table 3.37.
Another teacher activity that matters for students’ self-concept and formation of educational expectations is the marking and correcting of student work (Figure 3.9). The more hours teachers report spending on this per week, the less difficult students find the PISA test and the more likely they expect to complete at least a tertiary degree. Together with the positive relationship found in Chapter 2 with student achievement, this finding points to the key role teachers’ engagement plays in evaluating, reflecting and communicating on student progress in student academic success and educational expectations. This is consistent with findings from past research highlighting the “power of feedback” (Hattie and Timperley, 2007[38]; Wisniewski, Zierer and Hattie, 2020[39]). Results from a recent meta-analysis (Wisniewski, Zierer and Hattie, 2020[39]) indicate a medium effect of feedback on student learning. Yet, the impact of feedback is substantially influenced by what is conveyed. Furthermore, feedback has higher impact on cognitive skills outcomes than motivational and behavioural outcomes.
Like extracurricular activities, marking and correcting student work in a constructive and efficient manner seems to be a valuable way for teachers to support student development. Yet, as commented in Chapter 2, the relationship may run in the opposite direction: that it is because students have higher expectations and greater self-concept in some schools than in others that teachers in these schools invest more time in assessing and marking these students in order to meet their expectations.
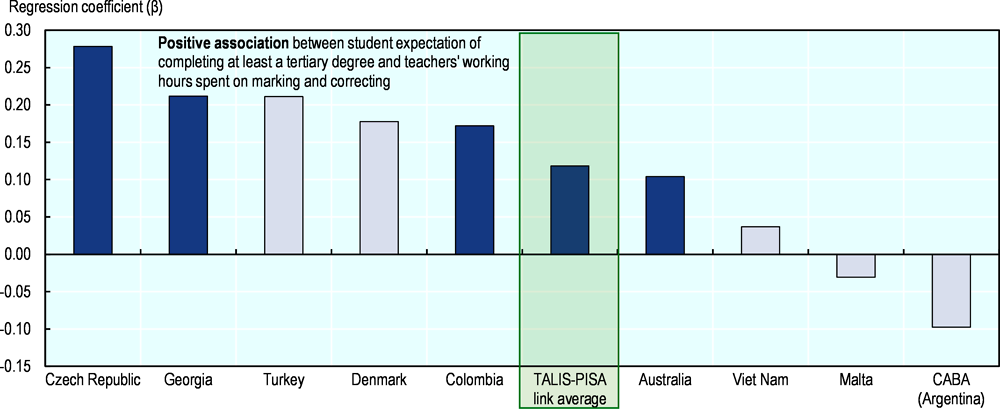
Notes: Results of linear regression based on responses of 15-year-old students and teachers. Controlling for the following classroom characteristics: class size, share of students whose first language is different from the language(s) of instruction, low academic achievers, students with special needs, students with behavioural problems, students from socio-economically disadvantaged homes, academically gifted students, students who are immigrants or with a migrant background and students who are refugees; and for the following student characteristics: gender, immigrant background and index of economic, social and cultural status.
Teacher variables are averaged for all teachers within the school.
Statistically significant coefficients are marked in a darker tone (see Annex B).
Countries and economies are ranked in descending order of the change in the expectation of completing at least a tertiary degree.
Sources: OECD, TALIS 2018 Database; OECD, PISA 2018 Database, Table 3.44.
Other teacher activities are related to student perception of their learning environment and educational aspirations, yet not in a favourable way, suggesting a reverse causality. For example, the less disciplined a classroom is, the more time teachers report spending on communication and co-operation with parents on average across countries but also in the Czech Republic, Turkey and Viet Nam (and Colombia after controlling for classroom composition) (Table 3.35). Also, the lower student educational expectations are, the more teachers report spending time on team work and dialogue with colleagues in their school on average across countries and in Georgia and Turkey (and the Czech Republic after accounting for classroom composition) (Table 3.43). Similarly, the less likely students are to aspire to complete a tertiary education degree, the more often teachers participate in school management on average across countries and in Australia, Turkey and Viet Nam (and CABA [Argentina] after controlling for classroom composition). For a few countries, these relationships disappear after controlling for classroom composition, which suggests that the student’s classroom characteristics mediate the relationship between the student’s aspiration and teachers’ engagement in school management and dialogue with families (Tables 3.37 and 3.44). This does not necessarily mean that communicating with parents and colleagues is detrimental to student social-emotional development. Rather, it likely means that teachers spend more time doing this when they feel students need it.
Teacher initial education
The level and content of teachers’ formal education seem to matter for students’ perceptions of their learning environment and their own educational expectations. One original finding is the positive relationship between the share of teachers holding a master’s or a doctorate degree in the school and student expectation of completing at least a tertiary degree (Table 3.45). The greater the number of teachers who hold a master’s or a doctorate degree at the school, the more likely students are to expect completing a tertiary degree on average across countries, as well as in the Czech Republic and Turkey. This remains true even after accounting for classroom socio-demographic and academic composition (as reported by the teachers) (Figure 3.10), suggesting that there is a net “effect” highly-educated teachers have on the way students shape their educational aspirations. This may be because these teachers are better informed about the existing tracks toward completing a tertiary degree, or because they embody students’ higher educational aspirations. In addition, the more teachers felt prepared for at least some, if not all, the subject(s) they teach, the higher the educational expectations of the students. This holds true on average across countries, as well as in the Czech Republic, Georgia, Malta and Viet Nam, but only remains significant for Georgia and Viet Nam after controlling for classroom socio-demographic and academic composition (Tables 3.47 and 3.48).
These results show that teachers’ levels of education (and perceived levels of preparation) may be related to student educational aspirations in a couple of the nine participating education systems. This adds to the debate and the lack of consensus on the effect of teacher education on student achievement (see Chapter 2 on this). While Rivkin, Hanushek and Kain (2005[40]) report no clear evidence that a master’s degree improves teacher effectiveness on student academic achievement, the TALIS-PISA link data analysis suggests that a master’s or a doctoral degree and appropriate teacher initial preparation may make a difference for different student outcomes, namely student educational aspirations. Yet, once again and despite the controls introduced in the analyses to account for classroom composition and student personal characteristics, the direction of the relationship could potentially be the reverse. Teachers’ credentials and certification can influence teachers’ employment conditions and, in particular, school assignment (OECD, 2018[36]).13 Teachers with more education might work in different schools, either because they are given more choice in school assignment or because education authorities allocate teachers to different schools based on their qualifications. Teacher assignment to schools might well be driven by teacher education level as well as the academic level and socio-demographic composition of the school and the social-emotional skills of its students or a combination of the above. In education systems offering several educational programmes to students from an early age, such as the Czech Republic and Turkey (OECD, (2020[30]), Figure V.3.2), more educated teachers are more likely to teach in the more academic and general tracks with students who have higher educational expectations. All this could explain the positive relationship found between teacher educational level and student educational expectations observed in the Czech Republic and Turkey.
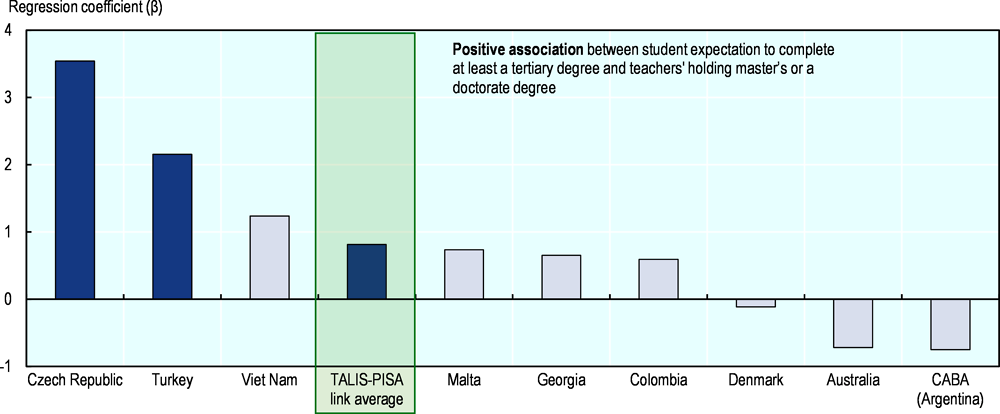
Notes: Results of a logistic regression based on responses of 15-year-old students and teachers. Controlling for the following classroom characteristics: share of students whose first language is different from the language(s) of instruction, low academic achievers, students with special needs, students with behavioural problems, students from socio-economically disadvantaged homes, academically gifted students, students who are immigrants or with a migrant background and students who are refugees; and for the following student characteristics: gender, immigrant background and index of economic, social and cultural status.
Teacher variables are averaged for all teachers within the school.
Statistically significant coefficients are marked in a darker tone (see Annex B).
Countries and economies are ranked in descending order of the change in the expectation of completing at least a tertiary degree.
Sources: OECD, TALIS 2018 Database; OECD, PISA 2018 Database, Table 3.46.
Teachers’ participation in professional development
There is no one single feature of teacher professional development activities that seems to matter for more than one of the four student social-emotional outcomes under scrutiny. Each outcome is related to specific features of professional development activities. Having teachers physically attend courses/seminars in a school seems beneficial to classroom disciplinary climate as perceived by the students (Table 3.50). This holds on average across participating countries but also in Australia, Denmark and Turkey and remains true, as well as becomes true, for Malta after accounting for classroom composition (Table 3.52). The content of teacher professional development activities matters for students’ perception of a teacher’s enthusiasm. It is associated as well with students’ educational expectations of completing a tertiary degree (Tables 3.53 and 3.57). The more teachers in a school participate in professional development focusing on the knowledge and understanding of their subject fields, the more students feel that their teachers like and enjoy teaching. This positive relationship is significant on average across participating countries, in the Czech Republic, Malta and Viet Nam, and remains significant even after controlling for classroom composition (Table 3.55).
Teachers’ well-being and job satisfaction
Each of the four student social-emotional outcomes is related in some way to teachers’ own social-emotional well-being at work. Students tend to find their teachers more interested in teaching when those teachers report lower levels of work-related stress on average in their school. This holds true in CABA (Argentina), Denmark and Viet Nam, and on average across all countries and economies when focusing on reading teachers only (this is also consistent with results from the lasso regression on the pooled sample) (Table 3.64). This relation remains generally significant after accounting for classroom composition (Figure 3.11).
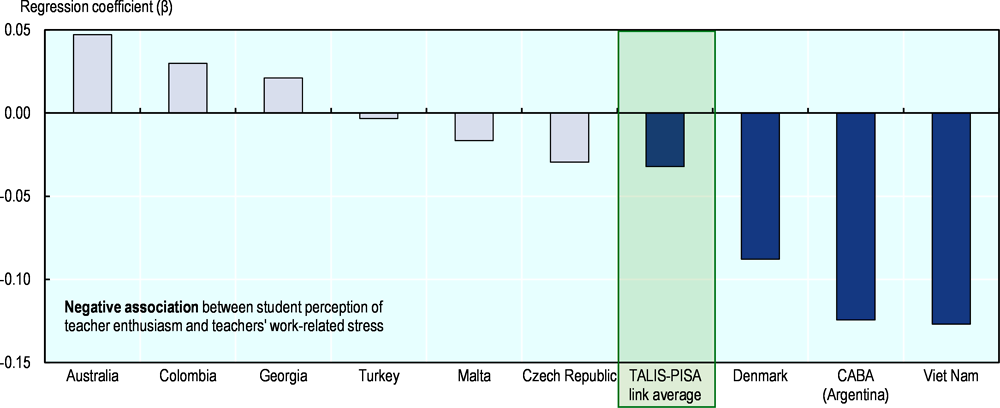
Notes: Results of linear regression based on responses of 15-year-old students and teachers. Controlling for the following classroom characteristics: class size, share of students whose first language is different from the language(s) of instruction, low academic achievers, students with special needs, students with behavioural problems, students from socio-economically disadvantaged homes, academically gifted students, students who are immigrants or with a migrant background and students who are refugees; and for the following student characteristics: gender, immigrant background and index of economic, social and cultural status.
Teacher variables are averaged only for subject domain teachers. The analysis is based on a sample restricted to schools with at least one subject domain teacher.
Statistically significant coefficients are marked in a darker tone (see Annex B).
Countries and economies are ranked in descending order of the change in the index of student perception of teacher enthusiasm.
Sources: OECD, TALIS 2018 Database; OECD, PISA 2018 Database, Table 3.66.
Teachers’ satisfaction with their work environment seems to be a positive factor for two student social-emotional outcomes: student behaviour in class as measured by classroom disciplinary climate (the relationship is significant on average across countries and economies, in Australia, CABA [Argentina] and Turkey) and with students’ feeling of mastery over the PISA test (the relation is significant on average across countries, in Australia, Colombia, Georgia and Turkey) (Tables 3.59 and 3.67). Yet, these relationships vanish in almost all countries once classroom characteristics have been accounted for (Tables 3.61 and 3.68).
The TALIS-PISA link data also indicate some relation between teachers’ satisfaction with salary and student educational expectations. On average across countries and economies as well as in Malta, Turkey and Viet Nam (and in the Czech Republic after accounting for classroom composition), the less satisfied teachers are with their salary in the school, the more likely students are to contemplate completing at least a tertiary degree (Tables 3.69 and 3.70). Under the same conditions on average across countries and economies as well as in Malta and Turkey, students also feel more able to master the PISA test (Tables 3.67 and 3.68). This suggests that some teachers not only project higher expectations for themselves in terms of salary level but also influence the educational expectations and confidence of their students upward. This influence may be direct when teachers are very explicit about their expectations vis-à-vis students or suggestive when teachers implicitly transmit their beliefs about valuable jobs and studies to students. The fact that this relationship remains significant after controlling for classroom composition in all concerned countries but Malta suggests that it is not fully mediated by the influence of students’ classmates. Colombia is the exception to this pattern: the more satisfied teachers are with their salary, the higher students’ educational expectations. Indicators from Education at a Glance suggest that this relationship is mediated by teacher experience as Colombian teachers receive a substantial increase in salary after 10 years of experience (one of the sharpest worldwide) and teachers who reach the top of the salary scale can earn more than double the starting salary (OECD, 2020[41]). However, further analysis of Colombia’s TALIS-PISA link data shows that the relationship remains significantly positive after controlling for both teacher experience and classroom composition.
Summary
Three main conclusions can be drawn from the findings presented above.
First, there seem to be clear school patterns of disciplinary climate. There is a high degree of alignment in different stakeholders’ perceptions of school climate. And there is consistency in the measures taken by school leaders and teachers to address disciplinary issues in the school. Teachers’ reporting of disciplinary issues is matched by students reporting of the same in all countries/economies with the exception of Georgia and Turkey where the relationship is not significant. Likewise, the less disciplined the classroom climate is, as reported by students, the more frequently principals report collaborating with teachers to solve classroom discipline problems, and the more time teachers report spending on communication and co-operation with parents. This does not necessarily mean that principals’ and teachers’ remedial measures are detrimental to student behaviour in class. Rather, principals and teachers invest more time in these kinds of activities when they feel students are in need of it. Some findings suggest that such vicious circles could be inverted by establishing positive relationships between teachers and students, and promoting a favourable climate for teachers’ work well-being. Indeed, results show that the more teachers report nurturing good relationships with students, the more students perceive them as enjoying teaching and the better it is for the disciplinary climate. In addition, students tend to find their teachers more interested in their teaching when teachers report lower levels of work-related stress on average in the school.
Second, the characteristics and number of classmates matter for student social-emotional skills, in particular for student self-concept. The greater the number of academically gifted students enrolled in the classroom, the more students feel able to succeed in the PISA test. As well, as the share of socio-economically disadvantaged students in the classroom increases, student expectation of completing tertiary studies tends to decrease. These findings suggest the positive effect of increased exposure to high-performing peers on students’ immediate self-concept, and a greater sensitivity of longer-term self-concept to the presence of socially disadvantaged peers. On average, students might be more easily influenced by the lower aspirations of their socially disadvantaged peers or by the lack of highly educated adults as role models among their peers’ parents or, by extension, in the local community.
Third, although causality cannot be established, two teacher characteristics and practices have been highlighted as positively related to student social-emotional development: the level and quality of teacher pre-service training, and the way teachers use their working time. Results show that the greater the number of teachers who hold a master’s or a doctorate degree there are in the school, and the more they felt prepared to teach their subject after their initial training, the more likely students are to expect to complete at least a tertiary degree. Then, as the amount of time teachers spend on extracurricular activities increases, the more students report that the classroom is disciplined, that the teacher is interested and motivated to teach and that they expect to complete at least a tertiary degree. In addition, the more time teachers spend on marking and correcting student work, the higher the level of student self-concept of doing well in the PISA test and completing tertiary studies. These findings suggest that spending quality time with students outside of the usual lessons and devoting time to assess student work and communicate progress to students are valuable ways to support student social-emotional development.
References
[45] Avvisati, F., N. Le Donné and M. Paccagnella (2019), “A meeting report: cross-cultural comparability of questionnaire measures in large-scale international surveys”, Measurement Instruments for the Social Sciences, Vol. 1/8, pp. 1-10, https://doi.org/10.1186/s42409-019-0010-z.
[6] Barratt, E. (1995), “History of personality and intelligence theory and research”, in Saklofske, D. and M. Zeidner (eds.), International Handbook of Personality and Intelligence. Perspectives on Individual Differences, Springer, Boston, MA, https://doi.org/10.1007/978-1-4757-5571-8_1.
[22] Blazar, D. et al. (2017), “Attending to general and mathematics-specific dimensions of teaching: Exploring factors across two observation instruments”, Educational Assessment, Vol. 22/2, pp. 71-94, https://doi.org/10.1080/10627197.2017.1309274.
[12] Blazar, D. and M. Kraft (2017), “Teacher and teaching effects on students’ attitudes and behaviors”, Educational Evaluation and Policy Analysis, Vol. 39/1, pp. 146-170, https://doi.org/10.3102/0162373716670260.
[9] Borghans, L. et al. (2008), “The economics and psychology of personality traits”, Journal of Human Resources, Vol. 43/4, pp. 972-1059, https://doi.org/10.1353/jhr.2008.0017.
[44] Borgonovii, F. and J. Pál (2016), “A Framework for the Analysis of Student Well-Being in the PISA 2015 Study: Being 15 In 2015”, OECD Education Working Papers, No. 140, OECD Publishing, Paris, https://doi.org/10.1787/5jlpszwghvvb-en.
[27] Breda, T. et al. (2020), “Do Female Role Models Reduce the Gender Gap in Science? Evidence from French High Schools”, PSE Working Papers, No. 2018-06, HAL Sciences de l’Homme et de la Société, https://halshs.archives-ouvertes.fr/halshs-01713068v3.
[32] Carrell, S. and M. Hoekstra (2010), “Externalities in the classroom: How children exposed to domestic violence affect everyone’s kids”, American Economic Journal: Applied Economics, Vol. 2/1, pp. 211-228, https://doi.org/10.1257/app.2.1.211.
[28] Carrell, S., M. Page and J. West (2010), “Sex and science: How professor gender perpetuates the gender gap”, The Quarterly Journal of Economics, Vol. 125/3, pp. 1101-1144, https://doi.org/10.1162/qjec.2010.125.3.1101.
[10] Chetty, R. et al. (2011), “How does your kindergarten classroom affect your earnings? Evidence from Project STAR”, The Quarterly Journal of Economics, Vol. 126/4, pp. 1593-1660, https://doi.org/10.1093/qje/qjr041.
[14] Chetty, R., J. Friedman and J. Rockoff (2014), “Measuring the impacts of teachers II: Teacher value-added and student outcomes in adulthood”, American Economic Review, Vol. 104/9, pp. 2633-2679, https://doi.org/10.1257/aer.104.9.2633.
[7] Duckworth, A. et al. (2007), “Grit: Perseverance and passion for long-term goals”, Journal of Personality and Social Psychology, Vol. 92/6, pp. 1087-1101, https://doi.org/10.1037/0022-3514.92.6.1087.
[8] Duckworth, A., P. Quinn and E. Tsukayama (2012), “What No Child Left Behind leaves behind: The roles of IQ and self-control in predicting standardized achievement test scores and report card grades”, Journal of Educational Psychology, Vol. 104/2, pp. 439-451, https://doi.org/10.1037/a0026280.
[34] Echazarra, A. et al. (2016), “How teachers teach and students learn: Successful strategies for school”, OECD Education Working Papers, No. 130, OECD Publishing, Paris, https://dx.doi.org/10.1787/5jm29kpt0xxx-en.
[37] Farb, A. and J. Matjasko (2012), “Recent advances in research on school-based extracurricular activities and adolescent development”, Developmental Review, Vol. 32/1, pp. 1-48, https://doi.org/10.1016/j.dr.2011.10.001.
[33] Gaviria, A. and S. Raphael (2001), “School-based peer effects and juvenile behavior”, Review of Economics and Statistics, Vol. 83/2, pp. 257-268, https://doi.org/10.1162/00346530151143798.
[15] Gershenson, S. (2016), “Linking teacher quality, student attendance, and student achievement”, Education Finance and Policy, Vol. 11/2, pp. 125-149, https://doi.org/10.1162/EDFP_a_00180.
[23] Hafen, C. et al. (2015), “Teaching through interactions in secondary school classrooms: Revisiting the factor structure and practical application of the classroom assessment scoring system-secondary”, The Journal of Early Adolescence, Vol. 35/5-6, pp. 651-680, https://doi.org/10.1177/0272431614537117.
[4] Hanushek, E. and S. Rivkin (2010), “Generalizations about using value-added measures of teacher quality”, American Economic Review, Vol. 100/2, pp. 267-271, https://doi.org/10.1257/aer.100.2.267.
[38] Hattie, J. and H. Timperley (2007), “The power of feedback”, Review of Educational Research, Vol. 77/1, pp. 81-112, https://doi.org/10.3102/003465430298487.
[3] Hoy, W., J. Hannum and M. Tschannen-Moran (1998), “Organizational climate and student achievement: A parsimonious and longitudinal view”, Journal of School Leadership, Vol. 8/4, pp. 336-359, https://doi.org/10.1177/105268469800800401.
[16] Jackson, C. (2018), “What do test scores miss? The importance of teacher effects on non–test score outcomes”, Journal of Political Economy, Vol. 126/5, pp. 2072-2107, https://doi.org/10.1086/699018.
[26] Jackson, C. (2012), “Non-Cognitive Ability, Test Scores, and Teacher Quality: Evidence from 9th Grade Teachers in North Carolina”, NBER Working Paper Series, No. 18624, National Bureau of Economic Research, Cambridge, MA, https://doi.org/10.3386/w18624.
[17] Jennings, J. and T. DiPrete (2010), “Teacher effects on social and behavioral skills in early elementary school”, Sociology of Education, Vol. 83/2, pp. 135-159, https://doi.org/10.1177/0038040710368011.
[43] Kankaraš, M. and J. Suarez-Alvarez (2019), “Assessment framework of the OECD Study on Social and Emotional Skills”, OECD Education Working Papers, No. 207, OECD Publishing, Paris, https://dx.doi.org/10.1787/5007adef-en.
[18] Koedel, C. (2008), “Teacher quality and dropout outcomes in a large, urban school district”, Journal of Urban Economics, Vol. 64/3, pp. 560-572, https://doi.org/10.1016/j.jue.2008.06.004.
[19] Kraft, M. (2019), “Teacher effects on complex cognitive skills and social-emotional competencies”, Journal of Human Resources, Vol. 54/1, pp. 1-36, https://doi.org/10.3368/jhr.54.1.0916.8265R3.
[20] Ladd, H. and L. Sorensen (2017), “Returns to teacher experience: Student achievement and motivation in middle school”, Education Finance and Policy, Vol. 12/2, pp. 241-279, https://doi.org/10.1162/EDFP_a_00194.
[35] Le Donné, N., P. Fraser and G. Bousquet (2016), “Teaching Strategies for Instructional Quality: Insights from the TALIS-PISA Link Data”, OECD Education Working Papers, No. 148, OECD Publishing, Paris, https://dx.doi.org/10.1787/5jln1hlsr0lr-en.
[11] Moffitt, T. et al. (2011), “A gradient of childhood self-control predicts health, wealth, and public safety”, Proceedings of the National Academy of Sciences of the United States of America, Vol. 108/7, pp. 2693-2698, https://doi.org/10.1073/pnas.1010076108.
[41] OECD (2020), Education at a Glance 2020: OECD Indicators, OECD Publishing, Paris, https://dx.doi.org/10.1787/69096873-en.
[24] OECD (2020), Global Teaching InSights: A Video Study of Teaching, OECD Publishing, Paris, https://dx.doi.org/10.1787/20d6f36b-en.
[30] OECD (2020), PISA 2018 Results (Volume V): Effective Policies, Successful Schools, PISA, OECD Publishing, Paris, https://dx.doi.org/10.1787/ca768d40-en.
[42] OECD (2020), TALIS 2018 Results (Volume II): Teachers and School Leaders as Valued Professionals, TALIS, OECD Publishing, Paris, https://dx.doi.org/10.1787/19cf08df-en.
[1] OECD (2019), PISA 2018 Results (Volume III): What School Life Means for Students’ Lives, PISA, OECD Publishing, Paris, https://dx.doi.org/10.1787/acd78851-en.
[2] OECD (2019), TALIS 2018 Results (Volume I): Teachers and School Leaders as Lifelong Learners, TALIS, OECD Publishing, Paris, https://dx.doi.org/10.1787/1d0bc92a-en.
[36] OECD (2018), Effective Teacher Policies: Insights from PISA, PISA, OECD Publishing, Paris, https://dx.doi.org/10.1787/9789264301603-en.
[25] OECD (2015), Skills for Social Progress: The Power of Social and Emotional Skills, OECD Skills Studies, OECD Publishing, Paris, https://dx.doi.org/10.1787/9789264226159-en.
[13] Pianta, R. and B. Hamre (2009), “Conceptualization, measurement, and improvement of classroom processes: Standardized observation can leverage capacity”, Educational Researcher, Vol. 38/2, pp. 109-119, https://doi.org/10.3102/0013189X09332374.
[40] Rivkin, S., E. Hanushek and J. Kain (2005), “Teachers, schools, and academic achievement”, Econometrica: Journal of the Econometric Society, Vol. 73/2, pp. 417-458, https://doi.org/10.1111/j.1468-0262.2005.00584.x.
[21] Ruzek, E. et al. (2015), “Using value-added models to measure teacher effects on students’ motivation and achievement”, The Journal of Early Adolescence, Vol. 35/5-6, pp. 852-882, https://doi.org/10.1177/0272431614525260.
[31] Sacerdote, B. (2011), “Peer effects in education: How might they work, how big are they and how much do we know thus far?”, in Hanushek, E., S. Machin and L. Woessmann (eds.), Handbook of the Economics of Education, Elsevier, Amsterdam, https://doi.org/10.1016/B978-0-444-53429-3.00004-1.
[5] Todd, P. and K. Wolpin (2007), “The production of cognitive achievement in children: Home, school, and racial test score gaps”, Journal of Human Capital, Vol. 1/1, pp. 91-136, https://doi.org/10.1086/526401.
[29] Van de gaer, E. et al. (2012), “The reference group effect: An explanation of the paradoxical relationship between academic achievement and self-confidence across countries”, Journal of Cross-Cultural Psychology, Vol. 43/8, pp. 1205-1228, https://doi.org/10.1177/0022022111428083.
[39] Wisniewski, B., K. Zierer and J. Hattie (2020), “The power of feedback revisited: A meta-analysis of educational feedback research”, Frontiers in Psychology, Vol. 10/3087, pp. 1-14, https://doi.org/10.3389/FPSYG.2019.03087.
Notes
← 1. TALIS-PISA link: Teaching and Learning International Survey (TALIS) and Programme for International Student Assessment (PISA) link covers schools that participated in both TALIS and PISA.
← 2. For instance, analysis based on TALIS data show that, in the case of teachers’ satisfaction with the profession, only a small percentage (i.e. 4%) of the total variance comes from differences between schools (OECD, 2020[42]).
← 3. The terms “social and emotional outcomes” and “social and emotional development” are used in continuity with the terminology employed in other OECD work – see, in particular, Box I.1 of the OECD Working Paper by Kankaraš and Suarez-Alvarez (2019[43]).
← 4. PISA measures classroom disciplinary climate by asking students how frequently (“never or hardly ever”, “some lessons”, “most lessons”, “every lesson”) the following things happen in their language-of-instruction lessons: “Students don’t listen to what the teacher says”; “There is noise and disorder”; “The teacher has to wait a long time for students to quiet down”; “Students cannot work well”; and “Students don’t start working for a long time after the lesson begins”. These statements were combined to create the index of classroom disciplinary climate whose average is 0 and standard deviation is 1 across OECD countries. Positive values on this scale mean that the student enjoys a better disciplinary climate in language-of-instruction lessons than the average student in OECD countries.
← 5. PISA measures student perception of teacher enthusiasm in language-of-instruction lessons. PISA asked 15-year-old students whether they agree (“strongly disagree”, “disagree”, “agree”, “strongly agree”) with the following statements about the teacher teaching the two language-of-instruction lessons they attended prior to sitting the PISA test: “It was clear to me that the teacher liked teaching us”; “The enthusiasm of the teacher inspired me”; “It was clear that the teacher likes to deal with the topic of the lesson”; and “The teacher showed enjoyment in teaching”. These statements were combined to create the index of teacher enthusiasm whose average is 0 and standard deviation is 1 across OECD countries. Positive values in this index mean that students perceived their language-of-instruction teachers to be more enthusiastic than the average student across OECD countries did.
← 6. The original PISA 2015 framework for student well-being was more comprehensive than the one retained in PISA 2018 and in this report. Beyond the cognitive and psychological dimensions of well-being, it included three additional dimensions: social, physical and material well-being (Borgonovii and Pál, 2016[44]).
← 7. PISA measures perception of difficulty of the PISA test by asking students how they feel about the reading tasks included in the test (“strongly agree”, “disagree”, “agree”, “strongly agree”): “There were many words I could not understand”; “Many texts were too difficult for me”; “I was lost when I had to navigate between different pages”. These statements were combined to create the index of perception of difficulty of the PISA test whose average is 0 and standard deviation is 1 across OECD countries. Positive values on this scale mean that the student finds the test more difficult.
← 8. Alternative coding was tried but the one discriminating expectations of completing at least a tertiary degree versus lower educational degrees was found to be subject to the largest differences between schools. Therefore, it was retained for the following analyses.
← 9. Unlike the other student outcomes, student educational expectation is coded as a binary variable. Therefore, the share of variance between schools cannot be estimated as it is for the continuous variables. The pseudo-R² of the logistic regression model, including dummies for all participating schools, is used as a proxy (see Annex B for more information).
← 10. In Georgia, schools show differences of similar magnitude in the other indicators of student interest in school.
← 11. Longer questions, including many sub-items, seem also to be a better option to enhance cross-cultural comparability of measurement (Avvisati, Le Donné and Paccagnella, 2019[45]).
← 12. This result is based on lasso regressions in which many predictors of student social-emotional development are included. This means that, among many other covariates, the share of low academic achievers and the share of students with behavioural problems are jointly introduced into the regressions.
← 13. An OECD report based on PISA 2018 data showed that teachers are sorted across schools with different socio-economic backgrounds according to their qualification level. More specifically, on average across OECD countries, only 69% of science teachers in disadvantaged schools have a university degree with a major in science while 79% of science teachers in advantaged schools did. This makes for a significant difference of 10 percentage points between the top and bottom quarters of school socio-economic profiles (OECD, 2018, p. 97[36]).