copy the linklink copied! Chapter 9. Which countries have improved and which countries have declined in performance over their participation in PISA?
This chapter reviews trends in mean performance, and in performance at the various levels of proficiency measured by PISA, between earlier PISA assessments (prior to 2015) and 2018.
PISA 2018 is the seventh round of the international assessment since the programme was launched in 2000. Every PISA test assesses students’ knowledge and skills in reading, mathematics and science; each assessment focuses on one of these subjects and provides a summary assessment of the other two (see “What is PISA?” at the beginning of this volume).
The first full assessment of each subject sets the scale and starting point for future comparisons. For reading, trend comparisons are possible starting from 2000. Mathematics was the major domain for the first time in 2003, and science in 2006. This means that it is not possible to measure the change in mathematics performance between PISA 2000 and PISA 2018, nor the change in science performance between PISA 2000, PISA 2003 and PISA 2018. In all subjects, the most reliable way to establish a trend in students’ performance is to compare all available results between the first full assessment of each subject and 2018.
Every third assessment provides an opportunity to revisit what it means to be proficient in a core subject and the kinds of contexts in which proficiency manifests itself. With the 2015 assessment, PISA moved its tests to computers; and by 2018, the reading and science tests had been revised to include digital contexts – such as simulations, in science, or online text formats, in reading – in the assessment (the transition to computer-based assessment will be completed in 2021, with the revision of the mathematics framework and test). Because of the changing nature of the test, PISA long-term trends reflect not only whether students have become better at mastering the reading tasks that proficient readers could successfully complete in 2000, or at solving the kinds of mathematics and science problems that were assessed in 2003 or 2006, they also indicate whether students’ skills are keeping pace with the changing nature of reading, mathematics and science in contemporary societies.1
-
Seven countries and economies saw improvements, on average, in the reading, mathematics and science performance of their students throughout their participation in PISA: Albania, Colombia, Macao (China), the Republic of Moldova, Peru, Portugal and Qatar. Seven countries/economies saw declining mean performance across all three subjects: Australia, Finland, Iceland, Korea, the Netherlands, New Zealand and the Slovak Republic.
-
The average trend in reading performance across OECD countries is hump-shaped: the slowly improving trend observed up to 2012 was followed by a decline over the 2012-2018 period, and in 2018, the average performance across OECD countries that participated in both assessments was close to the average performance observed in 2006. A similar, hump-shaped trajectory of mean performance was observed in science too, while the average trend in mathematics was flat.
-
No association between trends in mean performance and trends in performance gaps between high- and low-achieving students was observed in any subject. This means that there has been no obvious trade-off between pursuing excellence and closing performance gaps in education.
-
Six countries significantly increased enrolment rates in secondary education over their participation in PISA and maintained or improved their mean reading, mathematics and science performance (Albania, Brazil, Indonesia, Mexico, Turkey and Uruguay). This shows that the quality of education does not have to be sacrificed when increasing access to schooling.
For countries that participated in PISA in multiple years, trends in student performance indicate whether and by how much students’ skills in reading, mathematics and science are improving. But due to differences in when countries participated in PISA, not all countries and economies can compare their students’ performance across every PISA cycle. To better understand a country’s/economy’s trajectory and maximise the number of countries in the comparisons, this chapter focuses on estimates of the overall direction of trends in student performance, and of how that direction changed over time.2
This chapter reports trends in reading, mathematics and science performance for the 65 countries and economies that participated in PISA 2018 and at least one assessment prior to PISA 2015. These countries can compare performance over a period of six years or more, and typically over three or more assessments (except Panama, whose only previous participation was in 2009). Such trends are also referred to as “long-term trends”, in contrast to the short-term changes between PISA 2015 and PISA 2018 described in Chapter 8.3 The methodology underpinning the analysis of trends in performance in this chapter is detailed in Annex A7.
copy the linklink copied! Trends in mean performance
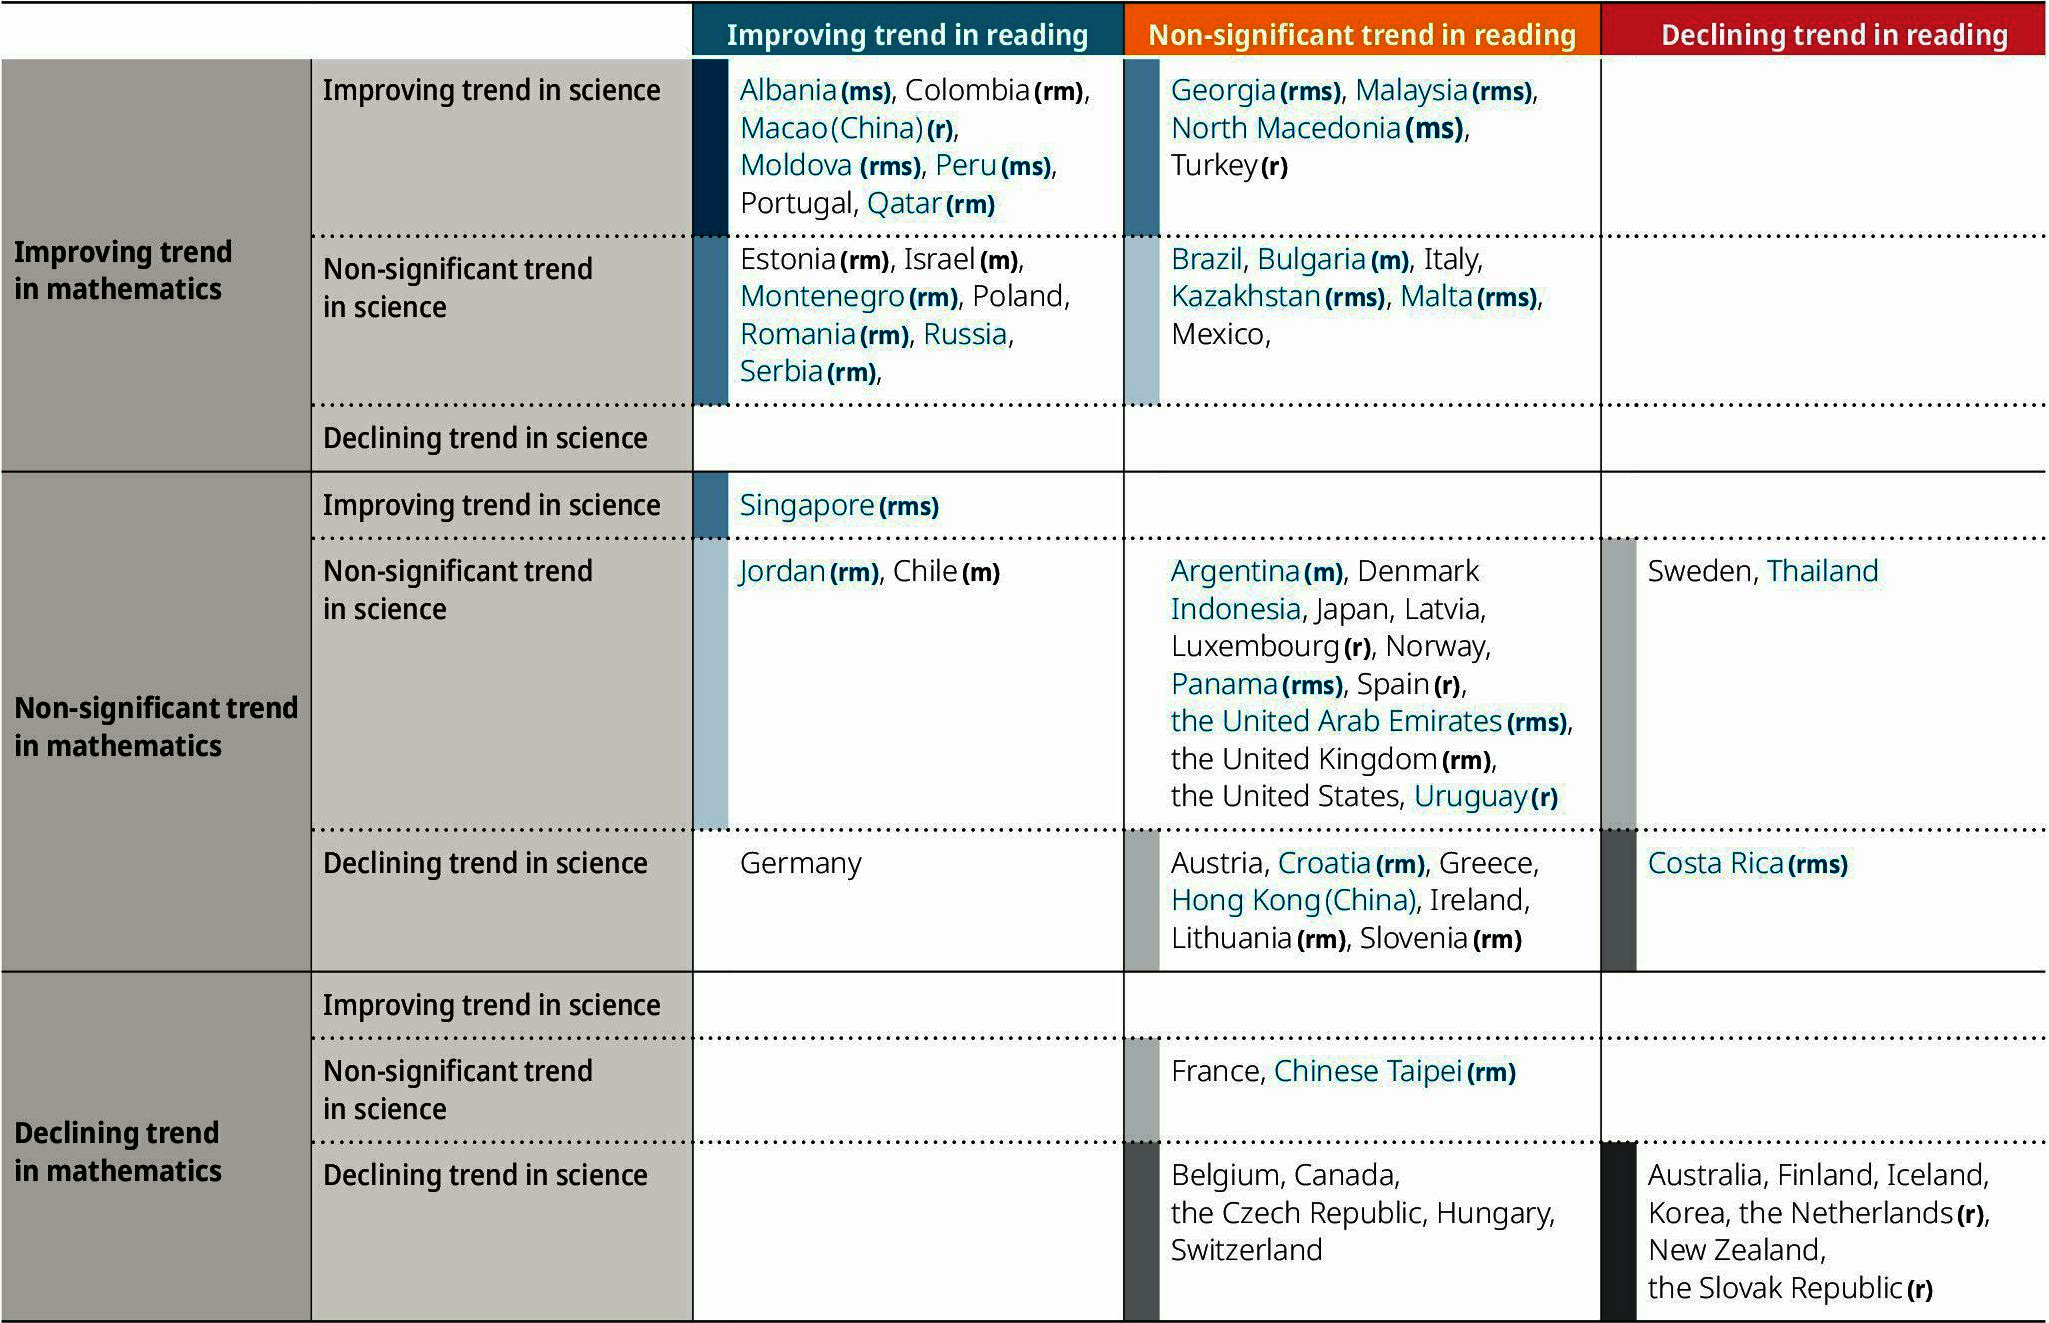
Table I.9.1 presents a synopsis of trends in mean performance in reading, mathematics and science. Countries in the top-left cell have shown significant improvements in mean performance, across all three subjects, over their participation in PISA. Countries in the bottom-right cell have shown significant declines in mean performance across all three subjects. (The period considered may differ depending on the subject and the country, and may influence the overall direction of the trend reported in Table I.9.1. Country-specific summaries, by subject, are presented in Annex D).
|
Table I.9.1. Trends in mean performance in reading, mathematics and science
|
|---|
|
Based on average three-year trend; only countries and economies that participated in PISA 2018 and at least one assessment prior to PISA 2015 are included
|
 |
|
Notes: A dark blue bar indicates improving mean performance across all three domains. Medium blue bars indicate improving mean performance across two (out of three) domains, with no decline in the remaining domain. Light blue bars indicate improving mean performance in one domain, with no decline in the remaining domains. |
|
White cells indicate non-significant improvement or decline across all three domains, as well as conflicting trends across domains. |
|
A dark grey bar indicates declining mean performance across all three domains. Medium grey bars indicate declining mean performance across two (out of three) domains, with no improvement in the remaining domain. Light grey bars indicate declining mean performance in one domain, with no improvement in the remaining domain. |
|
Not all countries and economies can compare their students’ performance over the same period; for many countries and economies, the period considered also differs depending on the subject (the longest possible period is 2000 to 2018 for reading, 2003 to 2018 for mathematics and 2006 to 2018 for science). The overall direction of trends reported in this table may depend on the period over which trends are computed. Letters in parentheses next to the country’s/economy’s name signal limitations in the period over which trends are computed, which may affect the comparability of trends with those of other countries/economies: |
|
r: Reading trends are computed over a shorter period than 2000, 2001 or 2002 to 2018. For Spain, the reading trend is computed over the 2000-2015 period. |
|
m: Mathematics trends are computed over a shorter period than 2003 to 2018. |
|
s: Science trends are computed over a shorter period than 2006 to 2018. |
|
Source: OECD, PISA 2018 Database, Tables I.B1.10, I.B1.11 and I.B1.12. |
Seven countries and economies saw an improving trend in their students’ mean reading, mathematics and science performance throughout their participation in PISA: Albania, Colombia, Macao (China), the Republic of Moldova (hereafter “Moldova”), Peru, Portugal and Qatar.
Twelve countries and economies saw significant improvements in students’ mean performance in two of the three subjects over their participation in PISA: in reading and mathematics in Estonia, Israel, Montenegro, Poland, Romania, the Russian Federation (hereafter “Russia”) and Serbia; in mathematics and science in Georgia, Malaysia, the Republic of North Macedonia (hereafter “North Macedonia”) and Turkey; and in reading and science in Singapore. In these countries and economies, student performance in the other subject did not change significantly over their participation in PISA.
Six more countries and economies saw improvements in their performance in mathematics, but not in reading or in science (Brazil, Bulgaria, Italy, Kazakhstan, Malta and Mexico). Three countries saw improvements in reading performance, but not in mathematics or in science (Chile, Germany and Jordan). In Germany, mean science performance actually declined, but over a shorter period, 2006-2018, than is used to establish the trend in reading and mathematics. These and other notable trends are analysed in greater detail in Annex D.
Seven countries/economies showed declining mean performance across all three subjects over their participation in PISA: Australia, Finland, Iceland, Korea, the Netherlands, New Zealand and the Slovak Republic. Six more countries/economies showed declining mean performance in at least two subjects: in mathematics and science, Belgium, Canada, the Czech Republic, Hungary and Switzerland; and in reading and science, Costa Rica.
Twelve countries and economies saw a decline in student performance in one subject only. Eight of these countries/economies saw declines in performance in science, including Germany, where mean performance improved in reading (see above), and Austria, Croatia, Greece, Hong Kong (China), Ireland, Lithuania and Slovenia; two countries/economies showed a decline in mathematics performance (France and Chinese Taipei); and two countries/economies in reading performance (Sweden and Thailand).
For 13 countries/economies, no significant improving or declining trend could be established in any of the subjects.
Curvilinear trajectories of performance
Several countries that participate in PISA can compare their performance over five or more PISA assessments, i.e. over a period of 12 years or longer. But over such a long period, not all trajectories have been linear. The average trend observed over successive PISA assessments does not capture the extent to which this trend corresponds to a steady, almost linear change, or, for example, to an increasingly positive trend or to an improving, but flattening trend (see Figure I.9.1 for an illustration of different possible trajectories). Even countries with no significant average trend may have seen a temporary slump in performance followed by a recovery, or a temporary improvement, followed by a return to prior levels of performance.
Figure I.9.1 categorises countries and economies into nine groups, depending on the shape of the trajectory of their reading performance (Table I.9.2 and Table I.9.3 provide the corresponding information for mathematics and science).4 Countries with an average improvement across at least five PISA assessments since PISA 2000, 2003 or 2006 are in the top row; countries with no significant positive or negative trend are in the middle row; and countries with a negative trend are in the bottom row. The column indicates whether the trend observed is a steady trend (middle column), or whether it is an accelerating, flattening or reversing trend.
Macao (China) is the only country/economy with a positive and accelerating trend in all three domains (reading, mathematics and science): student performance in Macao (China) improved over time, and more so in recent PISA cycles than in earlier PISA cycles. In contrast, Korea had a negative and accelerating trend in all three domains: student performance in Korea declined over time, with most of the decline observed over the most recent period.
The average trend in reading performance across OECD countries with valid data in all seven assessment cycles is hump-shaped: the slowly improving trend observed up to 2012 (OECD, 2014, pp. 383-384[1]) was followed by a decline between 2012 and 2018; and in 2018, the average performance across OECD countries that participated in every assessment stood close to the average performance observed in 2000, 2003 and 2006.5 The average trend in science followed a similar hump-shaped trajectory between 2006 and 2018. The average trend is flat in mathematics (all averages refer to the largest set of OECD countries that can compare their results in all assessment cycles for each subject) (Figure I.9.1, Table I.9.2, Table I.9.3, Tables I.B1.10, I.B1.11 and I.B1.12).
However, several countries/economies were able to move to a more positive trajectory in recent years, after a period of stagnation or decline. Sweden showed an improving trend in all three subjects between 2012 and 2018, reversing earlier declines in mean performance. In addition, a U-shaped trajectory in mean reading performance was observed in Argentina, the Czech Republic, Ireland, Slovenia and Uruguay; a similar trajectory in mean mathematics performance was observed in Denmark, Ireland, Jordan, Lithuania, Slovenia and the United Kingdom; and a U-shaped trajectory in mean science performance was observed in Jordan and Montenegro.6
Some countries and economies did not show significant improvement or deterioration over time; their performance remained stable over at least five PISA assessments in each domain. In particular, a “flat” trend was observed in the United States, where reading, mathematics and science scores remained about the same in every PISA assessment, with no particular trend of improvement or decline over its entire participation in PISA.
copy the linklink copied! Trends along the distribution of performance
Changes in a country’s/economy’s average performance can result from improvements or declines in performance at different points in the performance distribution. For example, in some countries/economies, improvement is observed along the entire distribution of performance, resulting in fewer students who perform at the lowest levels of proficiency and more students who attain the highest levels of proficiency. In other contexts, average improvement can mostly be attributed to large improvements amongst low-achieving students, with little or no change amongst high-achieving students. This may result in a smaller proportion of low-achieving students, but no increase in the share of top performers.

Notes: Figures are for illustrative purposes only. Countries and economies are grouped according to the overall direction of their trend (the sign and significance of the average three-year trend) and to the rate of change in the direction of their trend (the sign and significance of the curvature in the estimate of quadratic trends) (see Annex A7).
Only countries and economies with data from at least five PISA reading assessments are included. Not all countries and economies can compare their students’ performance over the same period. For each country/economy, the base year, starting from which reading results can be compared, is indicated in parentheses next to the country’s/economy’s name ( “00” = 2000, “01” = 2001, etc.). Both the overall direction and the change in the direction may be affected by the period considered.
OECD average-23 refers to the average of all OECD countries with valid data in all seven assessments; Austria, Chile, Estonia, Israel, Luxembourg, the Netherlands, the Slovak Republic, Slovenia, Spain, Turkey, the United Kingdom and the United States are not included in this average.
Source: OECD, PISA 2018 Database, Table I.B1.10.
Chapter 4 (Figure I.4.1) shows how performance gaps tend to be greater amongst higher-performing countries/economies, but with many exceptions to this general pattern. Does this cross-country relationship, observed in just one year, imply that there is a trade-off between pursuing excellence and closing performance gaps in education (Parker et al., 2018[2])?
A comparison of trends at the high and low ends of the performance distribution with trends in mean performance suggests that there is no trade-off, in general, between pursuing excellence and reducing learning gaps. Figure I.9.2 shows the linear trend in median performance alongside the trends observed at the 90th and 10th percentiles of the performance distribution (the median performance corresponds to the 50th percentile, or the mid-point, of the performance distribution). Trends at the 10th percentile indicate whether the lowest-achieving 10 % of students in a country/economy moved up the PISA scale over time. Similarly, trends at the 90th percentile indicate improvements amongst a country’s/economy’s high-achieving students (the 90th percentile is the point on the PISA scale below which exactly 90 % of students can be found).

Notes: Values that are statistically significantly different from 0 are marked in a darker tone (see Annex A3). OECD average-23 refers to the average of all OECD countries with valid data in all seven assessments; Austria, Chile, Estonia, Israel, Luxembourg, the Netherlands, the Slovak Republic, Slovenia, Spain, Turkey, the United Kingdom and the United States are not included in this average.
Countries and economies are grouped by the first PISA assessment starting from which trend comparisons are possible (base year), and are ranked, within each group, in descending order of the average three-year trend in median performance in reading.
Source: OECD, PISA 2018 Database, Table I.B1.13.
Amongst countries and economies with positive trends in reading performance, Albania saw improvements in student performance across the distribution, but more rapidly amongst its lowest-achieving students than amongst its highest-achieving students (Table I.B1.13). As a result, the achievement gap, measured by the inter-decile range (the distance between the 10th and 90th percentiles) shrank by more than 50 points between PISA 2000 and PISA 2018 (Table I.B1.28). Significant reductions in learning gaps were also observed in mathematics and science (for these subjects, trends could only be measured since Albania’s second participation in PISA in 2009). Singapore showed a pattern of widening gaps in reading performance since its first participation in 2009, with no improvement in reading at the 10th percentile and increasingly large improvements at the higher percentiles. But in mathematics and science, the gap between the highest- and lowest-performing students in Singapore narrowed over the period, thanks to stronger improvements amongst the lowest-performing students (there was no overall improvement, on average, in mathematics). Macao (China) showed a pattern of widening gaps in reading and science performance (since 2003 and 2006, respectively), but not in mathematics, where differences narrowed.
A significant widening of the gap in reading performance between high- and low-achieving students was observed in the United Arab Emirates, for which trend comparisons are only possible starting from 2012 onwards. Although average reading performance has remained stable since the United Arab Emirates’s first participation in PISA 2012, this hides significant improvements amongst high-performing students and rapidly declining performance amongst low-achieving students. Similar patterns of widening performance gaps were observed in mathematics and science (Figure I.9.2, Tables I.B1.29 and I.B1.30).
Overall, across all countries for which PISA can measure long trends in reading performance, there was no significant correlation between changes in average reading performance and changes in the gap in performance (Pearson’s rho = -0.21).7 There was also no significant association between trends in mean performance and trends in performance gaps between high- and low-achieving students in mathematics (rho = 0.14) and science (rho = 0.08).8 This lack of association suggests that there is no obvious trade-off between raising overall performance and narrowing learning gaps in education (Parker et al., 2018[2]).
Demographic shifts, such as increases in the immigrant population, and changes in enrolment rates (i.e. more disadvantaged 15-year-olds are now enrolled in secondary school than were in previous generations) sometimes contributed to widening disparities in performance. To determine the contribution of these changes to the observed performance trends, “adjusted trends” that neutralise the contribution of demographic and enrolment trends on performance trends are computed (see section “Average three-year trend in performance, adjusted for demographic changes” below).
copy the linklink copied! Improvements at the different levels of proficiency
PISA assesses reading, mathematics and science skills that are required to participate fully in a knowledge-based society that is increasingly reliant on digital technologies. These range from basic skills that can be considered as minimal capabilities required for further learning, for full participation in most of today’s institutions and for non-manual work, to the complex skills that only a few students in most countries have mastered, such as being able to understand and communicate complex information and being able to model complex situations mathematically. Trends in the proportion of low- and top-performing students indicate how the mastery of specific skills (as established in the described proficiency scale) has changed over time.9
The proportion of students who do not reach Level 2 on the PISA scales (low-achieving students) and the proportion of students who are able to score at Level 5 or 6 (top-performing students) are important indicators of the quality of a country’s/economy’s talent pool. Trends in the share of low-achieving students indicate the extent to which school systems are advancing towards providing all students with basic literacy and numeracy skills. Trends in the share of top-performing students indicate whether education systems are making progress in ensuring that young people can successfully use their reading, mathematics and science competences to navigate through a volatile, uncertain, complex and ambiguous environment.
On average across OECD countries, the proportion of students scoring below Level 2 in reading increased by 3.2 percentage points between 2009 and 2018, whereas the proportion of students scoring at or above Level 5 increased by 1.4 percentage points (Figure I.9.3). Between 2009 and 2018, seven countries/economies saw reductions in the share of students who scored below Level 2: Ireland, Macao (China), Moldova, Qatar, Russia and Slovenia, which were also able to simultaneously increase the share of students who scored at or above Level 5; and Peru, where the proportion of students scoring at Level 5 or 6 remained stable.
Eighteen more countries/economies saw an increase in the share of students performing at or above Level 5, but no reduction in the share of low-achieving students performing below Level 2. In Israel, Latvia, Luxembourg and Norway, the shares of both low achievers and top performers increased. In Greece, the share of low-achieving students increased, and the share of top-performing students decreased.
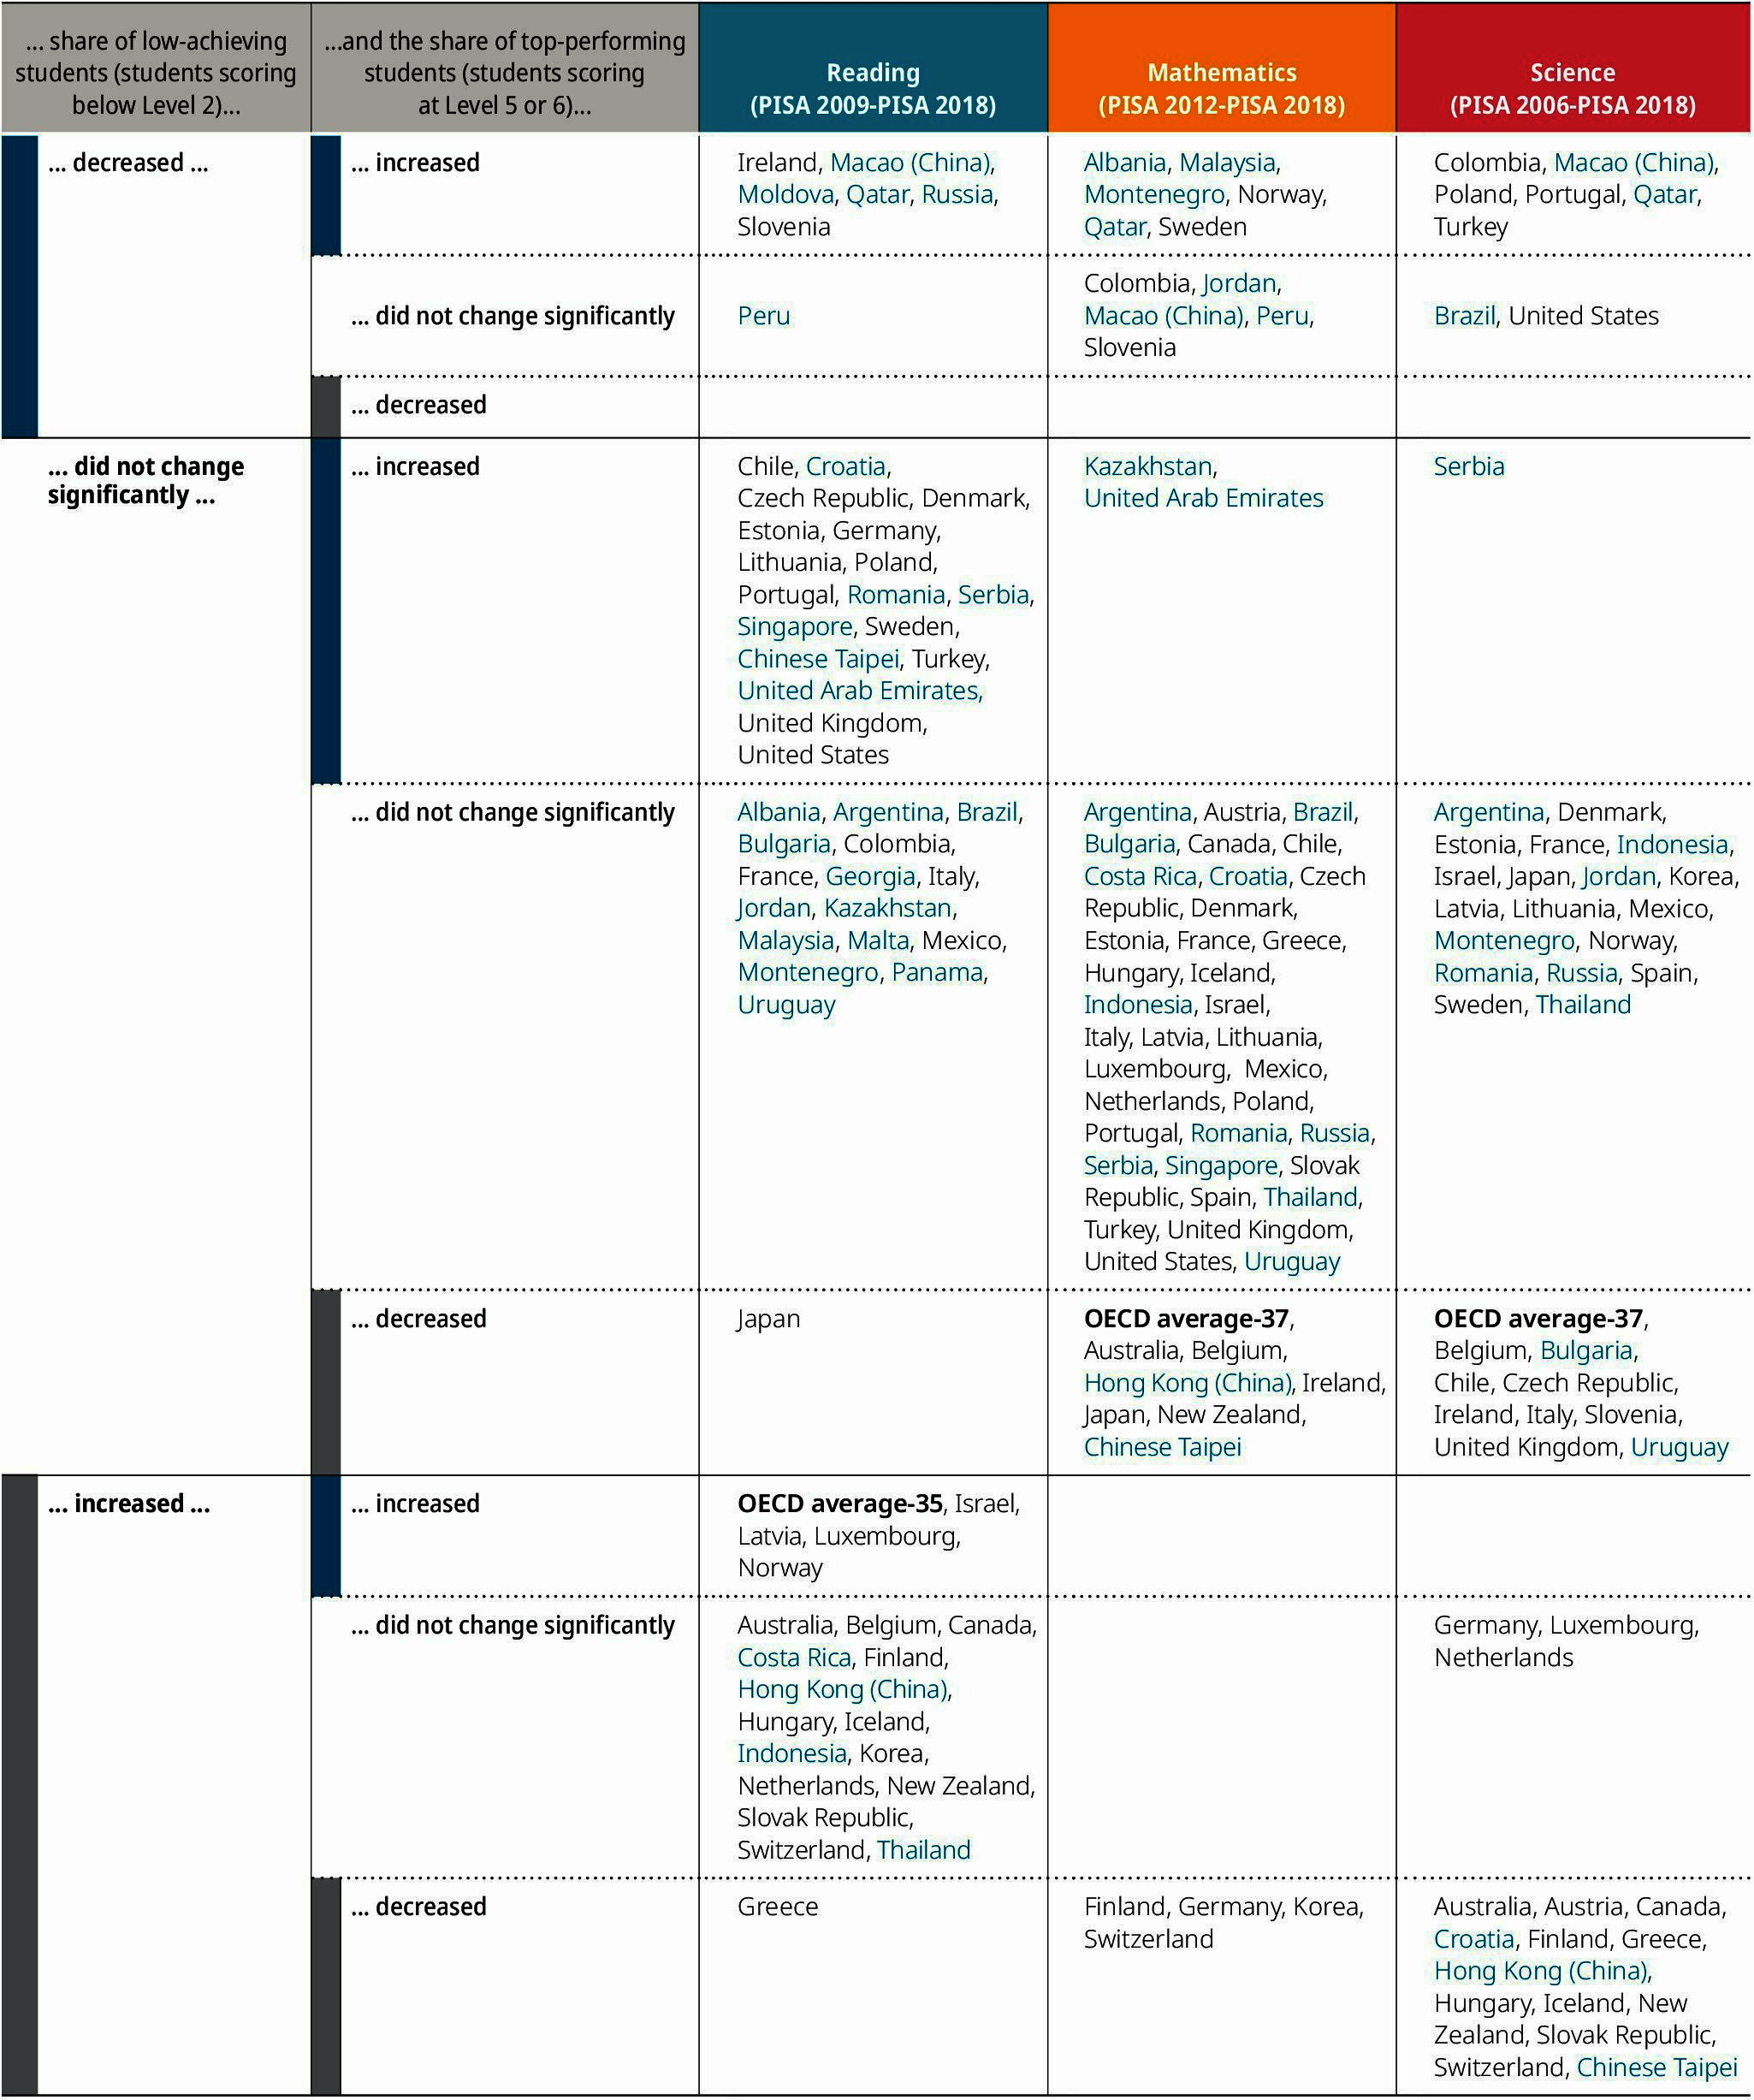
Table I.9.4 summarises the information in Figure I.9.3 by grouping countries/economies according to the significance and direction of trends in the share of top-performing and low-achieving students, and presents similar information for mathematics (PISA 2012 to PISA 2018) and science (PISA 2006 to PISA 2018).
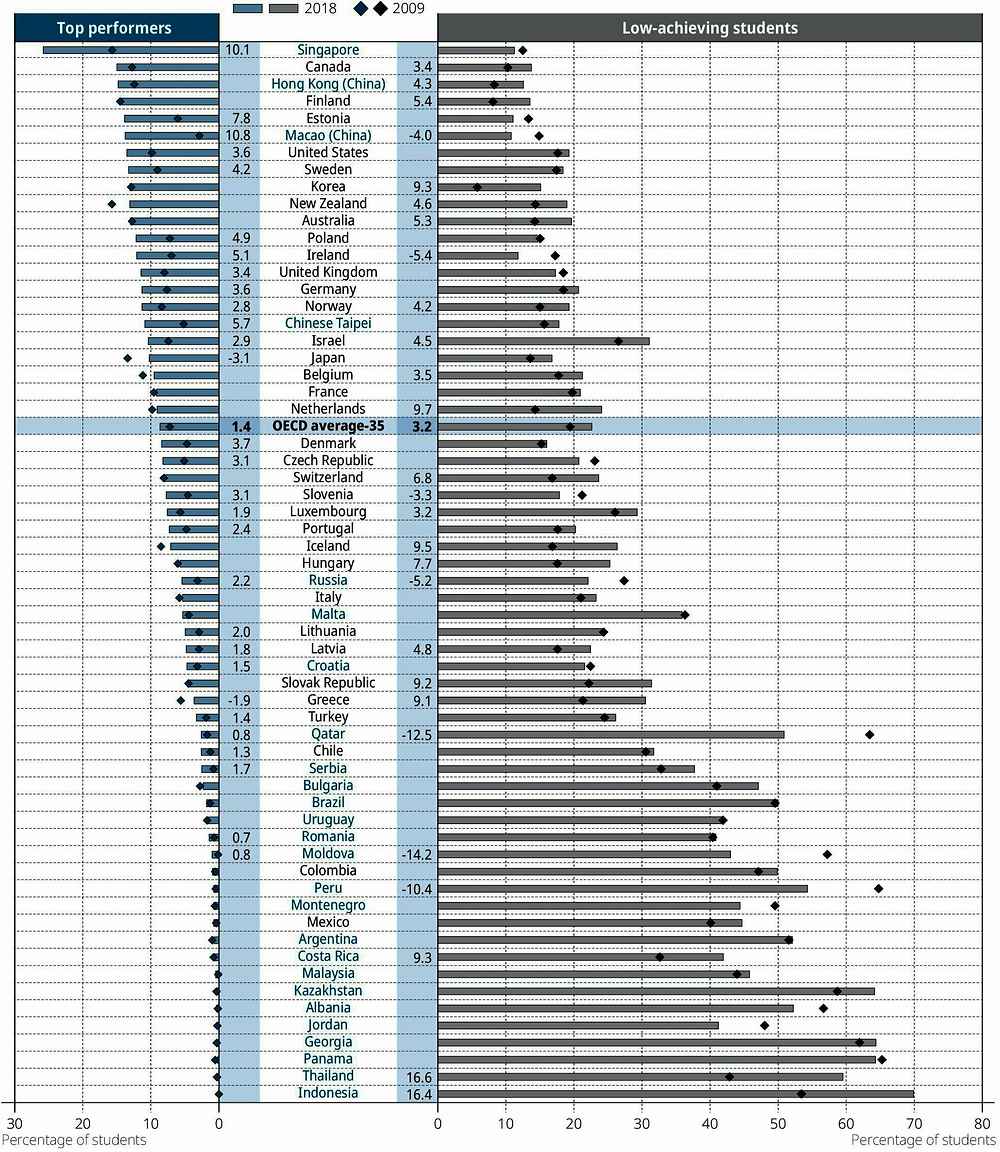
Notes: Only countries/economies that participated in both 2009 and 2018 PISA assessments are shown. Statistically significant changes between PISA 2009 and PISA 2018 in the share of students performing below Level 2 in reading and in the share of students performing at or above Level 5 in reading are shown beside the country/economy name.
OECD average-35 refers to the arithmetic mean across all OECD countries (and Colombia), excluding Austria and Spain.
Countries and economies are ranked in descending order of the percentage of students who scored at or above Level 5 in 2018.
Source: OECD, PISA 2018 Database, Table I.B1.7.
|
Table I.9.4. Long-term change in the percentage of low-achieving students and top performers in reading, mathematics and science
|
|---|
|
Countries/economies where the…
|
 |
|
Notes: Only countries and economies that participated in PISA 2018 and in the reference assessment (PISA 2009 for reading; PISA 2012 for mathematics; PISA 2006 for science) are included in each column. The change in reading performance between 2009 and 2018 for Spain is not reported; see Annex A9. |
|
OECD average-37 refers to the arithmetic average across all OECD countries and Colombia. OECD average-35 refers to the arithmetic mean across all OECD countries (and Colombia), excluding Austria and Spain. |
|
Source: OECD, PISA 2018 Database, Tables I.B1.7, I.B1.8 and I.B1.9. |
copy the linklink copied! Average three-year trend in performance, accounting for changes in enrolment rates
In most countries, all boys and girls who were born in 2002 were of the correct age to be eligible to sit the PISA 2018 test. (In countries that tested students in the second part of 2018, a 12-month period spanning the years 2002 and 2003 defined the eligible birthdates.) However, age was not the only criterion for eligibility: 15-year-olds also had to be enrolled in school, in 7th grade or higher, at the time of testing.
This additional condition might seem redundant in many high-income countries that established universal, free, and sometimes compulsory primary and lower-secondary schooling many decades ago;10 but because eligibility in PISA is determined by more than just a student’s age, the PISA sample does not necessarily represent the entire population of 15-year-olds in many low- and middle-income countries. PISA results thus reflect a combination of 15-year-olds’ access to education and the quality of the education that they have received over the course of their lives.
Globally, enrolment in secondary education has expanded dramatically over the past decades. This expansion is also reflected in PISA data, particularly for low- and middle-income countries. Between 2003 and 2018, Indonesia added almost 1.8 million students, and Mexico and Turkey more than 400 000 students to the total population of 15-year-olds eligible to participate in PISA. Brazil and Uruguay, where the total number of 15-year-olds in the country shrank, maintained or increased the number of 15-year-olds eligible to participate in PISA. As a result, PISA coverage – the proportion obtained by dividing the number of PISA-eligible students by the total number of 15-year-olds in a country – increased greatly in all five countries, and most spectacularly in Indonesia (from 46 % in 2003 to 85 % in 2018) and Turkey (from 36 % in 2003 to 73 % in 2018). Large increases in coverage, from low initial levels, were also observed in Albania and Costa Rica (since PISA 2009).
Meanwhile, the coverage of 15-year-olds in the PISA sample, which represents students in secondary school, remained stable in Colombia and Panama, and decreased by about 20 percentage points in Jordan. In Jordan, the population of 15-year-olds represented by PISA increased by about 25 000, but the total population of 15-year-olds increased by about 90 000, largely as a result of the massive influx of refugees from neighbouring countries. Refugee children may be enrolled outside of Jordan’s formal education system.

Note: Only countries that participated in 2018 and at least one assessment prior to 2015, and where Coverage Index 3 was below 66.6 % in their first or latest participation in PISA, are included in the figure.
Countries and economies are listed in alphabetical order.
Source: OECD PISA 2018 Database. Table I.A2.2.
Several factors contributed to lowering the social, economic or institutional barriers that had kept a large proportion of 15-year-olds out of school. Some countries, such as Brazil and Turkey, raised the age at which students can leave compulsory education to over 15; many countries also introduced or strengthened support for at-risk families (e.g. in the form of conditional or unconditional cash transfers). The rapid changes in the economy and the increased urbanisation observed in these countries may also have played a role (UNESCO, 2015[3]).
This welcome expansion in education opportunities makes it more difficult to interpret how mean scores in PISA have changed over time. Indeed, increases in coverage can lead to an underestimation of the real improvements that education systems have achieved. Household surveys often show that children from poor households, ethnic minorities or rural areas face a greater risk of not attending or completing lower secondary education (UNESCO, 2015[3]). Typically, as populations that had previously been excluded gain access to higher levels of schooling, a larger proportion of low-performing students will be included in PISA samples (Avvisati, 2017[4]).
The experience of most of the countries shown in Figure I.9.4, however, demonstrates that increases in access to schooling have not, in general, come at the expense of the average quality of education that 15-year-olds receive. In fact, Albania saw significant improvements in its students’ average performance in PISA in all three core PISA subjects – reading, mathematics and science – between 2009 and 2018. Turkey saw improvements in its students’ average performance in mathematics (between 2003 and 2018) and science (between 2006 and 2018). Brazil and Mexico observed improvements in their students’ mean performance in mathematics between 2003 and 2018. Mean results in Indonesia, Panama and Uruguay remained close to those observed in their first year of participation in PISA. Only Costa Rica saw a significant decline in its average reading and science performance over its participation in PISA (2010-2018) (Table I.9.1, Tables I.B1.10, I.B1.11 and I.B1.12).
Under plausible assumptions, this means that amongst countries that expanded enrolment significantly over their participation in PISA, all but one country (Costa Rica) probably saw significant improvements in the level of reading, mathematics and science proficiency attained by the top quarter of 15-year-olds (Figure I.9.5). By considering a population equal in size to 25 % of an age group, made up of only the best-performing students in a country, it is possible to monitor the rate of change in PISA performance for a sample of 15-year-olds that was minimally affected by changes in coverage rates over a given period.11 This analysis shows that the minimum scores in mathematics observed amongst this 25 % of top-performing youth increased rapidly (by more than 20 points per three-year period) in Albania and Turkey, and by about 10 points per three-year period in Brazil, Indonesia and Mexico. This suggests that when more disadvantaged children gain access to education for the first time, the remaining students can also benefit.
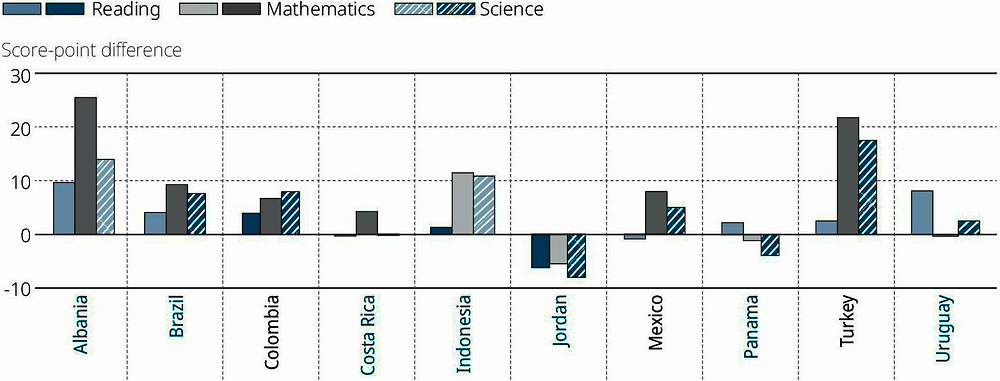
Notes: Only countries that participated in 2018 and at least one assessment prior to 2015, and where Coverage Index 3 was below 66.6 % in their first or latest participation in PISA, are included in the figure. For countries that participated in 2003, trends in reading and mathematics performance are measured over a different period than trends in science. See also Figure I.9.4 for relevant context.
Values that are statistically significant are marked in a darker tone (see Annex A3).
Countries and economies are listed in alphabetical order.
Source: OECD, PISA 2018 Database, Tables I.B1.13, I.B1.14, I.B1.15, I.B1.34, I.B1.35 and I.B1.36.
copy the linklink copied! Average three-year trend in performance, adjusted for demographic changes
In some countries, the demographics of the student population and of the PISA sample have changed considerably across PISA assessments. It is possible to analyse the impact of changes in the immigrant background, age and gender of the student population in each country and economy by contrasting the (unadjusted) changes in mean performance, reported in previous sections, with those that would have been observed had the overall profile of the student population been the same, throughout the period, as that observed in 2018. Adjusted trends provide an estimate of what the performance trend would have been if past PISA samples had had the same proportion of immigrant students (first- and second-generation) and the same composition by gender and age (defined in three-month increments) as the target population in 2018.
Adjusted trends for all countries are available in Tables I.B1.40-I.B1.48 in Annex B1 (for more details about the methods used to neutralise changes in the demographic composition of student populations, see Annex A7). On average across the 35 OECD countries that can compare their reading performance between 2009 and 2018, if the student population in 2009 had had the same demographic profile as the population in 2018, the average score in reading would have been 489 points (Table I.B1.40). In reality, the average observed score in 2009 was 491 points (Table I.B1.10). Much of the (non-significant) drop in OECD average performance between 2009 and 2018 (4 points, on average) can therefore be related to the changing demographic composition of student populations, and in particular, to the increase in the shares of first-generation immigrant students in countries where these students tend to score below non-immigrant students; see also Chapter 9 in PISA 2018 Results (Volume II): Where All Students Can Succeed (OECD, 2019[5]), which presents trends amongst immigrants and non-immigrant students separately. Adjusted and non-adjusted changes in reading performance differ by five score points or more in Qatar (where non-adjusted changes indicate stronger improvement than adjusted changes), and in Germany, Luxembourg, Norway, Sweden and Switzerland (where non-adjusted changes indicate stronger declines than adjusted changes, meaning that some of the declines could be attributed to the changing composition of the student population).12 For these countries, the counterfactual trends are discussed in greater detail in the context of the country-specific summaries presented in Annex D.
Informative as they may be, adjusted trends are merely hypothetical scenarios that help discern the sources of changes in student performance over time. Observed (unadjusted) trends shown in Figure I.9.1 and throughout this chapter summarise the observed overall evolution of student performance. The comparison of observed trends with hypothetical, adjusted trends can highlight some of the challenges that countries and economies face in improving students’ and schools’ performance.
References
[4] Avvisati, F. (2017), “Does the quality of learning outcomes fall when education expands to include more disadvantaged students?”, PISA in Focus, No. 75, OECD Publishing, Paris, https://doi.org/10.1787/06c8a756-en.
[10] Blundell, R. et al. (2007), “Changes in the Distribution of Male and Female Wages Accounting for Employment Composition Using Bounds”, Econometrica, Vol. 75/2, pp. 323-363, https://doi.org/10.1111/j.1468-0262.2006.00750.x.
[6] Hanushek, E. and L. Woessmann (2008), “The Role of Cognitive Skills in Economic Development”, Journal of Economic Literature, Vol. 46/3, pp. 607-668, https://doi.org/10.1257/jel.46.3.607.
[5] OECD (2019), PISA 2018 Results (Volume II): Where All Students Can Succeed, PISA, OECD Publishing, Paris, https://doi.org/10.1787/b5fd1b8f-en.
[1] OECD (2014), PISA 2012 Results: What Students Know and Can Do (Volume I, Revised edition, February 2014): Student Performance in Mathematics, Reading and Science, PISA, OECD Publishing, Paris, https://dx.doi.org/10.1787/9789264208780-en.
[2] Parker, P. et al. (2018), “Inequity and Excellence in Academic Performance: Evidence From 27 Countries”, American Educational Research Journal, Vol. 55/4, pp. 836-858, https://doi.org/10.3102/0002831218760213.
[8] Spaull, N. and S. Taylor (2015), “Access to What? Creating a Composite Measure of Educational Quantity and Educational Quality for 11 African Countries”, Comparative Education Review, Vol. 59/1, pp. 133-165, https://doi.org/10.1086/679295.
[7] Taylor, S. and N. Spaull (2015), “Measuring access to learning over a period of increased access to schooling: The case of Southern and Eastern Africa since 2000”, International Journal of Educational Development, Vol. 41, pp. 47-59, https://doi.org/10.1016/j.ijedudev.2014.12.001.
[3] UNESCO (2015), Education for All 2000-2015: Achievements and Challenges. EFA Global Monitoring Report, UNESCO, https://unesdoc.unesco.org/ark:/48223/pf0000232205 (accessed on 4 September 2019).
[9] United Nations General Assembly (1966), International Covenant on Economic, Social and Cultural Rights, p. 3, https://www.refworld.org/docid/3ae6b36c0.html (accessed on 17 August 2019).
Notes
← 1. In 2018, a few countries continued to assess students using pre-2015 pen-and-pencil tests (see Annex A5). Amongst countries discussed in this chapter, this was the case in Argentina, Jordan, the Republic of Moldova, the Republic of North Macedonia and Romania.
← 2. The overall direction of a trend is estimated by the linear trend. This represents the average change in student performance per three-year interval, observed over the entire period for which data are available. This period may vary, depending on the country and the subject assessed. Because the rate of change is reported over intervals of three years, the linear trend is referred to as the “three-year trend” in this chapter. Since three years corresponds to the typical interval between two PISA assessments, the average three-year trend can be directly compared to, for example, the change observed between PISA 2015 and PISA 2018, which is described in Chapter 8. For countries and economies that have participated in all PISA assessments, the average three-year trend takes into account up to seven points in time (for reading); for those countries that have valid data for fewer assessments, the average three-year trend takes into account only the valid and available information.
← 3. Not all OECD countries participated in all PISA assessments. When computing average changes and trends in performance, only those countries with valid data to compare across assessments are included in the average. Because multiple comparisons are often possible within a given table (e.g. between PISA 2000 and PISA 2018 results, but also between PISA 2009 and PISA 2018 results), tables showing trends often include multiple averages.
← 4. Non-linear trend trajectories are estimated using a regression model, by fitting a quadratic function to the five, six or seven mean estimates available, and taking into account the statistical uncertainty associated with each estimate as well as with comparisons over time (see Annex A7). This is a more robust measure of a country’s/economy’s trajectory in performance than the successive comparison of mean scores across consecutive assessments because it is less sensitive to one-time statistical fluctuations that may alter a country’s/economy’s mean performance estimate.
← 5. All of the pairwise comparisons of performance for the OECD average correspond to non-significant differences; however, the trend line, which reduces the statistical uncertainty by combining information from more than two assessments, shows a significant negative curvature.
← 6. “Hump-shaped” and “U-shaped” trajectories describe countries for which a significant change in the direction of the trend could be established over their participation in PISA, but no overall improvement or decline was found. The actual shape of a “U-shaped” trajectory may be closer to a “V” or “J” shape (or its mirror image); similarly, the actual shape of a “hump-shaped” trajectory may be similar to an inverse-U shape, but also to an “inverse-J” or “inverse-V” shape.
← 7. These correlations are measured between the longest difference in mean performance observed in PISA and the difference in the inter-decile range over the same time period, across 64 countries/economies. The Spearman rank correlation is very similar (-0.24).
← 8. The corresponding Spearman rank-correlation coefficients are 0.04 (mathematics) and -0.08 (science).
← 9. In this section, the proportions of students at Level 5 and above, and below Level 2, are compared across countries over the same period, starting with the most recent assessment, before 2015, in which a particular domain was the focus of the assessment (the reference year is 2009 in reading; 2012 in mathematics; 2006 in science). For reading and science, due to updates to the assessment framework, the specific abilities that define top-performing and low-achieving students differ between the reference year and 2018, but the same cut-off scores on the equated scales were used to define and compare proficiency levels.
← 10. The International Covenant on Economic, Social and Cultural Rights adopted by the United Nations General Assembly on 16 December 1966 recognises the right of everyone to free primary education and commits its parties to work towards introducing free education at secondary and higher levels (United Nations General Assembly, 1966[9]).
← 11. The interpretation of these trends requires the additional hypothesis that all the 15-year-olds who were excluded from participation in PISA in past cycles (mostly because they were not in secondary school at age 15) would not have scored above the “adjusted 75th percentile” if they had sat the test. In other words, this analysis relies on the hypothesis that, while the skills and ability of the 15-year-olds who were not eligible to participate in PISA may vary, this variation is bounded below the 75th percentile of the distribution of 15-year-olds’ performance in the subjects assessed by PISA. In particular, 15-year-olds who were not in school, or were below grade 7, at the time of the PISA test would not have scored amongst the country’s top quarter had they sat the PISA test. No assumption is made about how well these 15-year-olds would have scored if they had received the additional schooling that would have made them eligible to sit the PISA test. If some of the non-eligible 15-year-olds had had greater skills than assumed in this analysis, the 75th percentile estimates on which this analysis is based are, in reality, lower bounds on the true 75th percentiles. As the selectivity of PISA samples is attenuated (i.e. Coverage Index 3 increases), the lower bounds can be expected to move closer to the true value. In that context, the reported changes and trends may over-estimate the true changes and trends. For a discussion of non-parametric methods for partial identification of trends in the presence of selection, see Blundell et al. (2007[10]).
It is impossible to know for certain what the PISA score of the 15-year-olds who were not enrolled in school or who were still in grades 1 through 6 would have been, had they been tested. Without attributing an exact score to these students, it is nevertheless possible to assume, with some confidence, that they would have scored in the bottom part of a country’s performance distribution (Hanushek and Woessmann, 2008[6]; Spaull and Taylor, 2015[8]; Taylor and Spaull, 2015[7]).
← 12. In Australia, Portugal and Romania, adjusted and non-adjusted changes in reading performance between PISA 2009 and PISA 2018 also differ by more than five score points. In these countries, however, the major change observed in student demographics is a large increase in the proportion of students whose immigrant status is missing in the data, due to non-response to the questions about country of birth. Adjusted changes must therefore be interpreted with caution because they are based on the assumption that the characteristics of students whose immigrant status is missing are comparable across assessments.
Metadata, Legal and Rights
https://doi.org/10.1787/5f07c754-en
© OECD 2019
The use of this work, whether digital or print, is governed by the Terms and Conditions to be found at http://www.oecd.org/termsandconditions.