Chapter 1. Well-being: performance, measurement and policy innovations
From an international perspective, New Zealand fares well in several aspects of current well-being, but faces challenges in housing affordability, household income and earnings, mental health, and child well-being. There are also large inequalities for health and educational outcomes, and a high share of economically vulnerable people. Social capital is a particular strength, but New Zealand’s natural assets are being depleted. The Treasury has developed its Living Standards Framework and associated Dashboard to integrate well-being evidence more systematically in its advice to the Government. The Dashboard is consistent with international measurement practice, but has some indicator gaps, particularly for natural capital. The New Zealand Government is applying a well-being approach to policy and budget decision-making, including legislating for well-being objective-setting and reporting. Continuing to develop the evidence base that supports the well-being approach is critical. Effective implementation requires further investment in methodological development, civil service capacity-building, and strong leadership across government.
Introduction
The past decade has seen increasing interest in using well-being evidence in a more systematic way to support policy making. Evidence-informed policy is core practice in OECD countries, yet all governments struggle to integrate evidence effectively across the wide range of well-being outcomes that matter to people. An emphasis on GDP growth, economic efficiency, and managing fiscal pressures can mean that the wider impacts of policies on people’s lives - including household living standards, social and environmental outcomes - are often less systematically quantified and assessed. The sustainability of outcomes over time, and their distribution across the population, also often get less focus than shorter-term and aggregate outcomes. And although much policy evidence goes well beyond the analysis of economic and fiscal impacts (for example in health, education and environmental spheres), this is often constrained by departmental silos. This means that policy trade-offs are not always well evidenced and debated, and there are missed opportunities for synergies across policy settings. As a result, opportunities for efficiency savings are lost, priority-setting is less well-informed, and accountability for the broader impact of policy on people’s lives is reduced.
In recognition of these challenges, the New Zealand Treasury began to develop a Living Standards Framework in 2011 (Figure 1.1 shows the most recent version). Its primary aim is to improve the depth, breadth and quality of Treasury’s policy advice to current and future Governments (New Zealand Treasury, 2018[1]), prompting analysts to consider the broad well-being impacts of policy options. The Living Standards Framework has supported the current Government’s strategic emphasis on improving the well-being of New Zealanders and their families (New Zealand Government, 2018[2]). Nevertheless, the Framework remains first and foremost a tool developed by and for Treasury analysts, to provide high quality policy advice in the context of the priorities set by the government of the day.
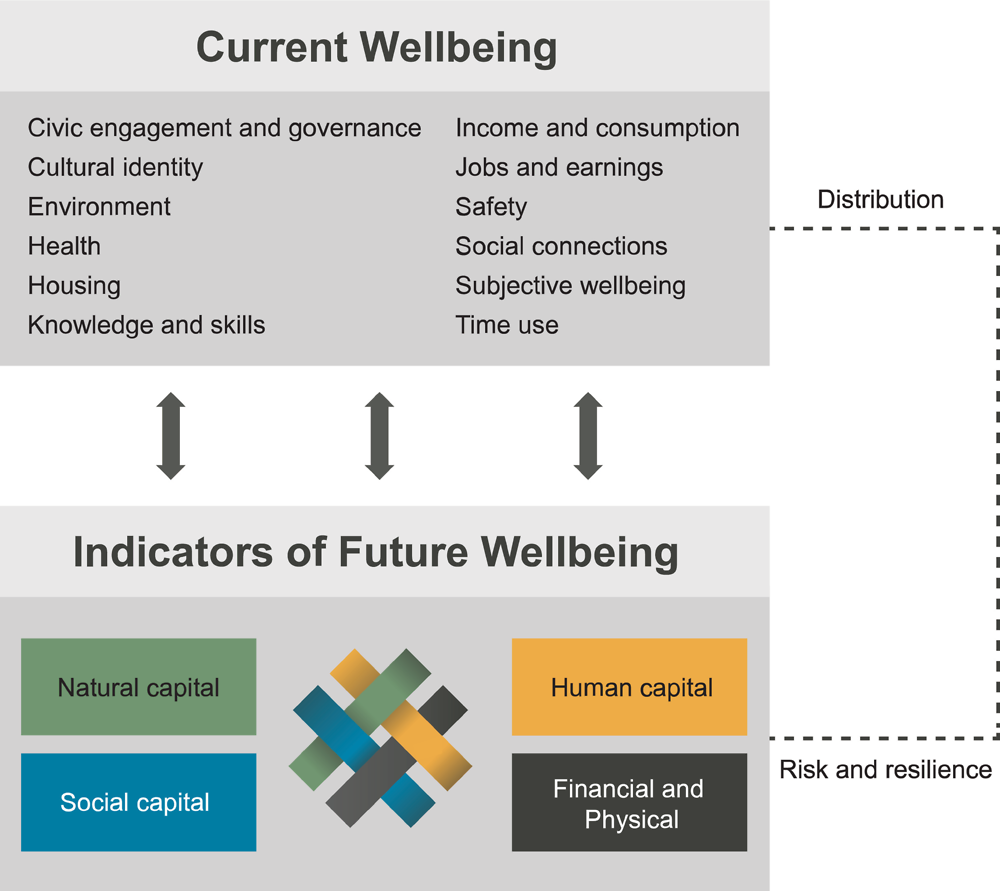
Source: New Zealand Treasury (2018), Living Standards Framework: Introducing the Dashboard, https://treasury.govt.nz/publications/tp/living-standards-framework-introducing-dashboard
Measurement challenges hinder people-centred policy analysis, but high-quality and internationally comparable measures of well-being and sustainability are increasingly becoming part of national statistical practice in OECD countries. Since the early 2000s, several governments have developed multidimensional frameworks and dashboards of well-being indicators. In New Zealand, measures of well-being have been collected in various forms for nearly two decades. In December 2018, the Treasury publicly released its first Living Standards Framework Dashboard, with 55 indicators spanning the dimensions shown in Figure 1.1 (New Zealand Treasury, 2018[3]). Quantifying well-being outcomes can raise their profile in public policy debates, but frameworks and measurement initiatives are only the first step in building and applying a broader evidence base to policy. The challenge now faced by governments is how to embed well-being evidence more systematically throughout policy decision making, including in budgets, cabinet committees and other routine processes, such as policy evaluation. Recent applications of the Living Standards Framework, including through a “Wellbeing Budget” in 2019, are important steps in this direction.
This chapter examines the use of well-being frameworks and evidence as tools for better policy-making, and offers recommendations for New Zealand in three key areas. The first relates to opportunities for raising well-being in New Zealand, as viewed from an international perspective. The second concerns the Treasury’s Living Standards Framework and measurement Dashboard, exploring how these compare to other initiatives internationally, as well as New Zealand’s current policy priorities. The third addresses integrating the Living Standards Framework more systematically into the machinery of government, to improve the evidence base and how policy advice is generated and used.
New Zealand’s well-being in an international context
Improving the well-being of New Zealanders and their families is one of three strategic priorities for the coalition government (New Zealand Government, 2018[2]), alongside building a productive, sustainable and inclusive economy, and providing new leadership by government. Applying the OECD approach to measuring well-being (OECD, 2017[4]; OECD, 2011[5]), this section offers an international perspective on opportunities to raise New Zealander’s outcomes from three different viewpoints: comparative current levels, trends since 2005, and the size of inequalities relative to those observed in other OECD countries. It also discusses how the priorities selected for the 2019 Budget align with this international analysis.
The big picture on New Zealand’s well-being
The OECD’s How’s Life? framework measures well-being through a set of more than 50 indicators (Figure 1.2). These are drawn from nationally representative data, generally sourced from national statistical office or OECD datasets. The majority of indicators are based on objective data, used to capture aspects of people’s living conditions today and the four capitals (financial and physical, natural, social and human) that help to sustain well-being over time. These are complemented by a limited number of subjective measures, such as life satisfaction, to take into account how people experience their lives.
Relative to other OECD countries, New Zealand performs well across several headline indicators of the How’s Life? framework (Figure 1.2).1 Nevertheless, there is still room for improvement, and some negative trends need to be counteracted. Good average performance sometimes also masks well-being inequalities that are larger than the OECD average.
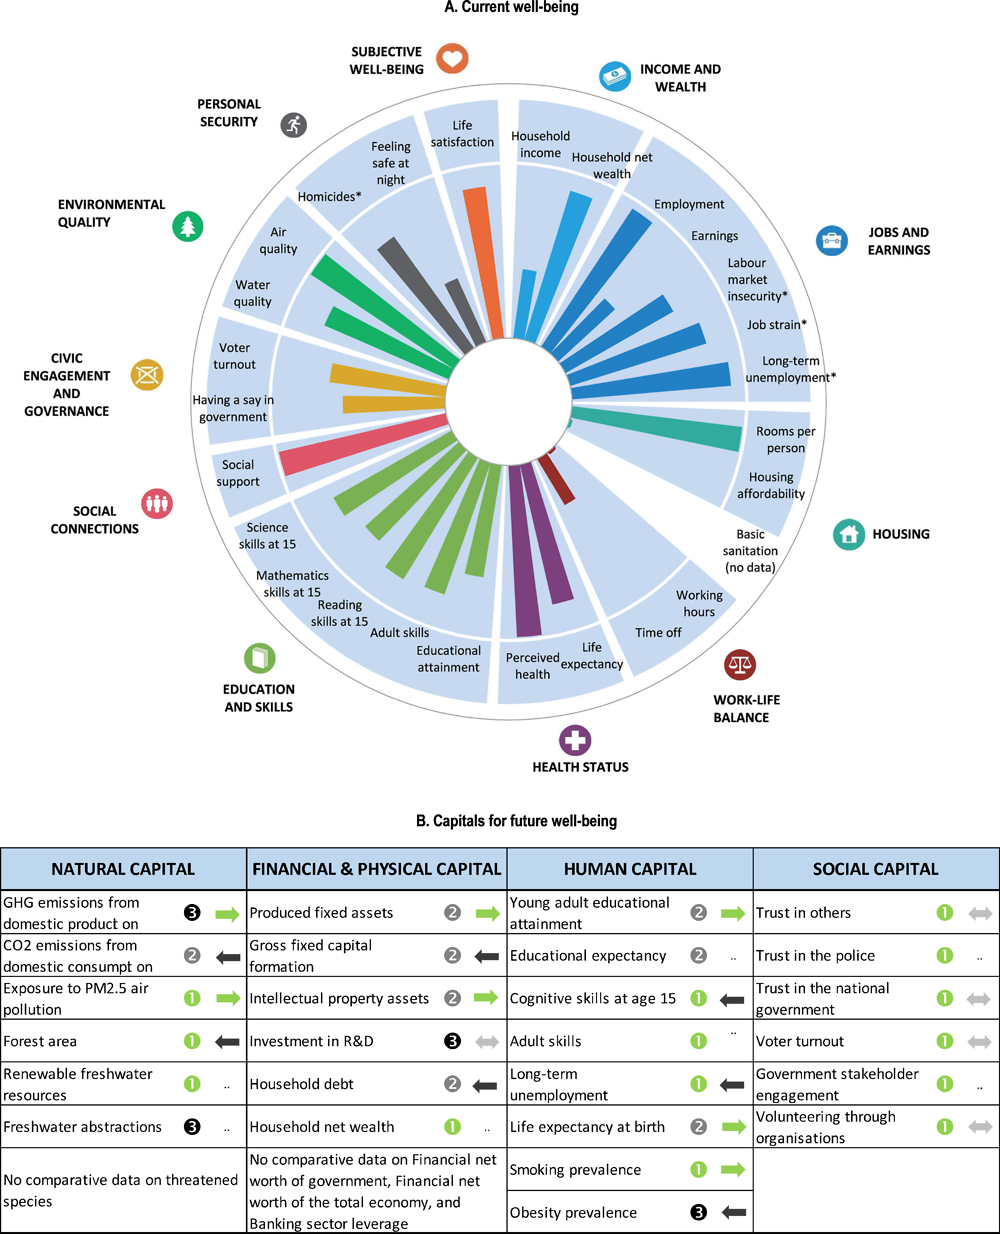
Note: This chart shows New Zealand’s relative strengths and weaknesses in well-being compared with other OECD countries. For the current well-being wheel, for both positive and negative indicators (marked with an “*”), longer bars always indicate higher well-being. No comparative data is available on basic sanitation. For the future well-being dashboard: = top-performing OECD tier, = middle-performing OECD tier, = bottom-performing OECD tier. Change is shown from 2005 to the latest available year, which is generally 2016. Forward arrows (in green) signify improvement over time, backward arrows (in black) indicate worsening, and level arrows (grey) indicate little change. Missing time trend data is indicated as “..”.
Source: Adapted from OECD How’s Life? 2017 (2017[4]) unless otherwise indicated in the StatLink.
Combining comparative well-being performance with data on changes since 2005, and the distribution of outcomes across population groups, can inform priorities for policy action (Figure 1.3). Outcomes to safeguard are those where New Zealand performs well internationally, and recent changes have been either positive or stable (top right quadrant). These include a comparatively high employment rate, strong social capital and civic outcomes, and good air quality. In other areas, New Zealand starts from a comparatively lower base but has made progress in recent years which requires further strengthening (bottom right). This includes rising household disposable income and earnings, fewer people working very long hours, growing investment in research and development, and increases in people’s feelings of safety. A companion paper (Fleischer, Frieling and Exton, forthcoming[6]) discusses these in greater detail.
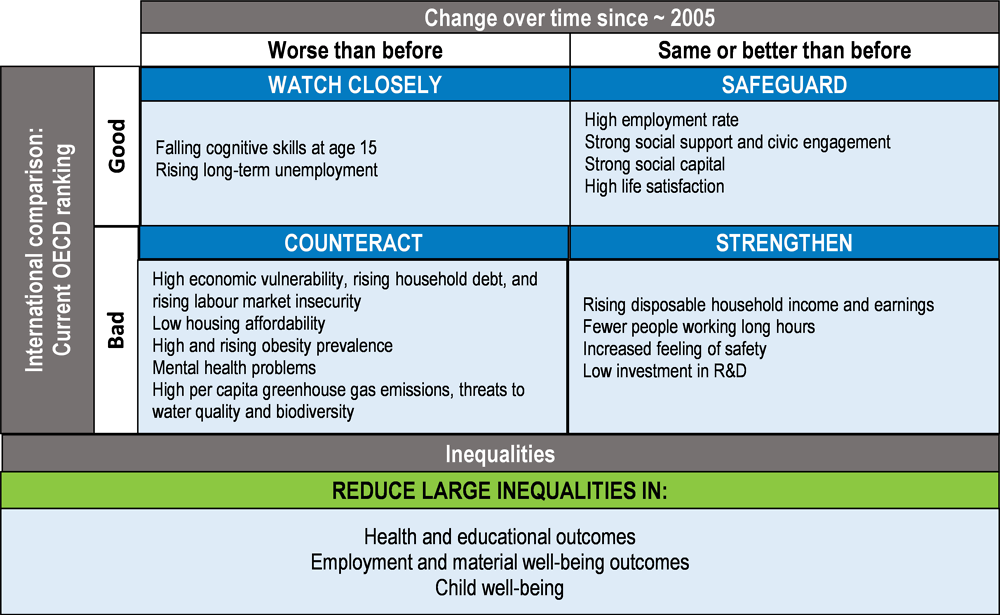
Note: OECD time series data are not available for all indicators, including renewable freshwater resources, freshwater abstractions, threatened species, household net wealth, adult skills, educational expectancy, trust in the police and government stakeholder engagement. These indicators have therefore not been included here.
Indicators in which New Zealand still ranks well but has lost ground over the past decade should be watched closely (top left). They include rising long-term unemployment and falling cognitive skills at age 15. Areas of poor and worsened performance require urgent action to counteract them (bottom left). This includes low and worsening housing affordability, high economic vulnerability, rising household debt, high per capita greenhouse gas emissions, high and rising obesity rates, and mental health problems. New Zealand’s water quality and biodiversity are also under threat (OECD, 2017[7]). Analysis of inequalities points to the importance of reducing gaps in health and educational outcomes, which are particularly high by international standards, as well as child well-being, and large ethnic differences in a broad range of well-being dimensions.
Key opportunities for improving New Zealand’s well-being
Reduce health inequalities, and address mental health and obesity challenges
88% of New Zealanders report being in good health, and life expectancy is about 1.5 years above the OECD average. Nevertheless, inequalities in life expectancy, measured as the standard deviation in age of death, are among the largest in the OECD (OECD, 2017[4]). Life expectancy varies considerably between regions and ethnic groups (Figure 1.4). Rates of amenable mortality - i.e. deaths under age 75 that could potentially be avoided given effective and timely healthcare - are about 2.5 times higher for Māori and Pasifika than for the rest of the population (Ministry of Health, 2017[8]).
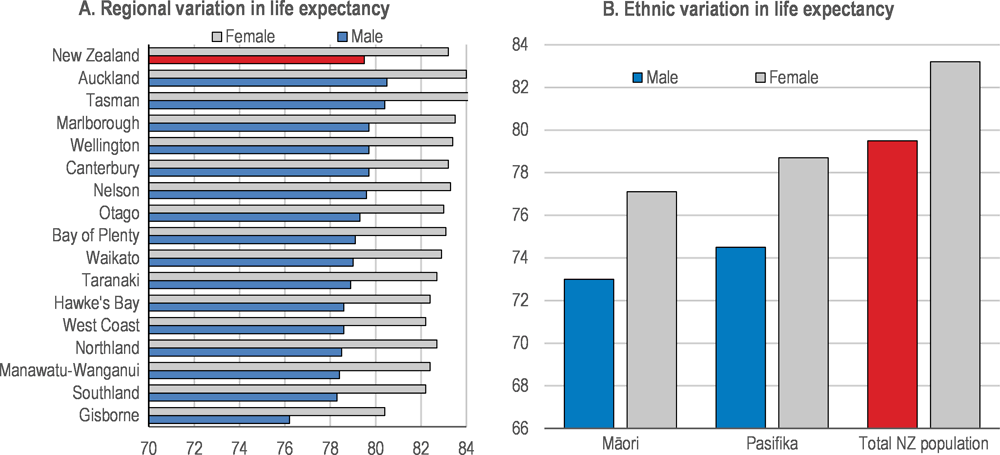
Source: Stats NZ, New Zealand Period Life Tables 2012-14, http://archive.stats.govt.nz/browse_for_stats/health/life_expectancy/NZLifeTables_HOTP12-14.aspx.
Between 2006 and 2017, New Zealand’s prevalence of serious non-fatal intentional self-harm injuries increased substantially (to 5.3 per 100 000 people, up from 3.1 in 2006) and provisional data indicate an increase in suicides between 2015 and 2017 (Stats NZ, 2018[9]). New Zealand’s overall suicide rate is close to the OECD average (OECD, 2019[10]; Stats NZ, 2018[9]), but its teenage suicide rate is among the highest in the OECD (discussed below). Mental health risk in New Zealand varies considerably with age, gender, ethnicity, and neighbourhood conditions (Figure 1.5): people living in the most socio-economically deprived areas are nearly three times more likely to report having experienced psychological distress in the past four weeks than people in the least deprived areas (adjusting for age, sex and ethnicity differences among neighbourhoods).
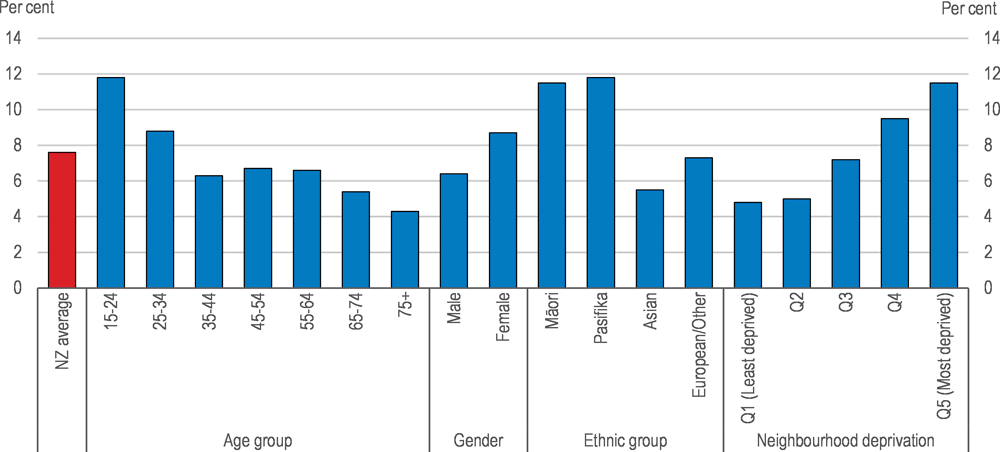
Note: Unadjusted prevalence rates for each group. Ethnic groups are based on total response groups, meaning that each person has been allocated to all ethnic groups that they have identified with.
Source: Ministry of Health, Annual Data Explorer 2016/17, https://minhealthnz.shinyapps.io/nz-health-survey-2016-17-annual-data-explorer.
In contrast with its low overall smoking prevalence (OECD, 2017[4]), New Zealand has the third highest adult obesity rate in the OECD, rising from 27% in 2006/07 to 32% in 2017/18 (Ministry of Health, 2019[11]). The prevalence of key health risks including obesity, physical inactivity and smoking is higher among Māori, Pasifika and people living in socio-economically deprived areas (Ministry of Health, 2017[12]).
Improve well-being for children and youth
New Zealand’s child poverty rate (based on a threshold set at half of the median income of each country, before housing costs) was 16.5% in 2018 (Stats NZ, 2019[13]), three percentage points above the OECD average in 2016 (OECD, 2019[14]). Rates are higher among Māori and Pasifika children, as well as for those living in sole-parent or jobless households (Ministry of Social Development, 2017[15]). Children in New Zealand are disproportionately affected by household crowding, with 16% of 0-19 year-olds living in crowded houses in 2013, as compared to a 10 % population average (Stats NZ, 2019[16]).
Child health concerns include a relatively high teenage birth rate (16 per 1000 women aged 15-19 in 2016, compared to an OECD average of 12.4 (OECD, 2018[17]), and high rates of obesity in children aged 2-14 years - which have risen from 8% in 2006/7 to 12% in 2016/17 (Ministry of Health, 2017[12]). New Zealand’s suicide rate among young people aged 15-19 is over three times higher than the OECD average, and has increased by one third since 2000, counter to the OECD average fall of nearly 15% (OECD, 2017[18]).
Cognitive skills of students at age 15 fell between 2006 and 2015, and educational inequalities are wide (Figure 1.6). In general, the gap in achievement between students from advantaged and disadvantaged socio-economic backgrounds is relatively large in New Zealand (May, Flockton and Kirkham, 2016[19]). Other student outcomes are also worrying: in 2015, New Zealand had the second worst score on the OECD Index of Exposure to Bullying, with 18% of students reporting frequent instances of being bullied. New Zealand students have also reported a weakening sense of belonging in school since 2003 (OECD, 2017[20]; TIMSS & PIRLS International Study Center, 2016[21])
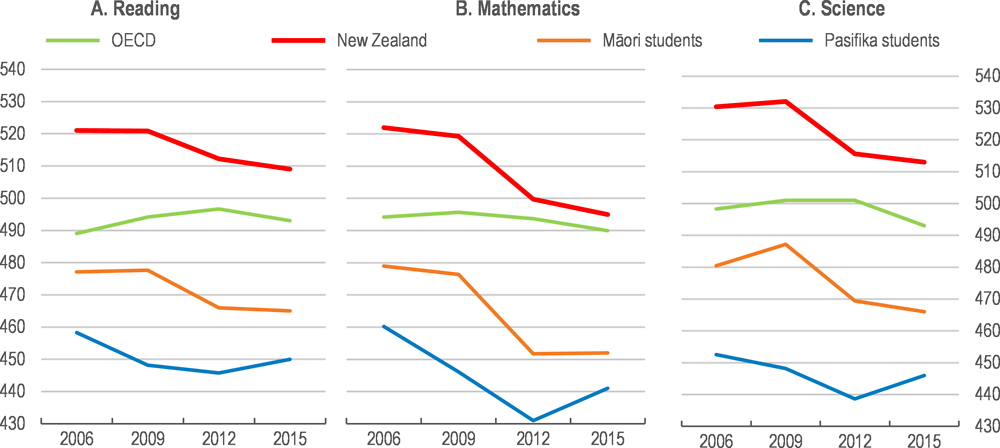
Source: OECD, PISA Results, various years; S. May, J. Flockton and S. Kirkham (2016), PISA 2015 - New Zealand Summary Report, Ministry of Education.
Secure better material conditions for all and reduce high economic vulnerability
Income inequalities in New Zealand have increased since the mid-1980s (Figure 1.7). Disposable income for New Zealand’s top income quintile is 5.8 times larger than that for the bottom quintile (OECD, 2017[22]).2 Between 2015 and 2018, the net worth of the richest 20% of New Zealand households increased (by NZD 394 000), while that of the bottom 40% did not change (Stats NZ, 2018[23]). In 2015, the age-standardised median net wealth of New Zealand Europeans was more than three times higher than that of the Asian population, five times that of Māori, and nine times that of Pasifika - though collective assets, such as Māori land and trusts, are not well captured by these statistics (Stats NZ, 2016[24]).
Compared to other OECD countries, the economic vulnerability of individuals is high: nearly two thirds of New Zealanders would be at risk of falling into poverty if they had to forgo three months of their income (Figure 1.8). Poor housing affordability in New Zealand (OECD, 2017[4]) further aggravates these vulnerabilities, with the burden disproportionately falling on those with lower incomes. Low-income households are less likely to own their home, and the majority of low-income renters now spend more than 40% of their gross income on housing (Chapter 3). Household debt as a share of income increased from 99% in 1998 to 164% in 2018 (Reserve Bank of New Zealand, 2019[25]).
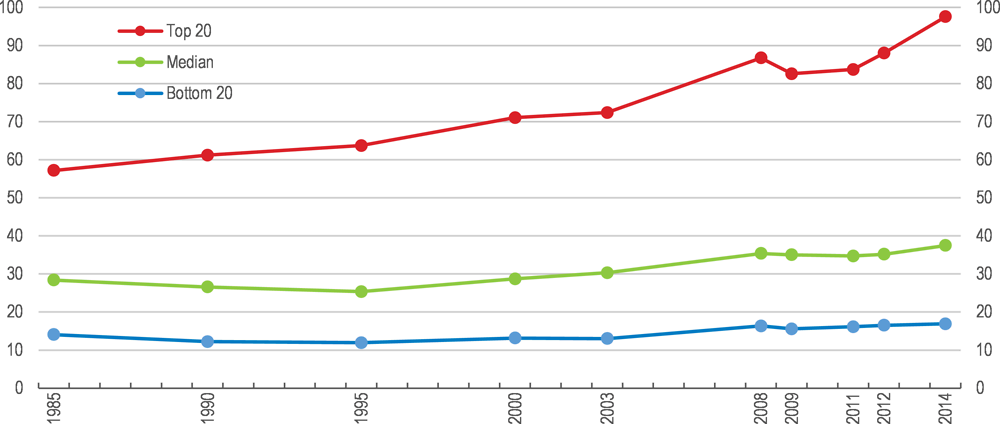
Note: Households’ annual equivalised disposable income is calculated as the income of each household adjusted by the square root of household size. The figure shows absolute levels of median income as well as averages for people in the top 20% and the bottom 20% of the income distribution. This differs from the approach taken in the Living Standards Framework Dashboard, which reports income by percentiles. Data collections have been carried out periodically since 1985; the horizontal access indicates the years for which data are available.
Source: OECD calculations based on the OECD Income Distribution database, http://stats.oecd.org/Index.aspx?DatasetCode=IDD.
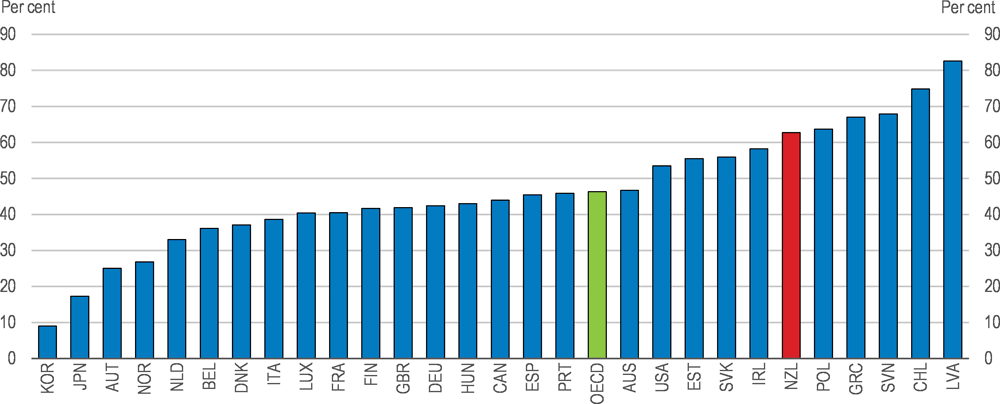
Source: Balestra, C. and R. Tonkin (2018), “Inequalities in household wealth across OECD countries: Evidence from the OECD Wealth Distribution Database”, OECD Statistics Working Papers, No. 2018/01, OECD Publishing, Paris, https://dx.doi.org/10.1787/7e1bf673-en.
New Zealand has a high level of employment, and a low rate of long-term unemployment. Nevertheless, both long-term unemployment and labour market insecurity increased following the global financial crisis, and have not yet returned to pre-crisis levels (OECD, 2017[22]), consistent with wider OECD trends. In 2018, the number of New Zealanders unemployed for over one year was four times higher than in 2008 (Stats NZ, 2018[26]), while labour market insecurity was 70% higher in 2015 than in 2007 (OECD, 2017[4]).
Raise outcomes for Māori
Gaps between Māori and non-Māori on life expectancy, employment and unemployment are larger than gaps between indigenous and non-indigenous peoples in Canada, the United States and Mexico (Figure 1.9).3 Over the last intercensal period (2006-2013 in New Zealand) the differences between Māori and non-Māori widened for income, employment, unemployment and upper secondary educational attainment, while many of these gaps were shrinking in other OECD countries (OECD, 2019[27]).
The Treasury’s Living Standards Framework Dashboard provides an analysis of outcomes for four major population groups (European, Māori, Pacific, and Asian), each of which have different profiles of well-being strengths and challenges (New Zealand Treasury, 2018[28]). For example, New Zealand Europeans report high levels of cultural identity (feeling they are able to be themselves in New Zealand), and have comparatively high housing, income and consumption outcomes. Although Māori experience lower well-being across most domains, differences in cultural identity for Māori are relatively small. Asians fare well on knowledge and skills, health, and safety, but have lower housing, income and consumption outcomes, and feel less able to be themselves in New Zealand. Pacific people report high social connections and subjective well-being, but poor housing, income and consumption, and cultural identity outcomes. Addressing inequalities and better understanding the requirements for strong well-being will be important for sustaining New Zealand’s well-being over time, as Māori, Pasifika and Asians are projected to make up an increasing proportion of New Zealand’s population over the next 20 years (Stats NZ, 2017[29]).
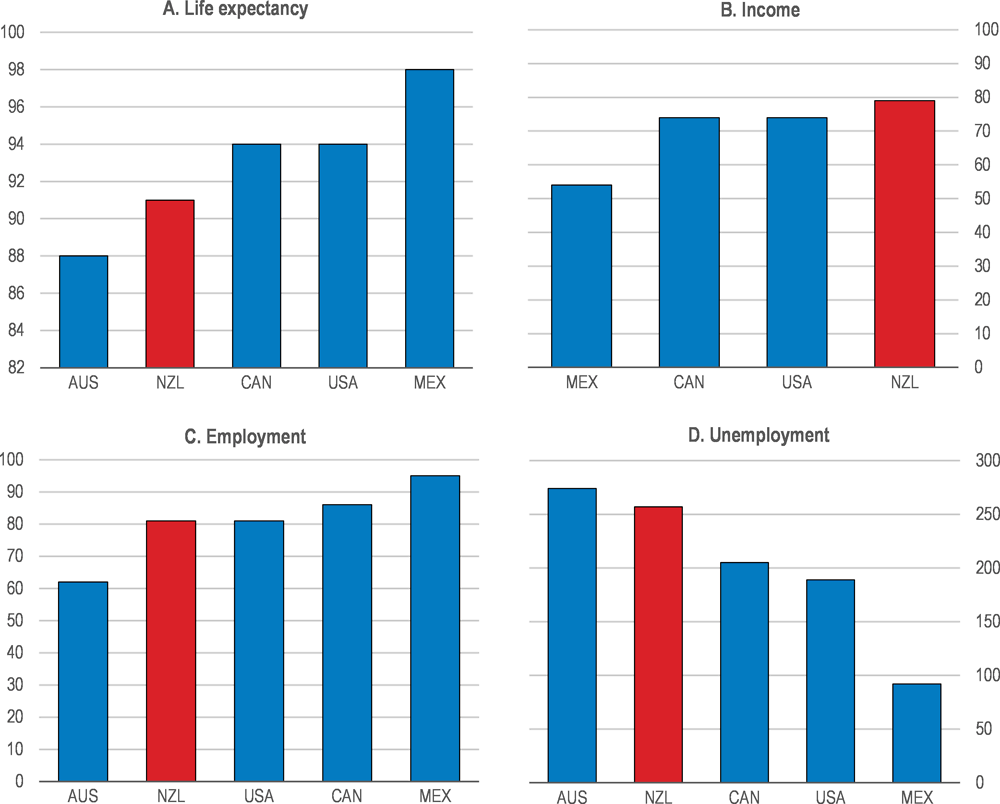
Note: The life expectancy rate of Indigenous Canadians is the weighted average of First Nations, Métis and Inuit women and men. Median income refers to total personal income for Canada; median household income for Mexico; median personal income for New Zealand; and median earnings for the United States. Non-Indigenous peoples’ income corresponds to the median earnings of the total population for the United States. Employment and unemployment refer to people aged 15-64, as a percentage of the population of the same age, except for Canada where it refers to populations aged 15 and over.
Source: Adapted from OECD (2019), Linking Indigenous Communities to Regional Development, OECD Publishing, Paris. See StatLink for data sources and reference years.
Curtail greenhouse gas emissions and biodiversity loss; improve water quality
The natural environment is an essential part of New Zealand’s national identity, receiving a top rating from New Zealanders in terms of its importance in defining their country (Stats NZ, 2017[30]). New Zealand’s air quality is very good by international standards and has improved over the past decade, driven mainly by a shift to cleaner home heating (Ministry for the Environment and Stats NZ, 2018[31]) (OECD, 2018[32]). However, expansion of primary production over the past decades, in particular dairy farming, has increased net greenhouse gas emissions since 1990 (Figure 1.10), freshwater contamination, and threats to biodiversity (OECD, 2017[7]). High rates of population growth are placing further pressure on the environment, particularly in urban areas.
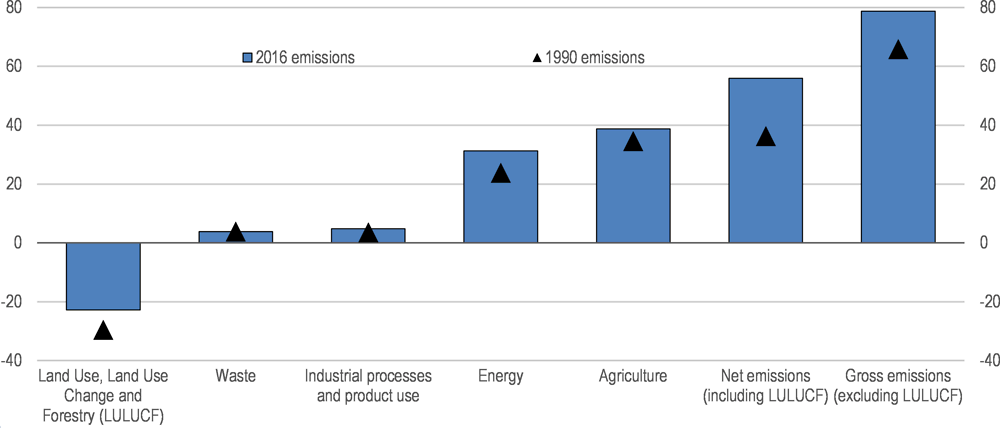
Note: Net emissions from the Land Use, Land Use Change and Forestry (LULUCF) sector are shown as a negative number because the sector removes more CO2 from the atmosphere than it emits. Columns may not sum up to the total due to rounding. Percentages are calculated from unrounded values.
Source: Ministry for the Environment (2018), New Zealand’s Greenhouse Gas Inventory: 1990-2016, mfe.govt.nz/sites/default/files/media/Climate%20Change/final_greenhouse_gas_inventory_snapshot.pdf
New Zealand’s gross greenhouse gas emissions per capita and per unit of GDP are among the five highest in the OECD, largely due to its sizeable agricultural sector which accounts for nearly half of New Zealand’s total emissions (OECD, 2019[33]). New Zealand forests offset just under a third of its gross emissions. Net emissions increased by 54% between 1990 and 2016 (Figure 1.10), as more forests were harvested, fewer trees were planted, and gross emissions rose (Ministry for the Environment, 2019[34]).
The 2019 Budget priorities and the international evidence on well-being
Five priorities for New Zealand’s first well-being budget were set out in the 2019 Budget Policy Statement (New Zealand Government, 2018[35]):
-
Creating opportunities for productive businesses, regions, iwi (Māori tribes) and others to transition to a sustainable and low-emissions economy;
-
Supporting a thriving nation in the digital age through innovation, social and economic opportunities;
-
Lifting Māori and Pasifika incomes, skills and opportunities;
-
Reducing child poverty and improving child well-being, including addressing family violence;
-
Supporting mental well-being for all New Zealanders, with a special focus on under 24-year-olds.
The budget priorities were developed through analysis of New Zealand well-being evidence, in consultation with Chief Science Advisors, and sector experts. They are in line with some of the well-being challenges identified through comparison with other OECD countries (e.g. Figure 1.3). The first budget priority addresses the urgency to counteract New Zealand’s high per capita greenhouse gas emissions and deteriorating natural capital. The second resonates with the identified need to strengthen investment in research and development. The third priority responds to the large ethnic inequalities in well-being outcomes in New Zealand. The fourth and fifth priorities are in line with the finding that child well-being and mental health are areas of high concern for New Zealand. However, many of these priorities reflect long-term systemic challenges that are unlikely to be reversed by a single short-term funding injection. Consideration must therefore be given to what can be done to foster better outcomes on a longer-term basis, through both budgetary and non-budgetary mechanisms.
While prioritisation means focusing on a relatively narrow set of issues, international evidence points to other opportunities to raise New Zealand’s well-being, in addition to those identified in the 2019 Budget priorities. For example, housing affordability is not explicitly mentioned in the five priorities – although the government has argued that better housing will be a key mechanism for delivering the priorities (Institute of Public Administration New Zealand, 2019[36]) and has several ongoing initiatives to address this (Chapter 3). New Zealand’s comparatively high rates of economic vulnerability, rising labour-market insecurity, and falling cognitive skills among students at age 15 are also not directly considered among the budget priorities, nor are high rates of obesity and large health disparities – though many of these outcomes are interrelated with the priorities selected. Ethnic inequalities are in need of urgent attention, but there are also other fault lines in New Zealand’s well-being, including challenges faced by people in low-income households and single-parents. One test of the five budget priorities will be the extent to which they drive programmes that have positive spill-overs for these other well-being outcomes, which would indicate that efficient and effective policy levers have been selected.
New Zealand’s Living Standards Framework from an international perspective
Frameworks for well-being in OECD countries
New Zealand Treasury’s Living Standards Framework, launched in 2011, was one of the earliest well-being policy frameworks to be developed among OECD countries. In December 2018, the Treasury publicly released its Living Standards Framework Dashboard, which operationalises the conceptual framework through a concrete set of indicators (New Zealand Treasury, 2018[37]). Information in the Dashboard is organised on three different levels: current well-being among different population groups, which also considers the relationships between well-being domains (our people); trends over time and international comparisons (our country); and the four capitals (our future) (New Zealand Treasury, 2018[3]). This builds on a long history of well-being measurement across the New Zealand Government more broadly (Box 1.1).
Among other OECD countries, a general distinction can be made between frameworks focused on the measurement, monitoring and reporting of well-being (often, but not exclusively, led by national statistical offices), and those developed to support more direct policy applications (often led by treasuries, or other central bodies such as the Prime Minister’s Office) (Table 1.1).
The Living Standards Framework’s conceptual underpinnings
The Living Standards Framework has undergone several iterations (Exton and Shinwell, 2018[38]). The December 2018 edition (Figure 1.1) is in line with international practice in terms of the dimensions and concepts covered (Figure 1.12, further down). For example, all existing national frameworks across the OECD feature well-being as a multidimensional construct, and take into account both objective and subjective aspects of people’s lives. Common domains of current well-being include income, jobs, housing, health, skills, safety, time use, environment, social connections and subjective well-being. The Living Standards Framework also reflects the specific New Zealand context, most notably through the inclusion of a cultural identity dimension, recognising New Zealand’s unique culture, including the partnership enshrined in the Treaty of Waitangi, multicultural origins and diverse immigrant population.
A comparative strength of the Living Standards Framework is that it makes a conceptual distinction between individual well-being outcomes “today” and the broader systems and means to sustain these over time (New Zealand Treasury, 2018[39]). Differentiating between current and future well-being helps to monitor whether a country is maximising the former at the cost of the latter, to clarify intertemporal trade-offs in policy design, and to emphasise the intergenerational character of well-being (Stiglitz, Sen and Fitoussi, 2009[40]; UNECE, 2013[41]; UNU-IHDP and UNEP, 2014[42]; OECD, 2015[43]) While several dashboards mix sustainability indicators with current well-being outcomes, only three other initiatives – the OECD Well-being Framework, Belgium’s Complementary Indicators to GDP and the Dutch Well-being Monitor – currently make explicit this distinction between current well-being and sustainability. In a further step, the Living Standards Framework also acknowledges the roles of risk and resilience, which are key components of a systems approach to sustainability that emphasises interactions among the four capitals, and their joint role in producing current well-being outcomes (De Smedt, Giovannini and Radermacher, 2018[44]).
Well-being measurement in New Zealand has a long history and spans multiple ministries and public bodies. As early as 2001, the Ministry of Social Development published its first Social Report (Ministry of Social Development, 2011[45]), with very similar domains to those for current well-being included in both the OECD approach and the Living Standards Framework Dashboard. The Social Report also strongly influenced the design of the biennial New Zealand General Social Survey, first fielded in 2008 to collect information about multiple well-being outcomes and their distribution across groups (Stats NZ, 2017[46]; Fleischer, Smith and Viac, 2016[47]).
Data availability expanded significantly in subsequent years, particularly in the social and environmental domains. In 2008 and 2010, Stats NZ produced two iterations of Measuring New Zealand’s Progress using a Sustainable Development Approach, building on the earlier Monitoring Progress Towards a Sustainable New Zealand Reports from 2002 and 2003 (Stats NZ, 2011[48]). In 2011, a paper by the Treasury provided a snapshot of New Zealand’s Living Standards (New Zealand Treasury, 2011[49]). Also in 2011, Stats NZ released the first prototype of its Integrated Data Infrastructure, a large database containing microdata about people and households from a wide range of government agencies, Stats NZ surveys and Census, as well as non-government organisations (Stats NZ, 2018[50]). This infrastructure provides a rich source of information for the Social Investment Agency, which strategically advises the government on improving outcomes for New Zealanders. Since its establishment in 2015, the Agency has produced various case studies on using a well-being approach to public policy, including on the well-being impacts of social housing (SIA, 2018[51]; SIA, 2018[52]; SIA, 2018[53]). The Ministry for the Environment and Stats NZ launched their Environmental Reporting series the same year (Ministry for the Environment and Stats NZ, 2015[54]).
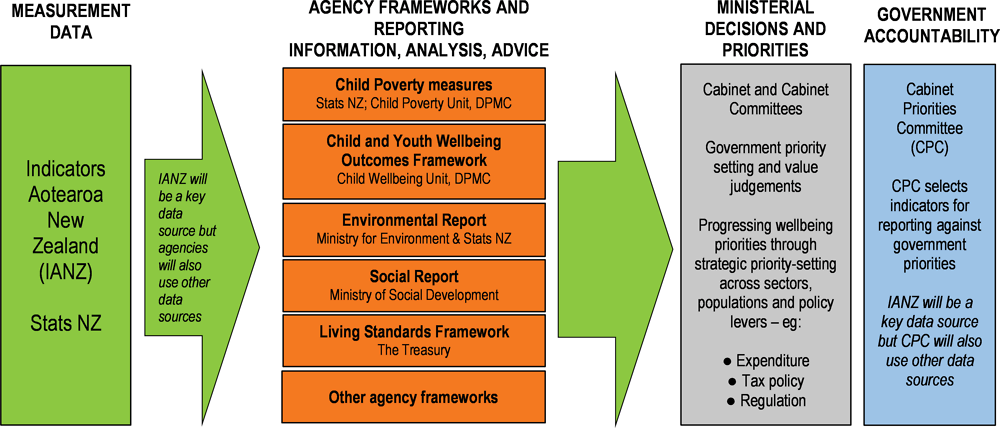
The Treasury’s 2018 Living Standards Framework Dashboard is a natural extension and consolidation of this previous work. Stats NZ’s Indicators Aotearoa New Zealand, is a further large-scale well-being and sustainability dataset due to be launched in mid-2019.
Broad-based stakeholder support for well-being frameworks is an important factor for their uptake and longevity. Public consultation has often played a role in the development of measurement frameworks in other countries (Table 1.1). The Treasury invited feedback on its Living Standards Framework Dashboard proposal by publishing it on its website. 500 responses were received, as well as 60 submissions from the business and NGO sectors, academics, individuals, and government agencies (New Zealand Treasury, 2018[37]). While this implies a high per capita response rate when compared to similar consultations in other countries, these remain relatively low numbers.4 Nevertheless, the Treasury was able to build on previous public outreach over the past four decades (e.g. consultations by the Royal Commissions on Social Security, as well as for the Ministry of Social Development’s Social Report, Stats NZ’s New Zealand General Social Survey, Measuring New Zealand’s Progress Using a Sustainable Development Approach, and the Environmental Reporting Series). In developing its well-being approach, the Treasury has been transparent in putting material, from discussion papers to the budget guidance and cost-benefit analysis tools, into the public domain (e.g. (King, Huseynli and Macgibbon, 2018[55]; Janssen, 2018[56]; Van Zyl and Au, 2018[57]; Frieling, 2018[58]; Morrissey, 2018[59]; Yong, 2018[60]; Tavita and Levi-Teu, 2018[61]; New Zealand Treasury, 2018[62]), providing a platform for engagement and debate within New Zealand, and a valuable resource for other governments.
From frameworks to measurement: the Living Standards Framework Dashboard
Across OECD countries, the shape and size of well-being frameworks, and the associated dashboards of indicators, have varied according to their use. Frameworks focused on monitoring and reporting typically involve building a large evidence base on the state of a country’s well-being (i.e. an indicator set) and making this information publically available.5 The goal of these diagnostic exercises is usually to provide a comprehensive account of how life is going for people, including trends over time and inequalities among population groups. At the other end of the spectrum, frameworks that have been developed for specific policy applications often have far fewer indicators, as in France, Italy and Sweden, where a small set of indicators are reported during budgetary discussions. The Living Standards Framework Dashboard falls in the middle of this spectrum (Figure 1.11). It covers 554 indicators, including a few indicators for each of the 12 domains of current well-being and the four capitals.6
From mid-2019, Stats NZ’s Indicators Aotearoa New Zealand (IANZ) initiative is expected to provide a suite of nearly one hundred well-being and other contextual indicators (Stats NZ, 2019[63]). This places it among the larger indicator sets in OECD countries (Figure 1.11), alongside several other broad-based well-being monitoring initiatives from national statistical offices. When the IANZ and Living Standards Framework Dashboard begin to be published in parallel, it will be important to clarify their different functions and complementarities. In the future, the Treasury’s Dashboard, and the well-being approaches in several other New Zealand government agencies, are expected to draw from data provided in IANZ (see Figure 1.13, below). At the same time, some in-depth features of the Treasury’s Dashboard, such as international comparisons, are not expected to feature in the IANZ data set, and will need to be drawn from other sources of data and analysis.
The Dashboard’s indicator coverage is broadly consistent with that in other countries, but includes some gaps
The Living Standards Framework Dashboard is consistent with an emerging international consensus on the key “ingredients” of well-being: detailed content mapping of the Living Standards Framework dimensions and indicators against other well-being frameworks across the OECD shows a large degree of overlap, even if indicators are organised into domains in slightly different ways across countries (Figure 1.12).
Despite the overlap with other well-being frameworks, several themes and indicators consistently included in other countries’ approaches do not feature in the Living Standards Framework Dashboard (Table 1.2). A variety of factors may explain these differences, ranging from data availability issues, to conceptual issues, to the need for parsimony and to focus on areas of greatest importance in the New Zealand context. When the Dashboard was introduced, the Treasury noted that further work was needed in particular to integrate Te Ao Māori perspectives and concepts of well-being; to develop indicators for New Zealand cultural identity; and to recognise the critical role of child well-being in intergenerational outcomes (New Zealand Treasury, 2018[1]). In addition, the Treasury signalled the need for future work on the risk and resilience components of the framework, institutions, knowledge and skills, human capital, the environment and natural capital, and trade-offs among the domains.
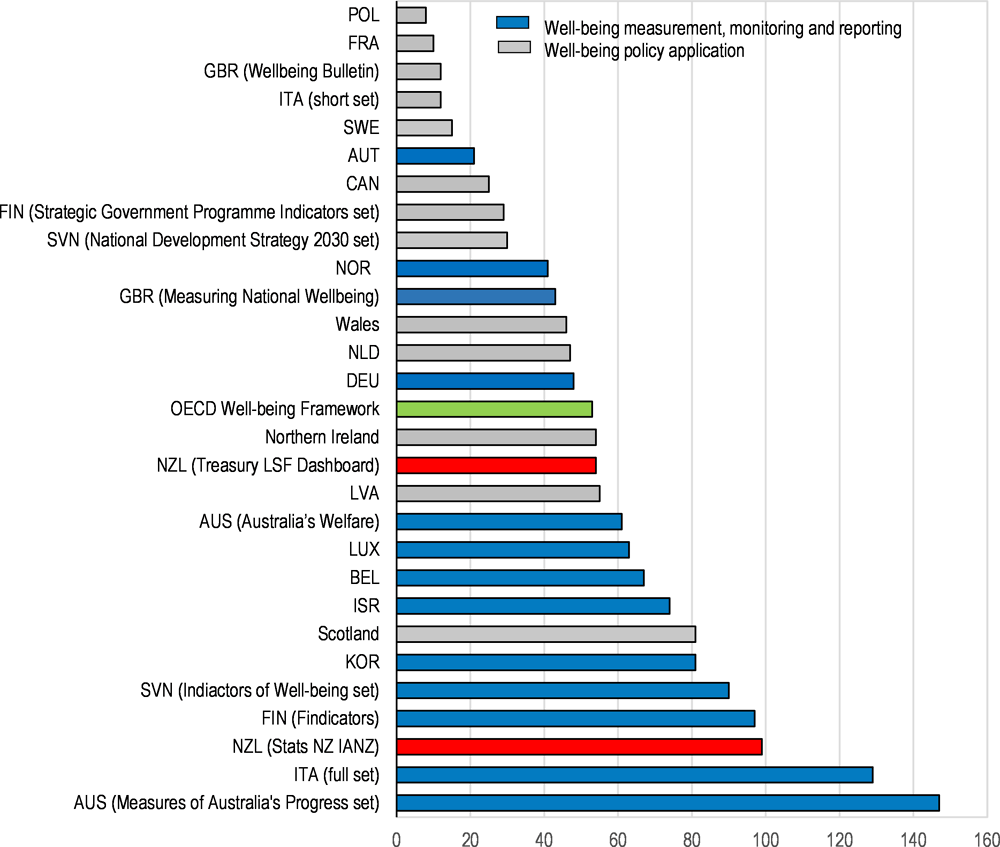
Note: The number of indicators refers to unique headline indicators as of May 2019. Information on Stats NZ’s IANZ initiative is based on the proposed indicator list released on 9 April 2019.
Source: See StatLink for details of the data sources.
In an international context, areas where the Dashboard’s measurement gaps are greatest include natural capital, human capital and innovation (Table 1.2) (Fleischer, Frieling and Exton, forthcoming[6]). In some cases the data gaps in the current Dashboard mean that it is not reflecting existing indicators of high relevance, both to New Zealand’s well-being performance internationally, and to the five priorities set out for the 2019 Wellbeing Budget. For example, maintaining and protecting New Zealand’s unique natural capital base is of central importance for the sustainability of well-being and growth, as reflected in the priorities for the 2019 Budget (New Zealand Government, 2018[35]). Yet this is the area where the Treasury’s Dashboard deviates the most from practice around the OECD (Table 1.2).7 A further budget priority emphasises innovation, yet measures of investment in research and development or adult skills and lifelong learning, both of which feature in many other national well-being frameworks and speak to this priority, are currently absent.
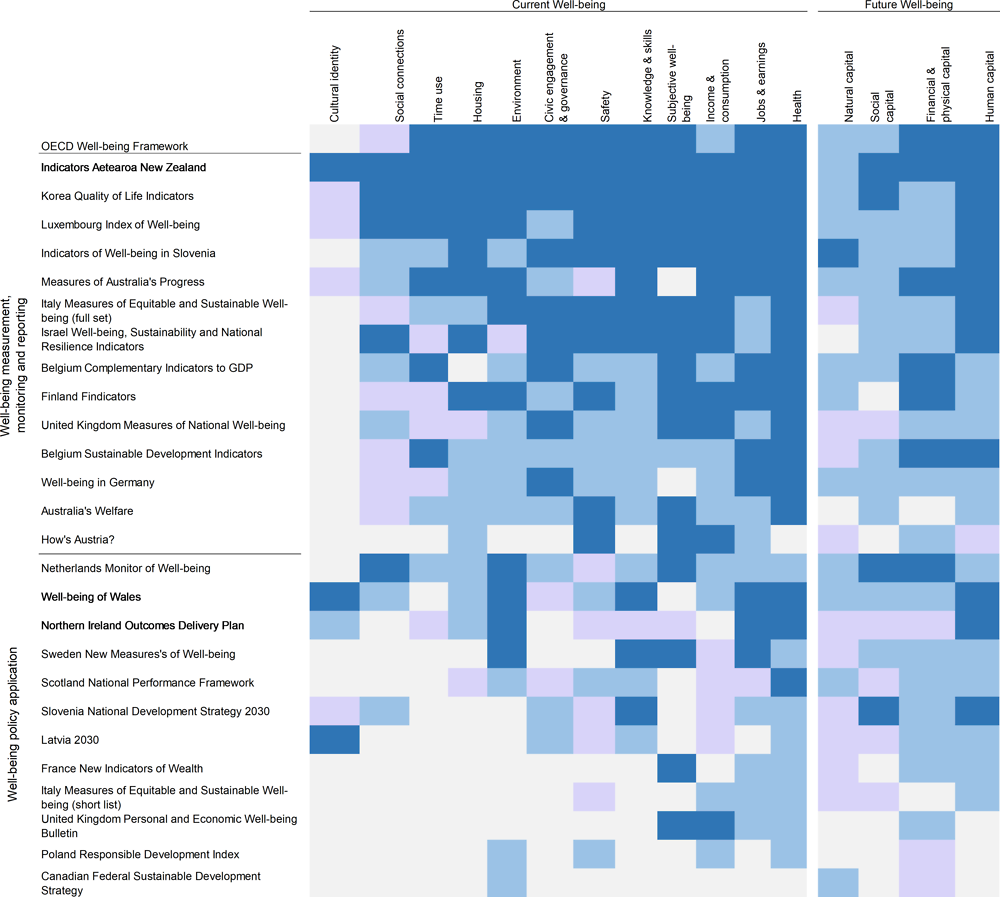
Note: A dark blue shade indicates that 50% or more of the indicators included in the Living Standards Framework dimensions are also contained in the other well-being dashboard. Light blue indicates that less than 50% (but more than 0) are contained in the other well-being dashboard. Purple indicates that a dashboard includes the concept envisioned by the respective Living Standards Framework dimension, but in a very different way and with no comparable indicators. White indicates that the dimension of the Living Standards Framework is not covered in other frameworks. Only fully operationalised indicators (as of May 2019) are considered. Norway - How We Are Doing and the Finland Strategic Government Programme Indicators are not included as indicator details in English were not available.
Source: Fleischer, Frieling and Exton (forthcoming[6])
Natural capital measurement is a particularly challenging area in need of further investment. It is a domain that is poorly covered in the OECD’s well-being framework, strongly hindered by a lack of internationally comparable data, and by the very wide range of indicators needed to capture environmental resources and ecosystem services comprehensively (OECD, 2017[4]; OECD, 2013[64]; OECD, 2015[43]). Nevertheless, several international indicators are available, and OECD data indicate that New Zealand performs poorly relative to other countries in terms of greenhouse gas emissions and soil nutrient balance, while Stats NZ data indicate worsening nitrogen pollution in rivers, measures that are currently missing from the Living Standards Framework Dashboard (Fleischer, Frieling and Exton, forthcoming[6]; OECD, 2017[7]). Most other well-being frameworks in OECD countries include related indicators (e.g. greenhouse gas emissions, CO2 emissions, carbon footprint) and energy (e.g. share of energy renewably produced). Likewise, the Living Standards Framework Dashboard includes no information on the state of New Zealand’s protected areas. Although the Dashboard has measures of drinking water quality and water ‘swimmability’ (i.e. the share of tested river sites deemed safe to swim in under normal conditions), measures used elsewhere include nitrates/nutrient pollution in rivers and lakes, a particularly important issue in New Zealand (OECD, 2017[7]; New Zealand Treasury, 2011[49]).8
New Zealand is generally well-placed in terms of existing data infrastructure to fill some of these comparative gaps (Fleischer, Frieling and Exton, forthcoming[6]). Where these indicators are considered beyond scope by the Treasury, they could be considered for inclusion in other agency-specific frameworks (Figure 1.13), or in the forthcoming Indicators Aotearoa New Zealand dataset from Stats NZ – which is expected, over time, to address around half of the data gaps identified here (Stats NZ, 2019[63]). To ensure a good read-across with other international approaches, the international comparability of these measures will also be key.
Applying a well-being lens to policy in New Zealand
Implementing a well-being approach to policy
New Zealand is among a small but growing group of countries taking steps to embed well-being more deeply and systematically into policy processes (Exton and Shinwell, 2018[38]; Durand and Exton, 2019[65]). Since 2015, France, Italy and Sweden have each introduced well-being indicators in their budget deliberations. Slovenia, Scotland, Paraguay, Ecuador and Colombia have drawn on well-being evidence to inform their National Development Strategies and performance frameworks. Wales, the United Kingdom, Ecuador, Bhutan and the United Arab Emirates have each experimented with creating new institutional structures to champion well-being or to support a strengthening of the evidence base (such as Commissioner or Ministerial-level posts, or dedicated centres for gathering and disseminating evidence). The United Kingdom What Works Centre and Treasury have meanwhile provided analysts with methodological guidance and support to consider well-being impacts in ex ante appraisal and ex post evaluation of policy proposals and programmes.
The New Zealand Government has identified a broad range of changes to the public finance and state sector system that are needed to support its well-being vision. Some of these changes are led by the Treasury, often with implications for other ministries and agencies (e.g. the 2019 Wellbeing Budget), but others are led in other agencies (e.g. the Department for the Prime Minister and Cabinet’s Child Poverty and Well-Being work; Stats NZ’s Indicators Aotearoa New Zealand). The government’s well-being approach includes:
-
Embedding well-being in the Public Finance Act (1989). The current proposals will require the government to set out each year how its well-being objectives, together with its fiscal objectives, will guide its budget. The well-being objectives themselves will be set by the government of the day.
-
The 2019 Wellbeing Budget, in which well-being evidence was used to shape the Budget priorities (New Zealand Government, 2018[35]), as well as to assess budget bids from government departments (New Zealand Treasury, 2018[62]). Agencies were also strongly encouraged to collaborate when developing budget bids.
-
The Child Poverty Reduction Act, passed in late 2018, requires the government of the day to set long-term (10-year) and intermediate (three-year) targets on a defined set of child poverty measures, and to report annually on those measures. On Budget day, the government must report on progress towards its child poverty targets, and how measures in the Budget will affect child poverty. The Children’s Act 2014 was also amended to require successive governments to develop and publish a child and youth well-being strategy, with a particular focus on improving the well-being of all children and young people; children with greater needs; reducing child poverty and mitigating the impacts of child poverty and of socio-economic disadvantage experienced by children; and improving the wellbeing of the core populations of interest to Oranga Tamariki-Ministry of Children. This includes setting desired outcomes, actions to achieve them, and reporting on measures of progress (Department of the Prime Minister and Cabinet, 2019[66]).
-
The Local Government (Community and Well-Being) Amendment Act (2019) reinstates wording that was previously included (from 2002-2012) in the Local Government Act, stating that the purpose of local government is to “promote the social, economic, environmental and cultural well-being of communities, in the present and for the future”.
-
Embedding well-being into agencies’ performance reporting. The government expects agencies to describe their contribution to improving inter-generational well-being. The Treasury is currently working with agencies to understand how best to embed a focus on intergenerational well-being in accountability documents. This is based on principles such as taking a longer-term view; thinking broadly about impacts, both positive and negative; working collectively towards shared outcomes; and recognising and building on existing frameworks, strategies or indicators. This ties into the government’s wider proposals to revise the State Sector Act (1992) and to enable a more coordinated, joined up public service.
The Treasury has been developing its Living Standards Framework since 2011. It was developed as a conceptual tool to support improvements in the quality of the Treasury’s advice through reminding Treasury analysts of the wider dimensions of well-being that should be taken into account when formulating policy advice, and in considering the trade-offs between alternative policy options (Au and Karacaoglu, 2015[67]; Exton and Shinwell, 2018[38]). Although not initially intended as a well-being measurement initiative, illustrative indicators were put forward for discussion, even in the early stages of developing the Framework (New Zealand Treasury, 2011[49]). The work has been stepped up since 2017 to support the government’s well-being approach:
-
The Living Standards Framework was updated in 2018, and a new Dashboard of well-being indicators was released. Amongst other uses, the Dashboard aims to complement the standard macroeconomic and fiscal reporting that the Treasury publishes as part of the Budget process. For example, the 2019 Budget Policy Statement included a “Wellbeing Outlook”, based on the Dashboard, to complement the standard Economic and Fiscal Outlook.
-
Proposed amendments to the Public Finance Act will require the Treasury to produce a periodic report on current and future well-being every four years (Institute of Public Administration New Zealand, 2019[36]).
-
The Treasury has also adopted a well-being approach in its longer-term statutory reporting. In the 2018 Investment Statement, which analyses the government balance sheet and its management, the Living Standards Framework provided an organising framework. The Statement, required at least every four years, also includes a chapter on how to broaden it to include natural capital considerations.
-
The Community for Policy Research was launched in November 2017 as a multidisciplinary network of external researchers whose work could be used to improve the advice of Treasury. To steer this, Treasury has published a short booklet listing its key research interests, clarifying the broad areas and research questions of greatest relevance to addressing priority gaps in the Treasury evidence base (New Zealand Treasury, 2017[68]).
Despite the different origins and context of the Living Standards Framework, New Zealand often faces policy implementation challenges similar to those in other countries. One challenge is simple awareness: communicating clearly what well-being is, how it can be measured, and why it matters for policy. The tools typically used to generate policy advice, and the theoretical and applied analysis on which these rest, are rarely centred on well-being, and often struggle consider economic, environmental and social impacts in an integrated way – even if recent work is beginning to turn this around. Well-being policy makes new demands on the evidence base, and the research response will take time to build. Much of the evidence will be generated outside of government departments, and perhaps even New Zealand itself, so evidence demands must be stated clearly, and communicated effectively. Signalling a long-term commitment to using well-being evidence will enable actors within the evidence pipeline to invest the long-term resources needed to meet these demands.
Further challenges include joining up across sectors, adopting a multidimensional approach to policy impact appraisal and evaluation that can forge collaboration across departmental silos, surfacing trade-offs and capitalising on synergies. The robustness of policy analysis tools must be maintained throughout, with good quality checks in place. Tackling these issues will require clear direction and leadership, continuous learning, and culture change, not only within government and the civil service, but also the wider community that shapes policy. These challenges, discussed in more detail below, should inform the next steps planned by the New Zealand Government, as well as the review and update of the Living Standards Framework and its Dashboard of measures, currently planned for 2021 (New Zealand Treasury, 2018[3]).
Building a joined-up well-being information system that can meet new policy needs
Good quality, timely, and comprehensive data play a crucial role in policy advice
The 2018 Living Standards Framework Dashboard represents an important step in consolidating well-being evidence for New Zealand. It draws data from several different sources including Stats NZ, the OECD, the Ministries of Health, Education, Environment and Justice. Despite some important data gaps (discussed above), a long tradition of measuring well-being in New Zealand means that The Treasury has a range of quality data to draw from (Box 1.1). The release of Indicators Aotearoa New Zealand by Stats NZ in mid-2019 will provide a key data source, feeding into the Living Standards Framework Dashboard and several other well-being reporting initiatives across government (Figure 1.13).
Source: New Zealand Treasury (2019), Presentation by Gabriel Makhlouf to the OECD, 22 January.
The steps being taken to implement a well-being approach across government (Box 1.2) place new demands on the statistical system, which is already under some strain (Stats NZ, 2018[69]). To build up the necessary well-being evidence base, data should be collected frequently, and reported in a timely manner. Doing so will provide policy makers with more rapid and regular information, as well as a richer source of material for the necessary research on critical policy levers. However, these demands are at odds with current statistical practice both in New Zealand and throughout the OECD, where well-being measures are often collected and reported with very low frequency and timeliness (Fleischer, Smith and Viac, 2016[47]). In New Zealand, the General Social Survey, a major source of well-being data, is conducted every two years. The Census, conducted every five years, is another important source. Time use data, critical for the Living Standards Framework’s time use domain, and for analysing unpaid work, leisure, social connectedness, cultural participation, health behaviours, etc. was last collected by Stats NZ in 2009/10, 11 years after the preceding data collection in 1998/99. In addition, around one-third of the proposed indicators for the Indicators Aotearoa New Zealand dashboard are currently still to be developed (Stats NZ, 2019[63]) – meaning that investment in new data sources and methods will be needed.
With any comprehensive well-being indicator set that aims to inform policy making, the cost burden of filling data gaps, providing more frequent and more granular data collections and more timely reporting must be considered. To help manage these pressures, it may be necessary for the government to identify a narrower set of top priority indicators (see below). Indeed, Stats NZ have stated their intention to select a core set of 20-25 indicators to provide a broad overview of progress, accompanied by 80-90 second tier measures in Indicators Aotearoa New Zealand (Stats NZ, 2018[70]). Some Stats NZ survey instruments, such as the Household Labour Force Survey and the Quarterly Employment Survey, are already fielded quarterly. The General Social Survey could be conducted on an annual, rather than two-yearly, cycle, and could incorporate some items currently only captured in the five-yearly Census. Additionally, Stats NZ should consider the use of administrative data and other Big Data sources. Some of these are already being explored in the context of the Census Transformation Programme (Stats NZ, 2019[71]).
A more joined-up approach to defining well-being is needed in government
The Living Standards Framework is a tool owned by the Treasury, rather than the wider New Zealand Government. Since it is neither a development strategy, nor a performance monitoring framework, it does not set specific goals or targets that unite government departments around a set of common objectives - an approach adopted in Scotland and Slovenia, for example, to galvanise government action and cooperation (Exton and Shinwell, 2018[38]; Durand and Exton, 2019[65]). The decentralised approach to well-being reporting in New Zealand, with several different frameworks and indicator sets operating in parallel, enables government ministries and agencies to tailor the breadth and depth of their analysis to the needs, audiences and policy problems at hand. Yet one important downside of this decentralised system is that there is no definitive account of New Zealand’s well-being – nor one consistent framework under which the different approaches are nested. For example, the “four well-beings” referred to in the Local Government (Community Well-being) Amendment Bill (Box 1.2, above) are quite different to the Treasury’s Living Standards Framework. The lack of coordination risks creating confusion among both stakeholders and the research community tasked with generating the evidence base, and will frustrate attempts to map indicators at the different levels of policy-making (Burton, Morrissey and Ng, 2018[72]). It also means that creating a more collaborative “whole-of-government” approach, another key objective for the current government, may become harder to realise.
Chief Executives across the public service should consider adopting a common conceptual framing of well-being – such as the Living Standards Framework - as an organising construct within which agency well-being frameworks can be nested. Greater clarity should also be provided on the respective roles of and connections between the approaches used in different parts of the public sector. This does not mean that all departments and agencies should adopt the same indicators as the Living Standards Framework Dashboard, since greater or less granularity may be required in specific domains. Nor would it necessarily mean covering all domains of the framework, since some may be of lesser relevance for a specific government agency. But it would mean that all indicator sets would be articulated in relation to one central framework, and stakeholders could easily understand how they interrelate. Although the Treasury did consult with other ministries, and the current approach builds on more than a decade of well-being work in New Zealand, the speed with which the current Living Standards Framework and Dashboard have been developed left little room to seek cross-government consensus. This goal should be pursued in the future, not least because the 2019 Wellbeing Budget already required all departments to use the Living Standards Framework in preparing their budget spending bids.
A small set of priority indicators could help raise awareness and focus attention
Comprehensive dashboards produced by independent public bodies, such as national statistical offices, are essential for general well-being monitoring. They also play an important role in ensuring that well-being is not defined as (or associated with) a narrow set of political priorities. Nevertheless, to capture the attention of senior leaders, politicians, media and the wider public, a smaller dashboard can be a valuable addition to larger diagnostic data sets (Jeffrey and Michaelson, 2015[73]; Kanbur, Patel and Stiglitz, 2018[74]; France Stratégie, n.d.[75]; Scott and Boyd, 2017[76]). This approach has been followed in a number of OECD countries. For example, implementation of the new budget laws in France and Italy resulted in 10 and 12 indicators respectively, while Sweden’s well-being dashboard, also presented to inform the budget process, contains 15.
The process for selecting small headline sets of indicators has varied across countries: in France, the 10 New Wealth Indicators were the product of public consultation, with final decisions then taken by the government; in Italy, decisions on 12 budget indicators were made by an expert committee established by the Prime Minister; in Sweden, Statistics Sweden developed the framework, in consultation with government offices (Exton and Shinwell, 2018[38]). In the United Kingdom, the national statistical office has released a new quarterly Personal and Economic Well-being Bulletin, which features 12 indicators (ONS, 2019[77]). The Welsh Government is currently undertaking a public consultation on a set of around 12 National Milestones, which will incorporate specific target levels (Welsh Government, 2018[78]), to complement its 46 measures of well-being (Table 1.1, above). One critical input in this selection should be key findings from the larger-scale well-being monitoring dashboards, which in New Zealand would be the Indicators Aotearoa New Zealand data set and the current Living Standards Framework Dashboard. Without these, priority selection will have less of an empirical basis, and be less transparent (Fleischer, Frieling and Exton, forthcoming[6]).
The well-being objective-setting that the New Zealand Government would be required to undertake in the currently proposed amendments to the Public Finance Act (Institute of Public Administration New Zealand, 2019[36]) could be accompanied by a set of priority headline indicators. These could in turn provide the basis of the annual reporting required under the proposed amendments. In the more immediate future, the five priorities set out for the 2019 Wellbeing Budget (New Zealand Government, 2018[35]) could provide one stimulus for a smaller set of indicators – though (particularly in light of the current frequency and timeliness of well-being data) these should be adopted for a longer time horizon, rather than an annual budget cycle. For example, the targets required by the new Child Poverty Reduction Act (New Zealand Parliament, 2018[79]), which must span both medium (three-year) and longer term (ten-year) timeframes, will provide clear focus and accountability over what should be realistic time horizons for policy-related changes to occur.
Adapting the policy toolkit to put well-being at the centre
The budget process is a key mechanism to operationalise a well-being approach
New Zealand’s 2019 Budget aims to use well-being evidence at every stage of the cycle, from setting priorities to evaluating results (Figure 1.14). Since the budget process engages all government departments, it offers a lever for capacity-building among analysts across the public service, and a way to forge more collaborative approaches and evidence-sharing. It also has the potential to generate savings through reconciling misaligned bids; consolidating those bids that should produce strong synergies in terms of outcomes; and, by looking across a number of bids that all impact on the same well-being outcome(s), choosing the one(s) associated with the strongest evidence and greatest impacts. The impact of greater alignment can be substantial. For example, the Treasury has assessed that, even under highly restrictive assumptions, better aligning policy could be fiscally equivalent over 40 years to raising the age of eligibility for the state pension by two years (Burton et al., 2016[80]).
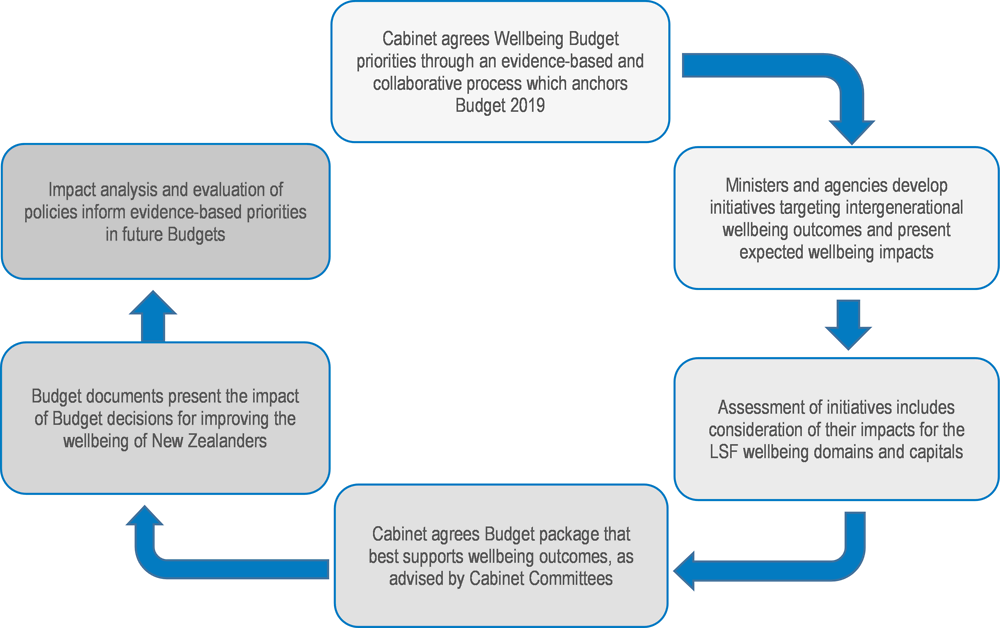
Source: New Zealand Government (2018), Budget Policy Statement, Budget 2019, www.budget.govt.nz/budget/2019/fiscal-strategy/bps2019.htm.
To support the 2019 Budget, the Treasury required all initiatives seeking new funding to include a well-being analysis and intervention logic. First, the template for funding proposals asked departments to quantify how their initiative is expected to impact on twelve current well-being domains (New Zealand Treasury, 2018[62]). Not every domain of current well-being was assessed for every initiative: departments were instead asked to outline one primary and up to three secondary well-being domains impacted. The template also required a description of who is affected; the magnitude of the impact; the timeframes in which the impact will be realised; and a description of the evidence base and quality. In addition, initiatives were assessed on whether they were expected to “increase”, “decrease” or “maintain” each of the four capital stocks. Finally, departments were also asked to consider whether initiatives help to build resilience or respond to risks to well-being.
Guidance to agencies submitting bids indicated that initiatives that align with one or more of the five Budget 2019 priorities, and show cross-agency and cross-portfolio collaboration, would be prioritised. As is commonly found in budgets across the OECD, a majority share of New Zealand’s budget is reserved for baseline spending, which limits the discretionary funds available for new initiatives. New spending announced in the 2019 Wellbeing Budget constitutes only around 4% of core Crown expenditure. One of the Treasury’s future challenges will therefore be to develop approaches for reviewing how effectively the baseline spending of government agencies supports New Zealanders’ well-being. As a first step in the 2019 Budget, each Minister was asked to undertake a review of spending and identify at least 1% of baseline spending that is not aligned with the government’s aims, or is of lowest priority.
Existing policy tools already account for several aspects of people’s well-being, albeit unevenly
While France, Italy and Sweden have each recently introduced new dashboards of well-being indicators in their budget processes, the approach taken in New Zealand is a much more comprehensive and integrated one than seen elsewhere to date. Nevertheless, several countries have started to address the question of how to go beyond GDP when performing ex ante policy appraisal and ex post policy evaluation. For example, international practice on regulatory impact assessments has seen a gradual shift towards considering the wider benefits and costs of regulation (Figure 1.15). Nevertheless, economic impacts, such as on competition and small businesses, impacts on the environment, and on the public sector and budget remain the most frequently assessed types of impacts. The analysis of social impacts, such as income inequality and poverty, is expanding but not as developed (OECD, 2018[81]; Deighton-Smith, Erbacci and Kauffmann, 2016[82]).
In New Zealand, regulatory impact assessments are a formal Cabinet requirement for regulatory changes (OECD, 2016[83]). The Treasury provides guidance and quality assurance of this process, including periodically commissioning independent reviews (OECD, 2015[84]). New Zealand’s response to the OECD Indicators of Regulatory Policy and Governance Survey 2017 indicated that each of the impacts in Figure 1.15 are assessed for some primary laws and subordinate regulations, but none are required to be assessed for all regulations. The templates provided for the purposes of impact assessment (New Zealand Treasury, 2017[85]) are very flexible: they require a statement about who is affected and how, as well as a summary of costs and benefits, and a description of stakeholder views, but there are no mandatory requirements to consider impacts for specific groups of citizens (e.g. by gender or ethnicity), or to assess equity concerns (e.g. income inequality) or specific outcomes (e.g. environmental or health impacts). The accompanying guidance (New Zealand Treasury, 2017[86]) notes that relevant impacts can include economic, fiscal, compliance, social, environmental and cultural impacts, but no further advice is provided on what social, environmental and cultural impacts are or how they might be considered.
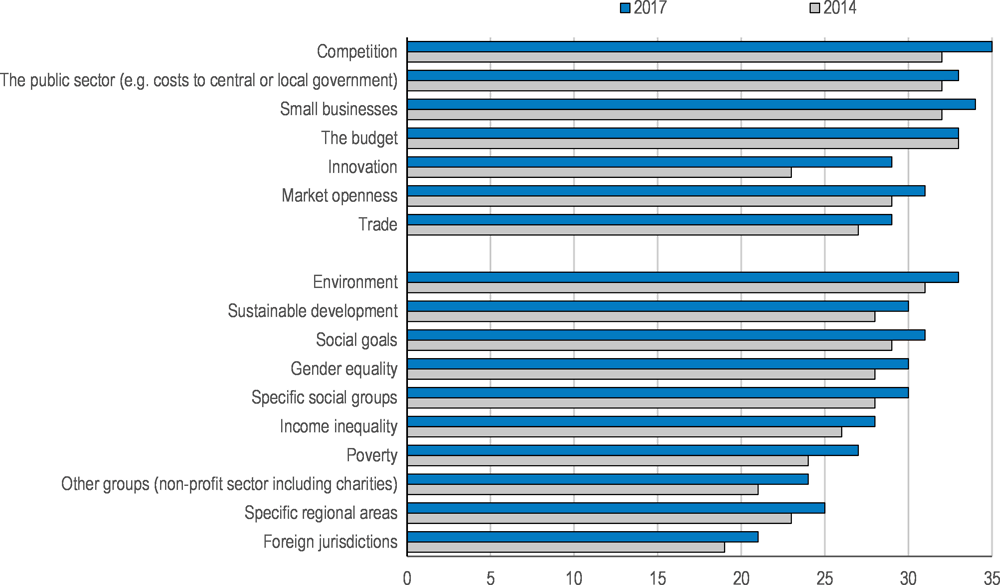
Note: Data is based on responses to the OECD Indicators of Regulatory Policy and Governance Surveys 2014 and 2017, from 34 OECD member countries and the European Union.
Source: Adapted from OECD (2018), Regulatory Policy Outlook 2018, OECD Publishing, Paris, https://dx.doi.org/10.1787/9789264303072-en.
Cost-benefit analysis, which is often part of regulatory impact assessments, is also often adapted to account for the non-market value of goods and services provided, or depleted, by policy interventions. Standard techniques include stated preference methods (i.e. asking people about their willingness to pay to receive a benefit, or avoid a cost) and revealed preference methods (i.e. observing people’s behaviour in order to infer the value they place on a given good). Recently, a third method, based on subjective well-being (typically, life satisfaction) has been developed in an effort to capture well-being impacts more broadly (Fujiwara and Campbell, 2011[87]; OECD, 2013[88]; O’Donnell et al., 2014[89]; Layard, 2016[90]; Wright, Peasgood and MacLennan, 2017[91]; Clark et al., 2018[92]; OECD, 2018[93]).9 Values generated through subjective well-being methods have been included in the New Zealand Treasury’s CBAx Impacts Database (Box 1.3). The United Kingdom Treasury’s Green Book on Appraisal and Evaluation in Central Government (HM Treasury, 2018[94]) also offers a detailed overview of methods to assess and evaluate non-market costs and benefits, including techniques based on subjective well-being.
One barrier to the harmonised use of any type of cost-benefit analysis is that different teams of analysts may base their assessments on different sets of assumptions. To support analysts working across government departments, the New Zealand Treasury has developed a spreadsheet tool called CBAx. A key goal is to support consistency and transparency of methods: it encourages users to spell out clearly their assumptions, such as those made about effect sizes, as well as the valuations applied to different goods and services, so that these can be compared across different analyses. Through adoption of a 50-year time horizon, CBAx also aims to encourage long-term thinking.
For the 2019 Budget, the CBAx model was updated to enable impacts to be linked to well-being domains. It was made available to departments as a supporting tool, but its use was strictly optional. The CBAx tool can accommodate a variety of methods for generating monetized values, including values inputted by departments themselves. There are currently over 200 values for impacts provided by the Treasury in the CBAx Impacts Database. In 2017, the Treasury purchased a license to use around 60 shadow values estimated using the subjective well-being method, as compiled by the Australian Social Value Bank, and adjusted using New Zealand income levels. Other monetised values in the Impacts Database range from the cost of a general practitioner visit, to the value of additional educational qualifications (derived from marginal gains in earnings), health gains assessed through additional quality adjusted life years (QALYs), and the social cost of fatal transport accidents based on the value of a statistical life.
A recent evaluation (New Zealand Institute of Economic Research, 2018[95]) found that agencies have made significant improvements in the quality of their analysis of budget initiatives since the CBAx tool was introduced. However, this evaluation also highlighted that the additional burden created for agencies does not pay off in all cases, particularly where the supporting evidence used is of variable quality, for smaller initiatives (in terms of cost pressures), and for initiatives liable to political determination (where greater transparency from Treasury about budget priorities was recommended). Nonetheless, one important advantage of CBAx was in prompting greater clarity around the intervention logic – something that can enhance cost-benefit analysis, whether or not the logic is presented in monetised or quantified form. Indeed, the New Zealand Institute of Economic Research suggested re-framing CBAx as an intervention logic model, to encourage agencies to focus on the quality of their inputs, rather than on achieving a positive net present value or high overall returns on investment. While CBAx continues to be a cost-benefit analysis tool, updated Treasury guidance now puts more emphasis on the identification and quantification of impacts - i.e. the quality of inputs - and less emphasis on the monetisation of impacts and summary measures.
Source: New Zealand Treasury (2018d), CBAx Tool User Guidance https://treasury.govt.nz/publications/guide/cbax-tool-user-guidance
A key advantage of these subjective well-being techniques is that they rely on people’s lived experiences, rather than on their reactions to hypothetical future scenarios (as in the case for willingness to pay), or the wide array of factors that affect behaviour beyond rational choice (as in the case of revealed preferences). The potential for strategic responding is also reduced. Subjective well-being survey questions are generally cost- and time-effective to administer to large samples (Fujiwara and Campbell, 2011[87]). Nevertheless, challenges remain in terms of data availability, sensitivity, and estimating the duration of impacts (OECD, 2013[88]; OECD, 2018[93]). Subjective well-being is only one element of the Living Standards Framework and the more policy focuses on a single metric, the more issues of measurement error and noise begin to matter. Due, in part, to the challenges of accurately estimating the relationship between income and subjective well-being (see OECD, 2013, 2018d), the monetary estimates obtained from the subjective well-being valuation method can sometimes seem implausibly large. Thus, while subjective well-being techniques can provide a valuable complement to other valuation methods (which also suffer from important biases), the methodology is still developing, and caution is needed in making direct comparisons of impact values derived from different valuation approaches.
One of the difficulties associated with all methods for monetising non-market impacts is the lack of transparency for non-technical audiences who have a critical stake in policy decisions. Reducing non-market goods to a list of monetary values can also damage public acceptability of the analysis (Corry, 2018). Cost-effectiveness analysis (describing costs incurred per unit improvement in subjective well-being) is thus sometimes viewed as a more palatable alternative (Layard, 2016[90]; O’Donnell et al., 2014[89]). Translating (decomposing) monetary values back into physical measures, whether for describing the number of people likely to be helped, or the ways in which their lives will change, remain important for the wider communication of policy decisions – including with Ministers.
Greater guidance and oversight to ensure truly multidimensional analysis
In broadening and deepening consideration of well-being impacts across its policy advice, the Treasury will need to carefully manage the additional burden this creates. A critical area in which to develop consistent guidance and practice will be how to select which well-being domains (and capitals) should be assessed under which circumstances (Deighton-Smith, Erbacci and Kauffmann, 2016[82]; Durand and Exton, 2019[65]). On the one hand, fully capturing trade-offs and synergies implies assessing impacts across all well-being domains, over all time frames, for all policy initiatives, even if impacts may be marginal (or nil) in some cases. Indeed, this whole-of-government perspective is a key distinguishing feature of a well-being approach, in contrast to “silos” of independent social, economic and environmental impact assessment (Whitby, Seaford and Berry, 2014[96]). On the other hand, this could push analysts beyond their areas of expertise, require very broad (and potentially fruitless) evidence searches, and create some considerable demands on time, training, and capacity-building.
The Treasury approach to the 2019 Budget combined precision with flexibility. Guidance made clear that the five budget priorities, and the degree of collaboration across departments, would play an important role in determining which proposals were retained. At the same time, the budget template offered a high degree of discretion for departments to describe impacts as they understood them, and for only a limited number of well-being domains - i.e. for one primary and up to two secondary domains (though they did have the option to cover more domains if considered relevant). Yet if “impact” and “relevance” are interpreted too narrowly (e.g. if an employment initiative is only assessed for its impact on jobs and earnings, rather than also on time use, health, social connections, income and consumption, knowledge and skills, etc.) then this is little different from existing practice: spill-overs and synergies will be at best only partially addressed, and opportunities for strategic alignment would be lost.
Treasury should review the 2019 Budget experiences, including how agencies went about selecting well-being domains for their assessments. This should be done with a view to providing stronger methodological guidance on both the development and assessment of bids. Existing mechanisms of quality assurance and oversight for policy advice more generally could also be adapted to embed a well-being approach. There is already a process in place for quarterly assessments of the quality of Treasury policy advice, where papers are selected on a random basis for review by a panel of six experienced Treasury staff, an external reviewer from the New Zealand Institute of Economic Research and a staffer from a Finance Minister’s office (New Zealand Treasury, 2018[97]). This process is conducted under the guidance set out by the Department of the Prime Minister and Cabinet’s “policy project” (Department of the Prime Minister and Cabinet, 2019[98]; Washington and Mintrom, 2018[99]). Treasury is also responsible for the quality assurance of regulatory impact assessments across government. These cross-government processes could be enhanced through the Living Standards Framework. A regulatory scrutiny body would offer another method of oversight.10
Public procurement is a further policy area that governments are increasingly leveraging to achieve social, economic and environmental benefits. The OECD recently developed a framework for understanding and measuring public procurement’s contribution to the economy and national well-being more broadly which was tested in Finland and Chile (OECD, 2019[100]). In a review of Germany’s public procurement system the OECD found that the current challenges facing Germany, such as an ageing society with increasingly costly healthcare needs, air quality in cities and rising rent prices, map onto key well-being challenges relating to health status, air quality and housing affordability (OECD, 2019[101]). However an empirical assessment of public procurement’s impact on well-being requires reliable sources of data and an appropriate methodology that are often lacking (OECD, 2019[101]).
The New Zealand Government spends approximately NZD 41 billion each year buying goods and services from third-party suppliers and providers (Office of the Minister for Economic Development, 2018[102]). The government has agreed in principle to four priority outcomes that government agencies will collectively leverage through this purchasing power: increasing New Zealand businesses’ access to government procurement; construction sector skills, training and employment opportunities; employment standards and improving conditions for workers; and supporting the transition to a net zero emissions economy, and a significant reduction in waste by 2020 (New Zealand Government Procurement, 2018[103]). The Ministry of Business, Innovation and Employment is developing a monitoring and reporting framework to track agency adoption and outcomes achieved. These outcomes align with the government’s objectives of a sustainable and inclusive economy, and resonate with the priorities set for the 2019 Well-being Budget.
A joint effort to develop the evidence base and map the intervention logic between policy levers and well-being outcomes
Linking outcomes back to policy systems
Adequately evidencing how public policy affects people’s well-being is central to the success of the government’s proposed amendments to the Public Finance Act, which will require an assessment of how spending contributes to well-being objectives. Yet well-being measures in themselves say nothing about the policy settings necessary to improve outcomes: they provide the diagnosis but without a prescription. Making well-being an operational tool therefore requires systematic evidence about the links between policy levers and well-being outcomes, mapped out for different levels of government (Burton, Morrissey and Ng, 2018[72]). This is a major research agenda – and one that might benefit from initially being focused around a small set of priorities, such as those set out for the 2019 Budget. The OECD Inclusive Growth Framework for Policy Action (OECD, 2018[104]) is one example of efforts to trace the intervention logic from the characteristics of policy systems and the wider economy, to the ultimate well-being outcomes that those systems help to produce.
Identifying intermediate outcomes, which respond fairly rapidly to changes in policy systems but can be linked empirically to final well-being outcomes, may prove pivotal. New Zealand’s recent experience with interagency performance targets, the Better Public Services Results Programme, implemented in 2012-17, generally focused on this mid-layer of indicators. An assessment of the programme concluded that of the ten targets selected, the most successful proved to be intermediate outcomes that would both respond to policy intervention over a reasonably short period - making it possible to galvanise cross-sector teams through the momentum built - but are also related to real-life results of value to people (Scott and Boyd, 2017[76]). Nevertheless, there are myriad intermediate goals that a government could focus on, all of which might gain popular support from some constituencies. It is therefore critical to have some way of assessing which should be tackled first, and which will deliver the highest returns. A comprehensive approach might therefore embed such a target-setting programme into a wider exercise that first identifies the priority domains of well-being where the greatest gains can be made (e.g. based on international evidence, trends over time, inequalities, expert advisors etc.), and then where the rationale for government intervention is strongest. The intermediate outcomes could then be defined based on the evidence about key drivers of those high-level outcomes, and on how those drivers interact with policy systems.
Existing networks for evidence-informed policy should be encouraged to adopt a multidimensional well-being approach
Well-being approaches are closely related to wider initiatives to bring evidence into policy, and thus suffer the same types of barriers (Acquah, 2018[105]; OECD (forthcoming), n.d.[106]). While the Treasury, together with other government departments, can contribute to knowledge generation through their work, they also rely on knowledge generated by external researchers such as those working in universities, think tanks, etc. (New Zealand Treasury, 2017[68]). A pivot towards well-being within government therefore needs to be supported, to a large extent, by a corresponding pivot towards well-being in the research community on which much government analysis relies. In particular, as noted above, more evidence is needed about how specific policy levers impact right across the spectrum of well-being outcomes – rather than more traditional research focused on the drivers of just one outcome, or one dimension of well-being.
Steps towards this type of whole-of-government analysis are being taken. For example, OECD work on the wider benefits of learning has adopted a well-being approach to consider outcomes in adulthood across a range of domains, from job performance to life satisfaction, job satisfaction and health risks (OECD, 2015[107]). A new study on the well-being impacts of digitalisation, How’s Life? in the Digital Age, considers the opportunities and risks of digital technology across the 11 dimensions of the OECD’s current well-being framework (OECD, 2019[108]). And forthcoming OECD work on both climate change mitigation and public procurement rests on the OECD well-being framework for considering the impacts of policies beyond GDP (OECD, forthcoming[109]; OECD, 2019[101]). In the New Zealand context, policy approaches to migration have also been considered through a multidimensional well-being lens (Fry and Wilson, 2018[110]); Chapter 2).
Internationally, the absence of clear responsibility in departments for how officials should engage with research evidence, and the quality of evidence required to inform effective policy making, are some of the largest obstacles to better use of evidence in policy (Sasse and Haddon, 2018[111]). In addition, there is often little coordination across government in how evidence is incorporated in the policy process. To address these challenges, the United Kingdom’s What Works Centres act as evidence hubs and knowledge brokers between research and policy communities. An important finding by the What Works network is that creating online resources is not enough. Knowledge mobilisation is a social process and opportunities need to be actively created through sustained engagement with individuals and organisations, to help bring relevant research to the right people at the right time (What Works Network, 2018[112]).
New Zealand’s existing policy evidence infrastructure could be encouraged to adopt more of a multidimensional well-being approach. For example, New Zealand’s Social Investment Agency has been building on a holistic model to assess whether social policy interventions are making a difference to people’s well-being (SIA, 2018[52]) – expanding its focus beyond its original goal of increasing fiscal returns from reducing long-term social benefit dependence (Acquah, 2018[105]). The Productivity Commission could similarly enhance its existing focus on maximising well-being through a multidimensional lens. Starting in 2009, New Zealand government agencies have appointed Chief Science Advisors and Chief Economists to help bring external capacity for evidence use into the heart of government. Sasse and Haddon (2018[111]) suggest that such Chief Advisors have an important role to play in generating more cross-government coordination in incorporating evidence into policy-making. For example, Chief Advisors can jointly identify priority research questions and work with academia to address these, or they can jointly review government’s use of tools for bringing insights from diverse academic disciplines into policy-making. Doing so could be supported by Treasury’s Community for Policy Research (New Zealand Treasury, 2017[68]).
Making a long-term commitment and embedding the approach in the machinery of government
At its heart, the move to adopt a well-being approach should simply be about supporting good policy advice: providing a clear structure under which it is easier to spell out the costs and benefits of policy action; quantify the trade-offs and synergies at work; and identify the population groups that might be differentially affected by different policy options. This needs to be supported by a strong evidence base, which in turn relies on well-being indicators collected with sufficient frequency, timeliness and granularity to meet the needs of policy makers.
Budgeting and regulatory impact assessments offer powerful levers to implement broader well-being frameworks. Well-being approaches have also been anchored in legislation to secure long-term commitment, as well as to garner cross-party political support. For example, laws such as the Scottish Community Empowerment Act 2015, the French 2015-411 law and the Italian Budget Law which entered into force in 2016, all place a duty on government to regularly report on a set of well-being indicators. In Wales, the Well-being of Future Generations Act 2015 (Welsh Government, 2015) requires all public bodies to place seven well-being goals at the centre of their decision-making. However, in all of these international examples, the intent has been to encourage policy-makers to consider a broader set of outcomes, rather than to require the use of a specific indicator set – thus allowing for priorities to shift as circumstances change. For example, Scottish Ministers have a duty to consult on, develop and publish a new set of National Outcomes for Scotland, and to review them at least every five years.
In New Zealand, the government is currently consulting on possible mechanisms to embed well-being in the Public Finance Act 1989 (New Zealand Treasury, 2018[113]). Currently proposed revisions would introduce requirements for the government of the day to set well-being objectives and report on these annually, while the Treasury would be required to report on current and future well-being every four years (Institute of Public Administration New Zealand, 2019[36]).
One challenge in using legislative processes is to ensure that they are backed up with real change in civil service and Parliamentary practice – which means focusing on the infrastructure and evidence base that supports implementation, as well as the capability-building needed to make it a reality. Making legislation flexible enough to accommodate new priorities, while at the same time purpose-driven enough to ensure that it has teeth, can be difficult. National accountability mechanisms can support this. For example, in Wales, implementation of the Future Generations Act is overseen by both the Auditor General and the Future Generations Commissioner, who monitors and reports the extent to which the different public bodies are setting and reaching their well-being objectives, and reviewing them accordingly. These structures were put in place partly in reaction to the closure of the wider United Kingdom Sustainable Development Commission in 2011; solidifying these monitoring roles in legislation was seen as a way to ensure their continued survival through changes of government (Wallace, 2019[114]).
In New Zealand, several other Commissioner roles already exist, whose responsibilities often have a strong bearing on well-being (e.g. the Parliamentary Commissioner for the Environment, Children’s Commissioner, Health and Disability Commissioner, Chief Human Rights Commissioner, Race Relations Commissioner and Equal Employment Opportunities Commissioner). A well-being Commissioner could be asked to adopt a cross-government coordination responsibility that would mirror the greater coordination expected across departments, as targeted by proposed revisions to the State Sector Act. The changes currently being explored as part of a fundamental review of the New Zealand Civil Service (State Services Commission, 2019[115]) should include critical capacity issues for delivering a well-being approach, including the need to develop expertise and evidence.
New Zealand is in a strong position to maintain momentum on well-being, but this will require continued investments, over time, in all four of the critical pillars needed to uphold it: the data and evidence base; the civil service capacity and policy tools; the political will and leadership; and the support of wider civil society. Any form of public sector innovation will also come with risks and resource costs that will need to be managed and mitigated. The New Zealand Treasury has positioned the Living Standards Framework as a tool developed by the Treasury and for the Treasury, rather than the whole of the public service. This is in keeping with the speed and manner in which it has developed over the past two years. Nevertheless, other government departments have been required to use the Living Standards Framework when preparing budget bids, and the consequences of Treasury tools are usually felt well beyond the Treasury. Developing a shared ownership would therefore be a valuable goal for its future development. This will require clear leadership and strong communication around the framework from the Treasury. In addition, although different government departments each have their own needs and audiences in terms of their well-being analysis and reporting, providing a more cross-government view on the broad framework and definition of well-being will be valuable for communicating with and engaging external audiences.
References
[105] Acquah, D. (2018), The Role of Evidence Informed Policy Making in Delivering in Performance: Country Case Studies in effective practice, OECD, Paris.
[67] Au, J. and G. Karacaoglu (2015), “Using the Living Standards Framework: Update and policy examples”, New Zealand Sociology, Vol. 30/No.3, pp. 27-40.
[119] Balestra, C. and L. Fleischer (2018), “Diversity statistics in the OECD: How do OECD countries collect data on ethnic, racial and indigenous identity?”, OECD Statistics Working Papers, No. 2018/09, OECD Publishing, Paris, https://dx.doi.org/10.1787/89bae654-en.
[80] Burton, T. et al. (2016), “The Benefits of Improved Social Sector Performance”, New Zealand Treasury, Wellington, https://treasury.govt.nz/sites/default/files/2016-11/ltfs-16-bg-bsipp.pdf.
[72] Burton, T., S. Morrissey and T. Ng (2018), “Using wellbeing statistics to improve how government and business interact”, in OECD and HEC-Paris SnO Centre (eds.), Compendium of Selected Papers on Measuring the Impacts of Business on Well-Being and Sustainability, OECD, Paris, http://www.oecd.org/statistics/Measuring-impacts-of-business-on-well-being.pdf.
[92] Clark, A. et al. (2018), The Origins of Happiness: The Science of Well-Being over the Life Course, Princeton University Press.
[44] De Smedt, M., E. Giovannini and W. Radermacher (2018), “Measuring sustainability”, in Stiglitz, J., J. Fitoussi and M. Durand (eds.), For Good Measure, OECD Publishing, Paris, https://doi.org/10.1787/9789264307278-11-en.
[82] Deighton-Smith, R., A. Erbacci and C. Kauffmann (2016), “Promoting inclusive growth through better regulation: The role of regulatory impact assessment”, OECD Regulatory Policy Working Papers, No. 3, OECD Publishing, Paris, https://dx.doi.org/10.1787/5jm3tqwqp1vj-en.
[66] Department of the Prime Minister and Cabinet (2019), Child poverty reduction and wellbeing legislation, https://dpmc.govt.nz/our-programmes/reducing-child-poverty/child-poverty-reduction-and-wellbeing-legislation (accessed on 14 April 2019).
[98] Department of the Prime Minister and Cabinet (2019), The Policy Project, https://dpmc.govt.nz/our-programmes/policy-project (accessed on 28 January 2019).
[65] Durand, M. and C. Exton (2019), “Adopting a well-being approach in central government: Policy mechanisms and practical tools”, in Global Happiness Policy Report 2019, Sustainable Development Solutions Network, New York, http://www.happinesscouncil.org.
[38] Exton, C. and M. Shinwell (2018), “Policy use of well-being metrics: Describing countries’ experiences”, OECD Statistics Working Papers, No. 2018/07, OECD Publishing, Paris, https://dx.doi.org/10.1787/d98eb8ed-en.
[6] Fleischer, L., M. Frieling and C. Exton (forthcoming), “Measuring New Zealand’s Well-Being (forthcoming companion paper)”, OECD Statistics Working Papers, OECD Publishing, Paris.
[47] Fleischer, L., C. Smith and C. Viac (2016), “A Review of General Social Surveys”, OECD Statistics Working Papers, No. 2016/9, OECD Publishing, Paris, https://dx.doi.org/10.1787/bb54d16f-en.
[75] France Stratégie (n.d.), Les nouveaux indicateurs de richesse (rapport du Gouvernement), https://www.strategie.gouv.fr/publications/indicateurs-de-richesse-rapport-gouvernement (accessed on 26 January 2019).
[58] Frieling, M. (2018), The Start of a Conversation on the Value of New Zealand’s Social Capital, http://www.treasury.govt.nz/publications/research-.
[110] Fry, J. and P. Wilson (2018), Better Lives: Migration, Wellbeing and New Zealand, Bridget Williams Books, Wellington, https://doi.org/10.7810/9781988533759.
[87] Fujiwara, D. and R. Campbell (2011), Valuation techniques for social cost-benefit analysis: Stated preference, revealed preference and subjective well-being approaches, a discussion of the current issues, HM Treasury and Department for Work and Pensions (United Kingdom).
[94] HM Treasury (2018), The Green Book: Central Government Guidance on Appraisal and Evaluation, https://www.gov.uk/government/publications/the-green-book-appraisal-and-evaluation-in-central-governent.
[36] Institute of Public Administration New Zealand (2019), Grant Robertson outlines a Wellbeing Approach - speech delivered 19 February 2019, https://ipanz.org.nz/Article?Action=View&Article_id=150163 (accessed on 14 April 2019).
[56] Janssen, J. (2018), The Start of a Conversation on the Value of New Zealand’s Financial/Physical Capital Living Standards Series: Discussion Paper 18/07, https://treasury.govt.nz/publications/dp/dp-18-07.
[73] Jeffrey, K. and J. Michaelson (2015), Five Headline Indicators of National Success: A Clearer Picture of How the UK is Performing, New Economics Foundation, London, https://neweconomics.org/uploads/files/1ff58cfc7d3f4b3fad_o4m6ynyiz.pdf.
[74] Kanbur, R., E. Patel and J. Stiglitz (2018), “Sustainable Development Goals and the measurement of economic and social progress”, in Stiglitz, J., J. Fitoussi and M. Durand (eds.), For Good Measure: Advancing Research on Well-being Metrics Beyond GDP, OECD Publishing, Paris, https://dx.doi.org/10.1787/9789264307278-4-en.
[55] King, A., G. Huseynli and N. Macgibbon (2018), Discussion Paper: Wellbeing Frameworks for the Treasury (18/01) - February 2018, http://www.treasury.govt.nz/publications/research-.
[90] Layard, R. (2016), “Measuring wellbeing and cost-effectiveness analysis: using subjective wellbeing – discussion paper”, Measuring Wellbeing Series, What Works Centre for Wellbeing, https://whatworkswellbeing.files.wordpress.com/2016/08/common-currency-measuring-wellbeing-series-1-dec-2016.pdf.
[19] May, S., J. Flockton and K. Kirkham (2016), PISA 2015: New Zealand Summary Report, https://www.educationcounts.govt.nz/publications/series/PISA/pisa-2015/pisa-2015-summary-report.
[34] Ministry for the Environment (2019), New Zealand’s Interactive Emissions Tracker, https://emissionstracker.mfe.govt.nz (accessed on 25 February 2019).
[31] Ministry for the Environment and Stats NZ (2018), New Zealand’s Environmental Reporting Series: Our air, http://www.mfe.govt.nz/more/environmental-reporting.
[54] Ministry for the Environment and Stats NZ (2015), Environment Aotearoa 2015. New Zealand’s Environmental Reporting Series, https://www.mfe.govt.nz/more/environmental-reporting.
[11] Ministry of Health (2019), Obesity Statistics, http://www.health.govt.nz/nz-health-statistics, Wellington: MoH.
[12] Ministry of Health (2017), Annual Data Explorer 2016/17, https://minhealthnz.shinyapps.io/nz-health-survey-2016-17-annual-data-explorer.
[8] Ministry of Health (2017), Health and Independence Report 2016, https://www.health.govt.nz/publication/health-and-independence-report-2016.
[15] Ministry of Social Development (2017), Household incomes in New Zealand: Trends in indicators of inequality and hardship 1982 to 2016, http://www.msd.govt.nz/about-msd-and-our-work/publications-resources/monitoring/household-incomes/.
[45] Ministry of Social Development (2011), The Social Report 2001, Ministry of Social Development, http://socialreport.msd.govt.nz/2001/introduction/introduction.shtml.
[59] Morrissey, S. (2018), The Start of a Conversation on the Value of New Zealand’s Human Capital, http://www.treasury.govt.nz/publications/research-policy/dp/2018/18-02.
[35] New Zealand Government (2018), Budget Policy Statement, Budget 2019, New Zealand Government, Wellington, https://www.budget.govt.nz/budget/2019/fiscal-strategy/bps2019.htm.
[2] New Zealand Government (2018), Our Plan, https://www.beehive.govt.nz/sites/default/files/2018-09/Our%20Plan.pdf.
[103] New Zealand Government Procurement (2018), Broader outcomes, https://www.procurement.govt.nz/broader-outcomes/ (accessed on 14 April 2019).
[95] New Zealand Institute of Economic Research (2018), Review of CBA advice to support budget initiatives The impact of CBAx and lessons for future budget processes NZIER report to the Treasury, https://treasury.govt.nz/sites/default/files/2018-09/nzier-cbax-report.pdf.
[79] New Zealand Parliament (2018), Child Poverty Reduction Bill, https://www.parliament.nz/en/pb/bills-and-laws/bills-proposed-laws/document/BILL_76267/child-poverty-reduction-bill.
[62] New Zealand Treasury (2018), Budget 2019: Guidance for Agencies, New Zealand Government, Wellington, https://treasury.govt.nz/publications/guide/budget-2019-guidance-agencies.
[113] New Zealand Treasury (2018), “Embedding Embedding wellbeing in the Public Finance Act 1989”, https://treasury.govt.nz/publications/consultation/embedding-wellbeing-public-finance-act-1989.
[39] New Zealand Treasury (2018), History of the LSF, https://treasury.govt.nz/information-and-services/nz-economy/living-standards/history-lsf.
[37] New Zealand Treasury (2018), Living Standards Framework: Introducing the Dashboard, https://treasury.govt.nz/publications/tp/living-standards-framework-introducing-dashboard.
[28] New Zealand Treasury (2018), “Our people - Multidimensional wellbeing in New Zealand”, New Zealand Treasury Analytical Papers, Vol. 18/04, https://treasury.govt.nz/publications/ap/ap-18-04.
[3] New Zealand Treasury (2018), Our People Our Country Our Future: Living Standards Framework Introducing the Dashboard, New Zealand Government, Wellington, https://treasury.govt.nz/publications/tp/living-standards-framework-introducing-dashboard.
[1] New Zealand Treasury (2018), The Living Standards Framework: Background and Future Work, New Zealand Government, Wellington, https://treasury.govt.nz/sites/default/files/2018-12/lsf-background-future-work.pdf.
[97] New Zealand Treasury (2018), The Treasury Annual Report 2017/18, New Zealand Government, Wellington, https://treasury.govt.nz/publications/annual-report/2018.
[68] New Zealand Treasury (2017), Community for Policy Research, https://treasury.govt.nz/sites/default/files/2017-12/community-for-policy-research.pdf.
[86] New Zealand Treasury (2017), Guidance Note: Best Practice Impact Analysis, New Zealand Government, Wellington, https://treasury.govt.nz/sites/default/files/2018-03/ia-bestprac-guidance-note.pdf.
[85] New Zealand Treasury (2017), Impact Analysis Requirements for Regulatory Proposals, https://treasury.govt.nz/information-and-services/regulation/impact-analysis-requirements-regulatory-proposals (accessed on 27 February 2019).
[49] New Zealand Treasury (2011), “Working Towards Higher Living Standards for New Zealanders - May 2011”, New Zealand Treasury Papers, Vol. 11/02, https://treasury.govt.nz/publications/tp/working-towards-higher-living-standards-new-zealanders-tp11-02.
[89] O’Donnell, G. et al. (2014), Wellbeing and Policy, The Legatum Institute.
[33] OECD (2019), “Air and climate: Greenhouse gas emissions by source”, OECD Environment Statistics (database), https://dx.doi.org/10.1787/data-00594-en (accessed on 19 April 2019).
[108] OECD (2019), How’s Life in the Digital Age?: Opportunities and Risks of the Digital Transformation for People’s Well-being, OECD Publishing, Paris, https://dx.doi.org/10.1787/9789264311800-en.
[27] OECD (2019), Linking Indigenous Communities to Regional Development (forthcoming report), OECD Publishing, Paris.
[14] OECD (2019), OECD Income Distribution Database, http://www.oecd.org/social/income-distribution-database.htm (accessed on 9 June 2019).
[100] OECD (2019), Productivity in Public Procurement: A Case Study of Finland, Measuring the Efficiency and Effectiveness of Public Procurement, OECD Publishing, Paris, http://www.oecd.org/gov/public-procurement/publications/productivity-public-procurement.pdf.
[101] OECD (2019), Public Procurement in Germany: Strategic Dimensions for Well-being and Growth, OECD Public Governance Reviews, OECD Publishing, Paris.
[10] OECD (2019), Suicide rates (indicator), https://dx.doi.org/10.1787/a82f3459-en (accessed on 19 April 2019).
[118] OECD (2018), Case Studies of RegWatchEurope Regulatory Oversight bodies and the European Union Regulatory Scrutiny Board, OECD Publishing, Paris, http://www.oecd.org/gov/regulatory-policy/regulatory-oversight-bodies-2018.htm.
[93] OECD (2018), Cost-Benefit Analysis and the Environment: Further Developments and Policy Use, OECD Publishing, Paris, https://dx.doi.org/10.1787/9789264085169-en.
[32] OECD (2018), Environmental Statistics Database, Exposure to PM2.5 in countries and regions., https://stats.oecd.org/index.aspx?queryid=72722.
[17] OECD (2018), OECD Family Database, http://www.oecd.org/els/family/database.htm (accessed on 19 May 2019).
[81] OECD (2018), OECD Regulatory Policy Outlook 2018, OECD Publishing, Paris, https://dx.doi.org/10.1787/9789264303072-en.
[104] OECD (2018), Opportunities for All: A Framework for Policy Action on Inclusive Growth, OECD Publishing, Paris, https://dx.doi.org/10.1787/9789264301665-en.
[4] OECD (2017), How’s Life? 2017: Measuring Well-being, OECD Publishing, Paris, https://dx.doi.org/10.1787/how_life-2017-en.
[7] OECD (2017), OECD Environmental Performance Reviews: New Zealand 2017, OECD Environmental Performance Reviews, OECD Publishing, Paris, https://dx.doi.org/10.1787/9789264268203-en.
[18] OECD (2017), OECD Family Database, http://www.oecd.org/els/family/database.htm (accessed on 6 March 2019).
[22] OECD (2017), “Online Data Annex: Current Well-Being”, in How’s Life? 2017: Measuring Well-being, OECD Publishing, Paris, https://dx.doi.org/10.1787/how_life-2017-53-en.
[20] OECD (2017), PISA 2015 Results (Volume III): Students’ Well-Being, PISA, OECD Publishing, Paris, https://dx.doi.org/10.1787/9789264273856-en.
[117] OECD (2016), OECD Regional Well-being, https://www.oecdregionalwellbeing.org/.
[83] OECD (2016), The Governance of Inclusive Growth, OECD Publishing, Paris, https://dx.doi.org/10.1787/9789264257993-en.
[43] OECD (2015), How’s Life? 2015: Measuring Well-being, OECD Publishing, Paris, https://dx.doi.org/10.1787/how_life-2015-en.
[84] OECD (2015), OECD Regulatory Policy Outlook 2015, OECD Publishing, Paris, https://dx.doi.org/10.1787/9789264238770-en.
[107] OECD (2015), Skills for Social Progress: The Power of Social and Emotional Skills, OECD Skills Studies, OECD Publishing, Paris, https://dx.doi.org/10.1787/9789264226159-en.
[64] OECD (2013), How’s Life? 2013: Measuring Well-being, OECD Publishing, Paris, https://dx.doi.org/10.1787/9789264201392-en.
[88] OECD (2013), OECD Guidelines on Measuring Subjective Well-being, OECD Publishing, Paris, https://dx.doi.org/10.1787/9789264191655-en.
[5] OECD (2011), How’s Life?: Measuring Well-being, OECD Publishing, Paris, https://dx.doi.org/10.1787/9789264121164-en.
[109] OECD (forthcoming), Climate Change Mitigation through a Well-being Lens, OECD Publishing, Paris.
[106] OECD (forthcoming) (n.d.), Building Capacity for Evidence Informed Policy Making: Lessons from country experiences, OECD Publishing, Paris.
[102] Office of the Minister for Economic Development (2018), Cabinet Paper: Enhancing the Effectiveness of Government Procurement Policy, https://www.mbie.govt.nz/dmsdocument/4302-cabinet-paper-enhancing-the-effectiveness-of-government-procurement-policy.
[77] ONS (2019), Beyond GDP: How ONS is developing wider measures of well-being, https://blog.ons.gov.uk/2019/02/04/beyond-gdp-how-ons-is-developing-wider-measures-of-well-being/.
[25] Reserve Bank of New Zealand (2019), Key household financial statistics - C21, https://www.rbnz.govt.nz/statistics/c21 (accessed on 6 March 2019).
[111] Sasse, T. and C. Haddon (2018), How government can work with academia, Institute for Government, London.
[76] Scott, R. and R. Boyd (2017), Interagency Performance Targets: A Case Study of New Zealand’s Results Programme, IBM Center for The Business of Government, Washington, DC, http://www.ssc.govt.nz/interagency-performance-targets-case-study-new-zealands-results-programme.
[52] SIA (2018), “Are we making a difference in the lives of New Zealanders - how will we know? A well-being measurement approach for investing for social well-being in New Zealand”, Social Investment Agency Working Paper, Vol. 0106, https://sia.govt.nz/assets/Uploads/Are-we-making-a-difference-in-the-lives-of-New-Zealanders-how-will-we-know.pdf.
[53] SIA (2018), “Measuring the well-being impacts of public policy: social housing”, Social Investment Agency Working Paper 0105, https://sia.govt.nz/assets/Uploads/Measuring-the-wellbeing-impacts-of-public-policy-social-housing.pdf.
[51] SIA (2018), Social Investment Agency, https://sia.govt.nz/.
[115] State Services Commission (2019), Transforming the State Sector, http://www.ssc.govt.nz/transforming-the-state-sector (accessed on 14 April 2019).
[13] Stats NZ (2019), Child poverty statistics: Year ended June 2018, https://www.stats.govt.nz/information-releases/child-poverty-statistics-year-ended-june-2018 (accessed on 19 May 2019).
[63] Stats NZ (2019), Indicators Aotearoa New Zealand – Ngā Tūtohu Aotearoa, https://www.stats.govt.nz/indicators-and-snapshots/indicators-aotearoa-new-zealand-nga-tutohu-aotearoa/ (accessed on 9 April 2019).
[16] Stats NZ (2019), Living in a crowded house: Exploring the ethnicity and well-being of people in crowded households, https://www.stats.govt.nz/reports/living-in-a-crowded-house-exploring-the-ethnicity-and-well-being-of-people-in-crowded-households (accessed on 11 April 2019).
[71] Stats NZ (2019), The Census Transformation Programme, https://www.stats.govt.nz/methods-and-standards/the-census-transformation-programme/ (accessed on 27 February 2019).
[69] Stats NZ (2018), 2018 Census data release delayed, https://www.stats.govt.nz/news/2018-census-data-release-delayed (accessed on 27 February 2019).
[70] Stats NZ (2018), Indicators Aotearoa New Zealand - measuring our wellbeing, https://www.stats.govt.nz/assets/Consultations/indicators-aotearoa-new-zealand-nga-tutohu-aotearoa-consultation/indicators-aotearoa-new-zealand-measuring-our-well-being.pdf.
[50] Stats NZ (2018), Integrated Data Infrastructure, https://www.stats.govt.nz/integrated-data/integrated-data-infrastructure/.
[26] Stats NZ (2018), OECD data request ’Unemployment rates’, provided on 22 November 2018.
[9] Stats NZ (2018), Serious injury outcome indicators: 2000–17, http://www.stats.govt.nz/information-releases/serious-injury-outcome-indicators-2000-17 (accessed on 26 February 2019).
[23] Stats NZ (2018), Wealth of top 20 percent rises by $394,000, http://www.stats.govt.nz/news/wealth-of-top-20-percent-rises-by-394000.
[29] Stats NZ (2017), National ethnic population projections: 2013 (base) – 2038 (update), http://archive.stats.govt.nz/browse_for_stats/population/estimates_and_projections/NationalEthnicPopulationProjections_HOTP2013-2038.aspx.
[46] Stats NZ (2017), New Zealand General Social Survey – information releases, http://archive.stats.govt.nz/browse_for_stats/people_and_communities/well-being/nzgss-info-releases.aspx.
[30] Stats NZ (2017), Wellbeing Statistics: 2016 (corrected tables), http://www.stats.govt.nz/information-releases/well-being-statistics-2016.
[24] Stats NZ (2016), Wealth patterns across ethnic groups in New Zealand, http://www.stats.govt.nz/reports/wealth-patterns-across-ethnic-groups-in-new-zealand.
[116] Stats NZ (2014), 2013 Census Quick Stats about culture and identity, http://archive.stats.govt.nz/Census/2013-census/profile-and-summary-reports/quickstats-culture-identity.aspx.
[48] Stats NZ (2011), Measuring New Zealand’s Progress Using a Sustainable Development Approach, http://archive.stats.govt.nz/browse_for_stats/snapshots-of-nz/Measuring-NZ-progress-sustainable-dev-%20approach.aspx.
[40] Stiglitz, J., A. Sen and J. Fitoussi (2009), Report by the Commission on the Measurement of Economic and Social Progress, http://ec.europa.eu/eurostat/documents/118025/118123/Fitoussi+Commission+report.
[61] Tavita, J. and Z. Levi-Teu (2018), Discussion Paper 18/09: A Pacific Perspective on the Living Standards Framework and Wellbeing, https://treasury.govt.nz/publications/dp/dp-18-09.
[21] TIMSS & PIRLS International Study Center (2016), TIMSS 2015 8th grade almanacs.
[41] UNECE (2013), Conference of European Statisticians Recommendations on Measuring Sustainable Development, United Nations, https://www.unece.org/publications/ces_sust_development.html.
[42] UNU-IHDP and UNEP (2014), Inclusive Wealth Report 2014. Measuring Progress towards Sustainability., http://www.ihdp.unu.edu/docs/Publications/Secretariat/Reports/SDMs/IWR_SDM_2014.pdf.
[57] Van Zyl, S. and J. Au (2018), The Start of a Conversation on the Value of New Zealand’s Natural Capital, http://www.treasury.govt.nz/publications/research-.
[114] Wallace, J. (2019), Wellbeing and Devolution Reframing the Role of Government in Scotland, Wales and Northern Ireland, Palgrave Macmillan, http://www.palgrave.com/gp/series/15247.
[99] Washington, S. and M. Mintrom (2018), “Strengthening policy capability: New Zealand’s Policy Project”, Policy Design and Practice, https://doi.org/10.1080/25741292.2018.1425086.
[78] Welsh Government (2018), Written Statement: Consultation on Milestones Under the Wellbeing of Future Generations Act (Wales) Act 2015, https://beta.gov.wales/written-statement-consultation-milestones-under-wellbeing-future-generations-act-wales-act-2015 (accessed on 13 February 2019).
[112] What Works Network (2018), The What Works Network - Five Years On, United Kingdom Government, London, https://www.gov.uk/government/publications/the-what-works-network-five-years-on.
[96] Whitby, A., C. Seaford and C. Berry (2014), BRAINPOoL Project Final Report: Beyond GDP - From Measurement to Politics and Policy, World Future Council, http://www.brainpoolproject.eu.
[91] Wright, L., T. Peasgood and S. MacLennan (2017), A Guide to Wellbeing Economic Evaluation, What Works Centre for Wellbeing, https://whatworkswellbeing.org/product/a-guide-to-wellbeing-economic-evaluation/.
[60] Yong, S. (2018), Discussion Paper 18/10: An Asian Perspective and the New Zealand Treasury Living Standards Framework - Dr Sue Yong, https://treasury.govt.nz/publications/dp/dp-18-10.
Notes
← 1. The Treasury’s Living Standards Framework draws on the OECD’s How’s Life? framework, but there are a number of differences in detail. In this paper, we refer to the How’s Life? assessment (OECD, 2017[4]) unless otherwise indicated.
← 2. This estimate is based on household survey data, which typically underestimate incomes at the top end of the distribution
← 3. Ethnic comparisons are complicated as ethnic groups have different demographic profiles (e.g. in terms of age structures) and geographical dispersions. Moreover, responses to ethnicity questions in surveys and censuses are fluid and groups are not mutually exclusive (almost half of Māori also identified with the NZ/European ethnic group in the 2013 Census (Stats NZ, 2014[116]) (Balestra and Fleischer, 2018[119]). Some of New Zealand’s notable regional differences in well-being outcomes, such as lower outcomes in Northland, intersect with ethnicity and access to public services, which further complicates the identification of driving factors (OECD, 2016[117]).
← 4. Approximate per capita response rates for public consultations that involved reactions of the public to a published proposal: 27 people/million in the UK in 2012 (1800 responses, 66 million inhabitants), 72 people/million in France in 2015 (4802 responses, 67 million inhabitants), 57 people/million in Wales in 2016 (171 responses, 3 million inhabitants), 112 people/million in New Zealand in 2018 (560 responses, 5 million inhabitants). Consultations are not directly comparable in terms of consultation time or quality of responses received.
← 5. Either a statistical office (e.g. in Australia, Austria, Israel, Korea, Finland), or a central government agency or Ministry (e.g. the German Federal Chancellery, the Australian Institute of Health and Welfare) usually leads this process, hosts and updates online databases, and publishes regular reports. “Lead body” refers to the main government entity responsible for developing and maintaining the well-being initiative, though several additional public bodies are often involved. In some cases, the centre of government kick-started processes by requesting the lead body to develop and publish indicators of well-being (e.g. in Israel, the United Kingdom and Italy).
← 6. Six indicators appear more than once in the Dashboard (for example, discrimination appears in both the “civic engagement and governance” dimension and the “social capital” dimension). The total of 55 indicators refers to unique indicators only (i.e. discrimination is counted only once).
← 7. The Millennium Ecosystem Assessment framework was used as a guide for the selection of natural capital indicators in the Dashboard, with the ecosystem services prioritised from a New Zealand perspective. Given New Zealand’s unique biodiversity and hydroelectricity characteristics, there are good grounds for some differences in approach compared to other OECD countries.
← 8. The planned Stats NZ IANZ data set is expected to cover a wide array of natural capital indicators, including both net and gross greenhouse gas emissions. However, many of the proposed IANZ natural capital measures are still in development, with no data currently available. This includes measures of waste flows in waterways and coastal marine environments, energy and material intensity, freshwater resources and water stress, and several aspects of biodiversity (Stats NZ, 2019[63]).
← 9. Under this set of methods, data on subjective well-being are either used to estimate monetary values for non-market factors (based on equivalent income) or are used as the common currency itself, so that policy options are examined as the monetary cost per unit of improvement in subjective well-being (a form of cost-effectiveness analysis).
← 10. For example, the EU Regulatory Scrutiny Board (RSB), established in 2015, reports directly to the European Commission President. Its role is to provide expert and arm’s length central quality control of draft RIAs prepared by all EC Directorates General, as well as of major evaluations. RIAs must receive a positive opinion from the Board before regulatory proposals are allowed to proceed, and the Board’s assessments are made publicly available. This type of “arm’s length” body also exists in the Czech Republic, Finland, Germany, the Netherlands, Norway, Sweden and the United Kingdom (OECD, 2018[118]).