3.2. Mobile connectivity
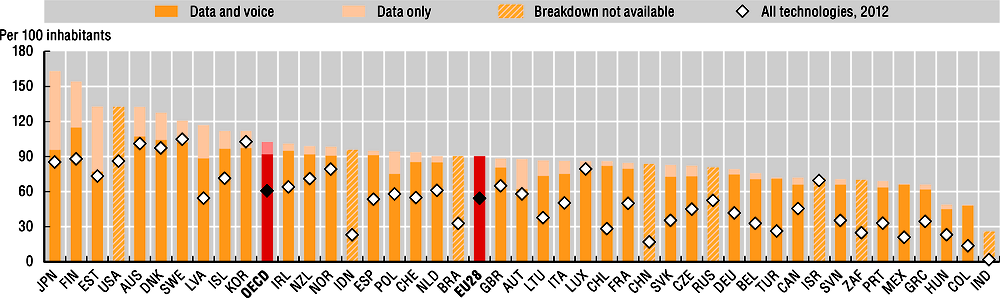
Growth in mobile broadband subscriptions has far outstripped fixed broadband growth since 2010, with worldwide subscriptions increasing from 825 million in 2010 to 4.6 billion in 2017 (ITU World Telecommunication/ICT Indicators Database), and now accounting for 82% of all broadband access paths in the world (77% in the OECD area). Mobile broadband take-up is much higher than fixed broadband take-up relative to population size, with around three subscriptions per two inhabitants in Japan and Finland, and an OECD average of one subscription per inhabitant. In all countries, the majority of subscriptions include both calls and data, though data-only subscriptions have over 40% market share in Estonia and Japan.
Increases in mobile broadband penetration can be rapid. Since 2010, China and India have experienced roughly 25-fold growth in mobile broadband subscriptions, while Mexico witnessed a 17-fold increase. In some countries the relatively limited availability and affordability of fixed broadband can be an important contributing factor to strong growth in mobile broadband subscriptions. For example, India saw more than 127 million additional subscriptions in 2017.
Mobile data usage is growing exponentially in some countries, particularly Finland, where almost 16 GB data were used each month per subscription on average in 2017. Use was above 6 GB monthly, and more than double the OECD average of 3 GB in Austria, Estonia, Latvia and Lithuania. In contrast, average usage remains below 1 GB monthly in Greece and the Slovak Republic. Between 2015 and 2017, average data usage more than doubled in two-thirds of countries and quintupled in Lithuania. Network capacity will need to continue to expand in order to meet the rapidly increasing demand for data.
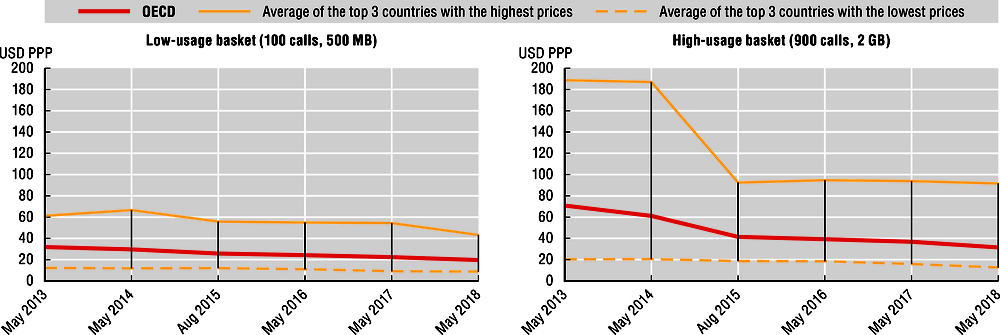
Prices for mobile broadband connectivity have fallen between 2013 and 2018, as shown by a comparison of average prices for specific OECD mobile broadband baskets representing “low usage” and “high usage”. Prices can also vary widely between countries, with the average for the three most costly countries being around five to seven times that of the three least costly countries in 2018.
These baskets provide a snapshot of the lowest-cost plans with the relevant data and call amounts for each period. Importantly, these statistics track available prices rather than customer uptake. Although a given basket may become available for a lower price, many users might be unable to take-up the offer due to contractual lock-in or may opt for more expensive packages with additional data, calls or ancillary services such as SMS and online content. However, an average for all OECD countries may nonetheless be considered as an indicator of general trends in these two segments of the market.
The number of mobile broadband subscriptions more than doubled between 2010 and 2017 – reaching more than one per OECD inhabitant for the first time.
Definitions
Mobile broadband penetration includes subscriptions to mobile-broadband networks that provide download speeds of at least 256 Kbps (e.g. using WCDMA, HSPA, CDMA2000 1x EV-DO, WiMAX IEEE 802.16e and LTE), and excludes subscriptions using only GPRS, EDGE or CDMA 1xRTT networks. Figures relate to the number of handset-based and computer-based (USB/dongles) mobile-broadband subscriptions to the public Internet that are regarded as active, based on either a recurring subscription fee for data/Internet access or the subscriber having accessed the Internet in the last three months.
High usage mobile broadband offers include 2 GB of download data and 900 minutes of voice calls. Low usage includes 500 MB of data and 100 minutes of calls.
Measurability
Mobile broadband subscriptions data, including data usage volumes, are typically supplied to the OECD or ITU by communications regulators that collect them directly from network operators according to common definitions. Data for wireless broadband subscriptions have improved greatly in recent years, especially with regard to the measurement of data only and data and voice mobile subscriptions. It is not currently possible to delineate business and consumer subscriptions, so both are counted. Even so, the data are typically presented in relation to the population of people in each country
OECD mobile broadband prices data are gathered directly from network operator websites. They cover at least the two largest mobile network operators, with a 50% or greater combined market share (by subscriber numbers). Offers include 3G and 4G mobile phone services, including post-paid, prepaid and SIM-only tariffs. Data and voice offers are treated separately from data only. Handsets are not included. Offers relate to month-to-month services advertised clearly on operator websites and should be available in the country’s largest city. For more information see the OECD Broadband Price Baskets Methodology (OECD, 2017). The ITU also collects prices for mobile broadband subscriptions from operator websites; focusing primarily on prepaid services that are popular in many non-OECD countries: https://www.itu.int/en/ITU-D/Statistics/Pages/definitions/pricemethodology.aspx.
Source: OECD, Broadband Portal, http://www.oecd.org/sti/broadband/broadband-statistics; ITU World Telecommunication/ICT Indicators Database, September 2018 and EU Digital Scoreboard 2017: Strengthening the European Digital Economy and Society.

Source: OECD, Broadband portal, http://www.oecd.org/sti/broadband/broadband-statistics, September 2018. See 1.
← 1. EU28 refers to the EEA (European Economic Area) and to Q2 2016 instead of 2015 and Q3 2017 instead of 2017. Data for Q2 2016 include the EU countries and Norway, but exclude Sweden and the United Kingdom. Data for Q3 2017 include EU countries and Norway.
For Switzerland, the 2017 data are based on OECD estimates.
Source: OECD calculations based on Strategy Analytics Ltc. Teligen Tariff & Benchmarking Market data using the OECD Methodology, https://www.strategyanalytics.com, June 2018.