copy the linklink copied!Chapter 3. The business environment for SMEs and entrepreneurship in Ireland
This chapter describes the main strengths and weaknesses of the business environment for SMEs and entrepreneurs in Ireland. It examines macro-economic conditions, labour market conditions, skills and the educational attainment, the tax environment affecting SMEs and entrepreneurs, the regulatory environment, access to finance conditions, infrastructure and energy, trade and foreign direct investment, and ends with a recap of the main recommendations in these areas.
Note by Turkey: The information in this document with reference to “Cyprus” relates to the southern part of the Island. There is no single authority representing both Turkish and Greek Cypriot people on the Island. Turkey recognises the Turkish Republic of Northern Cyprus (TRNC). Until a lasting and equitable solution is found within the context of the United Nations, Turkey shall preserve its position concerning the “Cyprus issue”.
Note by all the European Union Member States of the OECD and the European Union: The Republic of Cyprus is recognised by all members of the United Nations with the exception of Turkey. The information in this document relates to the area under the effective control of the Government of the Republic of Cyprus.
The statistical data for Israel are supplied by and under the responsibility of the relevant Israeli authorities. The use of such data by the OECD is without prejudice to the status of the Golan Heights, East Jerusalem and Israeli settlements in the West Bank under the terms of international law.
copy the linklink copied!Macro-economic conditions
Although the Irish economy was hit severely by the financial crisis, with GDP declining by almost 5% and 10% in 2008 and 2009 respectively, recovery has been sustained and Irish economic growth has outpaced the OECD and euro zone average in recent years. Average income in Ireland ranks at above the average of the OECD and income inequality, in stark contrast to many economies, has reduced.
This recovery is also reflected in government finances; the government deficit expanded to 32% of GDP in 2010, but dropped to almost zero in 2016. In a similar vein, the current account deficit turned into a surplus in 2013 and unemployment, having peaked in 2012, to a level of almost 15%, declined substantially to a level of 5.6% in 2017 (see Figure 3.1).
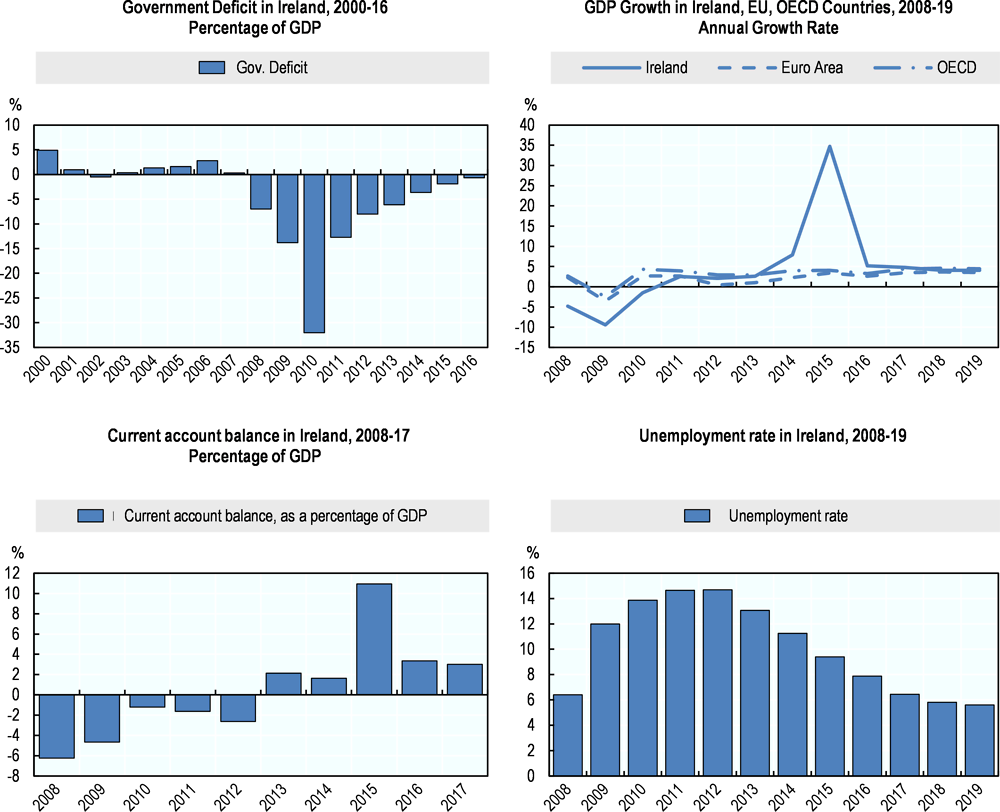
Note: 2015 data on GDP growth is excluded for Ireland due to changes in national accounting.
Source: (OECD, 2018[2]).
Nonetheless, some economic uncertainties remain. The planned departure of the United Kingdom from the European Union represents a key challenge for Ireland, given the strong economic links between the countries. As an illustration, 18% of all exports from Ireland are directed to the United Kingdom, with almost 3 400 companies exporting exclusively to the country, and 38% of the turnover of Irish-owned foreign affiliates was in the United Kingdom (Central Statistics Office, 2016).
“Brexit” will probably adversely affect Irish SMEs even where they have no direct link to the United Kingdom, for example through a decline in domestic demand and reduced consumer and investor confidence. A survey by the Department of Business, Enterprise and Innovation (DBEI) illustrated that 15% of all surveyed SMEs had been substantially impacted by Brexit in 2018 and another 37% moderately with many expecting a further impact in the near future (DBEI, 2018a).
The Irish economy is also vulnerable to the rising tide of protectionism. A recent study of 42 countries identified Ireland as the country whose economy has benefited the most from globalisation (and therefore has most to lose from protectionism) (Stiftung, 2018). Transatlantic trade tensions in particular could damage the Irish economy, as many American multinationals have their (European) headquarters based in Ireland.
A third risk for the Irish economy over the medium term is related to changes to the international tax environment. This could erode Ireland’s competitiveness and could possibly lead to a slowdown in foreign direct investment or even a potential exit of some large corporate groups that are resident in Ireland. The Irish Fiscal Advisory Council recently estimated the impact of a multinational moving headquarters out of Ireland. As a direct impact, this would reduce the estimated government revenues by over EUR 330 million, around 0.5% of total revenue in 2016, mostly through lower corporate taxation. It would also lower Gross Value Added by 1.9%, while the impact on employment and employee earnings would be more limited. The indirect impact is harder to measure, but could be considerably higher as spill-over effects to the wider economy are likely (Irish Fiscal Advisory Council, 2018a).
copy the linklink copied!The innovation system
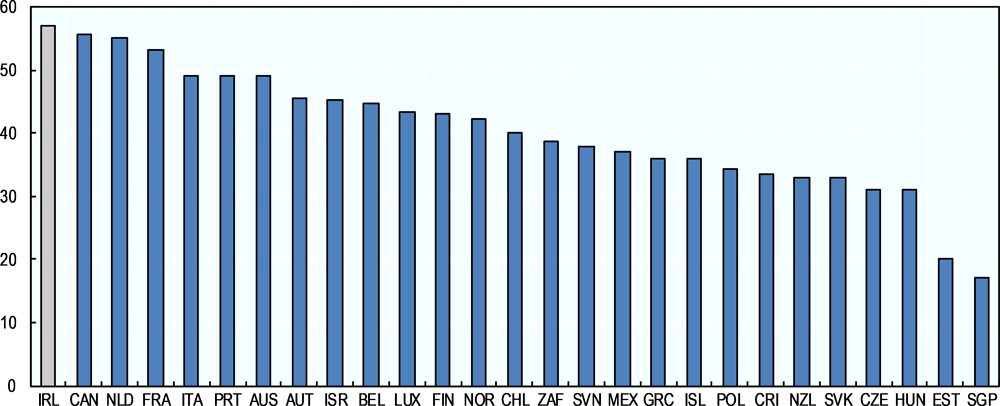
As discussed in Chapter 2, SME innovation performance is solid in Ireland. Some 40% of all SMEs in Ireland combine product or process innovation with marketing or organisational innovation strategies, the highest proportion among OECD countries (see Figure 3.2).
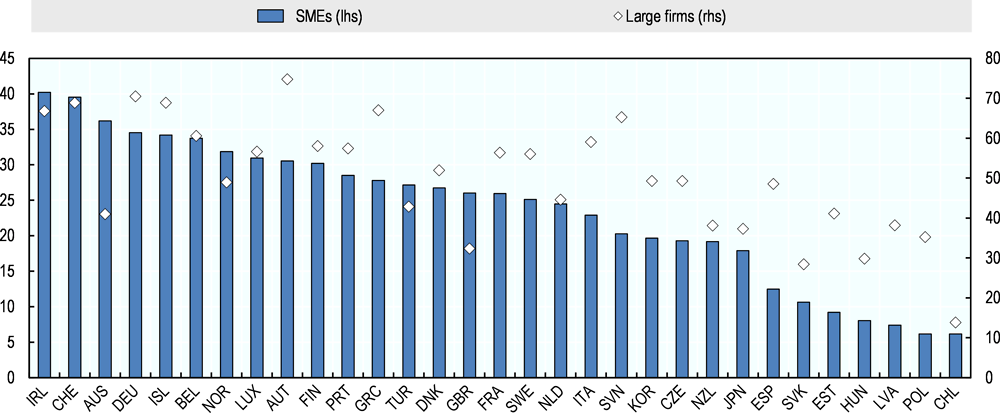
Note: The chart is based on national innovation surveys on “product or process” and “marketing or organisational” innovation strategies. The chart shows the share of firms adopting both types of innovation strategy.
Source: (Yin and Westmore, 2018).
This is supported by a strong innovation system overall. Ireland outperforms the EU average on most indicators identified by the European Innovation Scoreboard 2019. In addition, its performance has improved relative to that of the EU since 2011. Overall, Ireland is classified by the Scoreboard as a “Strong Innovator”, just below the “Innovation Leader” countries. As set out in Table 3.1, Ireland scored highly relative to the EU average in 2018 on the dimensions of human resources, attractive research systems, innovators, employment impacts and sales impacts. It performed less well in 2018 on the dimensions of finance and support, firm investments, linkages and intellectual assets.
One indicator on which Ireland scores relatively weakly is R&D expenditure by the public sector, which was scaled back in the aftermath of the financial crisis. Whereas in 2009, the government R&D budget (GRDB) amounted to 0.63% of GNP, this declined to 0.32% in 2017 and is estimated to have fallen to 0.30% in 2018 (according to provisional data) (DBEI, 2019). This is low by international standards; the average OECD country spent 0.51% of its GDP on GRDB in 2016, for example (DBEI, 2019). A related area for potential improvements is the low incidence of private co-funding of R&D expenditure, which is low by international standards, despite the relative innovativeness of SMEs in Ireland and the strong presence of multinational firms active in Ireland.
copy the linklink copied!Regulatory environment
Ease of doing business
Ireland is 23th on the worldwide “ease of doing business” ranking, conducted annually by the World Bank. Ireland scores particularly well in terms of starting a business, paying taxes and protecting minority investors. It is worth noting that, while this ranking is relevant for businesses of all sizes, a favourable regulatory environment is especially important for smaller enterprises, which have less resources at their disposal to deal with administrative burdens, red tape and regulatory complexities. Despite the strong overall performance, improvements are possible. The time and cost of enforcing contracts, for example, is well above the average in high-income countries. In addition, regulation relating to commercial property and legal services as well as the costs of business failure are high (see Table 3.2). As a minor source of concern, Ireland’s ranking dropped from 17 to 23 between 2017 and 2018, indicating more reform efforts from other top ranked countries.
Eegulatory impact assessments (RIA) are an important tool for identifying where new regulation could have adverse impacts on SMEs and remedying the main problems. Although RIAs are mandatory for all primary laws and major subordinate regulations in Ireland, there is a paucity of information on how many RIAs are actually conducted and their quality and implementation. In addition, Ireland has been slower than many other EU countries to introduce the so-called SME Test. This is under trial in Ireland as of the beginning of early 2019.
Stakeholder engagement
Ireland could strengthen its stakeholder engagement when designing regulation. The OECD has developed Indicators of Regulatory Policy and Governance (iREG), which comprise four key dimensions (methodology, oversight and quality control, systematic adoption and transparency). Ireland scores well below the OECD average in the area of stakeholder engagement in developing primary laws. Furthermore, Ireland ranks at the bottom of all OECD countries for stakeholder engagement in developing subordinate regulations, marking a deterioration compared to 2015 data (see Figure 3.3). The low score reflects that while draft primary laws are systematically subject to stakeholder engagement, consultation on draft subordinate regulation is not systematically undertaken. In addition and for both primary laws and subordinate regulation, stakeholder engagement is not systematically conducted at the early stage of the rule-making process, i.e. prior to a preferred solution being identified and/or a new or revised regulation being drafted, and there is no requirement to conduct consultation with the general public and there are no minimum consultation periods. Further, Ireland currently does not make use of interactive websites to engage with stakeholders, nor is it required to publish feedback on consultations. A evaluation of the current system and/or a performance reporting system could improve current consultation practices (OECD, 2018a).
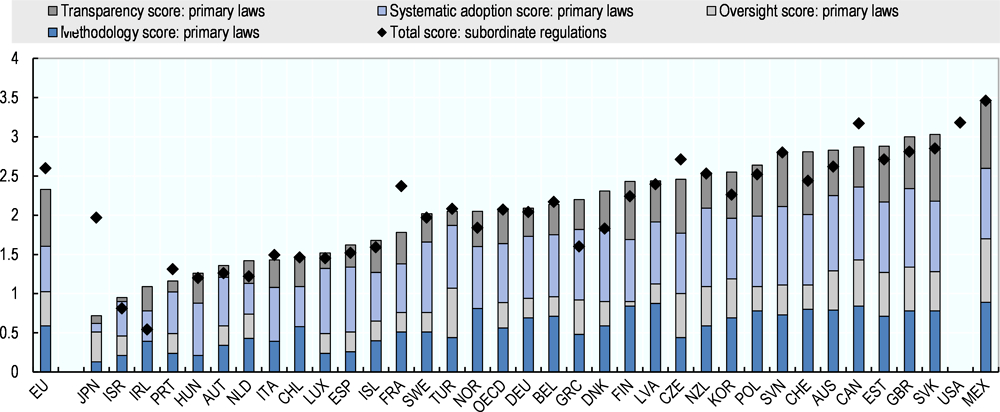
Note: Data for OECD countries is based on the 34 countries that were OECD members in 2014 and the European Union. Data on new OECD member and accession countries in 2017 includes Colombia, Costa Rica, Latvia and Lithuania. The more regulatory practices as advocated in the 2012 Recommendation a country has implemented, the higher its iREG score.
Source: (OECD, 2018a).
copy the linklink copied!Educational attainment and skills
Tertiary education
Ireland has a well-educated workforce. Comparative data illustrate that a high proportion of the population has completed tertiary education, while the share of the population with higher secondary education is about average (see Figure 3.4). The employment prospects and expected financial benefits from completing tertiary education are also higher than in most other European countries, suggesting that the education system provides skills that are relevant to the labour market (OECD, 2017a). The National Strategy for Higher Education to 2030 aims to make the higher educational system even more responsive to the business needs of Irish enterprises (OECD/EU, 2017).
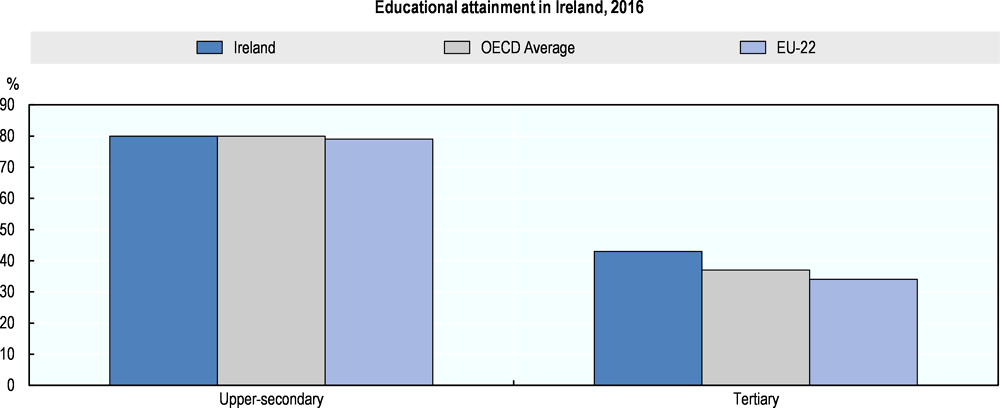
Note: EU-22 refers to EU 28 countries that are member states of the OECD.
Source: (OECD, 2017).
The OECD Programme for International Student Assessment (PISA) survey offers a comparative analysis of 15 year olds’ science, reading and mathematics skills and is widely perceived as a key indicator for a country’s education quality. The data illustrates that Ireland performs better than the OECD average on all three skill areas (OECD, 2016a) (see Figure 3.5).

Source: (OECD, 2016a).
In addition, 18% of new entrants to tertiary education in 2015 chose the fields of natural sciences, mathematics, statistics, and information and communication technologies (see Figure 3.6). This compares favourably to the average of 11% for the OECD (although engineering studies are relatively unpopular in Ireland) (OECD, 2017a).

Source: (OECD, 2017a).
In 2017, 13% of native-born Irish between the age of 15-29 were classified as NEETs, on par with the OECD average. The Irish-born NEET share is on a downward trend, after a surge in the aftermath of the financial crisis, up to a level of 22.4% in 2011. The NEET level among the foreign-born in Ireland lies below the OECD average (OECD, 2018b).
Dual training and apprenticeships
A 2017 OECD study illustrates that apprenticeships, defined as blending on and off-the-job learning, is an uncommon practice in Ireland (see Figure 3.7).
Boosting apprenticeships has some potential in Ireland. On the one side, it may prove an avenue for NEETs who are hard to reach through the traditional education system. In addition, the system may address labour shortages increasingly experienced by many Irish SMEs, given international evidence that smaller employers often make effective use of apprenticeships (Kuczera, 2017).
A national promotional campaign was launched in 2017 to stimulate apprenticeships, with the Apprenticeship Council, SOLAS, the HEA and other key stakeholders working in partnership and supported by a new website (www.apprenticeship.ie). It is too early to assess the impact of this approach. In addition, a new Retail Apprenticeship Scheme is being launched in 2019. It will be delivered through Retail Ireland Skillnet and will be the first sector based apprenticeship for the retail sector.
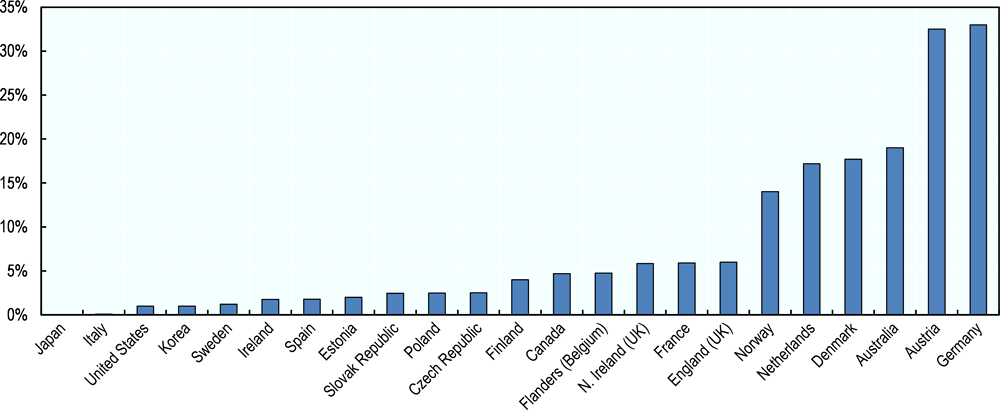
Note: In Ireland, Italy, Japan, Korea, Spain, Sweden and the United States the estimated share of current apprentices is not significantly different from zero.
Source: (Kuczera, 2017).
A key consideration given labour market tightness in Ireland is that small enterprises are not likely to engage in apprenticeships or related blended learning models if there is a high chance of their personnel being poached after training costs have been incurred. This implies a need for appropriate policy intervention to support training and reduce poaching. Possibly, the provision of training opportunities could even be employed as a tool to increase employee loyalty (Mühlemann, 2016).1 Several policy models can be employed in principle:
-
The introduction of training funds to which all employers contribute, but which are allocated to firms providing apprenticeships or training. These typically operate at the regional or sectorial level and are either run by governments or professional associations. The building sector in Germany and the construction sector in Austria are examples of this approach at the sectorial level. Switzerland has introduced a more general levy. Ireland established the National Training Fund (NTF) in 2000. The Government raised the levy from 0.7% to 0.8% in 2018 and plans a further increase by 0.1 percentage points in both 2019 and 2020 (Department of Education and Skills, 2018a).
-
Favouring the provision of public procurement contracts to firms that make of apprenticeship schemes, as in Switzerland.
-
Directly subsidising or reimbursing training costs as in Denmark, Finland or Norway. This could potentially be made conditional, for example, on targeting disadvantaged youths, or be made more attractive for small employers.
-
In a similar vein, tax incentives such as in Australia and France could be further explored in Ireland.2
In addition to the types of measures listed above, apprenticeship programmes benefit from more general policies, in particular support to public vocational schools and industry-specific training courses and measures to adapt apprenticeship programmes to the demands of the business community.3 Furthermore the take-up of apprenticeships by small employers can benefit from cooperation with associations and chambers of commerce to coordinate and encourage the development of apprenticeship programmes, promoting joint apprenticeships (as are relatively common in Austria and Germany), as well as from measures to limit and assist SMEs with the administrative procedures (Kuczera, 2017).
Life-long learning and adult skills
While Ireland performs well when it comes to skills of 15 year olds, the OECD Programme for the International Assessment of Adult Competencies (PIAAC) shows a different picture among Irish adults of working age (across the age group from 16 to 65). The data indicate that they consistently perform below the OECD average on three areas measured by this study, i.e. literacy, numeracy and problem solving (see Figure 3.8). These numbers are aggregates and hide significant heterogeneity. In particular, younger cohorts perform better compared to the OECD average, indicating improvements in the Irish education system in recent decades (OECD, 2018).
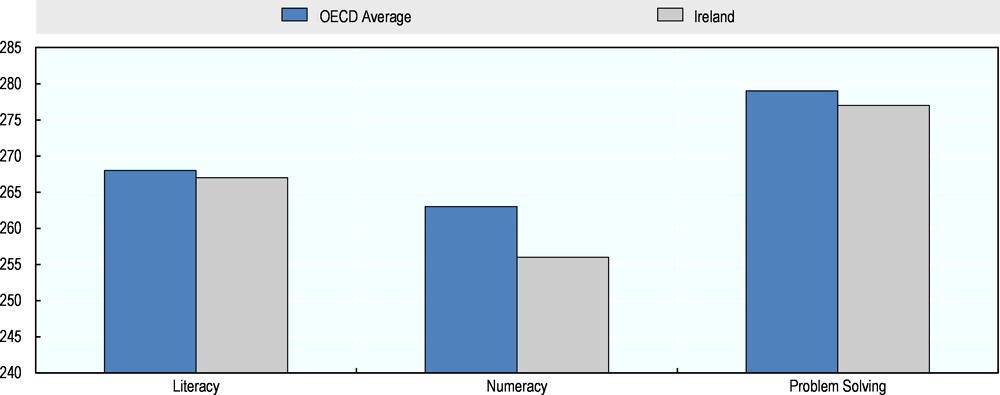
Source: (OECD, 2018).
Increasing adult participation in lifelong learning is an established policy priority in Ireland. The National Skills Strategy 2025 aims to increase the participation rate to 10% by 2020 and to 15% by 2025 and these targets are being pursued through the Action Plan for 2016-2019 and its annual implementation plans. Policies will focus on four areas:
-
Promotion and communication of the benefits of lifelong learning to the full population.
-
Improving the opportunities for education and training among the employed.
-
Developing greater recognition of workplace learning and capacity for recognition of prior learning.
-
Strengthening career guidance with the aid of employer engagement (Department of Education and Skills, 2016).
Ireland’s lifelong learning rate for adults 25-64 years old was 12.5% at the end of 2018, compared with an EU-28 average of 11.1%. This exceeds the participation rate objective set for 2020, but still needs to increase further to meet the 2025 target. According to SOLAS (2018), the participation rate of adults was 5% in formal learning activities and 9% in non-formal learning activities at the end of 2018. These participation rates have been increasing significantly and Ireland’s position has improved significantly compared to the the EU-28 average. The lifelong learning rates decline with age (see Figure 3.10) and are lower among adults with lower education attainment levels. To continue the increase in lifelong learning participation, efforts are needed to strengthen current initiatives (such as Springboard+ and EXPLORE)4 to support training and education among the employed, particularly in older employees.
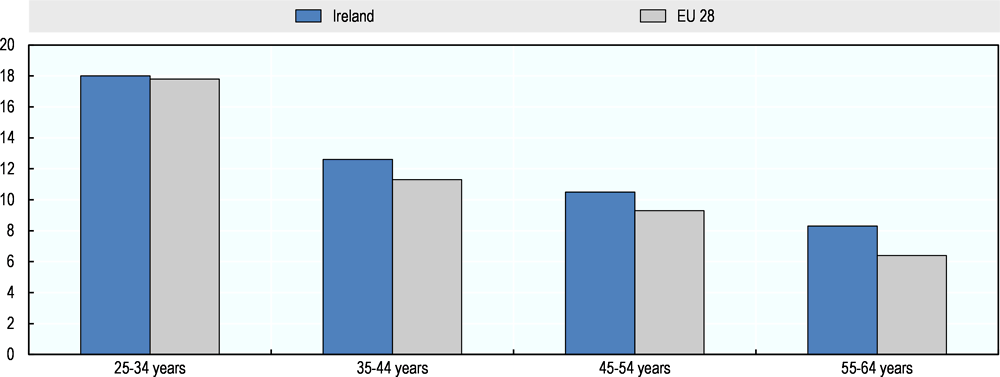
Source: Eurostat Adult Learning Statistics
Carefully monitoring progress on these fronts will be important in the years to come, especially considering the relatively low skill level of the adult population. Examples from leading countries, such as Switzerland (see Box 3.1), suggest that employer engagement is crucial in boosting lifelong learning activities. For this, employers need to be convinced that training and education is ultimately beneficial to their business (see Box 3.1).
The Further Education and Training (FET) sector in Ireland is in a period of transition. The first ever Further Education and Training (FET) Strategy 2014-2019 was published in May 2014. SOLAS (An tSeirbhís Oideachais Leanúnaigh agus Scileanna) is the new national Authority in this area, providing oversight and funding of the FET programmes, with 16 Educational and Training Boards established to replace 33 Vocational Education Committees.
One possible factor at play is the strong progressivity of the personal tax system in Ireland, which imposes high tax rates on average incomes. These high tax rates may discourage participation in lifelong learning activities for up-skilling and reduce the incentives to work longer and at a higher level (see below for more information about the personal tax system in Ireland).
In Switzerland, fully one-third of the surveyed population between the ages of 25 to 64 had participated in some kind of Continuing Education and Training (CET) in the preceding four weeks in 2017. This is the highest proportion among OECD member states and more than four times the share in Ireland.
About three-quarters of participants in training courses stated that they have been partly supported by their employer to take part in the training, and expenses borne by individuals are tax deductible. In addition, Swiss companies are required to contribute to a corresponding vocational and professional education and training levy, dependent on the economic sector they are active in, which is allocated to firms which provide training activities.
A crucial feature of the CET system in Switzerland is its responsiveness to market conditions. Business associations and professional organisations are closely involved with the training offering, as are regional governments (cantons). There is a wide spectrum of training programmes on offer with a large modularity allowing a large proportion of the working population to participate (such as courses on evenings, weekends, and so on).
A concern for Switzerland, common among high-income countries, relates to the tendency for the participants in CET to be weighted to young workers, highly-skilled workers and employees of large companies to take part in CET. Groups such as immigrants or the low skilled are considerably less likely to participate, even though they arguably may benefit most from lifelong learning (Vujanovic and Lewis, 2017[22]).
Entrepreneurial and management skills and education
Entrepreneurship education is relatively well developed in Ireland
Higher education in Ireland plays an important role in encouraging entrepreneurship, and this represents another area where Ireland performs well in an international context. Entrepreneurship education is offered across the sector in various disciplines. Course modules and programmes have been introduced in business schools to develop entrepreneurial mindsets and behaviours and have been adopted in an increasing number of disciplines and higher education institutions (HEIs). University College Cork, for example, has developed a cohesive approach to entrepreneurship for postgraduate levels, spearheaded by IGNITE, a one-year programme offering a wide range of support for students of different fields of study to set up their own businesses.
Programmes to integrate entrepreneurship in the curriculum are increasingly being assessed for their impact and are widely backed by senior management in education institutions. This is evidenced, for example, by the introduction of awards for entrepreneurial activities in HEIs and the drive in many HEIs to broaden entrepreneurship education beyond business and commerce to increasingly emphasise creativity and innovation (OECD/EU, 2017).
The evidence base on managerial skills is weak
In addition, several actors such as Local Enterprise Offices and Enterprise Ireland offer training and support to strengthen managerial skills. The education and training system also provides courses in this areas, including through the Springboard+ and Skillnet Ireland programmes. However, despite the importance the Irish Government attaches to entrepreneurial and managerial skills, there is a paucity of evidenceon the impact of government intervention in this area and areas requiring policy improvement. While managerial skills are inherently hard to measure objectively and likely to evolve only slowly over time, some countries have developed frameworks that can provide guidance to policy makers on designing programmes for managerial skills development. Box 3.2 provides more information on how management and leadership skills are measured in the United Kingdom as an input into policy design.
A 2012 study on leadership and management capabilities in the United Kingdom (BIS, 2012[23]) provides information on business management skills which can be compared with other countries. Key findings include:
-
43% of managers assessed their line management as ineffective.
-
The ineffective management in many businesses cost as much as GBP 19 billion in lost working hours on an annual basis and was responsible for more than half of business failures.
-
The management and leadership deficit compared unfavourably with Japan, Germany and the United States, and explained part of the productivity gap with these countries.
-
The adoption of best management practices would considerably boost the performance of many small businesses.
Much of the information about managerial and leadership practices from this study came from the “Learning and Talent Development Survey” which ran annually from 1998 to 2015.
A 2015 report, based on a one-off survey of around 2 500 businesses active in the United Kingdom, re-assessed the same issue. Its main conclusion was that the adoption of good management practices was very uneven, with a long tail of SMEs lagging behind, often far behind, and that this considerably impacted on the performance of these firms (BIS, 2015[24]).
Skills shortages
An annual survey of employers of all sizes by Manpower (a human resources company) found that very few surveyed companies in Ireland encountered major difficulties in recruiting personnel during the height of the global financial crisis period. While close to one in three firms reported difficulties filling jobs in 2006, this share dropped to 2% in 2012. As the economy, and the labour market, recovered, the proportion of companies with recruitment difficulties again started to increase to 20% in 2016 and 18% in 2018 (see Figure 3.10).
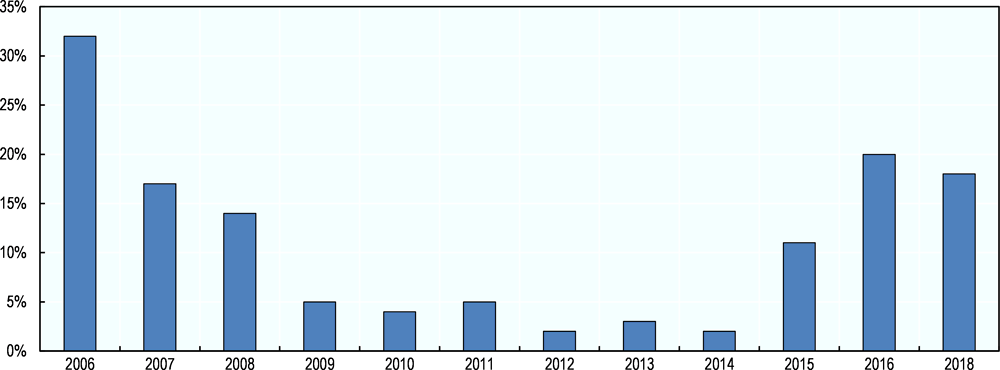
Note: 2017 data are not available.
Source: ManpowerGroup 2018 Talent Shortage Survey.
Although these percentages are still low by international comparisons, labour and skills shortages are very likely to intensify as the Irish economy nears full employment. The ability to attract and retain talented individuals increasingly represents a key challenge. This holds especially true for SMEs that compete for talent with larger and multinational companies, as for example evidenced from consultations with Enterprise Ireland clients. For example, a survey of the EOY Alumni community found that 57% of respondents faced difficulties in recruiting experienced hires over the past 12 months and 48% reported that they struggle to compete against large multinationals.
The 2018 National Skills Bulletin points to an increase in the number of mentions of difficult-to-fill (DTF) vacancies. The report states that “although professional occupations (mostly IT programmers, but also for engineers, accountants, doctors etc.) account for the majority of all DTF mentions, there were also frequent mentions across all occupational groups, particularly for technician posts, multilingual sales and customer care” (Mcnaboe et al., 2018).
The progressivity of the Irish personal taxation system and the high rates of marginal taxation of employee income at higher skills levels represents a competitive disadvantage compared to many other countries with similar skills shortages, however. Ireland therefore introduced the “Special Assignee Relief Programme” (SARP) in 2014, providing a tax relief for personnel earning at least EUR 75 000 as a base salary who have not been tax resident in Ireland for the 5 tax years preceding the year of arrival. This can ease recruitment of highly skilled workers from abroad. On the other hand, the scheme is limited to assignees or intra group transfers, and not applicable for Irish SMEs that do not have direct investments in other countries for that reason.
To support SMEs to attract highly skilled labour from abroad, the Irish Government could change the eligibility requirements of SARP to make it more relevant for smaller businesses, or introduce a tax relief scheme specific to SMEs recruiting non-nationals. Data from KMPG, an accounting firm, indicates that these schemes are fairly common in Europe. Eligibility criteria could be tweaked to minimise deadweight losses and ensure a targeting of high-skilled foreign talent. For example, monthly earnings might have to surpass a minimum and/or the tax relief could be limited to individuals with certain identifiable skills, for example the scheme could be limited to the Highly Skilled Eligible Occupations List (HSEOL) in Ireland.
copy the linklink copied!Infrastructure and energy
Physical infrastructure
Irish investments in infrastructure decreased severely during the financial crisis. Lower capital investments were primarily driven by large scale government expenditure cuts designed as belt-tightening measures. Prior to 2010, Ireland exceeded the EU-average in gross fixed capital formation but has lagged in this regard over the past 7-8 years. In 2017, Ireland invested only 1.9% of its GDP in fixed capital formation compared to the EU-28 average of 2.7% (see Figure 3.11). Infrastructure investment thus has not yet recovered following the crisis.
Boosting investments in physical infrastructure could yield positive effects on productivity and economic efficiency including for SMEs (Construction Industry Federation, 2017). For example, the World Economic Forum Executive Opinion Survey in 2016 indicated that the quality of Ireland’s transport infrastructure was sub-par in comparison to that of other OECD countries posing a severe constraint on the efficiency of seven supply chains and local firms’ abilities to maximise the value of participating in global value chains (OECD, 2018d). As another example, Dublin is one of the most traffic congested cities in Europe, while journey times in cities such as Cork and Limerick have increased in recent years as well, detracting from the attractiveness of these cities as an investment location (National Competitiveness Council, 2018a).
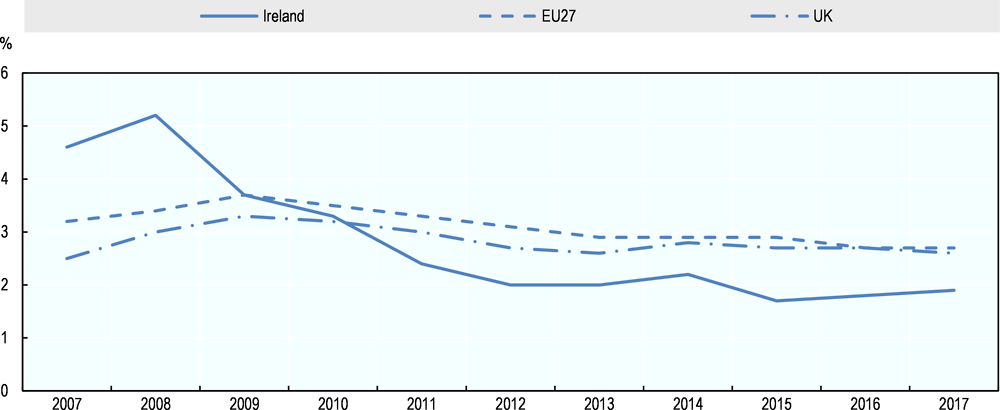
Source: (European Commission, 2018
The National Development Plan 2018-27 recognises the importance of physical infrastructure for the competitiveness of Irish businesses and for economic development more generally. In order to meet Ireland’s infrastructure and investment needs, the government has committed to invest an estimated EUR 116 billion over the 2018-27 period.
ICT infrastructure
Although Ireland ranks behind several top performing countries, it generally performs well with regards to business’ access to broadband. Overall, in 2016, as shown in Figure 3.12, 97.5% of all enterprises in Ireland had access to broadband; with 97.4% of smaller enterprises (10-49%), 98.3% of medium enterprises (50-249 employees) and 98.2% of larger enterprises (250+ employees) benefitting from broadband connectivity(OECD, 2017b). Next Generation Access (NGA Broadband), which is an indicator of high-quality, upgraded ICT infrastructure, is above average in Ireland, reaching 81.6% of Irish households compared to the 75.9% average across the EU (European Commission, 2017).
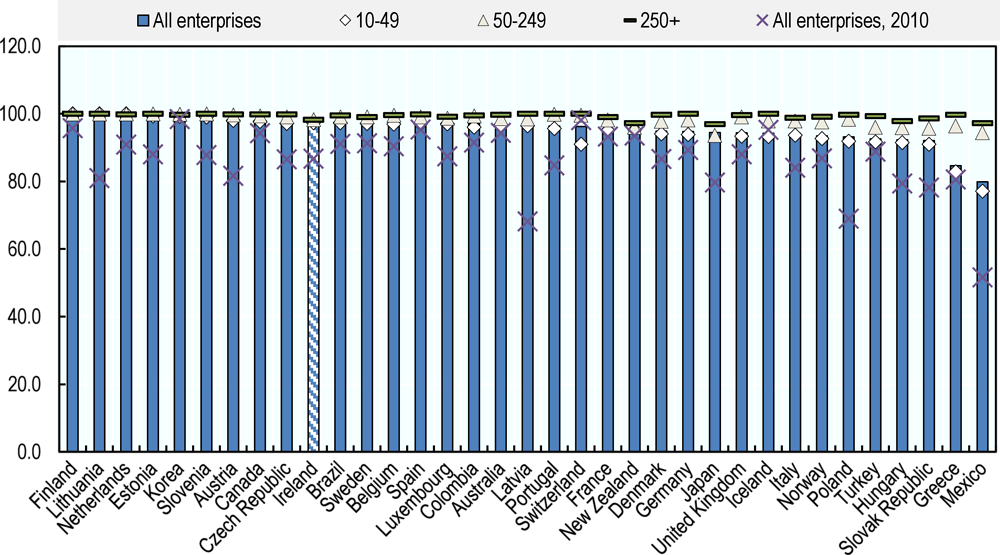
Source: (OECD, 2017).
Although broadband coverage is high, adoption rates have been sub-par. For example, in the second quarter of 2017, fixed broadband subscriptions were 29.44 per 100 people compared to the OECD average of 30.60 per 100 people. Although also slightly below the OECD average, mobile subscriptions have experienced tremendous growth in the last four years, helped by the government’s commitment to increasing broadband access throughout the country (OECD, 2017c). Price developments may also have played a role. Comparative data illustrate that business mobile broadband is much cheaper in Ireland than in Denmark, Germany, the Netherlands and Spain, and only slightly more expensive than in the United Kingdom, while the price for a business fixed broadband subscription is relatively high in comparison (National Competitiveness Council, 2018a). Moreover, while broadband connection is generally available, it sometimes represents a key hurdle for SMEs in remote and rural areas to adopt productivity-enhancing digital solutions (see Chapter 6).
Energy costs
In 2017, Ireland ranked among the top ten most expensive countries within the European Union in terms of electricity prices for business consumers at lower consumption bands, where SMEs are most prevalent. More specifically, Ireland ranked as the 7th most expensive country in terms of electricity for businesses consuming less than 20 MWh annually. As shown in Table 3.3, although mitigated to a certain extent by favourable tax policies, the basic cost of electricity in Ireland is high among EU countries, second only to Cyprus and Malta (Sustainable Energy Authority of Ireland, 2017).
High electricity costs in Ireland are primarily a function of external factors (namely Ireland’s dependence on imported fuel) as well as a general lack of industry competition and unbundling due to significant government interests in large electricity firms including the ESB group and EirGrid. Between 2010 and 2015, electricity prices for Irish SMEs increased 20% and remained high, accounting for on average 9% of non-wage costs (National Competitiveness Council, 2016). Since 2015, electricity prices have decreased but continue to remain expensive compared to most other countries in the EU (National Competitiveness Council, 2017a). Reducing the cost of electricity would free up cash flow within SMEs for more productive/innovative uses and ultimately increase profit margins, incentivising more interest in entrepreneurship.
Property prices
Following the recession between 2007 and 2013, housing prices in Ireland decreased by more than 50%. During the same period, new housing supply contracted by an estimated 90%. Since then, home prices in Ireland have risen dramatically by around 50% between 2013 and 2017, more than in any other OECD country. The recent surge in housing prices largely reflects the recovery from crisis-period prices. Taking 2000 as a benchmark year, housing prices in Ireland are not out of line with most other EU or OECD countries, although price developments have been very volatile. If prices continue to rise as in recent years, as seems likely, this could adversely affect productivity and economic growth, especially in urban centres (OECD, 2018d).
Although demand for housing has recovered following the crisis, housing supply has not recovered to the same extent, which has resulted in a housing shortage that has exacerbated homelessness levels and inflated the real prices of homes. These effects have been strong in Dublin as shown in Figure 3.13. The shortage of homes renders housing unaffordable and discourages professionals or aspiring entrepreneurs from relocating to potentially high growth areas, like Dublin. As such, increasing the housing supply should be prioritised. The establishment of the Local Infrastructure Housing Activation Fund in 2017 is a good example of a long-term policy solution to address the housing shortage. Other initiatives should seek to streamline administrative processes related to construction and lower construction costs, which remain high in Ireland compared to other countries (OECD, 2018d).
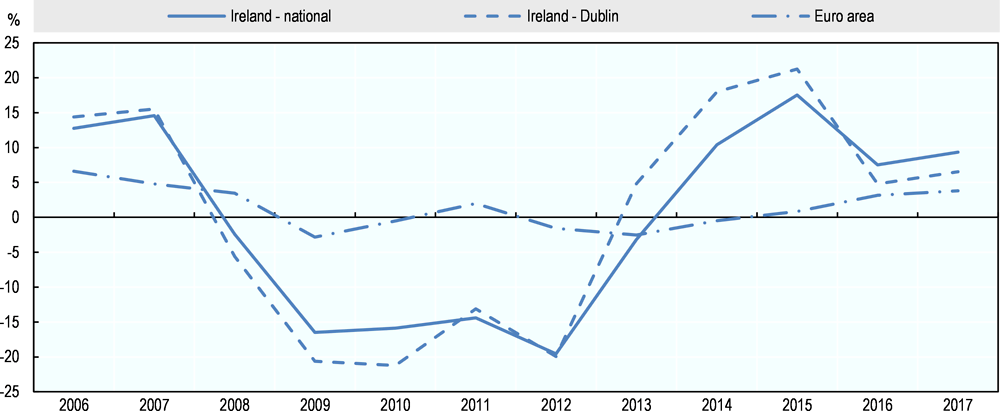
Source: (OECD, 2018[3]).
copy the linklink copied!Taxation affecting SMEs and entrepreneurship
Corporate taxation
A primary feature of the Irish tax regime for businesses is the single 12.5% corporate tax rate for active trading companies. That is lower than in any other OECD country except Hungary (see Figure 3.14). An economic impact assessment indicates that this low base rate plays an important role in Ireland’s success in attracting investments from multinational companies. A considerable increase in the statutory rate would likely reduce FDI significantly (Department of Finance, 2014).
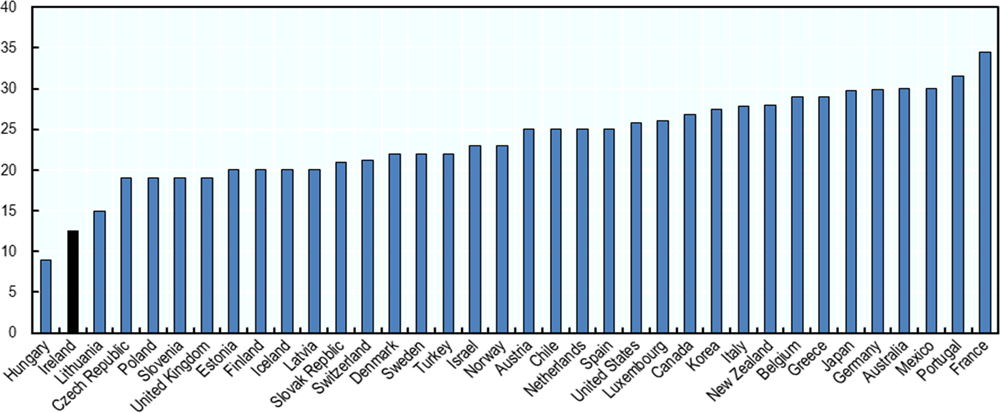
Source: (OECD, 2018e).
A discussion of other features of Ireland’s tax regime has to take the very low corporate tax rate into account. Recommendations to decrease other taxes paid by businesses should therefore be made with caution, both keeping in mind equity considerations and because reducing business taxes further may have relatively small impacts on business decisions.
Personal income tax
Personal income taxes are highly progressive in Ireland
Ireland has the most progressive personal income tax of all OECD member states bar Israel when measuring progressivity by comparing the tax due by a person on 167% of the average wage with the tax payable at 67% of the average wage (www.taxinstitute.ie, 2016). The top personal income tax (PIT) tax rate in Ireland stands at 22.5% for employees earning EUR 18 000 and 28.75% for employees earning EUR 25 000 on an annual basis. The top tax rate jumps to a level of 48.75 at an income of EUR 50 000, which is just below the average industrial earnings in Ireland.
Income taxes are almost zero in Ireland for very low incomes and Irish income tax base is relatively narrow in an international context, exempting a relatively large proportion of earnings from tax liability. However, marginal tax rates jump to high levels at relatively low wages by international comparison. The very high marginal income tax rate at a relatively low point in the income distribution marks the country as an outlier within the EU and OECD (O’connor, Hynes and Haugh, 2016), (McQuade, Riscado and Santacroce, 2017). In addition, employees pay the so-called Universal Social Charge (USC), an individualised tax charged on gross income topping at 8% at a wage of EUR 70 044, which has a very broad tax base, and a social security tax (PRSI), at 4% for most employees. Overall, combined taxation rates for individuals are 28.5% for earnings above EUR 30 000, 48.5% for incomes above EUR 50 000 and 52% for incomes above EUR 70 044.
This progressivity and prevalence of exemptions serves a purpose. In 2013, the Gini coefficient, a common aggregate measure of income inequality5, stood at 0.58 before taxes and transfers, and fell to 0.31 after taxes and transfers are included. This is the largest reduction between Gini coefficients before and after taxes and transfers among OECD countries, reflecting the redistributive nature of the Irish tax and transfer system (OECD, 2017d).
The high marginal income tax rates kicking in at relatively modest wages, could act as a disincentive to individuals to invest in human capital or set up and expand a business, however. A related issue is that Ireland has the highest combined top statutory tax rate on dividends among 25 OECD countries for which data are available, largely because of its personal tax regime (as dividends are typically taxed first as corporate income and then taxed again as personal income), which likely holds back corporate investments and economic growth (Dackehag and Hansson, n.d.[4]) (Alstadsæter, Jacob and Michaely, 2017[5]). Figure 3.15 illustrates.
Note: The unweighted mean includes the tax rate on new equity in Italy and the tax rate on new equity in Turkey and does not include the tax rates on existing equity. If the combined tax rate on existing equity in Italy and in Turkey were used instead of new equity, the unweighted average combined rate would be 41.6%.
Source: : (Harding and Marten, 2018a).
A simulation by the Department of Finance and the OECD suggests that the current tax system indeed represents a drag on economic growth, and that a shift from income taxes to property taxes would boost growth and employment. In addition, this reform could be achieved in a budget-neutral manner without undermining the income distribution (O’connor, Hynes and Haugh, 2016). The Irish Government could therefore consider lowering the marginal income tax rate, especially for mid-income earners.
In addition, Ireland could consider specific measures to attract foreign talent, in light of increasing skills shortages and its current income tax regime. Ireland’s Special Assignee Relief Programme (SARP) allows a discounted income tax rate for certain talent attracted from outside Ireland. However, SARP is only available for employees who have already previously worked for the hiring employer for a minimum period of 6 months in another country. This condition renders most SMEs, which typically do not employ personnel outside of Ireland, ineligible for the relief.
Standard capital gains tax
At 33%, Irish companies pay a high shareholder tax rate. Overall taxes payable on capital gains on long-held shares at the corporate and the personal levels total 41.4% in Ireland, higher than the OECD mean of 35.4% (in July 2016), despite the low income tax rate in Ireland (Harding and Marten, 2018a). This may be a disincentive to investment in enterprises.
There are exceptions from the full capital gains tax (CGT) in Ireland, especially for small enterprises. The “revised entrepreneur relief” lowers the rate to 10%. In order to be eligible, the beneficiary must hold at least 5% of the company’s shares, must have held them for three out of the five years immediately before disposal and must have worked as a “full-time” director or employee in the business, i.e. spent at least 50% of his/her time working for the company, continuously for three out of the past five years (www.taxinstitute.ie, 2016). The revised entrepreneur relief tends to favour outright sales of businesses, rather than facilitating entrepreneurs to dispose of a part of their holding (through share buyback for instance) without a high tax cost, which would then allow the entrepreneur to reap some financial reward from their investment mid cycle while staying with the business.
Importantly, the aim of the scheme is to encourage owners and entrepreneurs, not third-party investors such as business angels who cannot benefit from the relief, in contrast to a similar relief scheme in the United Kingdom, for example. On the other hand, a Section 626B exemption from CGT does facilitate certain holding companies to dispose of trading companies in a tax efficient manner, which can assist entrepreneurs to reinvest the proceeds of the sale of shares in companies.
Adjusting the revised entrepreneur relief to facilitate business angel investment could have a positive impact on productivity, given the well-documented benefits of angel investing on investee companies and on the general business population through potential spill-over effects (OECD, 2016b). It seems especially relevant in the Irish context, given its strong reliance on straight debt for its external finance options, and the relatively low take-up of external equity by SMEs. More activity from outside investors would also, at least to some extent address the so-called investment gap (Lawless, O’Toole and Slaymaker, 2018).
Compliance costs
Ireland ranks 4th worldwide on the annual the “Paying taxes” indicator by the World Bank. A “representative” Irish business has to make 9 payments per year for tax-related purposes and spend 88 hours to be tax-compliant on average. This compared favourably with the OECD average, which stands at 10.9 payments and 160.7 hours respectively (World Bank, 2019).
copy the linklink copied!SME access to finance
Bank credit
Access to bank credit has not fully recovered from the financial crisis
Irish banks were hit hard by the financial crisis, the government injecting fresh capital of EUR 64 billion (around 40% of GDP) to stabilise the sector between 2008 and 2010. The financial turmoil had a marked impact on SME lending, which declined by 23% between March 2010 and March 2015.
Although the situation has markedly improved, the financial crisis still leaves a mark on the SME financing landscape. For instance, the banking sector is still grappling with a high share of non-performing loans (NPLs). Although NPLs have come down significantly since 2013 when they were among the highest in the euro zone area, they still remain high, especially for loans to SMEs. While in 2014, more than half of SME loans within Irish retail banks were non-performing, this proportion lowered to around one-fourth in the third quarter of 2017 (Donnery et al., 2018). The share of SME lending in total business loans also fell from 87% in 2010 to 67% in 2016; and the interest rate spread between SMEs and large firms increased from 1.02 percentage points in 2010 to 2.47 percentage points in 2016 (OECD, 2018d).
Three large banks dominate the SME market in Ireland, accounting for around 95% of the market. Data from the Central Bank of Ireland shows that the non-retail SME lending market has become more concentrated since 2010, in part because some financial institutions exited from the Irish SME market in the aftermath of the financial crisis and have not returned since (Central Bank of Ireland, 2018).
Irish SMEs pay high interest rates.
Interest rates in Ireland remain well above the euro zone average. As Figure 3.16 illustrates, the average interest charged to SMEs was broadly in line with the euro zone average over the 2007-14 period, but then diverged. In most euro zone countries, SME interest rates declined considerably since 2014 to an average of 2.07% in May 2018. In Ireland, by contrast, interest rates do not show a clear pattern of change between 2014 and Q1 2018 and in May 2018 stood at 4%. The interest rate spread between loans charged to large enterprises and the SMEs also widened in Ireland since 2014, in contrast to developments in most other euro zone countries. This suggests that banks consider SMEs as particularly costly and/or risky to service in Ireland.

Note: SME loans interest rates refer to interest rates on bank loans to corporations of under EUR 1 million with floating rate and IRF up to three months. Interest rate spread refers to the difference between interest rates for SMEs and large businesses. Interest rates for large businesses refer to interest rates on bank loans to corporations of over EUR 1 million with floating rates and an IRF of up to three months.
Source: (ECB, 2018).
Demand for credit remains subdued
SMEs appear in general to be much more reluctant to take out loans than they were in the recent past. Half of all Irish SMEs did not hold any debt in the period from March to September 2017, twice as many as in September 2013. The number of Irish SMEs with debt levels higher than turnover decreased from 7.8% to 2.9% over the same period. Changing attitudes towards the attractiveness of bank debt, as well as increased cash reserves and low investment levels among SMEs that survived the financial crisis are likely explanations. Somewhat surprisingly, the data show that exporting SMEs take out less debt than their counterparts active only on the domestic market (McQuinn and McCann, 2017).
Survey data illustrate that loan credits are more often turned down in Ireland than in the EU 28 average, both for bank loans and for overdrafts or credit lines. A higher proportion is also pending in Ireland, suggesting that the decision time is higher (see Figure 3.17). A survey from the Irish SME Association (ISME) reveals a sharp uptick in credit refusals in Q2 2018, rising from 24% to 36%. The waiting time from decision to drawdown also increased from 6 to 8 weeks (ISME, 2018).

Source: (European Commission, Survey on the access to finance of enterprises (SAFE): Analytical Report 2017).
The demand for guarantees, especially personal guarantees (meaning that the business owner is personally liable in case of a default) also discourages Irish enterprises, especially smaller ones, from taking a bank loan. The widespread use of personal guarantees by banks could be detrimental to the creation and expansion of businesses, as it makes investment decisions particularly risky for the entrepreneur (Carroll, McCann and O’Toole, 2015).
In 2015, a study from the Central Bank of Ireland revealed that about one-third of all business loans were coupled with a personal guarantee over the 2012-14 period. The incidence of personal guarantees is negatively correlated with the size of the enterprise, its age and profitability. In addition, personal guarantees were more common for relatively large loans and for loans to innovative businesses (Carroll, McCann and O’Toole, 2015).
Research from the Central Statistics Office revealed that 73.6% of all bank finance applications required some form of collateral in 2014, the most recent data available. Of these, more than half (53.9%) required a personal guarantee from the business owner, while collateral in the form of a property of the business (at 16.5%) and other forms of collateral were much less common (see Figure 3.18).

Source: CSO Statistical release, OECD calculations.
Because of a paucity of data, it is unclear how that proportion has developed in recent years, nor how that number compares with other countries. Nonetheless, there is strong anecdotal evidence from organisations representing SMEs that many of their members perceive demands from banks for personal guarantees as problematic and that this perception contributes to the strong reliance on self-financing.
Take-up of finance instruments other than straight debt
The use and availability of financing instruments other than straight debt are often poorly documented and hard to compare internationally. Nonetheless, there is some evidence that Irish SMEs are very dependent on bank financing and that they face a paucity of alternatives. In September 2017, 7% of surveyed SMEs made inquiries for non-bank finance in the previous 6 months. In 2013, this proportion stood at 13% and continuously declined afterward. Of the firms that made inquiries, most of them related to government support measures with very few SMEs seeking private sector equity (see Figure 3.19).
Interestingly, trade credit is used a lot more by Irish SMEs than by their counterparts in other European countries (up to 35% more). This may be interpreted as further evidence of the reluctance of Irish SMEs to borrow from banks, as trade finance and bank credit are typically considered as relatively close substitutes (O’Toole, Lawless and Lambert, 2015).
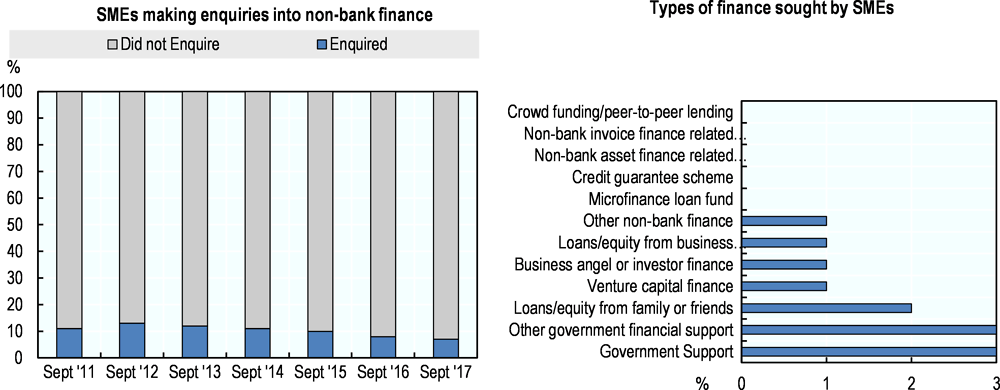
Source: (Fitzpatrick Associates, 2018).
The strong dependence on bank finance and the apparent reluctance to make use of alternative finance instruments, especially from external equity providers, may constitute a weakness for several reasons. Research documents that a more balanced capital structure increases the likelihood of attracting more bank credit at favourable conditions, which would be particularly welcome in the Irish context. In addition, a more diversified use of finance instruments is associated with higher growth in employment and turnover (Brogi and Lagasio, 2016).
Financial acumen of entrepreneurs and business owners
As with managerial skills, recent systematic data on the financial capabilities are unavailable, but anecdotal evidence suggests that this is often lacking, for example as judged by government stakeholders who provide financial services. An indication of the potential need for a renewed effort to stimulate financial skills among entrepreneurs and business owners is the disappointing take-up of current programmes in this area such as provided by Skillnet, and the local employment offices.
The Irish Government has taken action in this area. In addition to the examples above, Funding For Growth, delivered by InterTradeIreland, aims to improve the investor readiness of its beneficiaries through a range of programmes aimed at both start up and established businesses. These include the delivery of funding advisory workshops, one-to-one equity clinics, business planning workshops, venture capital workshops and the annual InterTradeIreland venture capital conference. InterTradeIreland also runs the Seedcorn investor readiness competition and partly funds HBAN (Halo Business Angel Network) the all-island organisation responsible for the promotion of business angel investments. Nonetheless, Ireland has not adopted a national action plan to coordinate policy efforts. Portugal, another country that observed a marked deterioration in the access and conditions of bank credit following the financial crisis, and which, over the last years, has been observing high levels of household indebtedness when compared to disposable income and low levels of savings, initiated a national action plan for financial education with SMEs as one of its focus groups (see Box 3.3). At the same time, the offer of savings and loan products in financial markets has become more diversified and complex, with alternatives that are increasingly more difficult to assess by individuals and families without adequate financial education. The major prospective goals to be achieved with the action plan are reducing asymmetries of information between the business community and the financial sector and promoting awareness of risks and opportunities of diverse financing instruments. A similar coordinated approach could be considered in Ireland.
The Portuguese National Action Plan for Financial Education defines the medium and long-term financial education goals, as well as the main areas of action to be developed for different target beneficiaries. The plan aims to raise financial knowledge at large among the population, and entrepreneurs and managers of small businesses represent one of the focus groups. It is a long term commitment, rolled out in 2011 and revised in 2016. A large group of stakeholders are involved in the Plan, including ministries, financial sector and consumer associations, trade unions, business associations and universities.
In 2015, the financial supervisors (the Central Bank of Portugal, the Insurance and Pension Funds Supervisory Authority and CMVM) and the Ministry of Economy, through the Portuguese Agency for Competitiveness and Innovation (IAPMEI), signed a cooperation protocol for the promotion of financial education of entrepreneurs and business owners and managers of micro, small and medium-sized enterprises in Portugal. One year later, the Portuguese Agency for Tourism (TP) joined the protocol.
Following the signature of this protocol, the “Core Competencies for Financial Training” was drawn up in November 2016 for the target group of entrepreneurs and business owners, identifying 10 different topics related to financial education and the information that training programmes should cover on these topics, which translated into 9 distinct training sessions. The document endeavours to provide guidelines to all actors active in the country that provide support in this area, thereby harmonising programmes according to good practice. It was developed following a public consultation and was finetuned during a series of pilot training actions.
The Core Competencies support the trainers in planning and implementing training actions on financial topics in a business context through the identification of relevant course contents and putting forward guidance for to ensure consistency and high quality standards in training activities. However, the teaching methodology of the training programme, as well as its planning and adaptation to specific circumstances, is the responsibility of each trainer or group of trainers.
In 2017, the financial supervisors, IAPMEI and TP hosted training courses designed for trainers with the purpose of setting up a pool of trainers to support the implementation of the Core Competencies. Each course ran for a minimum of 32 hours and a maximum of 51 hours of classroom training. Alongside general training, covering such subjects as pedagogical communication, the economic and financial system, the setting up and development of enterprises, and accounting and financial planning, the courses included modules on corporate banking products and services, capital market financing and risk management, insurance and pension funds. To complete their training, trainers had to carry out an on-the-job training session with managers of SMEs.
From a total of 34 individuals participating in these courses, most of them working with business associations, universities and polytechnic institutes, 10 received a certificate recognising their inclusion in the pool as regular trainers of IAPMEI and TP. The pool of trainers began its activity in 2018.
During the year 2018, the pool of trainers was responsible for 24 training sessions on the above-mentioned subjects directed to the targeted audience of entrepreneurs and SME managers. These sessions were held in different parts of the country, mainly in the premises of local business associations, town councils and business, tourism and hotel schools. They were attended by a total of 382 trainees, 94% of whom rated the sessions as good or very good. The most common subjects covered included business financing, business planning and accounting.
At least 28 training courses are foreseen in 2019 to enable IAPMEI and TP to increase the number of trainers in the pool. They also aim to improve and update the contents of each training course based on their experiences and feedback received.
In addition, IAPMEI and TP will run an annual conference to raise public awareness of the importance of financial education in the management of SMEs.
Source: Written correspondence with experts from CMVM.
It is important to note that the ambition of the Portuguese action plan is not only to boost financial knowledge among business owners, but also to restore confidence and trust between the business community and the financial sector, which was considerably damaged in the aftermath of the financial crisis, an experience which broadly mirrored developments in Ireland.
Chapter 5 of this publication describes the main public initiatives to ease SMEs’ access to finance in Ireland, and provides further recommendations for policy in this area.
copy the linklink copied!Trade and foreign direct investments
As Chapter 2 of this publication illustrates, Ireland’s exports are strongly concentrated, with the export share of the top five firms being far greater than in most other EU 28 countries. There is also a low incidence of exporting SMEs. The strong reliance on this small group of leading enterprises has been seen as a vulnerability of the Irish economy (National Competitiveness Council, 2018b). Chapter 5 of this publication provides more information on government initiatives to support SME internationalisation.
Ireland is also a large net recipient of foreign direct investments (FDI), and this is typically considered a major driver of economic development. An annual ranking from IBM, published in 2017, lists Ireland as the top country in the world in attracting high-value projects from abroad, followed by Denmark and Singapore. It was the sixth consecutive year that Ireland came on top of this ranking ranking (IBM Institute for Business Value, 2017).
Ireland has been particularly successful in attracting FDI from the United States; at the end of 2014, the stock of US FDI to Ireland amounted to USD 311 billion, more than the total of US FDI flowing to China, Brazil, India, Russia and South Africa (the so-called BRICS) combined (ICS, 2017). Data from IDA Ireland6, the dedicated promotion agency responsible for attracting FDI, also illustrates the importance of the United States as a source of FDI. More than half of all companies supported by IDA Ireland are US-based and they create far more jobs than FDI activities from all other countries combined (see Table 3.4).
The strong reliance on the United States as a source of FDI potentially poses challenges to the Irish economy going forward in light of increasing trade tensions and a recent reform to the American tax system which led to a very sharp contraction of FDI outflows from the United States in Q1 2018 (OECD, 2018).
Another consideration for Irish policy makers are the limited apparent linkages and productivity spillovers between multinational firms based in Ireland and indigenous Irish SMEs. This topic is further explored in Chapter 7 of this publication.
copy the linklink copied!Policy recommendations
-
Adopt best practices to improve stakeholder engagement in regulatory development on a systematic basis across government departments.
-
Evaluate the impact of the promotional campaign to stimulate apprenticeships, especially with an eye to its impact on small employers.
-
Develop an action plan for financial education with an emphasis on SME business owners and entrepreneurs and strengthen the evidence base on the managerial and financial skills of small business owners and managers.
-
Broaden the tax relief of the statutory capital gains tax (revised entrepreneur relief) by making third party equity investors eligible.
-
Consider lowering the marginal tax rate on personal income for medium earners, potentially while broadening the tax base to limit the budgetary implications.
-
Consider the introduction of a tax relief for non-domiciled new hires by Irish SMEs who have not been tax resident previously, potentially through amendments to SARP relief. Set tight eligibility criteria so as to alleviate specific skills shortages.
-
Support FDI-SME linkages by ensuring that export promotion initiatives extend to helping SMEs join FDI value chains, supporting SME compliance with industry standards, and involving FDI in local enterprise-led networks for innovation and skills development.
References
[5] Alstadsæter, A., M. Jacob and R. Michaely (2017), “Do dividend taxes affect corporate investment?”, Journal of Public Economics, Vol. 151, pp. 74-83, https://doi.org/10.1016/J.JPUBECO.2015.05.001.
[115] Bakija, J. and W. Gentry (2014), Capital Gains Taxes and Realizations: Evidence from a Long Panel of State-Level Data, https://web.williams.edu/Economics/wp/BakijaGentryCapitalGainsStatePanel.pdf (accessed on 9 January 2019).
[55] Bank Austria (2015), Austria: Lower tax burden, but higher deficit, https://www.bankaustria.at/files/Steuerreform_2015-03_e.pdf.
[74] Barro, R. and J. Furman (2017), The macroeconomic effects of the 2017 tax reform, https://www.brookings.edu/wp-content/uploads/2018/03/4_barrofurman.pdf.
[107] Beesley, A. (2017), Ireland’s outsized economic growth skewed by multinationals | Financial Times, Financial Times, https://www.ft.com/content/e3ae03c7-f2d1-304f-a4bf-1bb1cf16ce71 (accessed on 5 January 2019).
[126] Bentivogli, C., F. Quintilliani and D. Sabbatini (2013), The network contract, Bank of Italy, Rome, https://www.bancaditalia.it/pubblicazioni/qef/2013-0152/index.html?com.dotmarketing.htmlpage.language=1 (accessed on 17 May 2019).
[81] BIS (2015), Leadership and Management Skills in SMEs: Measuring Associations with Management Practices and Performance, https://assets.publishing.service.gov.uk/government/uploads/system/uploads/attachment_data/file/418404/bis-15-204-leadership-and-management-skills-in-sme.pdf.
[80] BIS (2012), Leadership & management in the UK - The key to sustainable growth, https://assets.publishing.service.gov.uk/government/uploads/system/uploads/attachment_data/file/32327/12-923-leadership-management-key-to-sustainable-growth-evidence.pdf.
[90] Boschmans, K. and L. Pissareva (2017), “Fostering Markets for SME Finance: Matching Business and Investor Needs”, OECD SME and Entrepreneurship Papers, Vol. 6, https://www.oecd-ilibrary.org/docserver/0bd38639-en.pdf?expires=1528191492&id=id&accname=guest&checksum=FE1241E7B73ACE88B281AF96805874EE.
[132] Bourke, J. and S. Roper (2019), Micro-Businesses in Ireland: From Ambition to Innovation., Cork: Cork University Business School, University College Cork.
[121] Brogi, M. and V. Lagasio (2016), SME Sources of Funding: More Capital or More Debt to Sustain Growth? An Empirical Analysis, https://doi.org/10.1007/978-3-319-41363-1_7.
[66] Carroll, J., F. McCann and C. O’Toole (2015), The use of personal guarantees in Irish SME lending, https://centralbank.ie/docs/default-source/publications/economic-letters/economic-letter---vol-2015-no-6.pdf?sfvrsn=10.
[62] Central Bank of Ireland (2018), SME Market Report, 2017 H2, https://www.centralbank.ie/docs/default-source/publications/sme-market-reports/sme-market-report-2017h2.pdf?sfvrsn=5.
[12] Central Statistics Office Ireland (2018), Business Demography 2016, https://www.cso.ie/en/releasesandpublications/er/bd/businessdemography2016/ (accessed on 15 October 2018).
[29] Central Statistics Office, I. (2016), Brexit, Ireland and the UK in numbers, https://www.cso.ie/en/statistics/othercsopublications/brexit-irelandandtheukinnumbers/.
[42] Construction Industry Federation (2017), Enhancing Ireland’s Infrastructure, https://cif.ie/reports-and-publications/.
[4] Dackehag, M. and Å. Hansson (n.d.), Taxation of dividend income and economic growth, https://www.lusem.lu.se/media/kwc/working-papers/2016/kwcwp2016-4.pdf (accessed on 21 May 2019).
[30] DBEI (2018), Brexit – the views of Irish SMEs survey results, https://dbei.gov.ie/en/Publications/Brexit-the-views-of-Irish-SMEs-survey-results.html.
[36] DBEI (2018), The Research and Development Budget, 2016-17, https://dbei.gov.ie/en/Publications/Publication-files/R-D-Budget-Survey-Report-2016-2017.pdf.
[59] Deloitte (2017), Navigating the tax landscape: The Irish entrepreneur’s view, https://www2.deloitte.com/content/dam/Deloitte/ie/Documents/Tax/IE_Tax_Navigating_the_tax_landscape.pdf.
[111] Department of Education and Skills (2018), National Training Fund Expenditure Report 2018, https://www.education.ie/en/Publications/Education-Reports/national-training-fund-expenditure-report-2018.pdf.
[39] Department of Education and Skills (2016), National Skills Strategy 2025 - Ireland’s Future, https://www.education.ie/en/Schools-Colleges/Services/National-Skills-Strategy/.
[106] Department of Finance (2018), GDP and ’modified GNI’- explanatory note, Economic Division, https://www.finance.gov.ie/wp-content/uploads/2018/05/180504-GDP-and-Modified-GNI-Explanatory-Note-May-2018.pdf (accessed on 5 January 2019).
[16] Department of Finance (2018), Patterns of Firm Level Productivity in Ireland, https://igees.gov.ie/wp-content/uploads/2018/04/Patterns-of-Firm-Level-Productivity-in-Ireland.pdf (accessed on 18 September 2018).
[120] Department of Finance (2014), Economic Impact Assessment of Ireland’s Corporation Tax Policy: Summary Research Findings and Policy Conclusions, http://www.budget.gov.ie/budgets/2015/documents/eia_summary_conclusions.pdf.
[83] Department of Jobs, Enterprise and Innovation (2015), Review of Microfinance Ireland 2015, https://dbei.gov.ie/en/Publications/Publication-files/Review-of-Microfinance-Ireland-2015.pdf.
[93] Department of social protection (2017), A review of the back to work enterprise allowance, http://www.welfare.ie/en/downloads/Review_of_BTWEA_Feb17.pdf.
[7] Di Ubaldo, M., M. Lawless and I. Siedschlag (2018), “Productivity spillovers from multinational activity to local firms in Ireland”, OECD Productivity Working Papers, No. 16, OECD Publishing, Paris, https://dx.doi.org/10.1787/58619717-en.
[61] Donnery, S. et al. (2018), Resolving Non-Performing Loans in Ireland: 2010-2018, https://www.centralbank.ie/docs/default-source/publications/quarterly-bulletins/quarterly-bulletin-signed-articles/resolving-non-performing-loans-in-ireland-2018-(donnery-fitzpatrick-greaney-mccann-and-o'keeffe).pdf?sfvrsn=6.
[63] ECB (2018), ECB Stastical Data Warehouse, https://sdw.ecb.europa.eu/browseTable.do?node=1513.
[21] Enterprise Ireland (2018), Bright Horizons for Irish Innovators, https://globalambition.ie/bright-horizons-for-irish-innovators/ (accessed on 18 October 2018).
[51] Ernst & Young (2017), Irish entrepreneurs continue to invest in future growth, but the cost of doing business in Ireland identified as a key challenge, https://www.ey.com/ie/en/newsroom/news-releases/irish-entrepreneurs-continue-to-invest-in-future-growth-but-the-cost-of-doing-business-in-ireland-identified-as-a-key-challenge.
[33] European Commission (2018), 2017 SBA Fact Sheet: Ireland, https://dbei.gov.ie/en/Publications/Publication-files/2017-SBA-Fact-Sheet.pdf.
[43] European Commission (2018), EU Open Data Portal, https://doi.org/teina2010.
[35] European Commission (2018), European Innovation Scoreboard 2018, https://ec.europa.eu/docsroom/documents/30686.
[44] European Commission (2017), Broadband Coverage in Europe 2016, https://doi.org/10.2759/679477.
[6] European Commission (2016), Evaluation and Analysis of Good Practices in Promoting and Supporting Migrant Entrepreneurship: A guide book, http://ec.europa.eu/DocsRoom/documents/18421/attachments/1/translations/en/renditions/pdf.
[1] European Commission (Survey on the access to finance of enterprises (SAFE): Analytical Report 2017), 2017, https://ec.europa.eu/docsroom/documents/26641.
[86] European Microfinance Network (2018), Microfinance Barometer 2018, https://www.european-microfinance.org/publication/microfinance-barometer-2018.
[28] Eurostat (2017), 1 in 10 enterprises in the EU recognised as high-growth companies, http://ec.europa.eu/eurostat/web/products-eurostat-news/-/DDN-20171019-1?inheritRedirect=true (accessed on 20 July 2018).
[14] Eurostat (2016), Almost 1 in 10 enterprises in the EU recognised as high-growth companies, http://ec.europa.eu/eurostat/documents/2995521/7706167/4-26102016-AP-EN.pdf/20f0c515-ed43-45c3-ad6a-ca0b26b36de5 (accessed on 20 July 2018).
[67] Fitzpatrick Associates (2018), SME Credit Demand Survey – April-September 2017: Final Report, https://www.finance.gov.ie/wp-content/uploads/2018/03/180306-SME-Credit-Demand-Survey-April-September-2017.pdf.
[24] Fitzsimons, P. and C. O’Gorman (2018), Entrepreneurship in Ireland 2017, Global Entrepreneurship Monitor (GEM), https://www.enterprise-ireland.com/en/Publications/Reports-Published-Strategies/GEM-Reports/2017-Global-Entrepreneurship-Monitor-Report.pdf (accessed on 11 September 2018).
[13] Forfás (2014), Innovation in Agency-Supported High Growth Firms in Ireland, https://dbei.gov.ie/en/Publications/Publication-files/Forf%C3%A1s/Innovation-in-Agency-Supported-High-Growth-Firms-in-Ireland.pdf (accessed on 20 July 2018).
[9] Hallak, I., P. Harasztosi and S. Schich (2018), Fear the Walking Dead? Incidence and Effects of Zombie Firms in Europe, https://doi.org/10.2760/314636.
[114] Harding, M. and M. Marten (2018), “Statutory tax rates on dividends, interest and capital gains: The debt equity bias at the personal level”, OECD Taxation Working Papers, No. 34, OECD Publishing, Paris, https://dx.doi.org/10.1787/1aa2825f-en.
[133] Harding, M. and M. Marten (2018), “Statutory tax rates on dividends, interest and capital gains: The debt equity bias at the personal level”, OECD Taxation Working Papers, No. 34, OECD Publishing, Paris, https://dx.doi.org/10.1787/1aa2825f-en.
[18] Hennigan, M. (2017), Irish Exports: Eurozone top market but poor for local firms: Part 2, http://www.finfacts.ie/Irish_finance_news/articleDetail.php?Irish-Exports-Eurozone-top-market-but-poor-for-local-firms-Part-2-793 (accessed on 20 July 2018).
[27] Hennigan, M. (2016), High-growth firms transient; not typically in high-tech sector, http://www.finfacts.ie/Irish_finance_news/articleDetail.php?High-growth-firms-transient-not-typically-in-high-tech-sector-743.
[11] Hennigan, M. (2016), Ireland’s business startup rate among lowest in European Union, http://www.finfacts.ie/Irish_finance_news/articleDetail.php?Ireland-s-business-startup-rate-among-lowest-in-European-Union-733 (accessed on 20 July 2018).
[69] IBM Institute for Business Value (2017), Global Location Trends, 2017 Annual Report, https://www.scribd.com/document/384239405/IBM-Global-Location-Trends-2018-annual-report%2Fibm-global-locations-trend-2017.pdf%3Fla%3Den&usg=AOvVaw04OAW.
[87] Ibrahimovic, A. and L. can Teeffelen (2016), A look at the characteristics of Qredits entrepreneurs: Comparative research and growth ambitions, Hogeschool Utrecht, https://cdn.qredits.nl/shared/files/documents/pdf/a_look_at_the_characteristics%20_of_Qredits-entrepreneurs_v6.pdf.
[77] Ibrahimovic, A. and L. van Teeffelen (2017), A look at the characteristics of Qredits entrepreneurs: Comparative research and growth ambitions, https://cdn.qredits.nl/shared/files/documents/pdf/a_look_at_the_characteristics%20_of_Qredits-entrepreneurs_v6.pdf.
[71] ICS (2017), Ireland - Openness to and Restriction on Foreign Investment, https://www.export.gov/article?id=Ireland-Openness-to-and-Restriction-on-Foreign-Investment.
[72] IDA Ireland (2017), IDA Ireland: Annual Report & Accounts 2017, https://www.idaireland.com/IDAIreland/media/docs/About-IDA/IDA_Annual_Report_2017.pdf.
[116] IFF Research (2017), Capital Gains Tax Entrepreneurs’ Relief: Behaviours and Motivations, http://www.hmrc.gov.uk (accessed on 9 January 2019).
[108] InterTradeIreland (2013), Analysis of the key features of an exporting SME on the island of Ireland, https://intertradeireland.com/insights/publications/analysis-of-the-key-features-of-an-exporting-sme-on-the-island-of-ireland/ (accessed on 7 January 2019).
[32] Irish Fiscal Advisory Council (2018), Fiscal Assessment Report, June 2018, https://www.fiscalcouncil.ie/wp-content/uploads/2018/06/IFAC-Fiscal-Assessment-Report-June-2018.pdf.
[57] Irish Fiscal Advisory Council (2018), Fiscal Assessment Report, June 2018, https://www.fiscalcouncil.ie/wp-content/uploads/2018/06/IFAC-Fiscal-Assessment-Report-June-2018.pdf.
[65] ISME (2018), Significant increase in loan refusal rates for SMEs, https://www.isme.ie/assets/Press-release-Q218-Bank-survey.pdf.
[54] Ivaškaitė-Tamošiūnė, V., A. Leodolter and M. Schmitz (2017), Personal Income Taxation in Austria: What do the reform measures mean for the budget, labour, market incentives and income distribution, https://ec.europa.eu/info/sites/info/files/eb030_en.pdf.
[78] Kerste, M. et al. (2016), Evaluatie microfinanciering: Eindrapport, http://www.seo.nl/uploads/media/2016-30_Evaluatie_microfinanciering.pdf.
[88] Kerste, M. et al. (2016), Evaluatie microfinanciering: Eindrapport, SEO Economisch Onderzoek, http://www.seo.nl/uploads/media/2016-30_Evaluatie_microfinanciering.pdf.
[89] KPMG (2017), L’impact économique de l’action de l’ADIE, https://www.adie.org/sites/default/files/links/etude_synthese_mcpro2106.pdf.
[85] Kraemer-Eis, H. et al. (2018), European Small Business Outlook: June 2018, https://www.european-microfinance.org/publication/eif-working-paper-201850-european-small-business-finance-outlook.
[37] Kuczera, M. (2017), Striking the right balance: Costs and benefits of apprenticeships, https://doi.org/10.1787/995fff01-en.
[56] Lawless, M., C. O’Toole and R. Slaymaker (2018), Estimating an SME investment gap and the contribution of financing, https://www.esri.ie/publications/estimating-an-sme-investment-gap-and-the-contribution-of-financing-frictions/.
[19] Lawless, M., I. Siedschlag and Z. Studnicka (2017), “Irish enterprise exporting patterns in goods and services: Evidence for policy”, Economic and Social Research Institute (ESRI) ESRI Research Bulletin 2017/2/4, https://www.esri.ie/pubs/RB20170204.pdf (accessed on 20 July 2018).
[128] Löher, J., M. Paschke and C. Schröder (2017), unter Mitarbeit von Kasdorf, A. (2017): Kooperationen zwischen etabliertem Mittelstand und Start-ups,, IfM Bonn.
[75] Maffini, G., J. Xing and M. Devereux (2016), The impact of investment incentives: evidence from UK corporation tax returns, https://www.sbs.ox.ac.uk/sites/default/files/Business_Taxation/Docs/Publications/Working_Papers/WP1601.pdf.
[113] Mcnaboe, J. et al. (2018), National Skills Bulletin 2018 A Report by the Skills and Labour Market Research Unit (SLMRU) in SOLAS on behalf of the National Skills Council Foreword by the Minister for Education and Skills, http://www.solas.ie/SkillsToAdvance/Documents/National%20Skills%20Bulletin%202018.pdf (accessed on 8 January 2019).
[129] McQuade, P., S. Riscado and S. Santacroce (2017), Personal income tax in Ireland: Future of the Universal Social Charge, European Commission.
[64] McQuinn, J. and F. McCann (2017), The financial vulnerability of Irish small and medium enterprises, 2013 to 2017, https://www.centralbank.ie/docs/default-source/publications/economic-letters/vol-2017-no-14--the-financial-vulnerability-of-irish-small-and-medium-enterprises-2013-to-2017-(mcquinn-and-mccann).pdf?sfvrsn=4.
[84] Microfinance Ireland (2018), A record year for Microfinance Ireland and an additional €30M commitment from EU for micro-enterprises in Ireland over the next 5 years, https://www.microfinanceireland.ie/wp-content/uploads/2018/01/Microfinance-Ireland-Press-Release-30-Jan-2018-final.pdf.
[100] Mühlemann, S. (2016), “The Cost and Benefits of Work-based Learning”, OECD Education Working Papers, No. 143, OECD Publishing, Paris, https://doi.org/10.1787/5jlpl4s6g0zv-en.
[52] National Competitive Council (2018), Benchmarking Competitiveness: Ireland and the United Kingdom, 2017, http://www.competitiveness.ie/News-Events/2017/NCC-Benchmarking-Competitiveness-for-Publication.pdf.
[112] National Competitiveness Council (2018), Costs of Doing Business in Ireland 2018, http://www.competitiveness.ie/News-Events/2018/Costs%20of%20Doing%20Business%202018%20Report.pdf (accessed on 8 January 2019).
[68] National Competitiveness Council (2018), Reliance on a small number of firms threatens Ireland’s economic model, http://www.competitiveness.ie/Publications/2018/Concentration-Bulletin.pdf.
[48] National Competitiveness Council (2017), Costs of Doing Business in Ireland 2017, http://www.competitiveness.ie/Publications/2017/.
[53] National Competitiveness Council (2017), Ireland’s competitiveness challenge, 2017, http://www.competitiveness.ie/News-Events/2017/Competitiveness%20Challenge%202017.pdf.
[47] National Competitiveness Council (2016), Costs of Doing Business in Ireland 2016, http://www.competitiveness.ie.
[130] O’connor, B., T. Hynes and D. Haugh (2016), Searching for the Inclusive Growth Tax Grail: The Distributional Impact of Growth Enhancing Tax Reform in Ireland*, https://igees.gov.ie/wp-content/uploads/2014/01/The-Distributional-Impact-of-Growth-Enhancing-Tax-Reform-in-Ireland.pdf (accessed on 21 May 2019).
[135] OECD (2019), Financing SMEs and Entrepreneurs 2019: An OECD Scoreboard, OECD Publishing, Paris, https://dx.doi.org/10.1787/fin_sme_ent-2019-en.
[110] OECD (2018), Education at a Glance 2018: OECD Indicators, OECD Publishing, Paris, https://dx.doi.org/10.1787/eag-2018-en.
[73] OECD (2018), FDI in figures, July 2018, http://www.oecd.org/investment/investment-policy/FDI-in-Figures-July-2018.pdf.
[70] OECD (2018), FDI Regulatory Restrictiveness Index, https://stats.oecd.org/.
[15] OECD (2018), OECD Compendium of Productivity Indicators 2018, OECD Publishing, Paris, https://doi.org/10.1787/pdtvy-2018-en.
[2] OECD (2018), OECD Economic Outlook, Volume 2018 Issue 1, OECD Publishing, Paris, https://doi.org/10.1787/eco_outlook-v2018-1-en.
[17] OECD (2018), OECD Economic Surveys: Ireland 2018, OECD Publishing, Paris, https://doi.org/10.1787/eco_surveys-irl-2018-en.
[49] OECD (2018), OECD Economic Surveys: Ireland 2018, https://doi.org/10.1787/eco_surveys-irl-2018-en.
[3] OECD (2018), OECD Economic Surveys: Ireland 2018, OECD Publishing, Paris, https://doi.org/10.1787/eco_surveys-irl-2018-en.
[119] OECD (2018), OECD Regulatory Policy Outlook 2018, OECD Publishing, Paris, https://dx.doi.org/10.1787/9789264303072-en.
[23] OECD (2018), “Promoting innovation in established SMEs”, http://www.oecd.org/cfe/smes/ministerial/documents/2018-SME-Ministerial-Conference-Parallel-Session-4.pdf (accessed on 6 June 2018).
[40] OECD (2018), Survey of Adult Skills (PIAAC), http://www.oecd.org/skills/piaac/.
[60] OECD (2018), Table II.1. Statutory corporate income tax rate, https://stats.oecd.org/index.aspx?DataSetCode=TABLE_II1.
[10] OECD (2017), Entrepreneurship at a Glance 2017, OECD Publishing, Paris, https://doi.org/10.1787/entrepreneur_aag-2017-en.
[104] OECD (2017), Entrepreneurship at a Glance 2017, OECD Publishing, Paris, https://doi.org/10.1787/entrepreneur_aag-2017-en.
[105] OECD (2017), Entrepreneurship at a Glance 2017, OECD Publishing, Paris, https://doi.org/10.1787/entrepreneur_aag-2017-en.
[123] OECD (2017), Entrepreneurship at a glance: 2017, https://doi.org/10.1787/entrepreneur_aag-2017-en.
[95] OECD (2017), Government at a Glance 2017, OECD Publishing, Paris, https://doi.org/10.1787/gov_glance-2017-en.
[96] OECD (2017), “Ireland”, in Education at a Glance 2017: OECD Indicators, OECD Publishing, Paris, https://doi.org/10.1787/eag-2017-52-en.
[45] OECD (2017), OECD Data: Fixed broadband subscriptions, https://data.oecd.org/broadband/fixed-broadband-subscriptions.htm#indicator-chart.
[101] OECD (2017), OECD Digital Economy Outlook 2017, OECD Publishing, Paris, https://doi.org/10.1787/9789264276284-en.
[20] OECD (2017), OECD Science, Technology and Industry Scoreboard 2017: The digital transformation, OECD Publishing, Paris, https://doi.org/10.1787/9789264268821-en.
[41] OECD (2017), Taxation and Skills, https://doi.org/10.1787/9789264269385-en.
[94] OECD (2017), The missing entrepreneurs 2017 : Policies for inclusive entrepreneurship.
[25] OECD (2017), The Missing Entrepreneurs 2017 : Policies for inclusive entrepreneurship.
[124] OECD (2017), The Missing Entrepreneurs 2017: Policies for Inclusive Entrepreneurship, https://doi.org/10.1787/9789264283602-en.
[98] OECD (2016), PISA 2015 Results (Volume I): Excellence and Equity in Education, PISA, OECD Publishing, Paris, https://doi.org/10.1787/9789264266490-en.
[99] OECD (2016), Society at a Glance 2016: OECD Social Indicators, OECD Publishing, Paris, https://doi.org/10.1787/9789264261488-en.
[102] OECD (2016), “The role of business angel investments in SME finance”, in Financing SMEs and Entrepreneurs 2016: An OECD Scoreboard, OECD Publishing, Paris, https://doi.org/10.1787/fin_sme_ent-2016-6-en.
[26] OECD (2015), “Ireland Policy Brief: Innovation”, OECD Better Policies Series, http://www.oecd.org/internet/oecd-digital-economy- (accessed on 20 July 2018).
[103] OECD (2015), Taxation of SMEs in OECD and G20 Countries, OECD Tax Policy Studies, No. 23, OECD Publishing, Paris, https://doi.org/10.1787/9789264243507-en.
[127] OECD (2014), Italy: Key Issues and Policies, OECD Studies on SMEs and Entrepreneurship, OECD Publishing, Paris, https://dx.doi.org/10.1787/9789264213951-en.
[92] OECD and European Commission (2017), Supporting women entrepreneurs in Ireland: Rapid policy assessments of inclusive entrepreneurship policies and programmes, https://www.oecd.org/ireland/RPA-Ireland-women-FINAL.pdf.
[97] OECD/EU (2017), Supporting Entrepreneurship and Innovation in Higher Education in Ireland, OECD Skills Studies, OECD Publishing, Paris/EU, Brussels, https://doi.org/10.1787/9789264270893-en.
[122] Organisation for Economic Co-operation and Development (n.d.), Entrepreneurship at a Glance 2017..
[117] O’Toole, C., M. Lawless and D. Lambert (2015), The Economic and social review., [Economic and Social Studies], https://www.esr.ie/article/view/294 (accessed on 11 January 2019).
[134] RetImpresa (2018), Guida alle reti d’impresa, https://www.assolombarda.it/servizi/mercato/documenti/guida-alle-reti-dimpresa-1.
[118] SBCI (2018), 1st Quarter Report of 2018 to the Minister for Business, Enterprise and Innovation detailing the analysis and performance of the SME Credit Guarantee Scheme at 31st March 2018, https://dbei.gov.ie/en/Publications/Publication-files/Q1-2018-Report-SME-Credit-Guarantee-Scheme.pdf.
[82] Schich, S. et al. (2017), Evaluating publicly supported credit guarantee programmes for SMEs, https://doi.org/www.oecd.org/finance/Evaluating-Publicly-Supported-Credit-Guarantee-Programmes-for-SMEs.pdf.
[38] SOLAS (2017), Lifelong Learning Report 2017, http://www.skillsireland.ie/Publications/2017/Lifelong%20Learning%20Report%202017.html.
[131] Sterlacchini, A. and F. Venturini (2018), “R&D tax incentives in EU countries: does the impact vary with firm size?”, Small Business Economics, pp. 1-22, https://doi.org/10.1007/s11187-018-0074-9.
[31] Stiftung, B. (2018), 2018 Globalization Report: Who benefits from globalization, https://www.bertelsmann-stiftung.de/fileadmin/files/BSt/Publikationen/GrauePublikationen/MT_Globalization_Report_2018.pdf.
[8] Storz, M. et al. (2017), Do we want these two to tango? On zombie firms and stressed banks in Europe, https://www.ecb.europa.eu/pub/pdf/scpwps/ecb.wp2104.en.pdf?0167b3eada64c9757df8e6e0b866b3a1.
[46] Sustainable Energy Authority of Ireland (2017), Electricity & Gas Prices in Ireland: 1st Semester (January-June) 2017, https://www.seai.ie/resources/publications/Electricity_Gas_Prices_January_June_2017.
[76] Tax Foundation (2015), U.S. Taxpayers Face the 6th Highest Top Marginal Capital Gains Tax Rate in the OECD, https://taxfoundation.org/us-taxpayers-face-6th-highest-top-marginal-capital-gains-tax-rate-oecd/.
[58] Taxinstitute.ie (2017), A future tax strategy to grow Irish indigenous exports: Opportunities and challenges in a new global landscape, http://taxinstitute.ie/Portals/0/PDFs%20-%20Press%20Room/Irish%20Tax%20Institute%20Exports%20Report%20June%202017.pdf.
[125] Tiscini, R. and L. Martiniello (2014), “The Case of the Formalized Italian Network Contracts: Evidence on Business Models and Performance Effects”, SSRN Electronic Journal, https://doi.org/10.2139/ssrn.2462465.
[79] Vujanovic, P. and C. Lewis (2017), Ensuring a dynamic skills-training and life-long learning system in Switzerland, https://doi.org/10.1787/438423d9-en.
[22] Wain, M. et al. (2015), Enhancing the intellectual property activities in the firm base in Ireland, technopolis group, http://www.technopolis-group.com (accessed on 18 October 2018).
[109] World Bank (2019), Doing Business 2019: Training for reform, http://www.worldbank.org/content/dam/doingBusiness/media/Annual-Reports/English/DB2019-report_web-version.pdf.
[91] World Bank, IMF, OECD (2015), Capital market instruments to mobilize institutional investors to infrastructure and SME financing in Emerging Market Economies, https://www.oecd.org/g20/topics/development/WB-IMF-OECD-report-Capital-Markets-Instruments-for-Infrastructure-and-SME-Financing.pdf.
[50] www.taxinstitute.ie (2016), Perspectives on Ireland’s personal tax system: A medium to long term approach, https://taxinstitute.ie/Portals/0/The%20Budget%20Book%202017%20-%20Final%2016%20Sept.pdf.
[34] Yin, Y. and B. Westmore (2018), Reforms for sustainable productivity growth in Ireland, https://doi.org/10.1787/2fd5fd8a-en.
Notes
← 1. The information is sourced from (Mühlemann, 2016) and (Kuczera, 2017).
← 2. In Australia, there are a number of tax incentives available for employers that provide apprenticeships. Incentive payments are made when Australian apprentices commence, recommence and complete their training, with higher payments for specific targeted groups such as “mature aged employees” and people with a disabilities. The incentives are subject to eligibility criteria, waiting periods and time limits. More information can be found here: https://www.australianapprenticeships.gov.au/programs/incentives.
In France, enterprises receive a tax credit when they employ apprentices for at least one month, worth EUR 1 600 per apprentice per year and EUR 2 200 for apprentices with a disability or low qualification level. In addition, SMEs offering apprenticeships are exempt from employer social contributions.
(SMEs) offering apprenticeships are fully exempted from employer social contributions.
← 3. In Australia, for instance, apprenticeships that lead to an occupation from the “National Skills Needs List” are eligible for additional subsidies. This aims to address skills shortages for the regional economy, covering all regions within the eight states of the country (Kuczera, 2017).
← 4. The Springboard+ is co-funded by the government of Ireland and the European Social Fund and provides upskilling in higher education through free courses at certificate, degree and masters level. The EXPLORE programme especially targets persons over 35 years of age in manufacturing employment by provide learning opportunities outside of the traditional classroom.
← 5. The Gini coefficient ranges from 0 to 1, with higher numbers representing greater inequality of incomes across individuals.
← 6. IDA Ireland has articulated a strategy to increase FDI flows to Ireland that is currently being implemented, “Winning: Foreign Direct Investment 2015-2019.”
Metadata, Legal and Rights
https://doi.org/10.1787/e726f46d-en
© OECD 2019
The use of this work, whether digital or print, is governed by the Terms and Conditions to be found at http://www.oecd.org/termsandconditions.