copy the linklink copied!1. General assessment of the macroeconomic situation
copy the linklink copied!Introduction
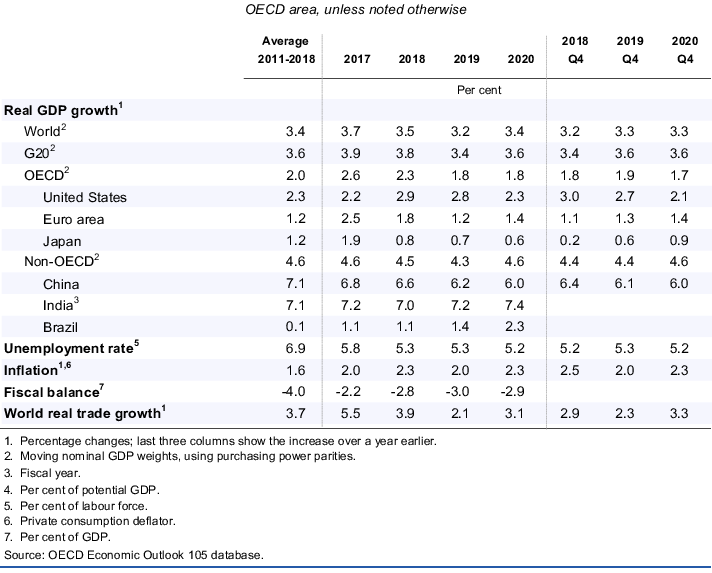
Global growth has slowed abruptly over the past year, with the weakness seen in the latter half of 2018 continuing in the early part of 2019 amidst persisting trade tensions. Trade and investment have moderated sharply, especially in Europe and China, business and consumer confidence have declined and policy uncertainty remains high. At the same time, financial market conditions have eased, helped by moves towards a more accommodative monetary policy stance in many economies, and favourable labour market conditions continue to support household incomes and spending in the major economies. Sizeable fiscal and quasi-fiscal easing is occurring in a handful of countries, including China, but in most economies fiscal policy is offering only limited support for growth. Overall, given the balance of these different forces acting, global GDP growth is projected to ease from 3½ per cent in 2018 to a sub-par rate of 3.2% this year, before edging up to 3.4% in 2020 (Table 1.1). This slowdown is widespread, with growth set to moderate this year in almost all economies. Trade growth is projected to weaken further this year, to around 2%, the weakest rate since the global financial crisis and checking the speed at which global output growth can rebound from its current soft pace. Inflationary pressures are set to remain mild, with few strains on capacity in most economies.
The balance of risks continues to be on the downside, with growth outcomes potentially being substantially weaker if negative risks materialise or interact. Key risks include a prolonged period of higher tariffs on trade between the United States and China; further steps to raise new trade barriers, particularly additional tariffs on trade between the United States and the European Union; a failure of policy stimulus to prevent a sharper slowdown in China; continuing policy uncertainty and prolonged sub-par growth in Europe, including lingering uncertainty about Brexit; and financial vulnerabilities from high debt and deteriorating credit quality. On the upside, decisive actions by policymakers to reduce policy-related uncertainty and strengthen medium-term growth prospects, including measures that reduce barriers to trade, would improve confidence and investment around the world.
Against this background, the key policy priorities are to ensure sufficient support for demand, reduce policy-related uncertainty, enhance resilience against risks and strengthen prospects for medium-term growth that provides opportunities for all. Multilateral dialogue should be restored to avoid new damaging trade restrictions and to take advantage of the opportunities of openness that benefit all economies. Central banks should remain supportive and ensure long-term interest rates stay low. Fiscal and structural policies should be focussed on actively addressing medium-term challenges, whilst ensuring adequate support for demand over the projection period. In the euro area, combined action across countries, involving renewed reform efforts, augmented by targeted fiscal measures where space exists, is needed to strengthen medium-term prospects in all member states and provide additional near-term support to area-wide growth. Scope exists to ease monetary policy in many emerging-market economies if inflation continues to decline towards target, provided investor confidence is retained. In all countries, improved reform ambition is needed to enhance living standards, improve medium-term prospects for investment and productivity, and make growth more inclusive by allowing the benefits to be distributed more widely.
In the event of an even sharper or more protracted global growth slowdown than currently projected, co-ordinated policy action across countries would provide the most effective and timely counterweight, with fiscal policy measures likely to offer the most support in the short term. To enhance the effectiveness of such actions, preparation is needed now, with identification of well-targeted growth and income enhancing measures that can be rolled out rapidly if required.
copy the linklink copied!Global growth is set to remain weak
Global GDP, trade and investment growth have fallen sharply
Global growth has slowed sharply over the past year, amidst heightened policy uncertainty, persistent trade tensions and declines in business and consumer confidence. In the latter half of 2018, world GDP growth declined to around 3% on a quarterly basis (Figure 1.1, Panel A), and appears likely to have improved only slightly in the first quarter this year. This is the weakest pace since 2015-16, in part reflecting the deep recessions occurring in some emerging-market economies and widespread weakness in industrial sectors (Figure 1.1, Panel C). Confidence indicators have also eased markedly in many OECD countries, especially in the euro area and Japan where growth has proved weaker than expected, and, until recently, in China. In contrast, confidence has held up in the United States, although growth has started to moderate as the support from fiscal policy wanes. At a sector level, incoming new orders remain at a low level in manufacturing (Figure 1.1, Panel B), but are holding up in service industries, possibly reflecting the relative buoyancy of consumer spending, including retail sales (Figure 1.1, Panel D), and so far limited spillovers from the weakness in manufacturing sectors (Box 1.1).
Note: GDP, industrial production and retail sales aggregation use PPP weights. GDP growth in the first quarter of 2019 based on currently available data and projections for the remaining economies. Data in Panel D are for retail sales in the majority of countries, but monthly household consumption is used for the United States and the monthly synthetic consumption indicator is used for Japan. Data for India are unavailable for Panel D.
Source: OECD Economic Outlook database; Markit; OECD Main Economic Indicators database; Refinitiv; and OECD calculations.
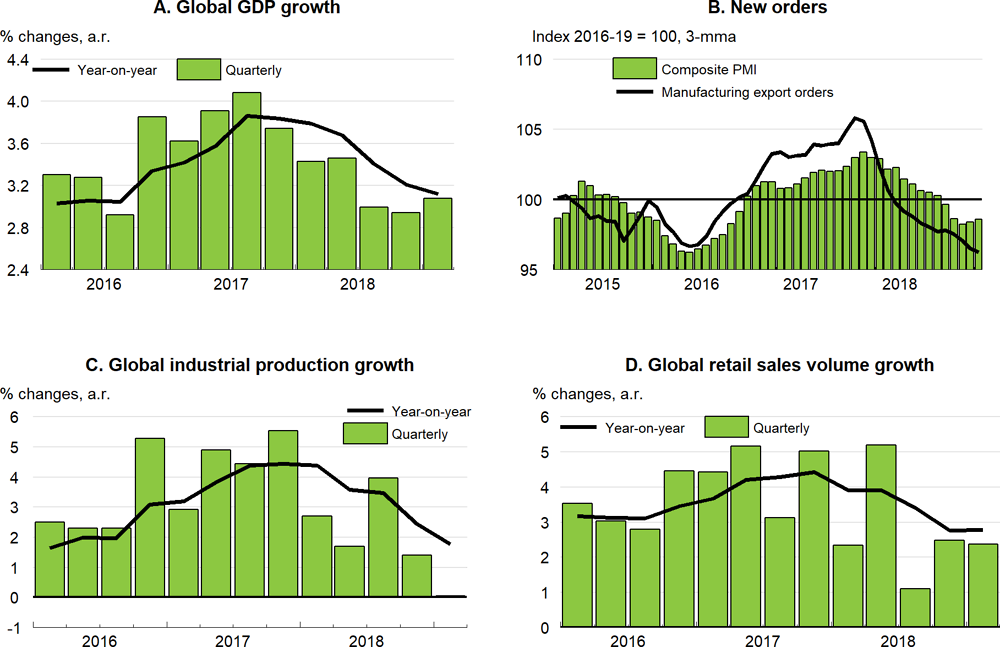
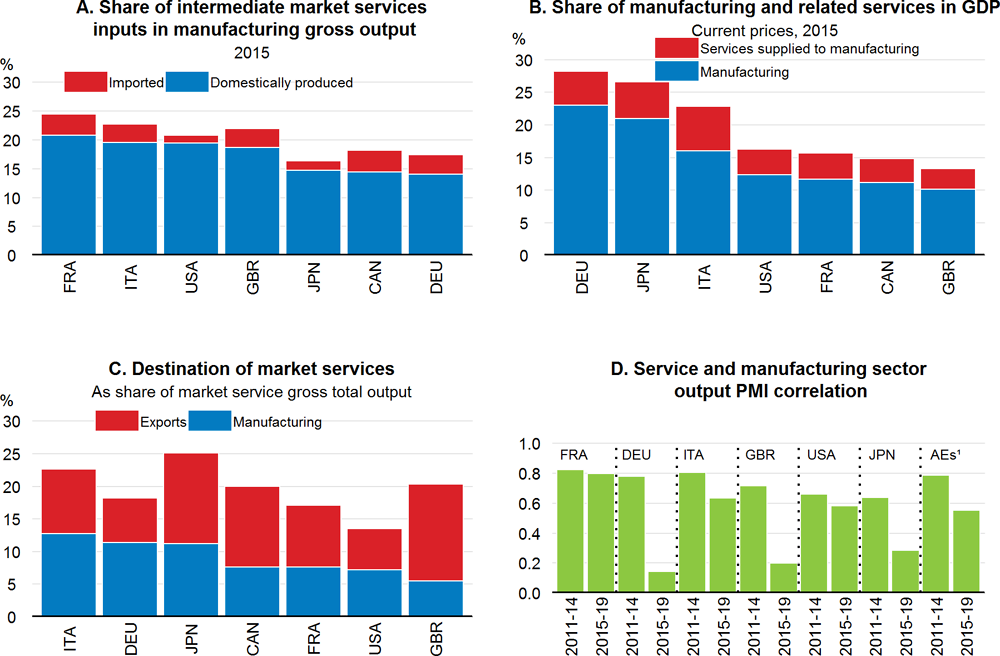
The current downturn in the global manufacturing cycle has so far had only limited spillovers to the service sector, where output has been more resilient in many economies (Figure 1.2). A key question is whether this situation can persist if there is an extended industrial slowdown. This box examines the linkages between the manufacturing and market services sectors in the G7 economies, and the extent to which they have common driving factors. The evidence suggests that despite sizeable direct connections via supply chains, the linkages between manufacturing and service sector developments have eased in recent years in some major economies, helped by an underlying divergence in the behaviour of the different expenditure components that drive demand in each sector.
Note: Services output excludes financial and public services in the euro area. Tertiary sector output in Japan.
Source: Eurostat; METI; and OECD calculations.
Supply-chain linkages
There are direct supply-chain linkages between manufacturing and services industries. Service sector outputs, particularly market services such as transport, communication and business services, are used as intermediate inputs in manufacturing.
-
In 2015, the share of market services inputs in gross output in the manufacturing sector ranged from 24% in France to 16% in Japan, amongst the G7 economies (Figure 1.3, Panel A), with the majority of these inputs being produced domestically. Differences across countries in part reflect the extent to which some services production is outsourced or produced internally within manufacturing companies.
-
Overall, in the G7 economies, the combined share of value-added output in the manufacturing sector and the output of market services that is used as an intermediate input in manufacturing ranged from 13% to 28% of GDP in 2015 (Figure 1.3, Panel B). The share of externally produced market services in manufacturing output was relatively large in Italy, accounting for close to 7% of GDP.
1. AEs refers to the Markit aggregate for the advanced economies.
Source: OECD National Accounts database; OECD Input-Output Tables; Markit; and OECD calculations.
Domestic service sectors have also become more exposed to the global business cycle over time because of rising exports of services.
-
The share of domestic market services gross output that is exported has risen over time, representing 10.5% of output in 2015 in the average G7 economies, up from 9% in 2005.
Overall, in the median G7 economy, about 20% of market services gross output went either to the manufacturing sector or was exported in 2015 (Figure 1.3, Panel C). The service sectors in Italy, Japan and the United Kingdom appear the most exposed to the global business cycle on these metrics, either because of the extent to which services supply inputs to domestic manufacturing or, as for the United Kingdom, because of a relatively high level of services exports.
The declining correlation between output growth in manufacturing and services sectors
In event of a recession or a shock common to all sectors, such as a severe tightening of financial conditions, there is little reason to expect any substantial decoupling between industrial and service sectors. Outside such periods, there may be differences in the key factors underpinning demand for services and manufactures. Business survey indicators highlight a continued positive correlation between manufacturing and service output, but it has declined noticeably in recent years in almost all major economies (Figure 1.3, Panel D), particularly in Germany.
One possible factor behind the recent divergence between manufacturing and service sector developments may be the extent to which they are driven by different components of expenditure, and, in particular, the strength of consumption growth relative to investment and trade growth since the global financial crisis.
-
On average in the G7 economies, around two-fifths of gross output in market services sectors is produced directly for private and public consumption in the domestic economy, whereas this represents only one-fifth of gross output in manufacturing.1
-
In contrast, around two-fifths of manufacturing sector gross output is produced for domestic investment and export demand, whereas this represents only one-sixth of gross output in market services.
-
Relatedly, around one-half of final household consumption expenditure is on domestically-produced market services, on average in the G7 economies. In contrast only around one-quarter of gross fixed capital formation is on domestically-produced market services.
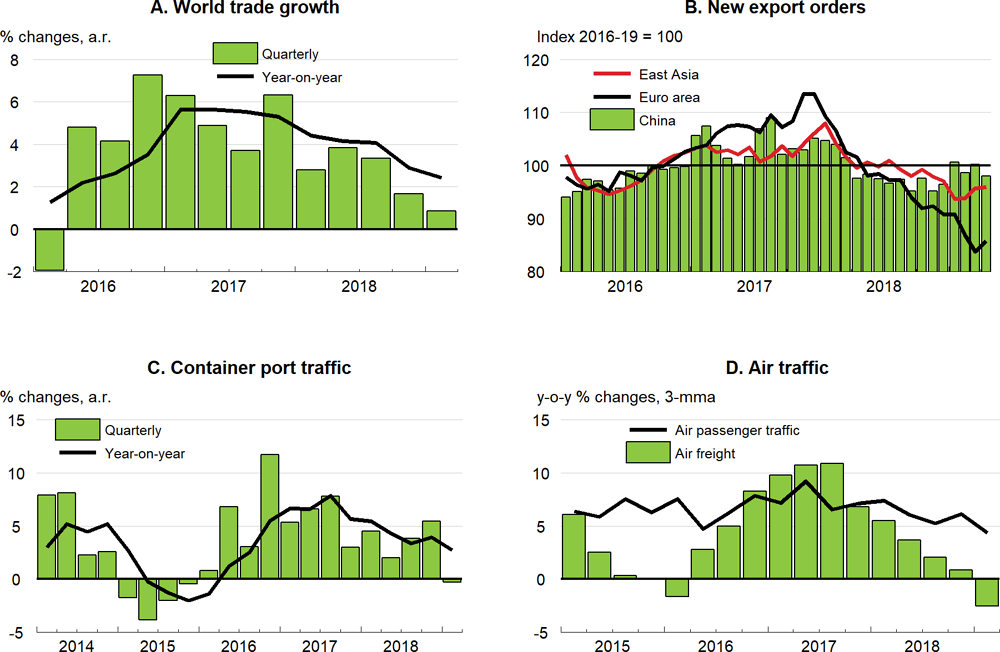
In the decade prior to the crisis, the year-on-year growth rates of private consumption and total (or business) investment were strongly positively correlated in almost all G7 economies (with the exception of the United Kingdom). This association has declined in the post-crisis period (from 2011 onwards), with the growth rates even becoming negatively correlated in some countries, including the United States. A similar pattern can be observed for export growth; this remains strongly correlated with business investment growth in most G7 countries, but is weakly or negatively correlated with consumption growth since 2011. There are also differing developments within exports, with international passenger traffic and tourism remaining more robust than other components of trade (Figure 1.4, Panel D).
The decoupling between consumption and other demand components can be partly explained by improving labour market outcomes and wealth effects that have helped to support consumption growth in recent years, while policy uncertainty and, more recently, trade restrictions have weighed on trade and investment. If this pattern persists, as is the case in the baseline projections in this Outlook, then output growth in service sectors should continue to hold up even if manufacturing output growth remains soft. However, if manufacturing output weakens further around the world, this may not persist, with adverse effects on wages and employment in industrial sectors likely to weaken aggregate household income and spending.
← 1. In the median G7 economy, just under one-half of market services output is used as intermediate consumption (by another service provider in about 70% of the cases), the rest being destined for final expenditure.
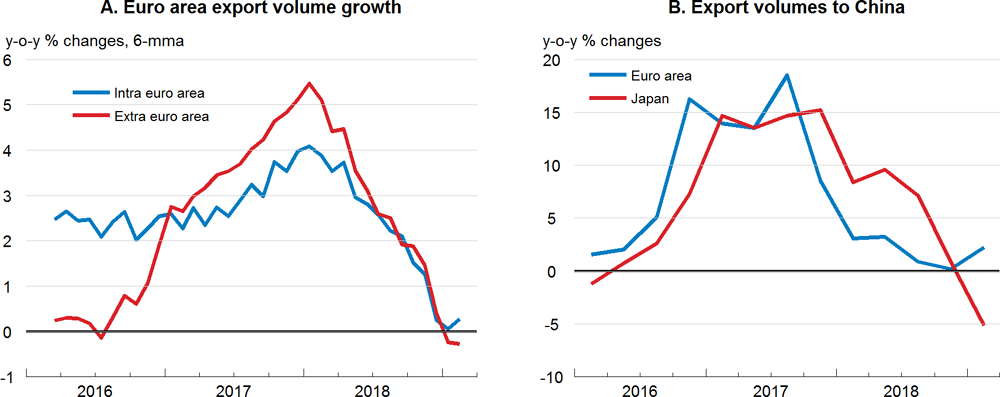
Global trade volume growth, a key artery of the global economy, has slowed abruptly, from around 5½ per cent in 2017 to around ¾ per cent in the first quarter of 2019 (Figure 1.4, Panel A). High-frequency indicators suggest that near-term trade prospects remain weak. Export orders are still at a low level, particularly in the euro area (Figure 1.4, Panel B) and Germany, where survey measures are currently lower than at any time during the euro area crisis. Global industrial production has stalled in recent months, and both container port traffic and air-freight traffic indicators have weakened (Figure 1.4, Panel C and D). In Europe, trade growth has declined, reflecting weak external and internal demand (Figure 1.5), and merchandise import growth has slowed sharply in China.
Note: Figures for world trade growth in the first quarter of 2019 are based on currently available data and projections for the remaining economies. East Asia export orders are a PPP-weighted average of Japan, Korea, Malaysia, the Philippines, Thailand, Chinese Taipei and Vietnam.
Source: OECD Economic Outlook 105 database; Markit; Institute of Shipping Economics and Logistics; International Air Transport Association; and OECD calculations.
Note: Merchandise export volumes. Seasonally and working-day adjusted for the euro area and seasonally adjusted for Japan.
Source: Eurostat; Bank of Japan; and OECD calculations.
A number of factors are contributing to the slowdown in trade. Many of these factors are likely to persist for some time, pointing to soft trade growth prospects for much of this year.
-
The series of new tariffs and retaliatory counter-measures introduced in 2018 are having a negative effect on output and incomes (OECD, 2018a; Amiti et al., 2019),1 and there have been marked declines in trade flows and increases in prices in some targeted sectors, particularly in the United States and China. Additional bilateral tariffs between the United States and China have just been announced, and risks remain that further measures may be implemented this year, including new restrictions in specific trade-sensitive sectors such as cars and car parts.
-
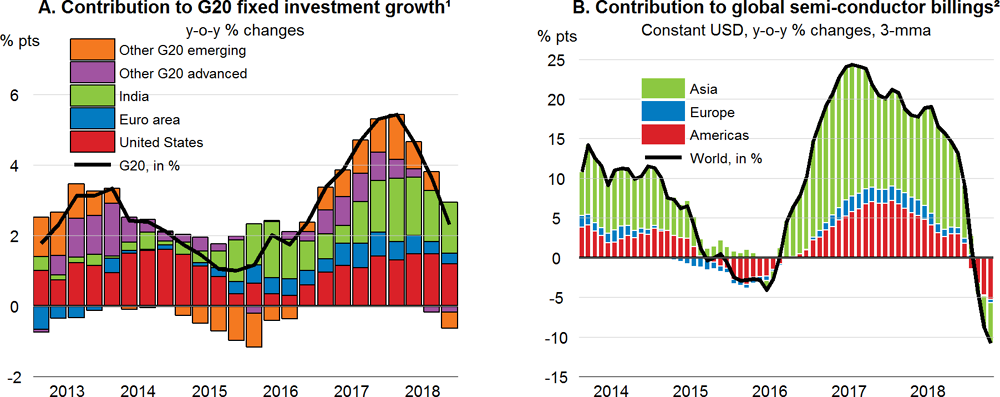
Weaker investment growth (Figure 1.6, Panel A), a relatively trade-intensive category of expenditure, has also contributed to the trade slowdown, with rising trade tensions having added to policy uncertainty and adversely affected business investment.2 Amongst the G20 economies for which timely data are available, annual fixed investment growth has halved, from around 5% in 2017 to 2½ per cent at the end of 2018.
-
In Asia, a sharp downturn in the global semi-conductor cycle (Figure 1.6, Panel B), and softer domestic demand growth in China account for much of the recent weakness in merchandise trade growth seen in countries such as Japan (Figure 1.5, Panel B) and Korea. US merchandise trade with China has also declined sharply, reflecting higher trade barriers, with export and import volumes in the first quarter of 2019 around 16% and 13% lower respectively than a year earlier.
-
In Europe, strong regional supply-chain linkages magnify the swings in trade (Ollivaud and Schwellnus, 2015), given the importance that economies such as Germany and Italy have as export markets for other European economies. These add to the specific drags exerted by the deep recession in Turkey and the slowdown in trade with the United Kingdom.
1. G20 fixed investment excludes China and Saudi Arabia, due a lack of quarterly data. The euro area aggregate includes only Germany, France and Italy. 'Other G20 advanced' includes Australia, Canada, Japan, Korea and the United Kingdom. 'Other G20 emerging' includes Argentina, Brazil, Indonesia, Mexico, Russia, South Africa and Turkey.
2. Semi-conductor billings in nominal USD for Asia and Europe are deflated using US semi-conductor import prices, and nominal billings in the United States are deflated using US semi-conductor export prices.
Source: OECD Economic Outlook 105 database; World Semi-Conductor Trade Statistics; Bureau of Labor Statistics; and OECD calculations.
Financial conditions and commodity prices are cushioning the extent of the slowdown. Financial market conditions have improved since the start of the year, with the significant repricing of risk seen in late 2018 being partially reversed amidst signals of more accommodative monetary policy than previously expected (see below). Equity prices have strengthened, long-term government bond yields have declined, and spreads on corporate bonds and emerging-market bonds have narrowed. However, the introduction by the United States of higher tariffs on imports from China has recently heightened volatility in asset prices. Supply restrictions by OPEC and Russia, and the impact of sanctions on output in Venezuela and Iran, have helped to push up oil prices this year, despite softer global demand growth. However, at the USD 70 per barrel assumed in the projection period, prices remain below the levels seen during the latter half of 2018.
Global growth is set to remain at a modest pace
Overall, recent economic and financial developments, and the materialisation of some downside risks, point to subdued global growth prospects. Global GDP growth is projected to ease to a below-trend rate of 3.2% this year and 3.4% in 2020, well below the rates seen in 2017-18 (Figure 1.7, Panel A), but on a par with 2015-16. The extent of the slowdown will depend on the continuing resilience of household spending, the speed at which the current recessions in some major emerging-market economies, notably Turkey and Argentina, start to fade and the strength of the subsequent recovery. Indeed, the sharp slowdowns and projected gradual recoveries in Turkey and Argentina account for around two-fifths of the decline in global growth between 2017 and 2019, and the rebound in 2020 (Figure 1.7, Panel B). High policy uncertainty and weak confidence are set to weigh further on business investment and trade prospects, and slow the pace at which growth can pick up from its current low rate, despite the support offered by improved financial conditions.
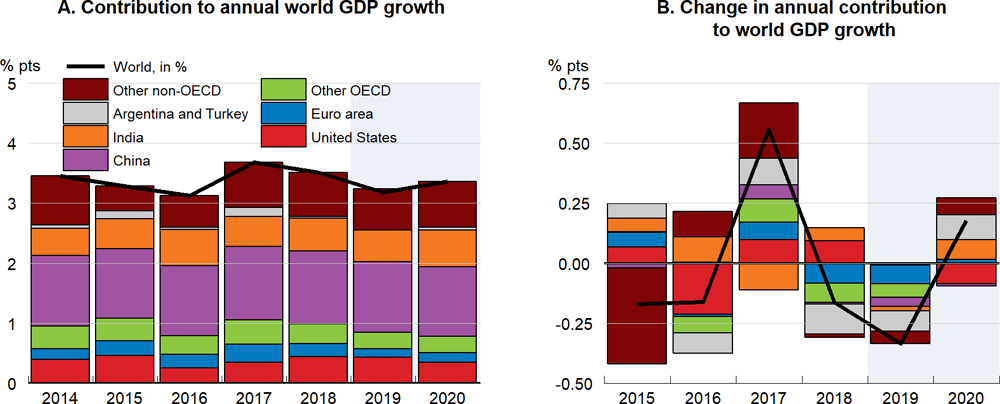
Note: Calculated using PPP weights.
Source: OECD Economic Outlook 105 database; and OECD calculations.
In the advanced economies, improved labour market conditions, lower headline inflation and, in some countries, modest supportive fiscal measures targeted at lower-income households and strong minimum wage increases should help to support real income growth and household spending. Sustained monetary policy support also continues to underpin activity. However, overall, fiscal policy appears set to offer less support than desirable in most countries; in the median OECD economy, fiscal easing is projected to remain modest at around 0.3% of GDP in 2019, with little further easing projected in 2020 (see below).
-
GDP growth in the United States is projected to moderate to around 2¾ per cent in 2019 and 2¼ per cent in 2020 as the support from fiscal easing slowly fades. Solid labour market outcomes and supportive financial conditions continue to underpin household incomes and spending, but higher tariffs are adding to business costs and prices, and the growth of business investment and exports has moderated.
-
GDP growth in Japan is set to remain at around 0.7% per annum in 2019 and 2020. Severe labour shortages and capacity constraints continue to stimulate investment, but confidence has eased and export growth has weakened. Stronger social spending and a temporary boost to public investment will cushion the immediate impact of the scheduled increase in the consumption tax rate in October 2019, but fiscal consolidation efforts are set to resume in 2020.
-
GDP growth in the euro area is projected to remain moderate, at just under 1¼ per cent in 2019 and between 1¼ and 1½ per cent in 2020. Wage growth and accommodative macroeconomic policies, including modest fiscal easing, provide support for household spending, but policy uncertainty, weak external demand and low confidence are likely to weigh on investment and trade growth.
Growth prospects in the emerging-market economies are collectively projected to be broadly steady over 2019-20, but this masks diverging developments in the major economies. The pause in monetary policy normalisation in the advanced economies and lower oil prices have reduced near-term risks, but weak global trade, and significant adjustment challenges from past financial market tensions continue to impede growth in many countries.
-
GDP growth in China is projected to moderate gradually to 6% by 2020. Import, investment and credit growth have slowed and trade tensions are adding to uncertainty, but new fiscal and quasi-fiscal stimulus measures are being implemented and monetary policy has eased. The extent and effectiveness of the new fiscal measures are difficult to gauge, but could amount to around 1% of GDP this year if local governments fully utilise the increase in their special bond quota (equivalent to ¾ per cent of GDP) to finance infrastructure spending. Scope remains for further policy support if required, but this would add to the challenges in achieving the necessary deleveraging of the corporate sector and aggravate risks to financial stability.
-
GDP growth in India is projected to strengthen to close to 7¼ per cent in FY 2019 and close to 7½ per cent in FY 2020, with improved financial conditions, fiscal and quasi-fiscal stimulus, including new income support measures for rural farmers, and recent structural reforms all helping to support domestic demand.
-
A gradual recovery is set to continue in Brazil, with GDP growth projected to pick up to around 1½ per cent this year and 2¼ per cent in 2020. Low inflation and improving labour markets provide support for private consumption, and successful implementation of reforms, particularly the pension reform, would help to reduce uncertainty and enhance investment.
Global trade and investment growth are projected to remain subdued
Global trade volume growth (goods plus services) is projected to slow further in 2019, to around 2%, before increasing to around 3% next year. At this pace, trade intensity would not only remain weak by pre-crisis standards, but would be below the average pace achieved over 2012-18 (Figure 1.8). The slowdown in trade growth this year is projected to be broad-based across economies, with the largest contributions coming from Asia and North America, together with a further easing in Europe. As in 2015-16, a sharp slowdown in trade growth in China is a key contributor to the overall softness of global trade. Import volumes in China are projected to rise by around 3¼ per cent per annum in 2019-20, after having risen by around 7½ per cent per annum on average in 2017-18. A prolonged period of heightened trade barriers between the United States and China in 2019, or the introduction of new trade restrictions, would reduce trade growth further in 2019 and 2020 (see below).
The weak projected pace of trade growth is consistent with the subdued outlook for investment in many economies. Recent survey indicators generally suggest that investment prospects are easing, despite significant capacity constraints in countries such as Japan and Germany. Production of capital goods is also currently weak in the major OECD economies. Continued policy uncertainty, skills and infrastructure shortages (European Investment Bank, 2018), a step-down in expectations of future global GDP growth, and a decline in business dynamism in some countries are all factors that reduce incentives to invest. In the OECD area, business investment growth is projected to ease to around 1¾ per cent per annum on average over 2019-20, from 3½ per cent per annum during 2017-18.
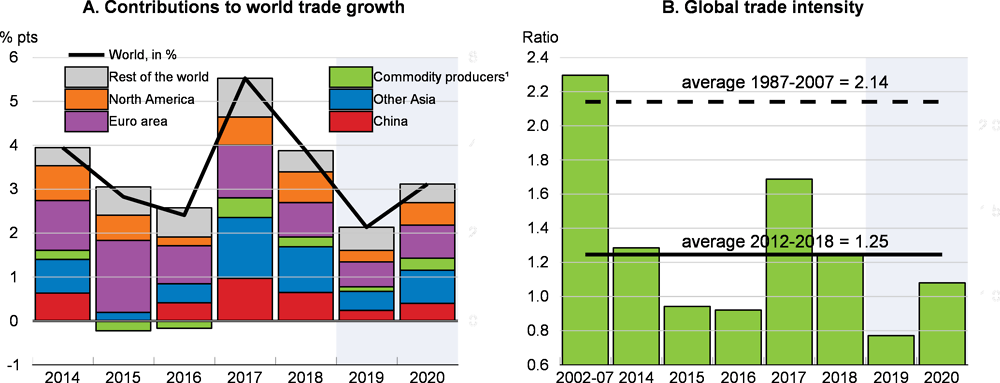
1. Commodity producers include Argentina, Australia, Brazil, Chile, Colombia, Indonesia, Norway, New Zealand, Russia, Saudi Arabia, South Africa and other oil-producing countries.
2. World trade volumes for goods plus services; global GDP at constant prices and market exchange rates. Period averages are the ratio of average annual world trade growth to average annual GDP growth in the period shown.
Source: OECD Economic Outlook 105 database; and OECD calculations.
Labour markets remain supportive and wage growth is rising modestly
Labour market conditions are continuing to improve in most OECD economies, despite the slowdown in output growth. The OECD-wide claimant unemployment rate is at its lowest level since 1980, and in the OECD economies as a whole, employment and participation rates have risen markedly in the past five decades, helped by past reforms that have boosted job creation, lowered barriers to labour force participation, and limited pathways to early retirement. Nonetheless, in the median OECD economy, aggregate participation and employment rates are only around 1 percentage point above their levels in 2007, prior to the financial crisis (Figure 1.9), and the quality of new job creation has not always matched the quantity.
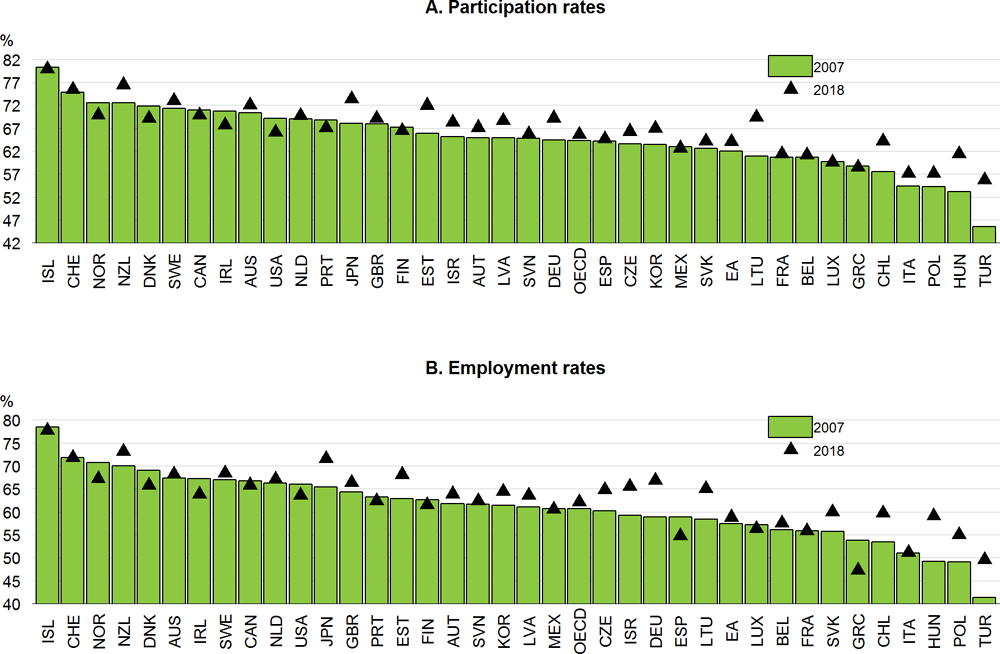
Note: As a per cent of the population aged 15-74 years.
Source: OECD Economic Outlook 105 database.
Outcomes have differed markedly across economies. In some, including Japan and Germany, both employment and participation rates have risen steadily over the past decade, and are now several percentage points higher than in 2007. Other countries, such as Sweden, Australia and New Zealand, already among the countries with the highest participation and employment rates in 2007, have also seen further improvements since then. In contrast, in the United States, amongst the best performing countries in 2007, employment and participation rates declined by 2-3 percentage points between 2007 and 2018. Amongst the countries with lower participation and employment rates in 2007, significant improvements have occurred in Turkey, Hungary, Poland and Chile, but little overall change has occurred in a number of other countries, including Italy and France, despite recent improvements in employment growth.
Steady employment growth is set to continue in most economies in 2019-20, albeit at a moderate pace. OECD-wide employment growth is projected to be around 0.9% per annum on average, down from 1½ per cent per annum in 2017-18. While this will help to support household incomes in the near term, the counterpart, given subdued output growth, is a continuation of very weak labour productivity growth for a further period, with adverse implications for medium-term growth prospects.
Nominal wage growth has begun to pick up in most OECD economies, but real wage growth remains moderate, in part due to still-modest labour productivity growth (Figure 1.10). Nonetheless, signs remain that spare capacity is diminishing, with unemployment rates in many advanced economies now below estimated sustainable rates and survey indicators still pointing to labour shortages, particularly for higher-skilled workers. Overall, in the median OECD economy, real wages are projected to rise by just over 1.3% per annum on average in 2019-20, up from around ¾ per cent per annum on average in 2017-18. Such an outcome would be much weaker than in the decade prior to the crisis, where real wage growth was closer to 2% per annum in the median OECD economy. Real wage growth is projected to be relatively robust in Germany, the United States and several Central European economies reflecting tight labour market conditions, as well as Korea, where minimum wages are being raised by a further 11% this year.
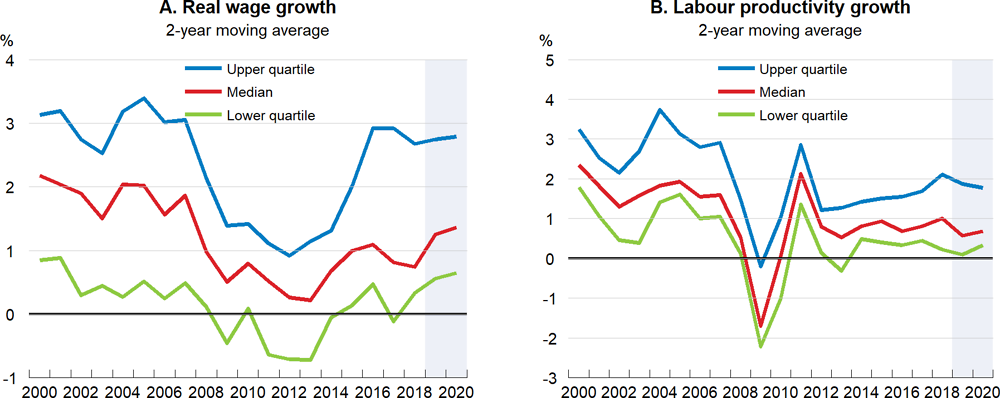
Note: Based on a sample of 33 OECD economies. Real wages are measured as compensation per employee deflated by the private consumption deflator. Labour productivity is measured as output per person employed.
Source: OECD Economic Outlook 105 database; and OECD calculations.
Inflation is set to remain moderate
Amongst the advanced economies, headline consumer price inflation in the median economy is projected to decline to 1½ per cent in 2019 (reflecting lower commodity prices) and increase slightly in 2020 to around 2% (Figure 1.11, Panel A). In the United States, where spare capacity remains limited but economic growth is moderating, inflation is likely to rise only slowly, to around 2¼ per cent by the end of 2020. In Japan, inflation is also projected to increase, but this will largely reflect the increase in the consumption tax rate; excluding the impact of the consumption tax increase, inflation is set to rise to only around 1% in 2020. In contrast, in the euro area, headline inflation is projected to decline from 2018 due to weak aggregate demand pressures and lower energy prices, with core inflation edging up to just below 1½ per cent by the end of 2020.
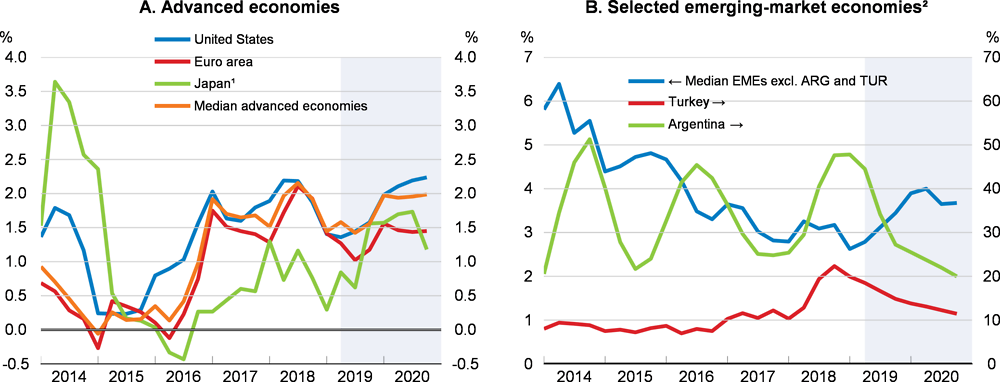
1. Inflation is not adjusted for changes in the consumption tax rates.
2. Selected emerging-market economies (EMEs) include: Argentina, Brazil, Chile, China, Costa Rica, India, Indonesia, Mexico, Russia, South Africa and Turkey.
Source: OECD Economic Outlook 105 database; and OECD calculations.
The prolonged period of very low inflation in the euro area seems to reflect persistent hysteresis effects, resulting in subdued aggregate demand growth, still sizeable under-employment and a slight decline in inflation expectations.3 There has been a persistent change in the distribution of individual prices of goods and services since the start of the global financial crisis. The share of goods and services with positive but low annual inflation rates (below 1.5%) has risen substantially and that of goods and services with relatively high inflation rates (above 2.5%) has declined (Figure 1.12, Panel A). This change was particularly large in Italy and, thus, is linked with a change in the contributions of individual countries to area-wide inflation. Countries that were the hardest hit by recessions have had subdued inflation in recent years, and contributed significantly less to euro area inflation than prior to the crisis when their economies were booming (Figure 1.12, Panel B).
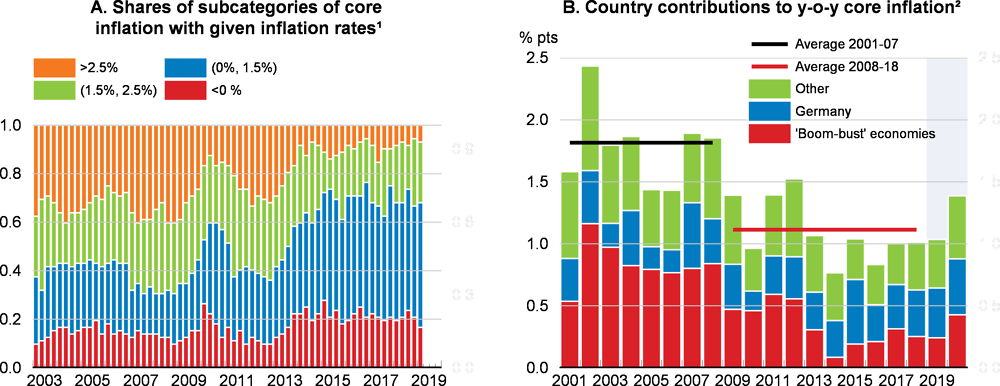
1. Calculations are based on 72 subcategories of the core harmonised consumer prices index for the euro area. Core indices exclude food and energy.
2. Contributions to the euro area-wide core inflation. “Boom-bust” euro area economies include: Greece, Ireland, Italy, Portugal and Spain.
Source: Eurostat; OECD Economic Outlook 105 database; and OECD calculations.
The link between aggregate domestic economic activity and inflation has not been very strong. There is evidence that inflation rates of only some individual categories of goods and services react to aggregate capacity measures.4 This may suggest that for many goods and services, technological progress, product-specific demand pressures, international trade, and competition in the domestic retail sector may be more relevant for price dynamics than economy-wide capacity utilisation measures and general inflation expectations. Thus, aggregate inflation may be a poor indicator of the price pressures stemming from aggregate cyclical activity.
In many emerging-market economies, consumer price inflation is also expected to remain relatively stable close to recent historically moderate levels (Figure 1.11, Panel B). The main exceptions are Argentina and Turkey, where inflation has shot up due to large depreciations of the domestic currencies. With a gradual easing of imported inflation, consumer price inflation should also decline gradually. However, headline inflation in these two economies is still projected to remain in double digits until the end of 2020.
copy the linklink copied!Key issues and risks
The balance of risks remains on the downside. Concern about negative risks may be already weighing on confidence and adding to uncertainty, and thus discouraging investment and trade. Growth outcomes would be weaker still if downside risks were to occur or interact, including from further steps to raise trade barriers, persisting policy uncertainty and prolonged sub-par growth in Europe, a disorderly Brexit, a sharper slowdown in China, and renewed financial market repricing. On the other hand, if these risks were to be addressed, thus providing businesses and households with greater confidence about the future, the economic outlook would be stronger than currently anticipated.
An intensification of trade restrictions would have significant costs
Continued uncertainty about trade policies remains a significant source of downside risks to global investment, jobs and living standards. Higher trade restrictions reduce living standards for consumers, particularly lower-income households, and add to production costs for businesses. The projections assume that the tariff increases imposed by the United States and China in 2018 are maintained, but do not incorporate the additional bilateral measures announced this May, or possible further extensions, given the uncertainties about how US-China trade arrangements may evolve. However, this points to sizeable downside risks for output and trade growth (see below). On the other hand, if the United States and China succeed in concluding a trade agreement in the near term, the tariff increases imposed in 2018 and this year could be reversed, providing a modest stimulus to growth, trade and household real incomes, although the overall global welfare gains under managed trade are likely to be lower than under free trade.
The tariffs imposed by the United States and China in 2018, which are incorporated in the projections, have already started to slow growth and add to inflation. By 2021, the level of output in the United States and China is estimated to be around 0.2-0.3% lower than otherwise, with world trade reduced by around 0.4% (OECD, 2018a). US consumer price inflation is also being raised, by around 0.2 percentage point in both 2019 and 2020.
The new round of tariff increases announced in May could add to these effects considerably if they are maintained, with the United States raising the tariffs on USD 200 billion of merchandise imports from China from 10% to 25% and China taking equivalent retaliatory action on USD 60 billion of merchandise imports from the United States. There is also a risk of additional tariffs being implemented in the future, covering the full spectrum of trade between the United States and China.
Simulations on the NiGEM global macro-model illustrate the potential additional adverse effects that the newly-announced tariff measures and possible further extensions may have on global output and trade, and the extent to which these would be magnified if they heightened uncertainty further (Figure 1.13).
-
The new measures announced this May, if maintained, are estimated to potentially reduce GDP further in the United States and China by an additional 0.2-0.3% on average by 2021 and 2022 (relative to baseline), with US consumer prices pushed up by a further 0.3% in 2020. This would double the impact of the tariff increases introduced during 2018.
-
Under a hypothetical scenario in which the United States and China impose 25% tariffs on all remaining bilateral trade (assumed to occur from July this year), the short-term costs are considerably higher and broader. Global trade would be close to 1% below baseline by 2021, with import volumes in the United States and China declining by around 2%. Output would also decline, by around 0.6% relative to baseline in the United States and 0.8% in China. Close trading partners would also start to be adversely affected, as demand contracts in two major export markets.
-
Further uncertainty about trade policies, and a growing concern that new restrictions might be applied on a much wider range of items affecting many economies, is likely to check business investment plans around the world. A rise of 50 basis points in investment risk premia in all countries for three years would raise the cost of capital and add to the negative effects on output from tariffs, with the level of global GDP 0.7% below baseline by 2021 and global trade declining by around 1½ per cent. OECD-wide business investment would decline by around 2½ per cent by 2021, with investment down by around 3¼ per cent in the United States.
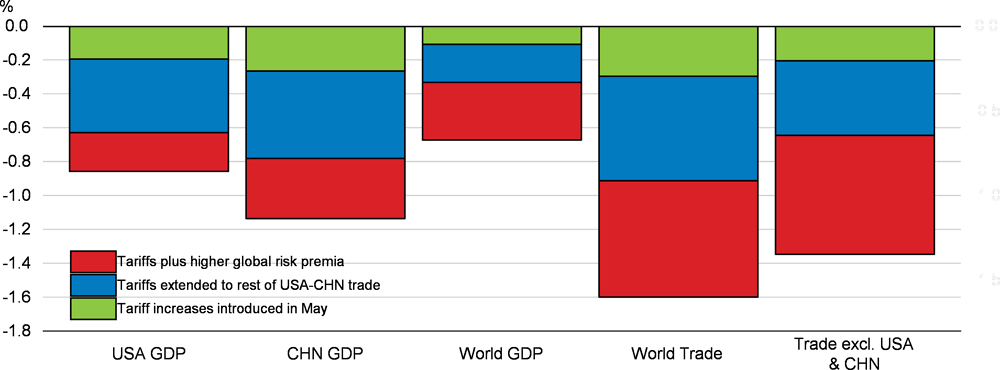
Note: The first scenario shows the impact of the United States raising tariffs on USD 200 billion of imports from China from 10% to 25% from mid-May 2019 (with reciprocal action by China on USD 60 billion of imports from the United States). The second scenario shows the additional impact if tariffs of 25% are imposed on all remaining bilateral non-commodity trade between China and the United States from July 2019. The final scenario adds in the impact from a global rise of 50 basis points in investment risk premia that persists for three years before slowly fading thereafter. All tariff shocks are maintained for six years. Based on simulations on NiGEM in forward-looking mode.
Source: OECD calculations.
Risks also remain that other new restrictive measures could be implemented later in 2019, affecting a broader range of countries or targeting specific products. The possibility of new US restrictions in specific trade-sensitive sectors such as cars and car parts is a particular concern, given the significant cross-country value-chain linkages in this sector and the scale of trade, especially in Europe. Such measures could add considerably to the costs of the tariff increases imposed so far and adversely affect business investment plans around the world.
The decline in trade intensity that results from the imposition of higher tariffs also has adverse effects on productivity and living standards in the medium term via lower competition, reduced scope for specialisation, and the slower diffusion of ideas across national borders (Haugh et al., 2016; Guillemette and Turner, 2018). In contrast, steps to lower tariffs, reduce unnecessary costs from non-tariff measures and liberalise trade in services would bring widespread gains (OECD, 2019a; OECD, 2019b).
Brexit-related uncertainties still persist
Uncertainty remains about the nature of the UK-EU trading relationship in the short and medium term as well as the timing of the withdrawal of the United Kingdom from the European Union (Brexit). The possibility that a withdrawal agreement will not be reached before the newly-extended exit date still remains a serious downside risk and near-term source of uncertainty. The current projections for UK GDP growth are conditional on the assumption of a smooth Brexit, with a transition period lasting until the end of 2020.
If the United Kingdom and the European Union were to separate without an agreement, the outlook would be significantly weaker. OECD analysis suggests that the increase in tariffs between the two economies from WTO rules coming into effect would further reduce GDP by around 2% (relative to baseline) in the United Kingdom in the next two years (Kierzenkowski et al., 2016). This would add to the adverse effects on GDP and business investment already seen relative to expectations prior to the vote in 2016.
The effects could be stronger still if a lack of adequate border infrastructure and a loss of access to EU trade arrangements with third countries were to cause serious bottlenecks in integrated cross-border supply chains. The costs would also be magnified if this also induced a decline in business and financial market confidence and disruptions in financial markets. In such a scenario, the likely adverse effects in the United Kingdom would generate sizeable negative spillovers on growth in other countries. Although contingency measures to soften the impact of a no-deal outcome are being taken by both sides, separation from the EU without an agreement would still be a major adverse shock, given that the United Kingdom is an important trading partner for many countries.
In the European Union, the impact of any scenario that resulted in trade between the United Kingdom and the European Union being undertaken on WTO terms would vary across member states. Some smaller countries with strong trade and investment links with the United Kingdom would be relatively exposed, including Ireland, the Netherlands and Denmark, resulting in significant adjustment costs in particular regions or sectors. OECD estimates suggest that their bilateral exports to the United Kingdom could decline by around 15% in the medium term in the event of trade being undertaken on WTO terms, with the strongest impacts being in the agri-food and machinery and equipment sectors (Arriola et al., 2018; Smith et al., 2018; Smith et al., 2019).
The slowdown in China and spillovers to the rest of the world
The baseline projections for China assume that the policy stimulus measures now being undertaken will offset the underlying softness in trade and private demand seen in recent months and prevent a sharp slowdown in growth. While signs have started to emerge that growth is now stabilising, risks remain that renewed policy stimulus either proves to be insufficient or less effective than anticipated. A much sharper unexpected slowdown in China would have significant adverse consequences for global growth and trade given the rising trade and financial linkages China now has around the world.
A key feature of the experience in 2015-16, when global trade and output growth also slowed markedly, was the extent to which weaker domestic demand growth in China resulted in a sharp slowdown in Chinese import volume growth. In turn, this reduced export volume growth and GDP growth in all economies.5 The slowdown in China was also reflected in global financial markets, with risk premia widening on corporate and emerging-market bond spreads during 2015-16, and global equity prices declining by around 10%. Illustrative simulations, using the NiGEM global macroeconomic model, highlight the adverse effects that a repeat of such developments might have on global growth and trade.
-
By itself, an unanticipated decline of 2 percentage points in the growth rate of domestic demand in China for two years could lower global GDP growth by close to 0.4 percentage point per annum, with the impact on Japan, commodity-producing economies and other economies in East Asia being higher than elsewhere (Figure 1.14, Panel A). Chinese import volume growth could decline by around 3¼ percentage points per annum on average in the first two years, hitting export volume growth in key trading partners, including Germany and many Asian economies (Figure 1.14, Panel B).
-
Greater uncertainty could add to these costs significantly, particularly in the advanced economies, by raising investment risk premia in financial markets and the cost of capital for companies. A fall in equity prices would further raise the cost of capital and also slow consumers’ expenditure through adverse effects on household wealth. Incorporating an additional rise of 50 basis points in global investment risk premia and a decline of 10% in global equity prices for two years, the combined shock reduces global GDP growth by 0.7 percentage point per annum on average in the first two years and global trade growth by close to 1½ per cent per annum. The financial shocks add significantly to the cost of the initial demand shock in many advanced economies, although neighbouring economies in Asia continue to be the most heavily affected.
-
Spillovers from the slowdown from China would be larger still if monetary policymakers around the world were not able to react because of limited policy space. If policy interest rates were fixed, the overall impact of the combined set of shocks would rise further, hitting global GDP growth by 0.8-0.9 percentage points per annum over the first two years, and lowering global trade growth by 1¾ percentage points per annum on average in the same period.
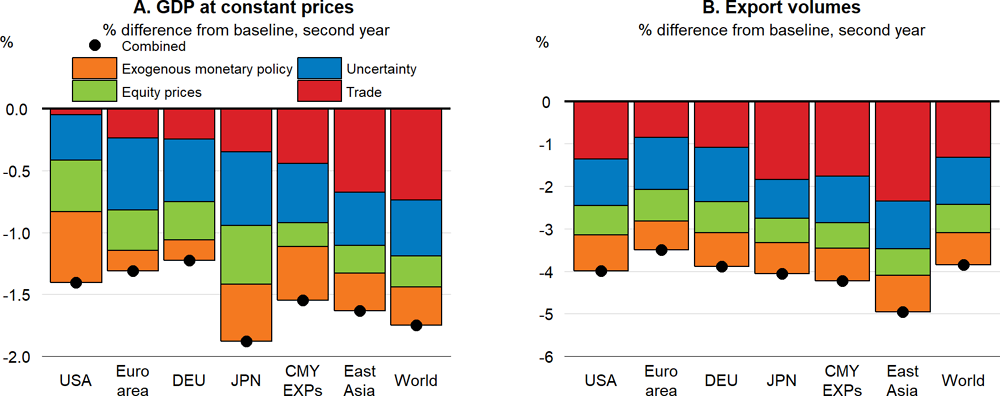
Note: Simulated impact of a two-year decline of 2 percentage points per annum in domestic demand growth in China, and a rise of 50 basis points in investment risk premia and decline of 10% in equity prices in all economies. The red bars show the contribution from the direct slowdown in trade; the blue bars show the additional contribution from adding higher uncertainty; the green bars show the contribution from lower equity prices; and the orange bar shows the additional effects if monetary policy is not able to act. Commodity exporting economies (CMY EXPs) include Argentina, Brazil, Chile, Indonesia, Russia, South Africa and other non-OECD oil-producing economies. East Asia includes Korea and the Dynamic Asian Economies.
Source: OECD calculations using NiGEM.
In contrast to trade, China’s integration into global financial markets remains modest (Figure 1.15).6 The exposures of advanced economies via financial assets are not large, with a few exceptions, including the United Kingdom, Korea and Australia and some financial centres (including Luxembourg, Singapore and Ireland), and are more important for equities than debt securities.7 For most advanced economies, bank exposures to China are also small both in absolute terms and relative to exposures to all other EMEs and to other individual large advanced economies. However, the ultimate aggregate exposures could be larger if exposures via financial centres are fully taken into account. Moreover, even if national exposures are small, individual financial institutions can still be vulnerable to developments in China; if such institutions are large and strongly interlinked with other domestic and global institutions, negative China-related shocks could spread widely.
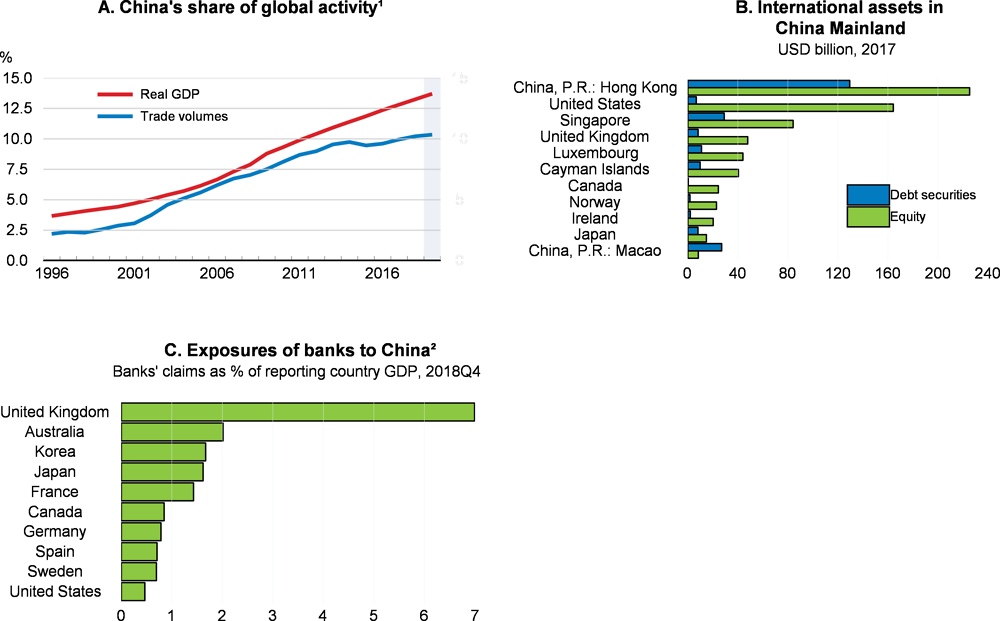
1. Global GDP and trade in goods and services are measured at constant prices and market exchange rates. Trade in goods and services is measured as the average of import and export volumes.
2. Ultimate risk basis.
Source: Bank for International Settlements; IMF Coordinated Portfolio Investment Survey (CPIS); OECD Economic Outlook 105 database; and OECD calculations.
Financial vulnerabilities remain from high private debt and poor credit quality
High debt of non-financial corporations and its deteriorating quality could pose a risk to financial stability in a weakening economic environment. In the context of highly accommodative monetary policy, the debt-to-GDP ratio of non-financial corporations has increased in many advanced economies; in some cases, exceeding the prior historical peaks reached in 2008 (Figure 1.16; OECD, 2017). This increase took place on the back of a notable surge in bond financing.8 In addition, strong risk appetite and loose financial conditions contributed to a deterioration in corporate credit quality (Box 1.2). Even if interest rates remain low for longer than previously expected, solvency risks associated with high debt have increased due to the current global slowdown, which is likely to reduce firms’ revenue growth. Corporate stress could trigger a change in investors’ risk appetite and result in widespread sell-offs in corporate bonds. Even limited market shocks have the potential to produce large price corrections because non-investment-grade corporate debt is typically much less liquid. The current composition of corporate bonds may also increase the risk of fire-sales, as a high share of corporate bonds is rated just above non-investment grade (Çelik and Isaksson, 2019; Figure 1.17, Panel B). If these bonds are downgraded to non-investment grade, institutional investors who are bound by rating-based regulatory requirements will be obliged to sell them.
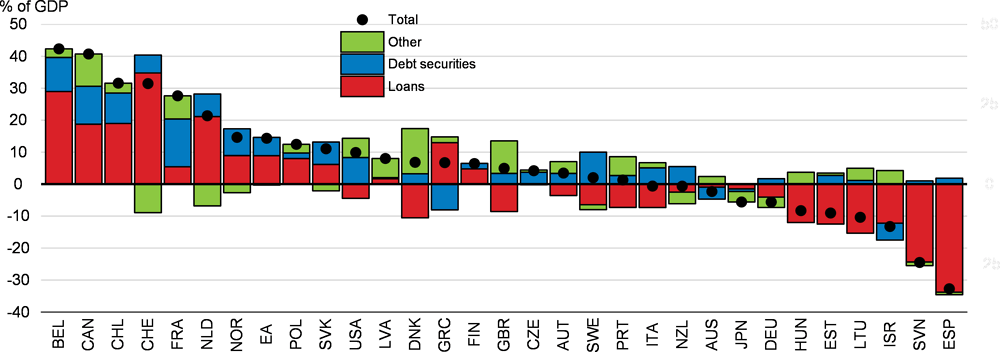
Note: On a consolidated basis, except for Canada, the euro area, Japan, New Zealand, Switzerland and the United States.
Source: OECD Economic Outlook 105 database; OECD National accounts database; and OECD calculations.
Since the financial crisis, strong risk appetite and loose financial conditions have contributed to a surge in sub-investment grade assets, such as high-yield bonds and floating-interest-rate leveraged loans (Figure 1.17). In bond markets, there has been a strong issuance of high-risk debt securities and a weakening of covenants, i.e. the legal provisions to protect investors in the event of a default or restructuring, including in emerging-market economies (Çelik and Isaksson, 2019). This makes it more difficult for investors to prevent losses.
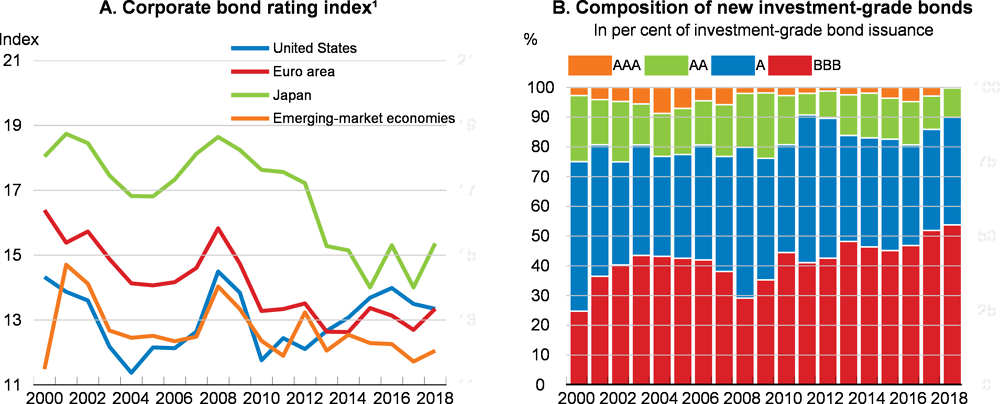
1. The lower the value of the index, the lower the quality of bonds.
Source: Çelik and Isaksson (2019), “Corporate Bond Markets in a Time of Unconventional Monetary Policy”, OECD Capital Market Series, OECD Publishing, Paris.
Leveraged loans in the main advanced economies have increased rapidly over recent years to an estimated USD 1.3 trillion. However, this figure includes only leveraged loans that are sufficiently large and traded to be captured within industry indexes such as the S&P Global Levered Loan Index. A more comprehensive assessment of the full leveraged loan market indicates that the loans outstanding are currently above USD 2.1 trillion (2½ per cent of global GDP in 2018) (Figure 1.18; Patalano and Roulet, 2019). Leveraged loans have often been issued on the basis of fragile business metrics such as earnings “add-backs”.1 These could underestimate actual leverage ratios and circumvent covenants that limit additional debt. Around 60% of leveraged loans are “covenant-lite” and, despite protecting investors from interest rate risk, they tend to be riskier than high-yield bonds, as they offer lower call protection,2 poorer liquidity and more limited transparency and regulation in case of a default (Bank of England, 2018). A sizeable share of leveraged loans at a global level are bundled in collateralised loan obligations (CLOs), and sold to investors, including investment funds and insurance companies.3
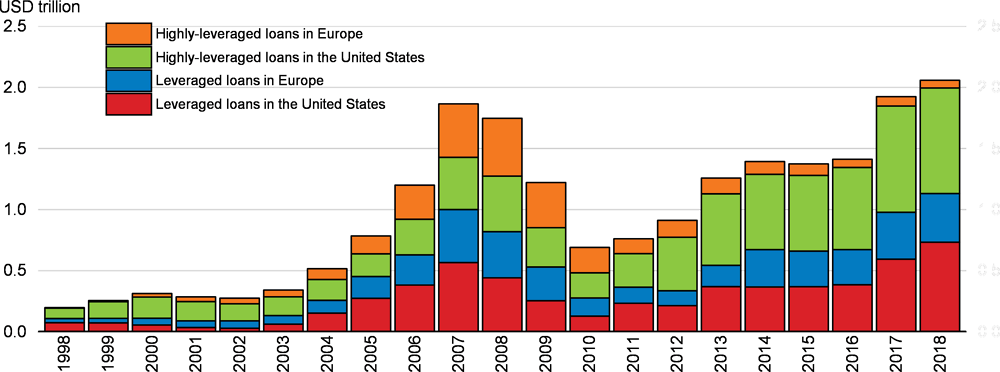
Note: The outstanding amount is calculated based on loan issuance but excludes the value of drawn and undrawn revolving credit facilities. A linear amortisation schedule is assumed for term loans and other amortising loans (i.e. mortgages, equipment, construction and commercial loans). All other term loans are not amortised as they are repayable at maturity. To account for loan re-financing, a 40% early repayment ratio is assumed.
Source: Patalano, R., D. and C. Roulet (2019), "Structural Developments in Financial Intermediation: The Rise of Debt and Non-Bank Credit Intermediation", OECD Working Paper, forthcoming, OECD Publishing, Paris.
← 1. Earnings “add-backs” are adjustments to company earnings before interest, taxes, depreciation and amortisation (EBITDA) used to gain access to debt markets. They include future cost savings or increases in sales that are not set to materialise in the short term. Add-backs in the past years have become an accepted part of the loan syndication process, as – in principle – they should provide a more realistic view about the company’s future ability to service its borrowing.
← 2. Leveraged loans are continuously callable at par. Therefore, their price stays at or near par during a strong market environment, limiting possible upside price surprises.
← 3. Around 45% of the stock of global leveraged loans in institutional investors’ portfolios are held through collateralised loan obligations (CLOs), and 30% by investment funds and insurance companies. The remaining share is unallocated, because it is unclear who the end-investors are (Bank of England, 2018).
An apparent disconnect between recent equity market dynamics and projected corporate fundamentals may signal a risk of correction. It also underlines how sensitive these markets have become to changes in expectations of future interest rates. Since January 2019, stock markets have picked up once again, on the back of a rebound in investor sentiment, though this was dented in May by renewed trade tensions between China and the United States (Figure 1.19, Panel A). In the major advanced economies, the increase in equity prices was partly a reaction to central banks’ communication implying that policy interest rates were likely to be lower for longer. However, at the same time, expected corporate earnings growth has continued to be revised down (Figure 1.19, Panel B), due to projections of weaker economic growth, increased labour cost pressures on profit margins and, in the United States, the waning effects of the corporate tax reduction.
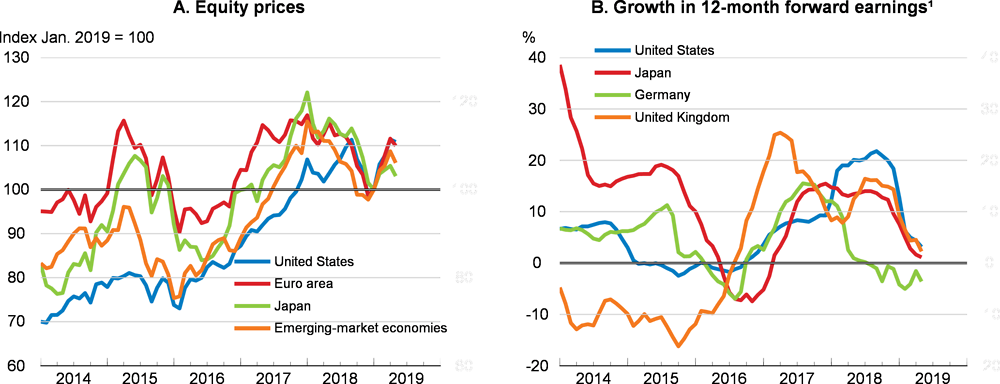
1. Earnings are 12-month forward forecasts from the IBES.
Source: Refinitiv; and OECD calculations.
Financial conditions in emerging-market economies have improved this year, but vulnerabilities persist. Many emerging-market economies experienced financial stress in 2018, reflecting both US monetary policy normalisation and idiosyncratic domestic factors. After key central banks in advanced economies signalled a pause in the normalisation of monetary policy, tensions eased in many countries, with their currencies recovering part of the 2018 losses vis-à-vis the US dollar and signs that capital inflows have picked up (Figure 1.20). Despite these improvements, emerging-market economies remain vulnerable to a widespread reduction in risk appetite in the context of trade tensions and weak global economic growth. Vulnerabilities stem from various imbalances related to current account deficits, foreign currency-denominated debt and a rapid increase in the debt of non-financial corporations.9
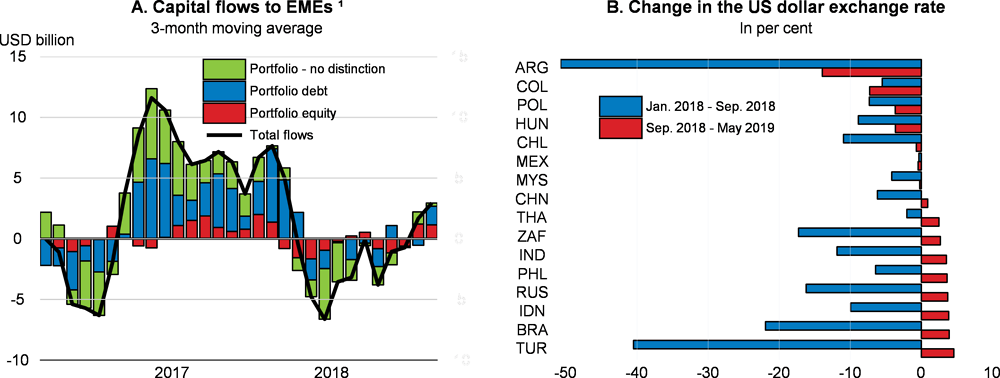
1. Capital flows by non-residents (international liabilities) for a subgroup of emerging-market economies (EMEs) for which monthly capital flow series are available (Argentina, Brazil, Bulgaria, Chile, Hungary, India, Pakistan, the Philippines, Poland, Romania, Turkey and Ukraine).
Source: Refinitiv; and OECD calculations.
Financial stress has intensified in Turkey and Argentina amid increased political uncertainty and continued macroeconomic imbalances. In Turkey, bond yields and credit default swaps have risen considerably since the start of 2019 and the exchange rate has weakened again. The country’s large external financing needs and dwindling net foreign exchange reserves represent a significant risk in event of a further depreciation of the national currency.10 Risks also remain high in Argentina, where the benchmark interest rate has increased sharply, as the monetary policy framework to keep base money constant was extended to support the peso after it hit a record low against the US dollar, and to reduce inflation.
copy the linklink copied!Policy considerations
Policymakers need to act to ensure sufficient support for demand, prevent downside risks from materialising, enhance resilience and strengthen medium-term growth prospects. The projected near-term weakness in the euro area warrants a combination of policy responses among member countries. In the event of an even sharper global growth slowdown than projected, co-ordinated policy action within countries and across countries would provide the most effective counterweight. Preparing for such an eventuality now by planning additional growth-enhancing measures that can be rolled out rapidly would increase the effectiveness of policy response.
Monetary policy considerations
In the main advanced economies, given rising uncertainty, contained inflation and weaker growth prospects, the monetary authorities have either paused policy normalisation or added modest stimulus, with monetary policy remaining highly accommodative (Figure 1.21):
-
In the United States, the more uncertain economic outlook and already advanced stage of policy normalisation, together with uncertainties about the longer-term level of equilibrium interest rates, justify the Federal Reserve’s decision to pause further interest rate increases. If downside risks materialise and the economy and inflation slow more than currently projected, the monetary policy stance could be eased. On the other hand, if economic growth and inflation turn out to be stronger than anticipated and downside risks dissipate, further interest rate increases would be required. The Federal Reserve has also decided to slow the pace at which it reduces its holdings of US Treasury securities between May and September and subsequently to keep them constant by reinvesting all maturing securities.11 Thus, monetary policy implementation will continue to operate with an ample supply of excess reserves (the so-called floor system).
-
In the euro area, the ECB has strengthened forward guidance regarding policy interest rates and announced that it expects them to remain at present levels at least until the end of 2019 (compared with summer 2019 communicated previously). After ceasing net asset purchases in December 2018, the ECB committed to reinvest the principal payments from maturing securities until well past the date when it started raising policy interest rates. The monetary authorities also announced new targeted longer-term refinancing operations (TLTROs), to be launched in September, to replace a similar scheme that is about to expire, as some banks could find it too costly to access wholesale markets for funding.
-
The Bank of Japan has maintained the negative policy rate, continued to purchase assets to fix the 10-year government bond yield at close to zero and strengthened forward guidance by announcing that it intends to maintain interest rates low for a prolonged period, at least until around spring 2020. The Bank of Japan has also extended the special funding schemes for banks.
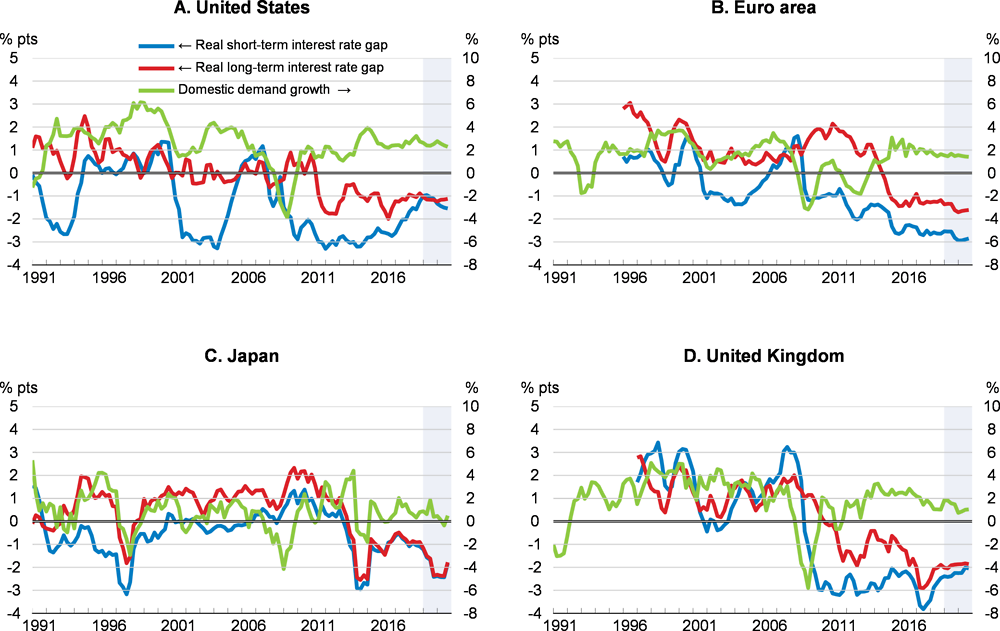
Note: The real interest rate gap is the difference between the real interest rate and year-on-year real potential GDP growth, as a proxy of the neutral interest rate. The real interest rate is calculated as either a short or long-term interest rate minus year-on-year core consumer price inflation (i.e. consumer price inflation excluding prices of food and energy). In Japan, inflation is not corrected for the effects of increases in consumption tax rates. All data are at quarterly frequency. Domestic demand growth is the year-on-year percentage change.
Source: OECD Economic Outlook 105 database; and OECD calculations.
In the euro area, the transmission of monetary policy could be made more effective by improving the profitability and balance sheets of banks. In this respect, supervisors and national authorities should increase efforts to accelerate the disposal of non-performing loans, as these still remain high in some banks. They should also encourage banks to address long-standing structural problems of low cost efficiency, limited revenue diversification and bank overcapacity (ECB, 2018). The potential side effects of sustained monetary stimulus on the profitability of the banking sector, via flat yield curves and negative interest rates on deposits at the ECB, should also continue to be evaluated, together with potential ways to alleviate these effects.
While prolonged monetary policy stimulus is warranted to return inflation to the target, it may involve undesirable side-effects, such as inflated asset prices and high debt. This can ultimately complicate the eventual normalisation of monetary policy as it may expose excesses and raise financial stability concerns. To minimise such side-effects, supervisory macroprudential policies should be actively used, even though there are concerns about their effectiveness (Box 1.3), and their implementation and calibration can be challenging. Their effectiveness depends on efficient micro and macro supervision and, where relevant, successful co-operation among different regulatory bodies.
Macroprudential policy tools have been used in many economies since the global financial crisis to make the financial system more resilient to shocks and to address emerging vulnerabilities. These tools supplement microprudential measures and supervision that aim to ensure that individual institutions are solid, which is a prerequisite for a sound financial system. In the environment of prolonged low inflation and low policy interest rates over the past decade, macroprudential policy tools have also been employed to help attenuate the negative side effects of accommodative monetary policy aimed at raising inflation closer to target.
Current macroprudential measures
Macroprudential policies can operate at either the lender or the borrower level. At the lender level, they are generally implemented through additional bank capital buffers (e.g. a capital conservation buffer, a countercyclical capital buffer or higher risk weights for specific exposures) alongside the introduction of the Basel III framework. The most commonly used macroprudential policy tools targeted at borrowers are loan-to-value (LTV), debt-to-income (DTI), and debt-service-to-income (DSTI) limits. They primarily apply to mortgage loans provided by banks, as the real estate sector is an important target of macroprudential policy, reflecting the destabilising effects of excessive housing-related lending in many countries in the past (Cournède et al., 2019).
To date, lender-based macroprudential policy instruments have been adopted in a number of countries, in both advanced and emerging-market economies, with the introduction of the Basel III framework. With some signs of the financial cycle maturing, several predominantly European countries have already activated countercyclical capital buffers and, in many of these countries, the buffers are to be increased (Table 1.2).1 In France, the buffer will be introduced in July 2019 and then raised to 0.5% of risk-weighted assets in April 2020, reflecting strong growth in the indebtedness of non-financial corporations and households. Notwithstanding increased use of such buffers, they are not applied in many large economies, including the United States, China, Japan and Germany.
As for borrower-based macroprudential policy tools, LTV limits are the most widely employed (Figure 1.22), particularly in countries with rapid mortgage credit and house price growth (Cournède et al., 2019). LTV limits are useful as the cap can be adjusted for different types of borrowers, such as first-time buyers, buyers of a second property or investors.2 Most of the countries using LTV limits combine them with either LTI or DTI/DSR/DSTI limits, and in four cases in Figure 1.22 all three limits are used. Still, several economies do not implement any statutory borrower-based regulatory measures although in some of them, like in the United States, regulators issue prudential guidance.
Effectiveness of macroprudential policy
Empirical evidence on the effectiveness of macroprudential policy is still limited and tentative. This partly reflects the short experience in using such measures. Most measures have been implemented in response to the last global financial crisis and have not been tested over a full financial cycle. However, tighter macroprudential policies are found to be associated with lower bank credit growth and house price inflation (Akinci and Olmstead-Rumsey, 2018). Measures intended to limit house price inflation are more effective in countries where bank finance is important (Akinci and Olmstead-Rumsey, 2018), but seem to be less effective in more developed and open economies, as their application comes with greater cross-border borrowing (Cerutti et al., 2017). Macroprudential measures, in particular LTV limits, seem to be more effective during booms than busts (Cerutti et al., 2017; Richter et al., 2018).
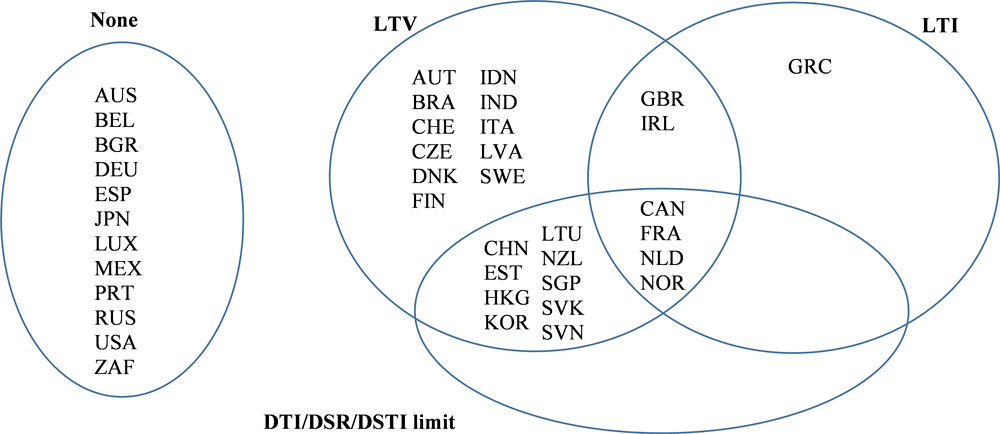
Note: LTV stands for loan-to-value, LTI stands for loan-to-income, DTI stands for debt-to-income, DSR stands for debt service ratio, and DSTI stands for debt-service-to-income. Only binding regulatory measures are shown; prudential guidance is not included.
Source: National authorities; European Systemic Risk Board; and Financial Stability Board.
← 1. In Switzerland, a capital surcharge is applied to mortgage loans.
← 2. For instance, in New Zealand, tighter LTV limits are imposed for investors (70%) than for owner-occupiers (80%). In Canada, borrowers with a new mortgage loan in specific geographic areas where housing prices have increased rapidly need to meet tighter LTV limits.
Fiscal and fiscal-structural policy considerations
In the majority of OECD economies, the fiscal policy stance is expected to be eased slightly in 2019-20, with the median easing over these two years combined of around 0.3% of potential GDP (Figure 1.23, Panel A).12 In some countries, this reflects an appropriate reaction to weaker economic growth. In the euro area, combined actions, involving renewed reform efforts and fiscal support where space exists, is needed (see below). Budget balances are expected to deteriorate in 2019-20 in nearly half of the OECD countries despite still falling net interest payments and some cyclical improvement in primary balances in a few cases (Figure 1.23, Panel B). Nonetheless, gross debt is set to decline relative to GDP in most countries, helped by nominal GDP growth, with a notable exception of the United States. Even so, in several countries, public debt and budget deficits will remain high (Figure 1.23, Panel C).
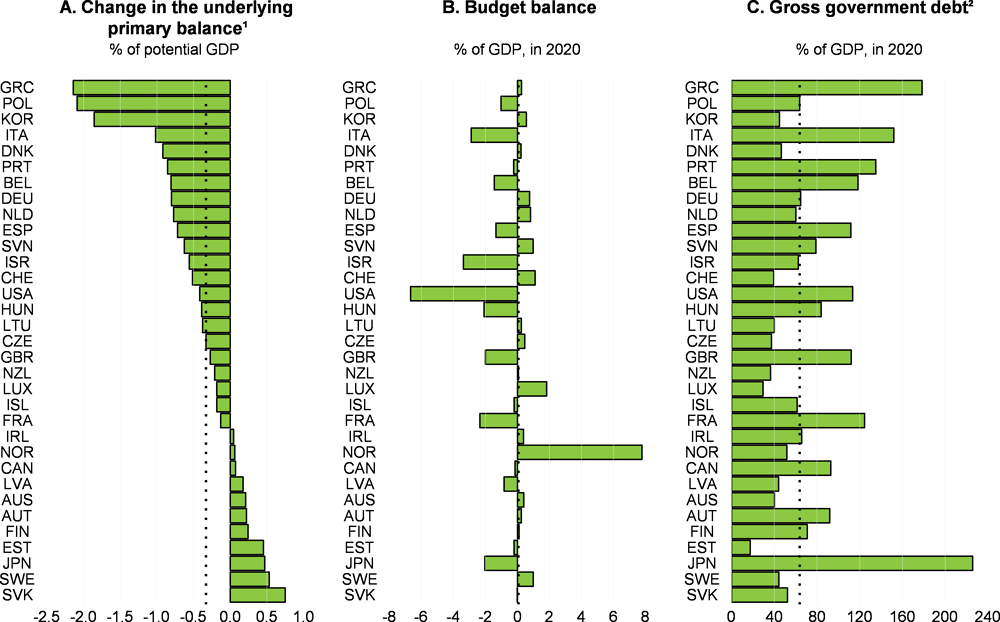
Note: Vertical lines show medians.
1. Change between 2018 and 2020.
2. Based on the national accounts definition.
Source: OECD Economic Outlook 105 database; and OECD calculations.
The appropriate stance of fiscal policy depends on policy needs and constraints, and thus differs across countries and areas. If downside risks for the global economy were to materialise, co-ordinated fiscal policies would be required more generally to help limit the downturn. As discussed below, there is scope in some economies to ease fiscal policy without compromising debt sustainability.
Assessing the need for fiscal easing for stabilisation purposes is inherently challenging, reflecting uncertainties about the real-time estimates of the cyclical position of the economy. In general, fiscal stimulus is desirable in countries with GDP below estimated potential output and unemployment above its estimated equilibrium level, particularly if the scope for additional monetary policy support is limited. This is still the case for many European countries. However, estimates of spare capacity are subject to considerable uncertainty and can be revised significantly, especially around major cyclical turning points. Even if spare capacity is limited, additional fiscal measures may be appropriate if inflation remains low, actual growth remains sluggish and there is significant need for new infrastructure, which is currently the case for some euro area countries. An expansionary fiscal stance in some countries could also help to address external imbalances, with fiscal easing offsetting large private financial surpluses and thus helping to reduce large current account surpluses.13
In many euro area and other advanced economies, fiscal room has expanded as a result of prolonged monetary policy stimulus. Despite rising debt-to-GDP ratios, government interest payments declined in relation to GDP between 2010 and 2018 in many OECD countries (Figure 1.24). This reflected both lower market interest rates and transfers of profits from central banks, which were boosted by interest earned from government bonds that they purchased, and nominal GDP growth. Together, macroeconomic and structural policies could provide additional support to the public finances by making it possible to achieve higher nominal GDP, particularly if the normalisation of monetary policy were to be delayed (Figure 1.25). In this context, implementing growth-enhancing structural reforms could contribute to such a favourable outcome, although in some countries government debt would still remain high in the longer term.14
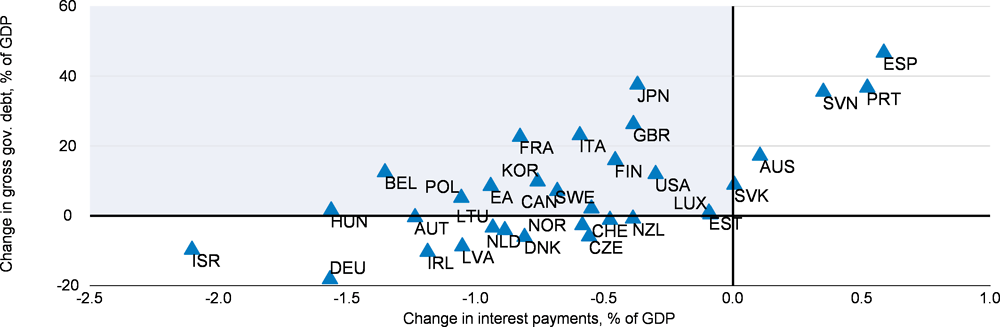
Source: OECD Economic Outlook105 database; and OECD calculations.
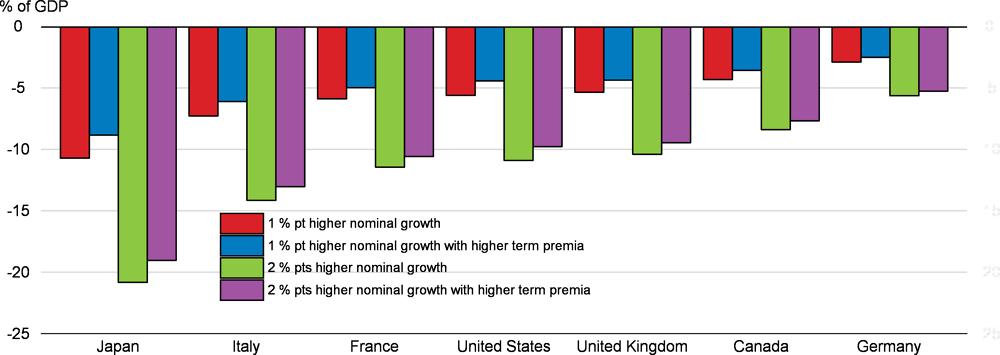
Note: Higher nominal growth by 1 or 2 percentage points (% pts) relative to baseline (nominal interest rates, nominal primary budget balances and nominal government financial assets are as in baseline). Higher term premia imply higher 10-year bond yields by 0.5 percentage point relative to baseline (with short-term interest rates kept as in baseline).
Source: OECD Economic Outlook 105 database; and OECD calculations.
Several OECD countries seem to have scope to ease fiscal policy without compromising debt sustainability. A commonly used benchmark for debt-sustainability assessment is the difference between the effective interest rate paid on (net) debt and nominal GDP growth (so-called r-g). If the difference is negative, as is currently the case and expected to remain so for the majority of OECD countries (Figure 1.26), then debt will eventually stabilise over time. However, depending on the path of the primary balance, this may still imply that debt rises relative to GDP, which may not be desirable. Alternatively, the scope for fiscal easing could be estimated by calculating the primary balance needed to stabilise debt in relation to GDP at a given level. These two indicators are not enough to assess public debt sustainability fully, and other aspects, like the level of taxes, potential growth and future liabilities related to population ageing and health care should be taken into account.
-
In this context, countries that have a primary balance above the level necessary to stabilise the debt ratio at recent levels, and relatively low government debt, may engage in fiscal easing whilst still having a gradual decline in gross debt in relation to GDP in the near term (Figure 1.27).15 This is the case for several European countries, including Germany, the Netherlands, Sweden and Switzerland. In the Netherlands and Germany, where the difference between the actual and debt-stabilising balance is particularly large, fiscal stimulus does not need to use all of the space available so as to avoid an excessively pro-cyclical fiscal stance and to ensure a sustained downward debt trajectory. Some other European countries, like Belgium, Spain and the United Kingdom, also could lower budget balances without increasing debt. However, their relatively high level of public debt calls for prudence in undertaking fiscal easing.
-
In contrast, in some countries, including France, Japan and the United States, current primary budget balances are adding to, and in Italy sustaining, already-high government debt, and thus further fiscal stimulus risks undermining future debt sustainability. In these countries, the authorities could still support economic activity by changing the structure of spending and taxes towards areas that are more conducive to economic growth. For example, a budget neutral policy could increase spending on growth enhancing components – like education and public investment in health, and research and development – while cutting growth-reducing spending – such as subsidies in sectors that restrict competition and distort effective resource allocation (OECD, 2016a).
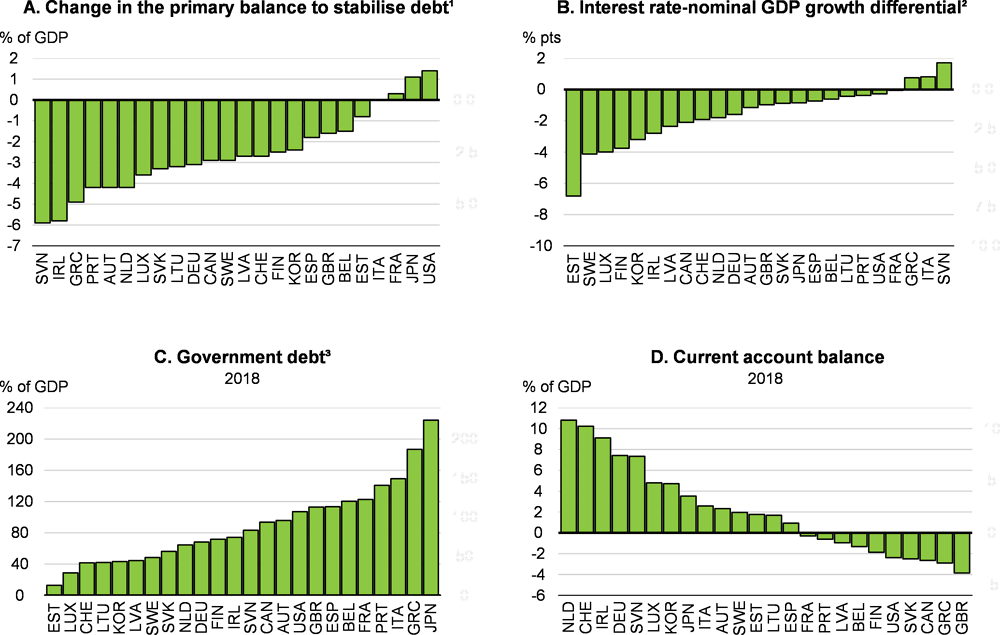
1. The change in the primary balance to stabilise debt is the difference between the primary balance that would stabilise the debt-to-GDP ratio at its 2018 level and the primary balance projected for 2019, based on the assumption that the nominal value of government financial assets does not change. A positive value implies that a country should tighten fiscal policy to stabilise the debt-to-GDP ratio.
2. The average difference between the effective interest rate paid on net debt (r) and nominal GDP growth (g) for 2016-18 (the so-called r-g). r is the weighted difference between the implied interest rate paid on government financial liabilities and the implied interest rate earned on government financial assets, where the weights are the share of financial liabilities and assets in net debt, respectively.
3. Government debt refers to the national accounts definition.
Source: OECD Economic Outlook 105 database; and OECD calculations.
The current modest growth rates in the euro area, and the limited scope for substantial additional monetary policy support, highlight the important role that combined structural and fiscal policy efforts could play in lifting growth. Indeed, some additional well-targeted fiscal easing is required now in those euro area countries with fiscal space. Such easing would help the benefits of structural reforms to appear more quickly, provide some additional near-term support to demand, and thus allow monetary policy to remain accommodative for longer, and ultimately deliver higher output in the short and medium term (Box 1.4).
Euro area growth has slowed considerably over the past year and is projected to remain subdued through the rest of 2019 and 2020. This adds to the challenges facing policymakers from the low rate of potential output growth, currently estimated to be around 1¼ per cent per annum. Poor medium-term prospects, reinforced by short-term demand weakness and the slump in business confidence act as disincentives to invest, raising the risk that the current slowdown in the euro area becomes entrenched and current expectations of weak medium-term growth become self-fulfilling. New policy measures are thus required to enhance area-wide growth prospects in the medium term and strengthen short-term demand in the euro area.
Actions by all countries, involving renewed structural reform efforts augmented by targeted fiscal support where space exists, along with continued low interest rates, offer the best prospects for restoring growth and improving living standards over time. A well-designed combination of country-specific structural and fiscal measures, accompanied by monetary policy keeping interest rates low for a longer period, can reinforce the benefits of each policy measure and mitigate the short-term side effects of others, to the benefit of the euro area as a whole. Supportive macroeconomic policies can help to bring forward the effects of structural reforms, particularly at a time when growth is soft, as reforms typically have a faster impact in a more favourable economic environment (Bouis et al., 2012; OECD, 2016b).
-
Structural reforms are needed in all member states to improve medium-term productivity and living standards. For instance, further liberalisation of product markets, especially in services, would help to improve the diffusion of new ideas and technologies between firms and across countries and boost total factor productivity (TFP) growth. Stronger competitive pressures would also encourage firms to expand and upgrade the quality of their capital stock and innovate, thereby helping to revive growth. Such reforms take time to have their full effect.
-
In those euro area countries with fiscal space, a temporary and well targeted additional fiscal stimulus could help to facilitate the necessary improvement in medium-term growth prospects, and also offset the current weakness in growth. Moreover, there would be positive short-term output spillovers for the rest of the euro area, particularly if interest rates remain low. New fiscal measures focused on investment, including digital infrastructure, and support for low income households and displaced workers could help to bring forward some of the medium-term benefits of reforms and foster confidence. At the same time, firms would be encouraged to spend, because of stronger aggregate demand pressures and improved infrastructure, and help would be provided to compensate workers and households displaced by the impact of stronger competitive pressures on less efficient companies.
-
Other member states in which fiscal space is currently limited, should refrain from additional stimulus measures that could increase sovereign risk premia. However, they should also look for budget-neutral changes that would help to strengthen growth and make it more inclusive.
-
Limited additional monetary policy measures by the ECB could also provide some modest support for demand in the near term, if needed, but cannot do much to offset to weak medium-term growth prospects. Keeping interest rates low for a longer period can nonetheless provide important synergies at times when fiscal and structural actions are being undertaken. In particular, forward guidance that recognises the likely positive medium-term effects of new well-designed structural reforms on output can help to hold down long-term interest rates and thereby allow private investment to strengthen more quickly than it otherwise might have.
Illustrative scenarios, using the NiGEM global macro model, highlight the benefits that can be obtained from combined action across euro area countries and policies. The different policy measures considered are:
-
Productivity-enhancing structural reforms are undertaken in all euro area economies. These are assumed to consist of measures that raise TFP growth by 0.2 percentage point per annum for five years, beginning in 2019, with the 1% higher level of TFP being maintained permanently thereafter. This offsets part of the slowdown in TFP growth experienced since the crisis. In the euro area as a whole, OECD estimates suggest that the annual average contribution of TFP to potential output growth between 2007 and 2017 was around 0.2 percentage point weaker than in the pre-crisis decade, at 0.3 percentage point.1
-
A three-year debt-financed increase in government investment of 0.5% of GDP per annum in Germany and the Netherlands, two of the euro area countries with fiscal space (see main text). In both economies, budget and current account surpluses point to an excess of saving relative to investment. Net general government fixed investment (gross investment less capital consumption) has been close to zero in Germany for an extended period, and has slowed in the Netherlands to around ⅓ per cent of GDP per annum since 2013, from 0.9% of GDP per annum on average in the previous decade. No fiscal measures are implemented in other euro area economies, including France, Italy and Spain. A number of smaller euro area economies might also have space for additional fiscal measures, which would enhance the area-wide effect of the stimulus.
-
Monetary policy is assumed to be set in a way that takes into account the longer-term supply-side gains that arise from enhanced structural reforms. In effect, this means forward guidance is being used to help interest rates stay low for longer, recognising that area-wide inflationary pressures will be somewhat lower in the medium term at any given level of demand.2
The combined actions help to bring forward the medium-term impact of structural reforms. Euro area GDP growth is raised by around ¼ percentage point in the first year and 0.2 percentage point in the second year; in the longer term, the level of GDP is around 1% higher (Figure 1.27). The full impact of stronger structural reforms emerges gradually over time, continuing to build even as the direct influence of the fiscal stimulus measures wanes.
-
Business investment rises relatively rapidly, by around 1% in the first year in the economies undertaking fiscal stimulus and 0.8% in the euro area as a whole, helped by expectations of higher future output and somewhat lower long-term interest rates, and the capital stock continues to accumulate over time.
-
Co-ordinated action also offers benefits for workers. Nominal and real wages also rise gradually over time, as they adjust towards a higher level of labour productivity. In turn, this helps to strengthen consumer spending.
-
There are small, but positive spillovers for other economies, particularly close trading partners. At their peak, in the third year of the combined measures, the level of export volumes is raised by between ½ and ¾ per cent in the EU economies that are not members of the euro area. In the longer term, there are small positive effects on the level of output in these economies as well, of around 0.2% in the Czech Republic, Hungary and Poland and around 0.1% on average in the remaining countries.
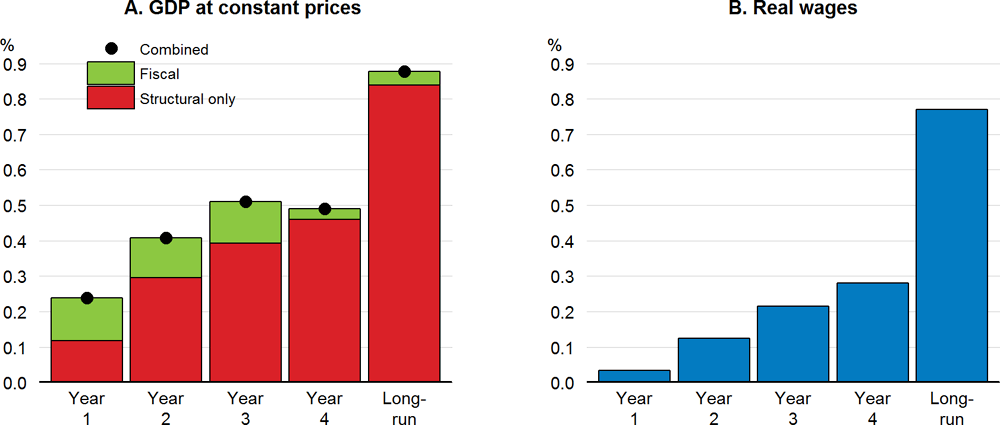
Note: Real wages are measured as compensation per employee deflated by the private consumption deflator.
Source: OECD calculations using NiGEM.
There are clear synergies from taking complementary actions across different policy areas. Accommodative monetary policy helps to raise the longer-term output gains from structural reforms. After a decade, the impact of reforms on GDP is higher when accompanied by more accommodative monetary policy. The initial stimulus from public investment provides a further boost, helping to bring forward the medium-term gains to output and wages produced by structural reforms. All told, the impact of reforms on GDP after a decade is close to one-quarter higher when combined action is taken than if reforms are undertaken without macroeconomic policy support.
← 1. There are a number of ways in which an increase of 1% in the level of TFP over five years can be achieved, especially if a collection of reforms are undertaken simultaneously in a number of different policy areas, as is necessary for many countries. The synergies from a set of well-designed incremental reforms might also augment the benefits from each reform taken in isolation. The policy priorities set out for each euro area country in the forthcoming OECD Going for Growth report are different, but frequently include steps to: streamline permits and licenses; improve the transparency of regulation; reduce barriers to entry in network industries, professional services and retail sector; and strengthen collaboration between research institutes, universities and industry. EU-wide reforms could reinforce such efforts, particularly if renewed progress is made in completing the Single Market. Stronger government investment in physical and digital infrastructure can also enhance potential output in the longer term by raising the capital stock.
← 2. Monetary policy in NiGEM follows a two-pillar rule, responding to both the deviation of inflation from target and the deviation of nominal GDP from (its baseline) target. In this case, the nominal GDP target was raised by 1%, reflecting the positive long-term supply shock.
From the perspective of stabilising the economy in the short and medium term, the fiscal authorities should choose measures with high multipliers. Empirical evidence on which measures are the most effective is not settled though. Most macroeconomic models suggest that a temporary increase in public investment has the highest short-term multiplier, with somewhat lower multipliers for transitory increases in public consumption and the lowest multipliers for temporary tax cuts (Barrell et al., 2012; and Cournède et al., 2013). By adding to the capital stock, an increase in public investment also has some longer-term effects (OECD, 2016a). However, a recent overview of empirical research over the past decade suggests that debt-financed temporary tax-based fiscal stimulus may be more efficient than public-consumption-based stimulus, though the relative strength differs depending on the methodology employed (Ramey, 2019). In any case, with persistently low interest rates in many OECD economies, fiscal multipliers may currently be higher than otherwise, and the risk of crowding-out effects from public spending reduced, especially if the fiscal stimulus were to lower real interest rates, at least for a period, by increasing expected inflation (Christiano et al., 2011; Coenen et al., 2012; Farhi and Werning, 2016; Miyamoto et al., 2018; Ramey and Zubairy, 2018).
Macroeconomic policy requirements in emerging-market economies
Although financial stress has eased in most emerging-market economies, underlying vulnerabilities persist and weak global trade, financial stability risks and significant adjustment challenges from past financial market tensions continue to impede growth in many countries. Policy requirements differ across the individual economies depending on their situation.
-
In China, both fiscal (including quasi-fiscal) and monetary policies have been eased, as appropriate given demand weakness, and scope remains for further measures if the underlying strength of the economy is weaker than anticipated or policy instruments are less effective than in the past. However, careful targeting is needed to avoid adding to high indebtedness of non-financial corporations and medium-term deleveraging challenges.
-
Other emerging-market economies, such as India and Mexico, with flexible exchange rate frameworks and manageable exposures to foreign currency denominated debt, also have scope to ease monetary policy as inflation declines, while taking the opportunity to improve their fiscal positions if needed.
-
A tighter policy stance remains necessary in those emerging-market economies, such as Argentina and Turkey, where concerns persist about the sustainability of fiscal or external positions, or the health of the banking sector, in order to retain investors’ confidence. Nominal interest rates can go down as inflation moderates from its current high rates, but there is limited scope to lower real interest rates substantially. The priority in these economies is to undertake reforms that enhance the prospects for fiscal and financial sustainability in the medium term.
Many emerging-market economies, including China, India, Russia and Turkey, would benefit from increased fiscal transparency, which might help to reduce the risk premia they face in global financial markets. They do not publish estimates of the general government budget balance and debt according to international accounting standards, preventing an objective assessment of public finances for the total government sector, including local governments. Moreover, in many of these economies, quasi-fiscal measures, involving state-owned banks and companies and various contingent liabilities, are more common than in advanced economies. Reporting such measures would be welcome as it would allow a better assessment to be made of the fiscal risks faced by these countries.
Structural policy ambition needs to be improved in all countries
The prospects for strong and sustained improvement in living standards and incomes in the medium term remain weaker than prior to the crisis in all economies. As documented in the forthcoming edition of OECD Going for Growth, structural reform efforts have stabilised in both advanced and emerging market economies in recent years, but at a level below that achieved in the aftermath of the crisis (Figure 1.28). Improved reform ambition in both advanced and emerging-market economies would help to enhance living standards, strengthen medium-term prospects for investment and productivity, and allow the benefits of growth to be distributed more widely. New initiatives by governments to reduce the unnecessary costs of non-tariff measures or to tackle barriers to cross-border services trade would also bring benefits to all economies and consumers.
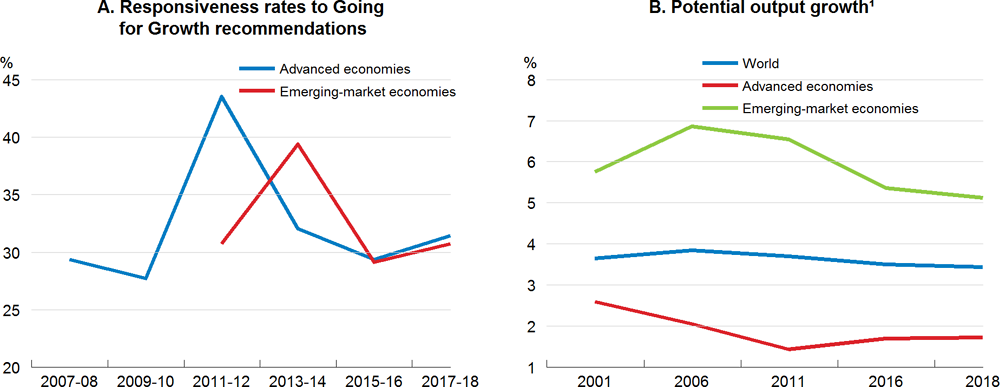
1. Based on OECD estimates of potential output growth for 46 economies, aggregated using PPP weights.
Source: OECD (2019), Going for Growth, forthcoming; and OECD Economic Outlook 105 database.
Stronger reforms are needed to promote business dynamism and knowledge diffusion and enhance innovation capacity. Further measures are also essential to help restore trust and confidence in government, and promote equality of opportunity, as highlighted in the OECD Risks that Matter survey (OECD, 2019c). Amongst the key measures to take are steps to help workers acquire the new skills necessary to enable them to benefit from fast-changing labour markets, as set out in the OECD Skills Outlook (OECD, 2019d). This would help create new opportunities for those workers and regions most exposed to the impact of global integration and the challenges brought by the ongoing digital transformation of societies, as stressed in the updated OECD Jobs Strategy, the OECD Framework for Policy Action on Inclusive Growth, and the OECD Going Digital project OECD (2019e). Improved efficiency of tax and transfer policies, including better targeting of transfers, also needs to be an integral part of well-designed policy packages to respond to people’s concerns about public services and social benefits, by helping to make work pay and by strengthening real income growth amongst poorer households (Causa et al., 2018).
Reforms to improve digital infrastructure are a high priority in some countries to help businesses harness the productivity-raising power of high-speed internet access, cloud computing and other new technologies. Indeed, in Europe, around one-half of firms cite access to digital infrastructure, or a lack of adequate transport infrastructure, as being obstacles to investment (Figure 1.29), with these factors tending to be closely correlated across countries.
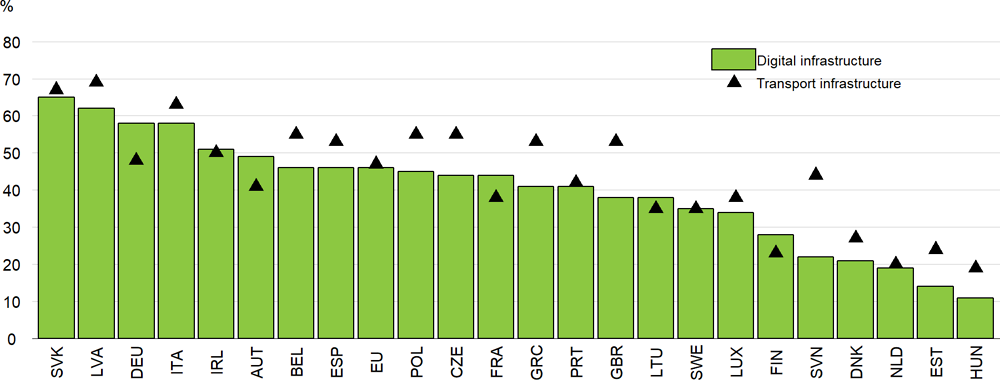
Source: European Investment Bank (2018), EIB Investment Report 2018/19: Retooling Europe’s Economy, European Investment Bank, Luxembourg.
Moreover, across countries, the share of firms citing access to digital infrastructure as an obstacle to investment is significantly negatively correlated with the shares of firms having access to high-speed (or superfast) broadband and adopting digital technologies such as cloud computing (Figure 1.30), and positively associated with the share of firms having only lower-speed broadband. This suggests that continued investment in communication networks is needed to increase the availability of high-speed internet access and make it more affordable. In turn, this should enhance take-up and usage by firms and households (OECD, 2019e) and enhance productivity growth, as discussed in Chapter 2.
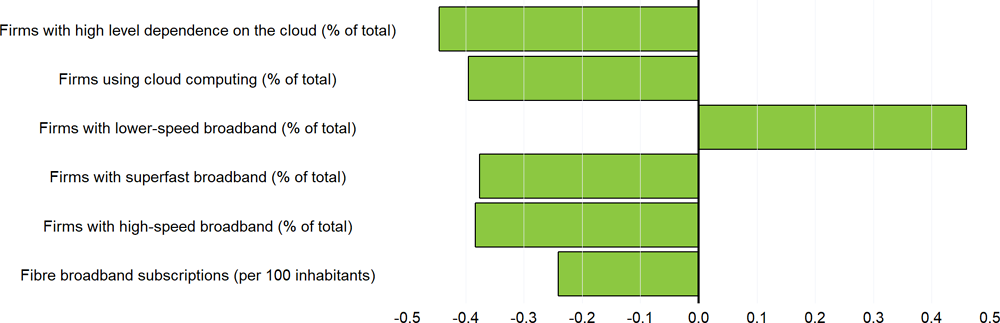
Note: Based on the 23 EU countries who are member states of the OECD. High-speed and superfast broadband refer to broadband speeds of at least 30 Megabits per second (Mbps) and 100 Mbps respectively. Lower-speed broadband refers to speeds of less than 10Mbps.
Source: European Investment Bank; OECD Broadband Portal; Eurostat; and OECD calculations.
Targeted government investment may have a role to play in establishing high-speed networks and helping to overcome digital divides across regions if private sector initiatives to provide access to high-speed broadband networks are not sufficient, including in countries such as Germany (OECD, 2018b). Governments can also implement pro-competitive reforms to incentivise private investment, by reducing barriers to entry, streamlining rights of way (including approvals), enabling the sharing of network infrastructure, and ensuring adequate competition in fixed and mobile broadband markets.
References
Akinci, O. and J. Olmstead-Rumsey (2018), “How Effective Are Macroprudential Policies? An Empirical Investigation”, Journal of Financial Intermediation, 33, 33-57.
Amiti, M. S.J. Redding and D. Weinstein (2019), “The Impact of the 2018 Trade War on US Prices and Welfare”, NBER Working Papers, No. 25672.
Arriola, C. et al. (2018), “The Potential Macroeconomic and Sectoral Consequences of Brexit on Ireland”, OECD Economics Department Working Papers, No. 1508, OECD Publishing, Paris, https://doi.org/10.1787/e930967b-en.
Bank of England (2018), Financial Stability Report, November, No. 44.
Barrell, R., D. Holland and I. Hurst (2012), “Fiscal Consolidation: Part 2. Fiscal Multipliers and Fiscal Consolidations”, OECD Economics Department Working Papers, No. 933, OECD Publishing, Paris, https://dx.doi.org/10.1787/5k9fdf6bs78r-en.
Bouis, R. et al. (2012), “The Short-Term Effects of Structural Reforms: An Empirical Analysis”, OECD Economics Department Working Papers, No. 949, OECD Publishing, Paris, https://doi.org/10.1787/5k9csvk4d56d-en.
Causa, O., J. Browne and A. Vindics (2018), “Income Redistribution across OECD Countries: Main Findings and Policy Implications”, OECD Economic Policy Papers, No. 23, OECD Publishing, Paris, https://doi.org/10.1787/3b63e61c-en.
Çelik, S. and M. Isaksson (2019), “Corporate Bond Markets in a Time of Unconventional Monetary Policy”, OECD Capital Market Series, OECD Publishing, Paris.
Cerutti, E., S. Claessens and L. Laeven (2017), “The Use and Effectiveness of Macroprudential Policies: New Evidence”, Journal of Financial Stability, 28, 203-224.
Christiano, L., M. Eichenbaum and S. Rebelo (2011), “When is the Government Spending Multiplier Large?”, Journal of Political Economy, 119, 78-121.
Coenen, G. et al. (2012), “Effects of Fiscal Stimulus in Structural Models”, American Economic Journal: Macroeconomics, 4, 22-68.
Cournède, B., A. Goujard and A. Pina (2013), “Reconciling Fiscal Consolidation with Growth and Equity”, OECD Journal: Economic Studies, Vol. 1, OECD Publishing, Paris, https://doi.org/10.1787/eco_studies-2013-5jzb44vzbkhd.
Cournède, B., S. Sakha and V. Ziemann (2019), “Housing Markets and Economic Resilience,” OECD Economics Department Working Papers, forthcoming, OECD Publishing, Paris.
ECB (2018), Financial Stability Review, November, European Central Bank.
European Investment Bank (2018), EIB Investment Report 2018/19: Retooling Europe’s Economy, European Investment Bank, Luxembourg.
European Parliament (2019), Implementation of the Macroeconomic Imbalance Procedure: State of Play - March 2019. In-depth Analysis.
Farhi, E. and I. Werning (2016), “Fiscal Multipliers: Liquidity Traps and Currency Unions”, in J. B. Taylor and H. Uhlig (eds), Handbook of Macroeconomics, Vol. 2, 2417-2492.
Federal Reserve Bank of Atlanta (2019), “Tariff Worries and US Business Investment: Take Two”, Federal Reserve Bank of Atlanta macroblog, February 2019.
Guillemette, Y. and D. Turner (2018), “The Long-View: Scenarios for the World Economy to 2060”, OECD Economics Department Policy Papers, No. 22, OECD Publishing, Paris, https://doi.org/10.1787/b4f4e03e-en.
Haugh, D. et al. (2016), “Cardiac Arrest or Dizzy Spell: Why Is World Trade So Weak and What Can Policy Do about It?”, OECD Economic Policy Papers, No. 18, OECD Publishing, Paris, https://doi.org/10.1787/5jlr2h45q532-en.
Kierzenkowski, R. et al. (2016), “The Economic Consequences of Brexit: A Taxing Decision”, OECD Economic Policy Papers, No. 16, OECD Publishing, Paris, https://doi.org/10.1787/5jm0lsvdkf6k-en.
Miyamoto, W., T.L. Nguyen and D. Sergeyev (2018), “Government Spending Multipliers under the Zero Lower Bound”, American Economic Journal: Macroeconomics, 10, 247-277.
OECD (2016a), “Using the Fiscal Levers to Escape the Low-Growth Trap”, Chapter 2 in OECD Economic Outlook, Volume 2016, Issue 2, OECD Publishing, Paris, https://doi.org/10.1787/eco_outlook-v2016-2-en.
OECD (2016b), “Short-Term Labour Market Effects of Structural Reforms: Pain Before the Gain?”, Chapter 3 in OECD Employment Outlook 2016, OECD Publishing, Paris, https://doi.org/10.1787/empl_outlook-2016-7-en.
OECD (2017), “Resilience in a Time of High Debt”, Chapter 2 in OECD Economic Outlook, Volume 2017, Issue 2, OECD Publishing, Paris, https://doi.org/10.1787/eco_outlook-v2017-2-3-en.
OECD (2018a), OECD Economic Outlook, Volume 2018, Issue 2, OECD Publishing, Paris, https://doi.org/10.1787/eco_outlook-v2018-2-en.
OECD (2018b), OECD Economic Surveys: Germany 2018, OECD Publishing, Paris, https://doi.org/10.1787/19990251.
OECD (2019a), Trade Policy and the Global Economy: Reducing Unnecessary Costs of Non-Tariff Measures, OECD Publishing, Paris.
OECD (2019b), Trade Policy and the Global Economy: Addressing Barriers to Services Trade, OECD Publishing, Paris.
OECD (2019c), “Risks That Matter: Main Findings from the 2018 OECD Risks That Matter Survey”, http://www.oecd.org/social/risks-that-matter.htm.
OECD (2019d), OECD Skills Outlook 2019: Thriving in a Digital World, OECD Publishing, Paris, https://doi.org/10.1787/df80bc12-en.
OECD (2019e), Measuring the Digital Transformation: A Roadmap for the Future, OECD Publishing, Paris, https://doi.org/10.1787/9789264311992-en.
Ollivaud, P. and C. Schwellnus (2015), “Does the Post-Crisis Weakness of Global Trade Solely Reflect Weak Demand? ”, OECD Economics Department Working Papers, No. 1216, OECD Publishing, Paris, https://doi.org/10.1787/5js1qvnff3hk-en.
Patalano, R., D. and C. Roulet (2019), “Structural Developments in Financial Intermediation: The Rise of Debt and Non-Bank Credit Intermediation”, OECD Working Papers, forthcoming, OECD Publishing, Paris.
Ramey, V. (2019), “Ten Years after the Financial Crisis: What Have We Learned from the Renaissance in Fiscal Research?”, NBER Working Papers, No. 25531.
Ramey, V. and S. Zubairy (2018), “Government Spending Multipliers in Good Times and in Bad: Evidence From U.S. Historical Data”, Journal of Political Economy, 126, 850-901.
Richter, B., M. Schularick and I. Shim (2018), “The Macroeconomic Effects of Macroprudential Policy”, BIS Working Papers, No. 740, Bank for International Settlements, Basel.
Smith, D. et al. (2018), “The Potential Economic Impact of Brexit on the Netherlands”, OECD Economics Department Working Papers, No. 1518, OECD Publishing, Paris, https://doi.org/10.1787/20cb5ddc-en.
Smith, D., M. Hermansen and S. Malthe-Thaggard (2019), “The Potential Economic Impact of Brexit on Denmark”, OECD Economics Department Working Papers, No. 1544, OECD Publishing, Paris, https://doi.org/10.1787/41a95fb3-en.
Stock, J.H. and M. Watson (2018), “Slack and Cyclically Sensitive Inflation”, paper presented at the ECB Forum on Central Banking, Sintra, Portugal, 18-20 June.
WTO-OECD-UNCTAD (2018), 20th Report on G20 Trade and Investment Measures.
Fiscal policy settings for 2019-20 are based as closely as possible on legislated tax and spending provisions and are consistent with the growth, inflation and wage projections. Where government plans have been announced but not legislated, they are incorporated if it is deemed clear that they will be implemented in a shape close to that announced. Where there is insufficient information to determine budget outcomes, underlying primary balances are kept unchanged, implying no discretionary change in the fiscal stance. In the euro area countries, the stated targets in Stability Programmes are also used.
Regarding monetary policy, the assumed path of policy interest rates and unconventional measures represents the most likely outcome, conditional upon the OECD projections of activity and inflation, which may differ from the stated path of the monetary authorities.
Structural reforms that have been implemented or announced for the projection period are taken into account, but no further reforms are assumed to take place.
The projections assume unchanged exchange rates from those prevailing on 26 April 2019: one US dollar equals JPY 111.6, EUR 0.88 (or equivalently one euro equals USD 1.14) and 6.70 renminbi.
The price of a barrel of Brent crude oil is assumed to remain constant at USD 70 throughout the projection period. Non-oil commodity prices are assumed to be constant over the projection period at their average levels from March 2019.
The projections for the United Kingdom use a technical assumption of a smooth Brexit with a transition period lasting until the end of 2020, following a formal exit from the European Union. The end of the transition period is assumed to occur smoothly, but the final outcome of the agreement on the future relationship between the European Union and the United Kingdom is assumed to be uncertain through 2020.
Tariffs that have been introduced by the United States and China on their bilateral trade in 2018 are maintained throughout 2019 and 2020 in the projections, and no other tariff measures are assumed (including the higher US tariffs on imports from China and the response by China announced in mid-May 2019).
The cut-off date for information used in the projections is 15 May 2019.
Notes
← 1. While some economies enacted trade-facilitating measures last year, these were outweighed by new restrictive trade policy measures (WTO-OECD-UNCTAD, 2018).
← 2. In the United States, survey-based estimates suggest that tariff increases and trade policy tensions may have reduced gross investment by 4.2% in the manufacturing sector in 2018 (Federal Reserve Bank of Atlanta, 2019).
← 3. For instance, market-based longer-term inflation expectations derived from inflation swaps and bond yield differentials point to a decline in expected inflation by ¾ percentage point on average between 2008-12 and 2013-19.
← 4. Stock and Watson (2018) show that the cyclical component of inflation is sensitive to aggregate cyclical activity only for a few components of total inflation in the United States and the euro area. These components are primarily services and goods that could be considered locally priced. Also, according to simple regressions for the G7 economies using quarterly data for the 2001-18 period, the annual inflation rate of only 30-40% of core inflation components is generally linked to economy-wide output or unemployment gaps, with the exception of Italy where the share is between 50% and 60%. Goods tend to be less responsive to country-specific gaps than services. Analysis based on a dynamic factor model yields similar results. With the exception of France and Japan, the share of individual goods and services with a significant and positive correlation with the underlying inflation trend, as measured by the estimated common unobservable factor, is well below 50%.
← 5. OECD estimates suggest that import volume growth in China slowed from an average annual pace of over 9% in 2013-14, to under 5% in 2015-16, with world trade growth slowing by around 1 percentage point between the same periods.
← 6. The share of China’s foreign portfolio assets in world international portfolio liabilities, and the share of portfolio liabilities vis-à-vis non-residents in world international portfolio assets, are small compared with G7 countries and relatively large compared with other BRIICS. However, this does not account for the fact the Chinese economy is significantly larger than the economies of other BRIICS. The integration of Chinese RMB-denominated assets is advancing fast, spurred by the inclusion of such assets in global bond benchmark indices. For example, local currency Chinese bonds are being phased into the Bloomberg Barclays Global Aggregate Index; when fully accounted for, scheduled at the end of 2020, they would represent 5½ per cent of the index (based on data as of end-January 2018).
← 7. Advanced economies’ holdings of Chinese debt securities and equities are small relative to holdings of debt securities of other large advanced economies and in some cases are no bigger than holdings of some other BRIICS’ debt securities.
← 8. The stock of non-financial corporate bonds in advanced economies at the end of 2018 reached over USD 10 trillion, rising by nearly 70% in real terms since 2008 (Çelik and Isaksson, 2019). A steady increase in net bond issuance was observed across most advanced economies, including in Europe where external finance is nevertheless still primarily based on bank credit.
← 9. Debt securities of non-financial corporations in emerging-market economies increased almost six-fold between 2008 and 2018 in real terms, driven primarily by China, with the outstanding stock of bonds reaching USD 2.78 trillion at the end of 2018 (Çelik and Isaksson, 2019).
← 10. The stock of foreign-currency-denominated short-term foreign debt was USD 171 billion in February 2019, around 25% of GDP. In mid-May 2019, net foreign currency reserves reported by the central bank amounted to around USD 26.6 billion, without taking into account off-balance sheet swap liabilities.
← 11. However, it intends to maintain the pace of reducing its holdings of agency debt and mortgage backed securities, with some share of the principal payments being reinvested in Treasury securities.
← 12. The projection assumes an unchanged fiscal stance in general, unless discretionary measures have been voted or have been announced and are likely to be implemented soon (Annex 1.A). In Italy, the projected fiscal easing in 2020 includes about half of the legislated increase in the VAT rate.
← 13. Germany and the Netherlands have very large current account surpluses (Figure 1.26), which are identified as external imbalances according to the EU Macroeconomic Imbalances Procedure (European Parliament, 2019). In Germany, this imbalance reflects subdued investment, including in the public sector.
← 14. For instance, significant new reforms to ease regulation in the energy, transport and communication sectors and boosting spending on active labour market policies in G7 economies could increase the GDP level on average by 1% after five years (OECD, 2018a).
← 15. The primary balance needed to stabilise debt shown here is only indicative. It is calculated based on the 2018 differential between the effective interest rate paid on government debt and nominal GDP growth rate. This balance will not be stable over time. It will decline if the interest-growth differential falls and it will increase with a higher gross debt-to-GDP ratio if the interest-growth differential is positive, all other things being constant. If the fiscal stimulus is effective in rising nominal GDP growth, it would likely help to improve debt dynamics by lowering the interest-growth differential.
Metadata, Legal and Rights
https://doi.org/10.1787/b2e897b0-en
© OECD 2019
The use of this work, whether digital or print, is governed by the Terms and Conditions to be found at http://www.oecd.org/termsandconditions.