copy the linklink copied!Recipients of long-term care
Across OECD countries, an average of 10.8% of people aged 65 and over received long-term care (LTC) in 2017. This represents a 5% increase compared with 2007 (Figure 11.17). More than one in five people aged 65 and over received LTC services in Switzerland (22%) and Israel (20%), compared with less than 5% in the Slovak Republic (4%), Canada (4%), Ireland (3%), Portugal (2%), and Poland (1%).
The majority of LTC recipients are older adults (Figure 11.18). Although LTC services are also delivered to younger disabled groups, people are more likely to develop disabilities and need support from LTC services as they age. In 2017, just 21% of LTC recipients on average across OECD countries were younger than 65, while a further 27% were between 65 and 79. Adults aged 80 and over represent the majority of LTC recipients in OECD countries. On average in OECD countries, 51% of LTC recipients were aged 80 and above in 2017. In Japan, two-thirds of LTC recipients were 80 and over, while people aged 0-64 represented just 3% of LTC recipients.
While population ageing is a significant driver of the growth in LTC users over time, the cross-country variation in the proportion of older LTC recipients suggests that other drivers – notably publicly funded LTC services – also determine LTC use. For example, Israel has one of the youngest populations among OECD countries but a greater than average proportion receive LTC. Because data on people receiving care outside public systems are more difficult to collect and may be underreported, figures for countries that rely more heavily on privately-funded care may be artificially low. Cultural norms around the degree to which families look after older people may also be an important driver of the utilisation of formal services (see indicator on “Informal carers”).
Many people in need of LTC care wish to remain in their homes for as long as possible. In response to these preferences, and the high costs of care facility-based LTC, many OECD countries have developed services to support home-based care for older adults. Between 2007 and 2017, the proportion of LTC recipients who received care at home rose by 4%, from 64% to 68% (Figure 11.19). Increases have been particularly large in Portugal, Australia, Sweden, Germany and the United States. In Germany, part of the increase was due to policy reforms expanding the definition of long-term care and therefore increasing the number of benefit recipients. While the proportion of LTC recipients living at home has increased over the past decade in most OECD countries, it has declined significantly in Estonia, where there has been a significant increase in the use of institutional care, but an even larger decrease in the number of “curators” appointed by local government to care for people at home.
LTC recipients are defined as people receiving long-term care by paid providers, including non-professionals receiving cash payments under a social programme. They also include recipients of cash benefits such as consumer-choice programmes, care allowances or other social benefits granted with the primary goal of supporting people with LTC needs. LTC institutions refer to nursing and residential care facilities that provide accommodation and LTC as a package. LTC at home is defined as people with functional restrictions who receive most of their care at home. Home care also applies to the use of institutions on a temporary basis, community care and day-care centres and specially designed living arrangements. Data for Poland, Ireland, Canada, the Slovak Republic, Iceland and Belgium are only available for people receiving LTC in institutions, so the total number of recipients will be underestimated. In Estonia, data on recipients of home care refer only to those who have a “curator” appointed by local government. Other social services, without a personal care component, are not included in the data. It is possible that some of the decrease in recipients reflects the replacement of curators with these other services.
Data on LTC services are difficult to collect in many countries and there are some known limitations of the figures. Data for some countries refers only to people receiving publicly funded care, while other countries include people who are paying for their own care.
References
[1] Colombo, F. et al. (2011), Help Wanted? Providing and Paying for Long-Term Care, OECD Health Policy Studies, OECD Publishing, Paris, https://doi.org/10.1787/9789264097759-en.
[2] Muir, T. (2017), “Measuring social protection for long-term care”, OECD Health Working Papers, No. 93, OECD Publishing, Paris, https://dx.doi.org/10.1787/a411500a-en.
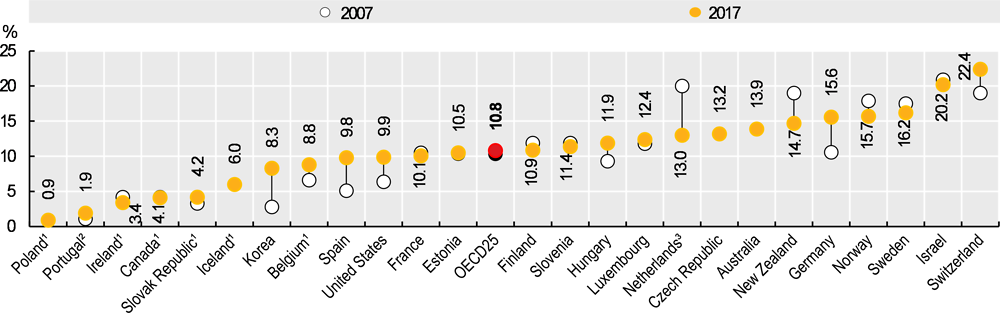
1. Include only recipients of LTC in institutions. 2. Refers to people receiving care through the National Network of Integrated Continuing Care. 3. Refers to social-insurance funded LTC only: the fall in recent years largely reflects the transfer of many LTC services to municipalities in 2015.
Source: OECD Health Statistics 2019.
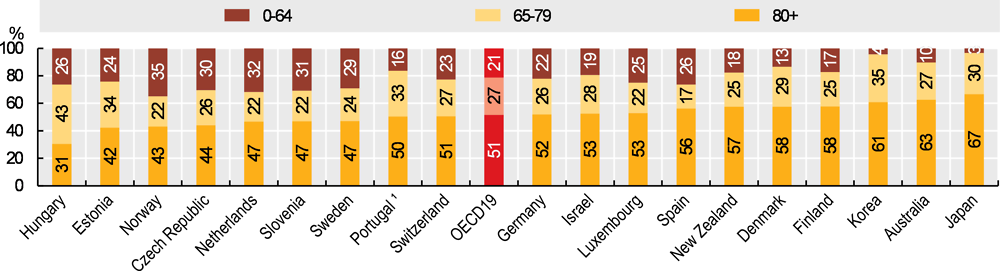
1. Data refer to people receiving care through the National Network of Integrated Continuing Care.
Source: OECD Health Statistics 2019.
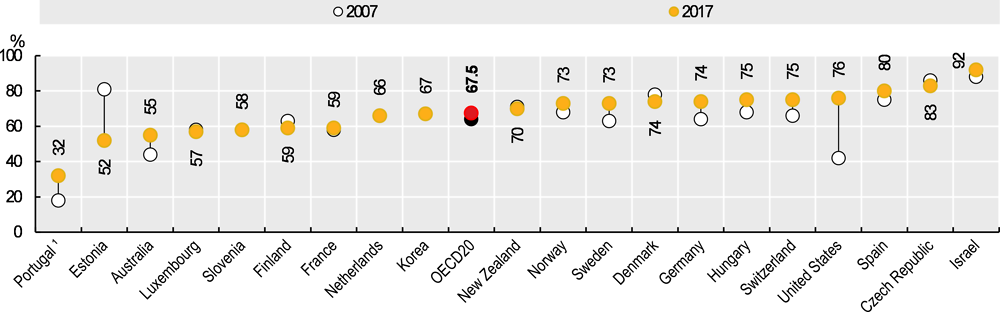
1. Data refer to people receiving care through the National Network of Integrated Continuing Care.
Source: OECD Health Statistics 2019.
Metadata, Legal and Rights
https://doi.org/10.1787/4dd50c09-en
© OECD 2019
The use of this work, whether digital or print, is governed by the Terms and Conditions to be found at http://www.oecd.org/termsandconditions.