
5. Inclusion, material conditions and COVID-19
The pandemic’s consequences for jobs and incomes are weighing heavily on already vulnerable population groups. Industries that were most affected by lockdowns typically include higher shares of younger, lower-educated and lower-paid workers. Across the OECD, the employment gap between young people and other working-age adults widened, and the youth unemployment rate reached twice that of other working-age adults in Q2 2020. On average across EU countries, the labour income loss between 2019 and 2020 was four times higher for workers in the bottom income quintile, relative to workers in the top quintile. Women, mothers, immigrants and those belonging to racial/ethnic minorities and LGBTQ+ communities were more likely to lose their jobs and are now facing particular financial strain. Housing challenges were also exacerbated, with vulnerable groups struggling to access affordable and quality housing.
Lower-paid and less-educated workers were more likely to stop working during the pandemic, and those who remained in employment were less able to telework
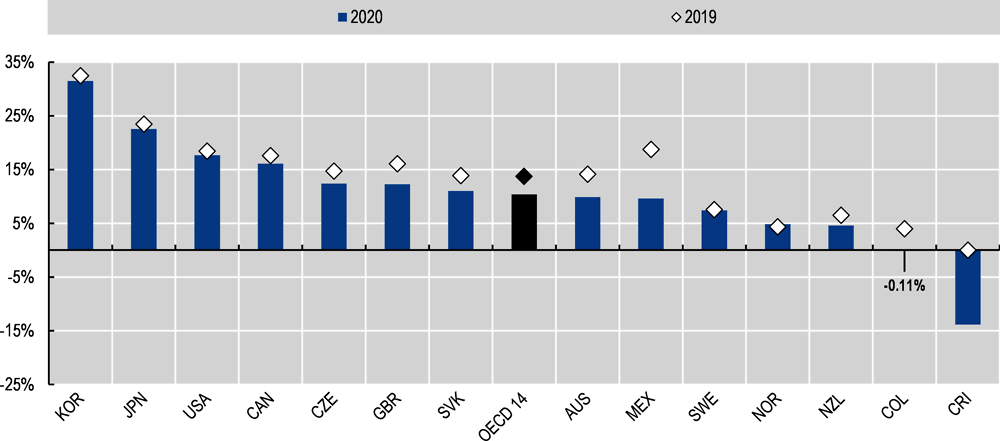
Lower-paid and less-educated workers were most exposed to the pandemic’s immediate impacts on the labour market. These workers are less likely to be in roles that are amenable to teleworking (Box 5.1), making them both more adversely impacted by pandemic-related business closures and more likely to be in roles involving higher social contact and infection risk (OECD, 2020[1]). In 22 European OECD countries, low-wage earners make up a much higher share of those who lost their jobs in 2020 (Figure 5.1). It is therefore not surprising that, across the EU 27, it is estimated that the average loss of employment income between 2019 and 2020 was four times higher for workers in the bottom income quintile compared to those in the top income quintile (-10.2% vs. -2.5%) (Eurostat, 2021[2]).1 Evidence from a separate survey conducted in 25 OECD countries in September-October 2020 also shows that people from low-income households were more likely than those in medium- or high-income households to report a job loss or a job-related disruption (OECD, n.d.[3]).2

Note: All figures are part of the experimental statistics produced by Eurostat in the frame of advanced estimates on income inequality and poverty indicators. Low-income earners comprise individuals in deciles 1, 2 and 3; middle-income earners comprise individuals in deciles 4, 5, 6 and 7; and high-income earners comprise individuals in deciles 8, 9 and 10.
Source: Eurostat (2020[4]), Impact of COVID-19 on employment income - advanced estimates, https://ec.europa.eu/eurostat/statistics-explained/index.php?title=Impact_of_COVID-19_on_employment_income_-_advanced_estimates#A_sharp_decrease_in_the_median_employment_income.
On average in 34 OECD countries, workers with tertiary education experienced a smaller rise in unemployment in 2020 relative to their less-educated peers. Nevertheless, education gaps related to the change in unemployment between 2019 and 2020 did vary across OECD countries, with some experiencing a greater widening of the education gap than others (Figure 5.2). Evidence from the United States indicates that the magnitude of this education gap also varies by sector (Box 5.2).

Note: The OECD average excludes Chile, Denmark, Japan and Turkey. Data for Germany in 2020 are provisional and might be subject to low reliability due to technical issues with the introduction of the new German system of integrated household surveys.
Source: OECD (n.d.[5]), OECD Education statistics (database), https://doi.org/10.1787/889e8641-en.
Data from the US Census Bureau Household Pulse survey (see Box 3.1 for methods) collected between 19 August and 21 December 2020 show that the propensity to switch from in-person work to telework increased with education level: those with a university degree are more than three times as likely to have started working from home during the pandemic, compared to those with only a high school degree (Figure 5.3, Panel A). Data collected as part of Germany’s Socio-Economic Panel (see Box 3.1 for methods) in April-June 2020 meanwhile found that those with higher levels of education are more than four times as likely to report working from home (Figure 5.3, Panel B). This is true both for employees who are able to work from home full-time (18% for high education, 4% for low), as well as for those who work from home only part-time (16% vs. 3%). A subsequent round of data collection in January-February 2021 suggests even greater disparities: 19% of those with higher levels of education were able to work from home full-time, compared to only 2% of those with lower levels of education.
The REpresentations, PErceptions and ATtitudes on COVID-19 (REPEAT) survey collects data on attitudes and behavioural responses to COVID-19, as well as labour market outcomes, in eighteen countries. The survey is a part of a larger project, “Citizens’ Attitudes towards COVID-19”, housed at Sciences Po Paris. Data are collected at four different points in time in each country, so that outcomes can be tracked over the course of the pandemic. Each survey wave samples around 1 000 respondents. Surveys are conducted online; data are then weighted to account for gender, age, occupation, geographic location and political orientation.
The data used in Figure 5.4 were gathered during the second wave of data collection, in mid-April 2020 (see figure note for exact dates per country). In total, surveys were administered to 15 045 respondents in twelve countries: Australia, Austria, Brazil, Canada, France, Germany, Italy, New Zealand, Poland, Sweden, the United Kingdom and the United States. Employees from the bottom earnings quartile and those with at most a high school diploma were more likely to stop working since the pandemic began; and those in this quartile who were able to continue working were less likely to report being able to telework.
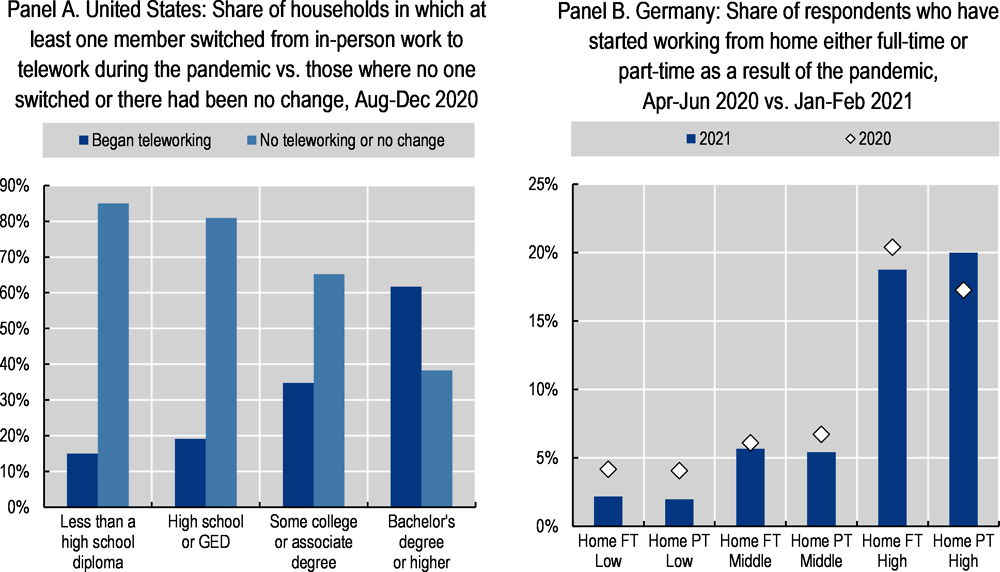
Note: Panel B shows the share of respondents who report working from home either full-time (FT) or part-time (PT), by education level (low, middle, high), in 2020 vs. 2021. The educational categories are defined as follows: “Low” refers to below upper-secondary education (i.e. less than primary, primary and lower secondary education), “Middle” refers to upper secondary education (i.e. secondary and post-secondary non-tertiary education), and “High” refers to tertiary education. Funded by the German Federal Ministry of Education and Research (BMBF). The data can be accessed via the research data centre of the SOEP.
Source: Marshall, J., C. Burd and M. Burrows (2021[6]), Working From Home During the Pandemic, US Census Bureau, https://www.census.gov/library/stories/2021/03/working-from-home-during-the-pandemic.html (Panel A); and Kühne et al. (2020[7]), “The need for household panel surveys in times of crisis: The case of SOEP-CoV”, Survey Research Methods, Vol. 14/2, pp. 195-203, https://doi.org/10.18148/srm/2020.v14i2.7748 (Panel B).
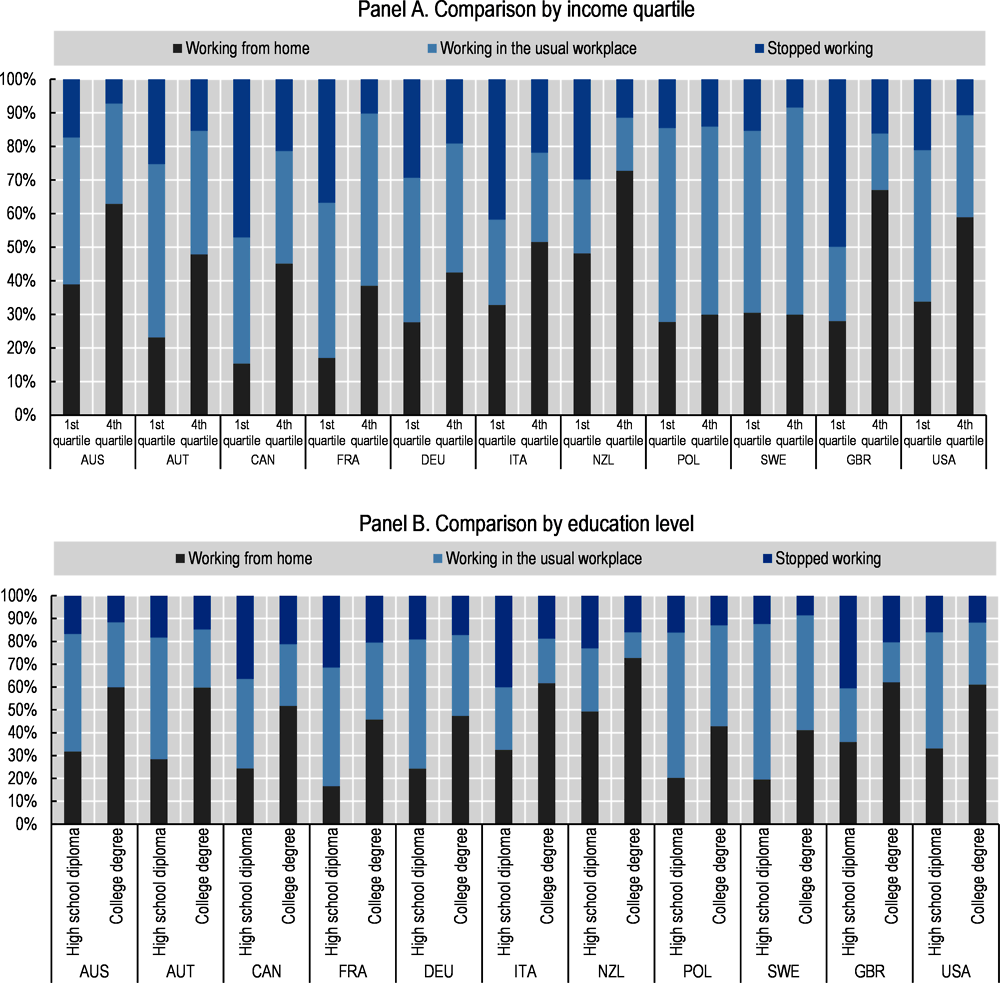
Note: Data are from the REPEAT (REpresentations, PErceptions and ATtitudes on the COVID-19) survey. Data were collected: 15-20 April (Australia); 15-18 April (Austria and New Zealand); 30 April-2 May (Poland); 14-17 April (Canada); 15-16 April (France); 16-18 April (Germany and the United States); 15-17 April (Italy and the United Kingdom); and 16-17 April (Sweden). No data are available on service workers in Australia, New Zealand or the United States, on self-employed in Australia, and on the type of occupation in Canada.
Source: Galasso, V. and M. Foucault (2020[8]), Working during COVID-19: Cross-country evidence from real-time survey data, OECD Social, Employment and Migration Working Papers, No. 246, OECD Publishing, Paris, https://doi.org/10.1787/34a2c306-en.
Workers with lower levels of education and people facing financial difficulties were most worried about losing their jobs between April-June 2020 and February-March 2021. Data for 22 European OECD countries indicate that 13% of those with a secondary education or less reported that it was “very likely” or “likely” that they would lose their jobs within the next three months, compared to 9% of those with a tertiary or above education level (Figure 5.5, Panel A). Similarly, 29% of people who are having difficulty making ends meet felt this way, relative to 7% of those who reported that they could easily make ends meet (Figure 5.5, Panel B).

Note: Ratios above 1 indicate better outcomes for workers with lower education levels (here, defined as those with secondary or below levels of education) or for workers who reported “difficulty” or “great difficulty” making ends meet; values below 1 indicate better outcomes for those with higher education levels (defined as those with tertiary or above) or for workers who can make ends meet “easily”. Job insecurity refers to respondents indicating they were “very likely” or “rather likely” to lose their job within the next three months. Data are not reported where fewer than 100 observations per category are available. ** denotes countries with between 100 and 300 observations per category; * denotes countries with between 301 and 500 observations per category. More than 500 observations per category are available for all other countries. In Panel A, the OECD average includes only those 22 countries shown. Differences between groups are significant at the 5% level for Belgium, Finland, Greece, Hungary, Italy, Latvia, Lithuania, OECD 22, Poland, Portugal and the Slovak Republic. In Panel B, the OECD average includes only those 22 countries shown in Panel A. Difference between groups are significant at the 5% level for all countries, including OECD 22. Refer to Box 2.1 for methodological details on the Living, working and COVID-19 survey.
Source: Eurofound (n.d.[9]), Living, working and COVID-19 e-survey (database), https://www.eurofound.europa.eu/data/covid-19.
In the United States, across all selected industries, workers with lower levels of education had higher unemployment rates than those with a university degree between January 2020 and February 2021. However, in the hardest hit sector of leisure and hospitality, the difference in unemployment rates between the two groups was considerably smaller than (for example) in manufacturing (Figure 5.6).
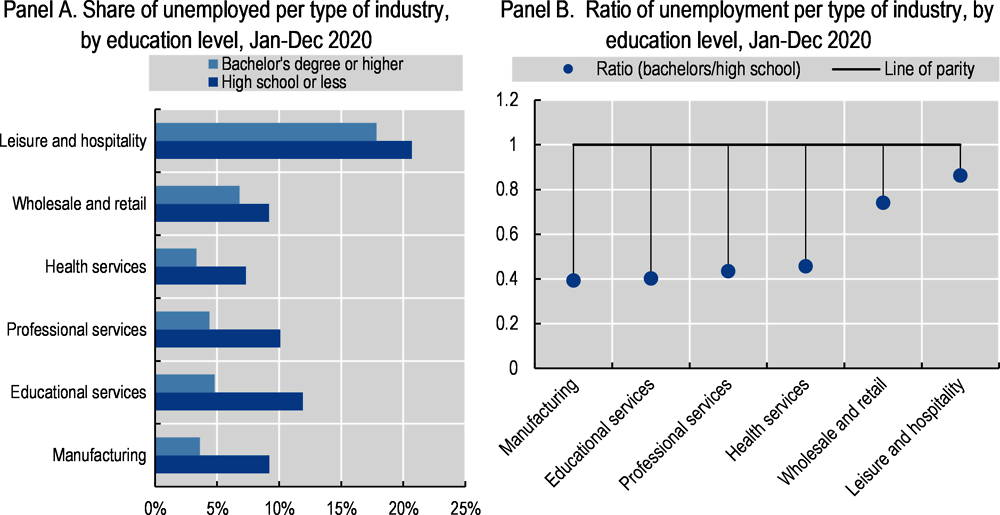
Note: Unemployment rates are expressed as a cumulative average of January-December 2020. In Panel B, ratios above 1 indicate better outcomes for those with lower education levels (high school or less); values below 1 indicate better outcomes for those with higher education levels (bachelor’s degree or higher).
Source: Georgetown University (n.d.[10]), Tracking COVID-19 Unemployment and Job Losses, https://cew.georgetown.edu/cew-reports/jobtracker/#unemployment-tracking.
Younger workers have been further disadvantaged by the pandemic, experiencing higher job and earnings losses than older workers
Young people aged 15 to 24 experienced a higher risk of job loss than workers aged 25 or over during the pandemic. Indeed, young people are more likely to hold less secure and lower skill jobs and are highly represented in sectors more severely exposed to government lockdowns (OECD, 2021[11]). In nearly all OECD countries, young workers experienced higher rises in unemployment compared to older workers between 2019 and 2020 (Figure 5.7, Panel A). In Q2 2020, the OECD average unemployment rate for workers aged 15-24 was 18.5%, more than twice as high as that of workers aged 25 or over (7.4%) (Figure 5.7, Panel B).
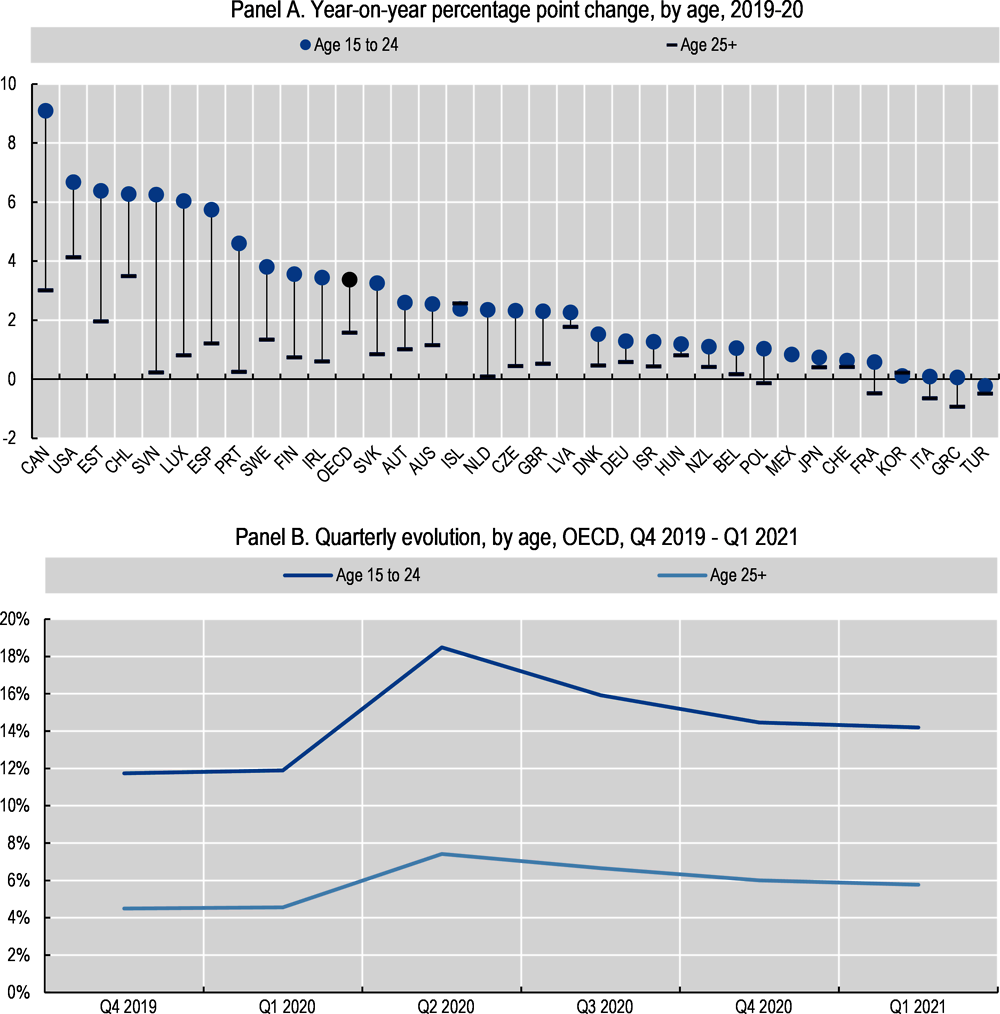
Note: The OECD unemployment rate is calculated as the total number of unemployed people in all OECD countries, as a percentage of the total labour force (i.e. the unemployed plus those in employment). Data for Germany in 2020 are provisional and might be subject to low reliability due to technical issues with the introduction of the new German system of integrated household surveys.
Source: OECD (n.d.[12]), Main Economic Indicators (database), https://doi.org/10.1787/data-00046-en.
The COVID-19 crisis has reversed the decade-long improvement in the number of young people not in education, employment or training (NEET). At the end of 2019, prior to the COVID-19 outbreak, just over 1 in every 10 young people aged 15 to 29 were NEET (OECD, 2021[11]). By the second quarter of 2020, however, the NEET rate increased by 2.9 percentage points year-on-year across the OECD, with a high share of the increase concentrated in inactivity (Figure 5.8). Despite having decreased in the third quarter of 2020, the share of inactive NEET youth remained elevated in the majority of countries in Q4 2020 (OECD, 2021[11]). Periods of inactivity have proved to be very damaging for young people’s career prospects, and the high levels of NEET present during the pandemic are likely to result in longer-term scarring effects (see (OECD, 2021[11]) and Chapter 9 for more information on youth NEET during the pandemic).
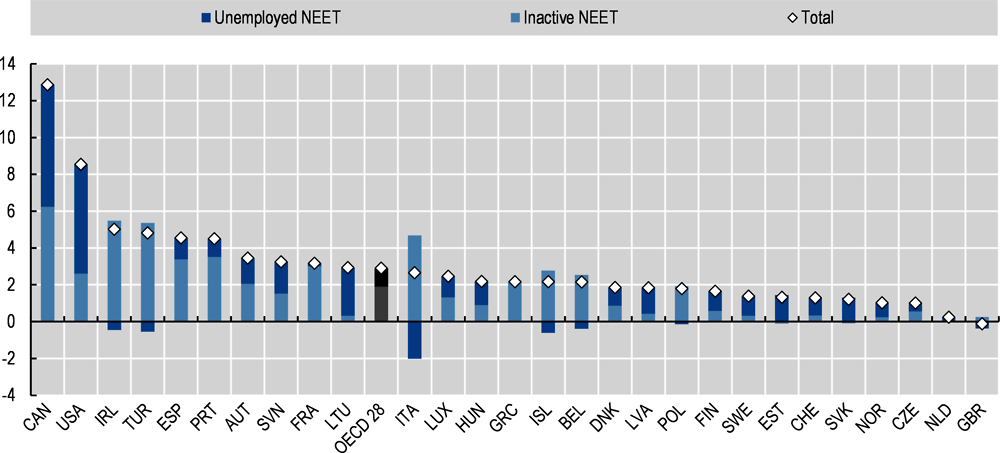
Note: The OECD average excludes Australia, Chile, Colombia, Costa Rica, Germany, Israel, Japan, Korea, Mexico and New Zealand. In Canada, the large increase in NEET rates in Q2 2020 was driven, in large part, by school closures and the large numbers of youth who, as a result, reported that they were not attending school. See https://www150.statcan.gc.ca/n1/pub/81-599-x/81-599-x2020001-eng.htm for more details. Elsewhere, data refer to enrolment rather than attendance and are, as a result, unaffected by school closures. See OECD (2021[11]) for more information on NEET during the pandemic.
Source: OECD (2021[11]), OECD Employment Outlook 2021: Navigating the COVID-19 Crisis and Recovery OECD Publishing, Paris, https://doi.org/10.1787/5a700c4b-en.
Young people were also more exposed to greater falls in earnings and higher rates of job insecurity during 2020. It is estimated that, in the EU 27, younger workers aged 16-34 suffered higher losses in earnings compared to workers aged 35-65 between 2019 and 2020 – respectively 5.8% and 4.5% (Figure 5.9). The younger age group experienced higher losses in employment income in 20 EU Member States, with declines ranging from 15% to 2% compared with 2019. Nevertheless, income support by governments is estimated to have reduced the losses for both age groups (Eurostat, 2021[2]). In addition, data from 22 European OECD countries collected between April-June 2020 and February-March 2021 suggest that job insecurity was also higher among younger workers on average. Specifically, 19% of young people (aged 18 to 24) felt they were likely to lose their job in the following three months, compared to 11% of people aged 25 or over (Figure 5.10).

Note: All figures are part of the experimental statistics produced by Eurostat in the frame of advanced estimates on income inequality and poverty indicators. EU 27 includes all member states of the European Union, including Bulgaria, Croatia, Cyprus, Malta and Romania.
Source: Eurostat (2020[4]), Impact of COVID-19 on employment income - advanced estimates, https://ec.europa.eu/eurostat/statistics-explained/index.php?title=Impact_of_COVID-19_on_employment_income_-_advanced_estimates#A_sharp_decrease_in_the_median_employment_income.
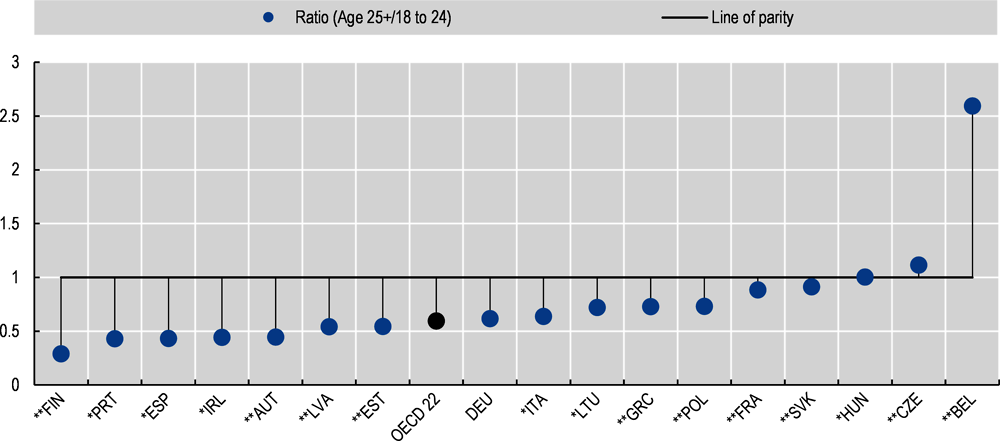
Note: Ratios above 1 indicate better outcomes for workers aged between 18 and 24; values below 1 indicate better outcomes for those aged 25 or over. Job insecurity refers to respondents indicating they were “very likely” or “rather likely” to lose their job within the next three months. Data are not reported where fewer than 100 observations per age category are available. ** denotes countries with between 100 and 300 observations per category; * denotes countries with between 301 and 500 observations per category. More than 500 observations per category are available for all other countries. The OECD average includes Austria, Belgium, the Czech Republic, Denmark, Estonia, Finland, France, Germany, Greece, Hungary, Ireland, Italy, Latvia, Lithuania, Luxembourg, the Netherlands, Poland, Portugal, the Slovak Republic, Slovenia, Spain and Sweden. Differences between groups are significant at the 5% level for Belgium, Finland, Ireland, OECD 22, Portugal and Spain. Refer to Box 2.1 for methodological details on the Living, working and COVID-19 survey.
Source: Eurofound (n.d.[9]), Living, working and COVID-19 e-survey (database), https://www.eurofound.europa.eu/data/covid-19.
COVID-19 also risks compounding existing labour market inequalities between young people. In the 2007-2008 financial crisis, young people with educational attainment below upper secondary level suffered the most from unemployment and inactivity, which persisted during the recovery. Indeed, in 2017, young people with no more than lower-secondary education were three times more likely to be not in employment, education or training (NEET) compared to those with a university degree (OECD, 2020[13]).
Young women were particularly affected by job and income losses during COVID-19. On average across the OECD, the youth unemployment rate for women aged 15 to 24 increased by 3.9 percentage points between 2019 and 2020, while the unemployment rate for young men grew by 2.9 percentage points (Figure 5.11). In addition, among EU 27 countries, young women (aged 16 to 24) are estimated to have experienced higher labour income losses between 2019 and 2020 compared to young men (12.7% versus 11.3%) (Eurostat, 2021[2]).
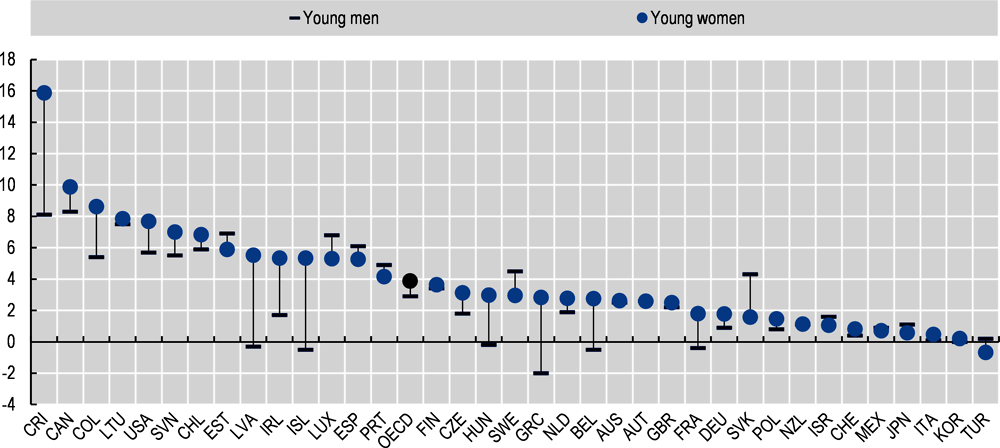
Note: The OECD unemployment rate is calculated as the total number of unemployed people in all OECD countries, as a percentage of the total labour force (i.e. the unemployed plus those in employment). Data for Germany in 2020 are provisional and might be subject to low reliability due to technical issues with the introduction of the new German system of integrated household surveys.
Source: OECD (n.d.[12]), Main Economic Indicators (database), https://doi.org/10.1787/data-00046-en.
The pandemic has affected both men and women negatively in terms of employment, but women, especially mothers, face a number of additional vulnerabilities and challenges
A number of factors have made women more vulnerable to job and income loss during the COVID-19 crisis. First, women tend to be less firmly attached to the labour force than men; they also tend to work fewer hours and to have lower wages (OECD, 2021[11]). Second, women are over-represented in the services sector, including retail, catering and hospitality, which were hit the hardest by government lockdown measures. In 2019, the share of employed women in the services sector across 26 OECD countries was 84.1% on average, 22.8 percentage points higher than that of men (61.3%).
Nevertheless, women make up a large share of workers in the sectors defined as essential, including health care and education. As such, women have been facing exceptional work demands and are more likely to be exposed to COVID-19 while working (OECD, 2021[11]). In addition, the pandemic’s impact on employment has been partly shaped by whether people’s jobs enable them to telework, which tends to be possible in both male and female-dominated sectors (e.g. education) (see Box 5.5 for information on teleworking experiences for different population groups) (OECD, 2021[11]).
Therefore, on average across the OECD, women and men experienced similar rises in unemployment in 2020 (respectively by 1.8 and 1.6 percentage points) (Figure 5.12, Panel A). Indeed, while in Q2 2020, right after the onset of the crisis, average unemployment rose slightly more for women than for men, the average gender unemployment gap went back to pre-pandemic levels by Q4 2020 and Q1 2021 (Figure 5.12, Panel B). Patterns vary across countries, however (see Box 5.3 for evidence from Chile and (OECD, 2021[11]) for more information) (Refer to Chapter 7 for information on how the pandemic impacted unpaid work for women and men). Eurostat estimates meanwhile indicate that, at the EU 27 level, there were no substantial differences in labour income losses between women and men (Eurostat, 2021[2]).
In many OECD countries, reduced work hours cushioned the impact of school closures on employment, for both women and men. Indeed, the closure of schools and childcare facilities threatened the labour market attachment of women in particular, as they are more likely than men to move to part-time employment or to leave the labour market due to caregiving responsibilities. In a number of countries, job retention schemes, short-time work schemes or specific care leave allowed women to retain their job while working fewer hours (OECD, 2021[11]). As a result, the gendered impact of the pandemic on unemployment varied across countries. For instance, the impact on women and men was similar in most European countries – where large use of job retention schemes was made – in contrast with the United States and Canada, which mainly relied on temporary layoffs (Figure 5.12, Panel A) (see also Chapter 2).
Government policies mitigated the impact on employment, but parents were still more likely to withdraw from the labour force, especially mothers with young children. In the EU 27, absences from work were higher among women than men between 1 January and the end of June 2020, and they were most frequent during school and childcare centre closure (ILO and UN Women, 2020[14]). Evidence from Chile, Costa Rica and Mexico reveals that partnered women with children experienced sharper pandemic-related drops in labour force participation rates (LFPR) between Q1 and Q2 2020 than partnered men with children – and that these falls were most common among women with children under six-years-old (ILO and UN Women, 2020[14]). In the United States, the participation rates for parents fell more than for non-parents during the first year of the pandemic, and mothers’ participation rates fell more than for fathers. The LFPR of mothers overall was about 3.5 percentage points lower in March 2021 than in January 2020. By contrast, fathers’ LFPR was down only by 1 percentage point. In particular, in March 2021, the LFPR of single mothers and mothers with children under 12 was lower than that for mothers with teenage children (Figure 5.13). Moreover, in the United States in October-November 2020, about 14% of unmarried mothers and mothers whose youngest child was under age 6 reported that they left their job due to child-care responsibilities in 2020, compared with 8% of mothers with children aged 6 to 12 (Bauer, 2021[15]).
On average in 14 OECD countries, the gender wage gap narrowed from 13.7% to 10.4% in 2020 (Figure 5.14). One possible explanation for this is compositional: women are over-represented in low-paid occupations in the sectors hardest hit by the pandemic, and therefore were more exposed to job loss in 2020. As a result of the missing lowest-paid women, the gender wage gap narrowed (Institute for Women’s Policy Research, 2021[16]).
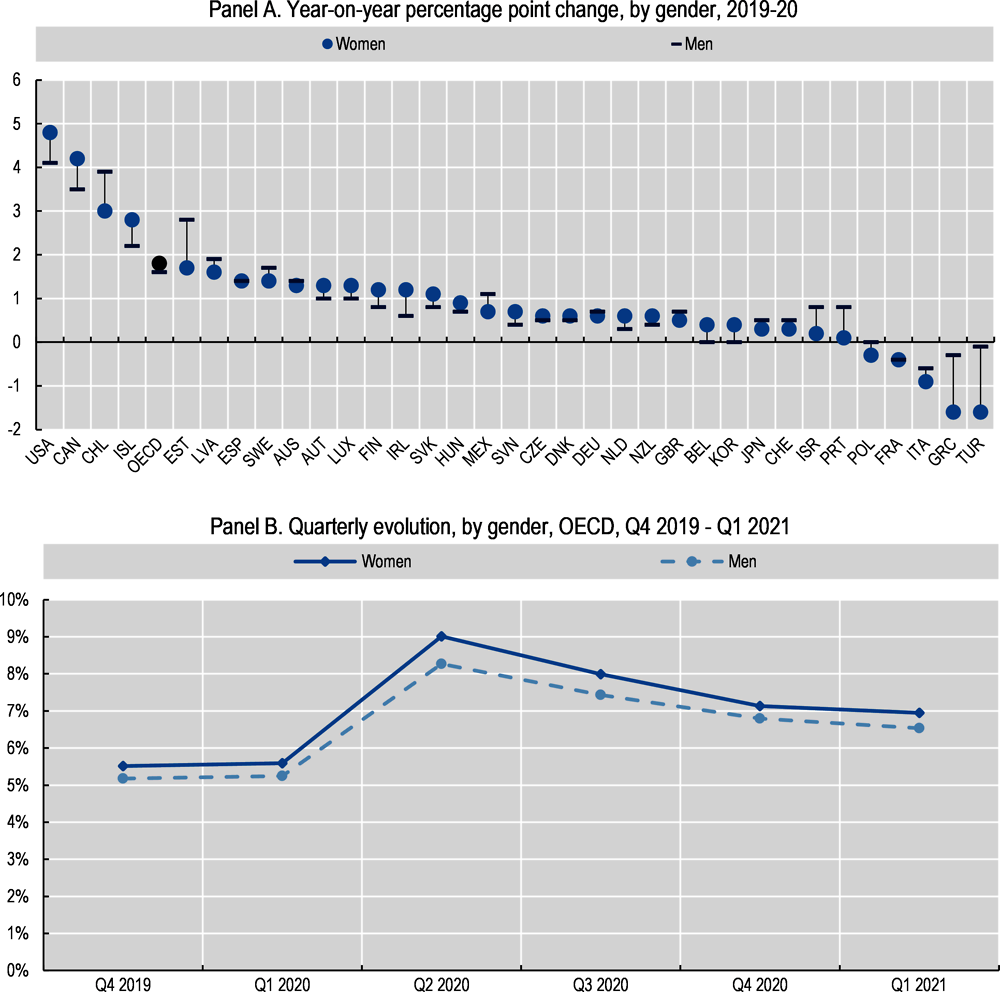
Note: The OECD unemployment rate is calculated as the total number of unemployed people in all OECD countries, as a percentage of the total labour force (i.e. the unemployed plus those in employment). Data for Germany in 2020 are provisional and might be subject to low reliability due to technical issues with the introduction of the new German system of integrated household surveys.
Source: OECD (n.d.[12]), Main Economic Indicators (database), https://doi.org/10.1787/data-00046-en.

Note: The figure shows outcomes for mothers/fathers according to their marital status and age of their children.
Source: Bauer (2021[15]), Mothers are being left behind in the economic recovery from COVID-19, Brookings, https://www.brookings.edu/blog/up-front/2021/05/06/mothers-are-being-left-behind-in-the-economic-recovery-from-covid-19/.
Note: The gender wage gap is calculated as the difference between the median earnings of men and women relative to the median earnings of men. The OECD average includes only those 14 countries shown.
Source: OECD (n.d.[17]), Employment and Labour Market Statistics (database), https://doi.org/10.1787/data-00302-en.
The Chilean COVID-19 Social Survey (Encuesta Social COVID-19) is an initiative of the United Nations Development Program (UNDP), in conjunction with the National Institute of Statistics (INE) and in partnership with the Ministry of Social Development and Family (MDSF). Currently, two rounds of the survey have been conducted: the first in July 2020 and the second in November 2020. 13 648 people were surveyed in the first round, and 10 344 in the second round. For both rounds, the survey took place through a phone interview conducted with a web questionnaire. The survey is made up of the following modules: characterisation of the household economic impact, access to help from third parties, care, income, mental health and availability of information. The second round also included information about the presence of children and adolescents in the households.
According to the COVID-19 Social Survey, women and low-income households fared worse on a number of material well-being indicators. For instance, both the share of households with no employed members and the share of households who felt their income was insufficient were higher among women-led households and for those in the bottom income quintile in November 2020 (Figure 5.15).
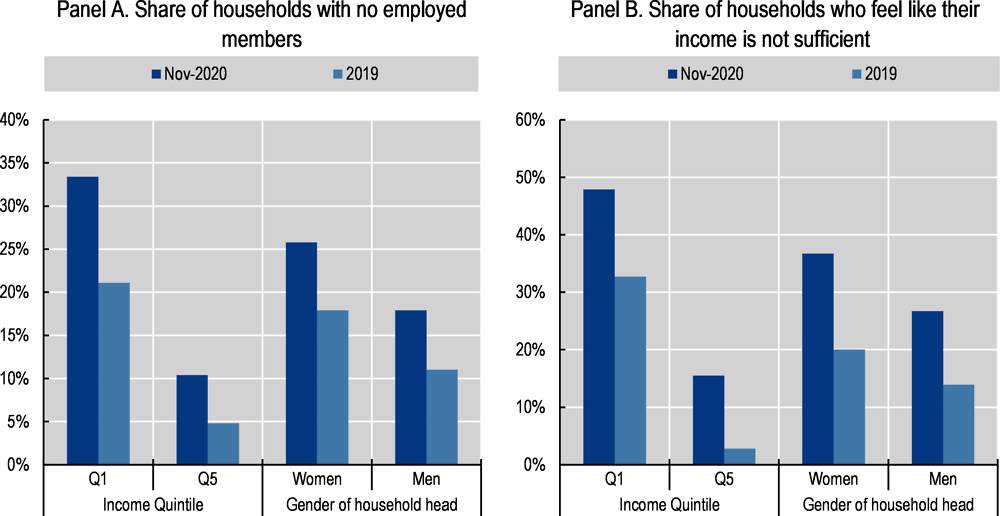
Source: Ministerio Desarrollo Social y Familia (n.d.[18]), Encuesta Social COVID-19 (COVID-19 Social Survey), http://observatorio.ministeriodesarrollosocial.gob.cl/encuesta-social-covid19.
Immigrants and people belonging to racial/ethnic minorities were often the first to lose their jobs at the beginning of the pandemic
Although it is still too early to gauge the full labour market effects of the pandemic – especially in European OECD countries, where job retention schemes have cushioned the immediate impact of the lockdowns – initial evidence shows a disproportionate toll throughout 2020 on migrants in all countries where data are currently available (OECD, 2020[19]).3 Overall, employment trajectories for native- and foreign-born individuals followed similar trends for 23 OECD countries – they dropped sharply in the second quarter of 2020 and slightly recovered in the third. Unlike that of native-borns, however, employment among migrant workers declined again in the last quarter of 2020 (Figure 5.16, Panel A and B). In the first quarter of 2021, the employment rate decreased more for foreign-born than for native-born individuals (Figure 5.16, Panel A). Some care is needed in interpreting the latest developments in the OECD employment rate, as methodological changes to the EU Labour Force Survey blur the comparison between the fourth quarter of 2020 and the first quarter of 2021 for EU countries.4 Migrants were also more affected by unemployment, particularly in the first half of 2020 (OECD, 2020[19]).
Migrants face a number of vulnerabilities in the labour market. They are over-represented among employees with temporary contracts and low wages, in cyclical sectors and in service sectors (such as hospitality, security and cleaning) which were particularly affected by the pandemic (Statistics Canada, 2020[20]; OECD, 2020[19]). In the EU, migrants account for about 12% of the population, but for more than a quarter of employment in the hospitality industry (OECD, 2020[21]). Migrants have fewer networks to rely upon in times of economic downturn, and there is some evidence that discrimination is more pronounced in times of slack labour markets (OECD, 2020[19]).
In addition, the different employment, language training and income support programmes that newcomers rely upon have been suspended or interrupted in the wake of the pandemic in some OECD countries, although they moved to remote delivery modes in some places such as Canada. This is likely to negatively affect migrant employment outcomes in the long term, especially for parents who also faced competing family and childcare priorities during COVID-19. Refugees have been particularly impacted in this regard during the pandemic: for instance, in Germany, 39% of refugee respondents stated that their language skills had deteriorated in 2020 (Brücker, 2021[22]). In Australia, temporary migrants were excluded from the JobKeeper and JobSeeker income support packages introduced for the general population in March 2020. A July 2020 survey of over 6 000 temporary visa holders in Australia, including international students, temporary graduate and skill shortage visa holders as well as refugees and asylum seekers, revealed that 70% of those respondents who were working lost their job or most of their hours or shifts; 28% of these respondents were also unable to pay for meals or food for some period since March (Berg and Farbenblum, 2020[23]).
The limited data available also suggest that people belonging to racial and ethnic minorities have faced greater labour market challenges during the pandemic. In the United Kingdom, the unemployment rate of people identifying as ethnic minority5 stood at 8.5% between July and September 2020, 1.4 percentage points higher than in the same period in 2019. Over the same period, the unemployment rate among white people had risen by only 0.9 percentage points, to 4.5% (ONS, n.d.[24]). Indeed, industries such as transport and storage as well as accommodation and food sectors in which ethnic minority workers are over-represented announced the most redundancies over the summer (ONS, 2020[25]; Powell, Francis-Devine and Foley, 2020[26]). Ethnic minority workers were also less likely to have been placed on job retention schemes, and more likely to have permanently lost their jobs, relative to white British people in April, while their average household earnings fell by slightly more than for white workers between February and April (8.4% compared to 8%) (Benzeval et al., 2020[27]; Hu, 2020[28]). In the United States, while by April 2021 unemployment rates had fallen from their April 2020 heights for all racial/ethnic groups, gaps between white and Black as well as Hispanic/Latino communities markedly widened compared to end 2019 (doubling for the former and tripling for the latter group) (Figure 5.17) (see Box 5.4 for information on the pandemic’s impact on racial/ethnic minority-owned SMEs). In Canada, experimental estimates from the Labour Force Survey suggest that from January 2020 to January 2021, the unemployment rate increased by 5.3 percentage points among Black Canadians, compared to 3.7 percentage points among non-visible minority6 Canadians (excluding Indigenous people). In the three months ending in January 2021, the unemployment rate among Black Canadians (13.1%) was about 70% higher than that among non-visible minority Canadians (7.7%) (Statistics Canada, 2021[29]).

Note: In both panels, the OECD average includes only those 23 countries shown in Panel B.
Source: Eurostat (n.d.[30]), Employment rates by sex, age and country of birth (%) (database), https://ec.europa.eu/eurostat/web/lfs/data/database; and US Bureau of Labor Statistics (n.d.[31]), Employment status of the civilian population by nativity and sex, not seasonally adjusted (database), https://www.bls.gov/webapps/legacy/cpsatab7.htm.

Source: US Bureau of Labor Statistics (n.d.[32]), Civilian Unemployment Rate (database), https://www.bls.gov/charts/employment-situation/civilian-unemployment-rate.htm.
Women and young people belonging to racial/ethnic communities in the United States were particularly hard hit by the pandemic, experiencing exceptionally high levels of unemployment, and slow employment gains in the recovery. Between February and May, Hispanic/Latino (-21%), Asian (-19%) and Black (-17%) women experienced a greater loss in employment than white women (-13%) (Pew Research Center, 2020[33]). By August 2020, Black women had recovered only 34% of their pre-pandemic jobs, compared to 61% of jobs recovered by white women; by September 2020, the unemployment rates of Black (11.1%) and Hispanic/Latino women (11%) were still more than twice as high as prior to the pandemic (National Women’s Law Center, 2020[34]; Long et al., 2020[35]). The unemployment rate for Hispanic/Latino women, who are more likely than others to be employed in hard-hit leisure and hospitality services, continued to increase from 10.5% in August 2020, even as unemployment rates improved for all other groups of workers aged 20 or over by race/ethnicity and gender (National Women’s Law Center, 2020[34]). Higher exposure to the virus also played a role: in an experimental online survey, a significantly higher share of Hispanic/Latino and Black adults compared to white adults (2.8% and 2.6% vs. 0.3%, respectively) stated in August 2020 that they could not go to work in the previous week because they or someone in their family was sick with COVID-19 (CDC, 2020[36]). Similarly, Black teens aged 16 to 19 on average had the highest unemployment rate (18.9%) among all other age and race/ethnicity groups between July 2020 and July 2021. Hispanic/Latino youth aged 16 to 19 also experienced high unemployment rates (16.8% on average) during the same period (Broady, 2021[37]). Additionally, the unemployment rate for Black teens aged 16 to 19 increased from 9.3% in June 2021 to 17.9% in August 2021, while it decreased for most other racial/ethnic and age groups (Broady, 2021[37]).
Emerging evidence also suggests that the crisis may have longer-lasting consequences among some more disadvantaged groups. In Canada, Indigenous and non-Indigenous people were similarly impacted in terms of unemployment initially, but greater disparities appeared as the pandemic progressed. From the three months ending in February to the three months ending in May 2020, the unemployment rate of Indigenous people living off reserve and non-Indigenous people both increased by a similar amount and stood at 16.6% and 11.7%, respectively. However, employment among Indigenous people has been slower to recover. Year-on-year, the employment rate in June-August 2020 was down 6.9 points among Indigenous people living off reserve and down 5.0 points among non-Indigenous people (Statistics Canada, 2020[38]). During the same months, Indigenous women’s employment rate (for those living off reserve) was further away from pre-pandemic levels than the one for Indigenous men (Statistics Canada, 2020[38]).
The COVID-19 crisis hit businesses owned by women, racial/ethnic minority and younger entrepreneurs disproportionately. Their businesses tend to be concentrated in the most affected sectors and are on average smaller and younger. Being typically self-funded or funded by friends and family, these businesses have fewer financial assets and more limited access to diversified sources of finance. Women and racial/ethnic minority entrepreneurs have faced higher risks of unemployment and income loss than other categories, and government support has been less effective at reaching their businesses. As far as women entrepreneurs are concerned, increasing household and care responsibilities also played a role in shaping these developments (OECD, 2021[39]).
Women-led SMEs were seven percentage points more likely to close compared to men-led SMEs, according to data collected in May 2020 by Facebook, the OECD and the World Bank. This pattern varies across regions, with the largest gender disparity in business closures to be found in North and Latin America (14 and 11 percentage points respectively). All regions in the world have at least a 6 percentage point gender disparity in business closure rates (OECD, 2021[40]). Other studies confirm the higher impact of the crisis on women entrepreneurs. In the United States, the number of women business owners declined by 10%, compared to 7% of men business owners (Fairlie, 2020[41]). In Germany, self-employed women were 35% more likely to experience revenue loss than men (Graeber, Kritikos and Seebauer, 2021[42]). Lastly, in Canada, 62% of women-owned businesses laid off more than 80% of their workers, against 45% on average for the small business population at large (OECD, 2021[40]).
Racial/ethnic minority entrepreneurs were significantly affected as well, according to evidence from the United States. Between February and April 2020, the number of Black and Hispanic/Latino businesses dropped by 41% and 32% respectively, compared to the general 22% decrease in active business owners (Fairlie, 2020[41]). In addition, a survey among small businesses conducted by the US Chamber of Commerce in the first half of November 2020 revealed that 74% of owners needed further government assistance to navigate the crisis. This share rises to 81% for racial/ethnic minority-owned businesses. Evidence from a US Federal Reserve Survey indicates that racial/ethnic minority-owned businesses are experiencing a slower recovery. In early 2021, 79% of Asian-owned, 77% of Black-owned and 66% of Hispanic/Latino-owned businesses described their financial situation as “fair” or “poor”, compared to 54% of white-owned firms (OECD, 2021[40]).
Members of LGBTQ+ communities have experienced very large job and income losses since the pandemic began
The demographic composition of LGBTQ+ communities and their prevalence in the sectors most affected by government containment measures – such as hospitality, arts and entertainment – makes them more vulnerable to job and income loss (Wenham, 2020[43]). In Canada, in 2018, LGBTQ2+7 Canadians were generally younger than non-LGBTQ2+ Canadians and were significantly less likely to identify as male (Prokopenko and Kevins, 2020[44]). A majority (53%) of LGBTQI2S8 households in Canada have been affected by lay-offs and reduced hours as a result of the pandemic, compared to 39% of overall Canadian households (Innovative Research Group, 2020[45]).9 In the United States, according to a survey conducted in July-August 2020, 64% of LGBTQ households experienced employment loss compared to 45% of non-LGBTQ households (this included losing their jobs, having their hours or wages reduced, having been furloughed, or taking a mandatory unpaid leave) (Movement Advancement Project, 2020[46]). This share rises to 71% of Hispanic/Latino LGBTQ households and 68% of lower-income LGBTQ households (< USD 30 000 per year) (Movement Advancement Project, 2020[46]). Compounding these difficulties, LGBTQ people report higher rates of employment discrimination generally and may struggle to find new jobs.10
Even for those who can telework, the pandemic has brought disruptions to their working lives. Parents working from home faced challenges juggling work and childcare responsibilities, particularly in the face of school and nursery closures. In the United States in October 2020, parents were more likely than non-parents to report not being able to meet deadlines and not having the right space and equipment to work from home. In addition, half of teleworking parents with children younger than 18 said it’s been difficult for them to be able to get their work done without interruptions, while only 20% of parents who do not have minor children reported the same (Parker, Menasce Horowitz and Minkin, 2020[47]).1 In the United States, teleworkers younger than 50 have been significantly more likely than older workers to say it’s been difficult for them to be able to get their work done without interruptions (38% versus 18%) (Parker, Menasce Horowitz and Minkin, 2020[47]).
Teleworking is having mixed impacts on work-life balance, enabling more flexibility and family time, but bringing more worry and workaholism. In 22 European OECD countries, in July 2020, respondents who worked exclusively from home were slightly more likely to worry about work when not working (24%) compared to those who worked at their employer’s premises or other locations (20%). At that same time in the EU 27, 22% of parents working exclusively from home reported finding it hard to focus on work due to family, compared to only 8% of parents working at other locations and 5% of teleworkers with no children (Eurofound, 2020[48]). Younger workers struggled too: according to the qualitative study run by the European Commission Joint Research Centre in Italy, France and Spain in April-May 2020, “workaholism” was more common among younger workers living alone (Fana et al., 2020[49]). However, many appreciate the flexibility and additional family time that come with teleworking. In the EU 27, teleworkers with children under 12 were less likely to report that their job prevents them from spending time with family (32%) than those working at other locations (38%) in July 2020 (refer to Chapter 4 for more information on work-life balance) (Eurofound, 2020[48]). In the United States, in October 2020, 29% of teleworkers said they now have more flexibility to choose when to put in their work hours, and 38% of them said it is now easier for them to balance work with family responsibilities (Parker, Menasce Horowitz and Minkin, 2020[47]). Indeed, additional evidence from the United States suggests that workers with children under 18 have the strongest preferences to continue working from home, at least two or three times a week (64% compared to 49% of workers with no children). This preference is also more common among women than men (57.8% versus 54.1%) and among workers with a four-year college degree (58% versus 53% of employees without a four-year college degree) (Barrero, Bloom and Davis, 2021[50]).2
Work generally has been more stressful and draining since the beginning of the pandemic, including for teleworkers. COVID-19 has put additional pressure on workers, as anxiety or job insecurity affect many of them (refer to Chapter 2), and those working from home have not been spared this experience. According to a survey conducted in nine countries worldwide by the Capgemini Research Institute, in September-October 2020, over half of the surveyed employees felt burnt out as a result of working remotely, and the figure rises to 61% for younger employees aged 31-40.3 Moreover, 56% of surveyed employees feared the stresses and demands of being “always on” (Capgemini Research Institute, 2020[51]).
There is a significant age gap in the extent to which workers are facing motivational challenges in their virtual work lives. In October 2020 in the United States, while the majority of teleworkers (six-in-ten) said it has been “very or somewhat easy” to feel motivated to do their work since the pandemic started, 53% of those between aged 18-29 compared to 20% of those over 50 found it “difficult” (Parker, Menasce Horowitz and Minkin, 2020[47]). In 22 European OECD countries, in July 2020, it was less likely for teleworkers to feel like they are doing a useful job “always” or “most of the time” (71%) compared to those who work at other locations (76%) (Eurofound, 2020[48]).
In addition, some workers miss in-person contact and have been feeling isolated while teleworking. According to an Ipsos study conducted in 28 countries in November-December 2020, nearly half of those who worked from home said they have felt lonely or isolated when they did (Ipsos, 2020[52]).4 In the EU 27, 12% of all employees felt isolated at work “always” or “most of the time” in July 2020. This affected a larger share of younger respondents (15% of those aged 18-34), but only 12% of those aged 35-49, and just 9% of 50+ year-olds. Isolation is also reported by a larger share of those exclusively working from home (15%) compared to those working from other locations (10%) (Eurofound, 2020[48]).
Young workers and newcomers feel disconnected from their teams. 56% of the employees surveyed by the Capgemini Research Institute felt disconnected from their organisation due to remote working in September-October 2020. Of the employees who feel disconnected, 41% fall in the 31-40 age bracket, but in the over-50s, this drops to 8% (Capgemini Research Institute, 2020[51]). The experience of teleworking has been particularly difficult for newcomers in this respect. In fact, 50% of these new joiners say that they would not continue with the organisation if they had to work only from a remote location, and 55% of them do not feel integrated into the organisation due to the impersonal nature of interactions (Capgemini Research Institute, 2020[51]).
← 1. Data collected between 13 and 19 October 2020. Sample size: 5 858, national, random sampling of residential addresses. The survey is weighted to be representative of the United States adult population by gender, race, ethnicity, partisan affiliation, education and other categories.
← 2. Data are from the June 2021 Survey of Working Arrangements and Attitudes. Sample size: 2 232. Raw responses were re-weighted to match population shares in the 2010 to 2019 CPS.
← 3. The Remote Workforce Survey was conducted in France, India, Italy, Germany, the Netherlands, Spain, Sweden, the United Kingdom and the United States. The survey included 500 organisations, 5 016 employees and 500 executives.
← 4. Study conducted in Argentina, Australia, Belgium, Brazil, Canada, Chile, China (mainland), Colombia, France, Germany, Hungary, India, Italy, Japan, Malaysia, Mexico, the Netherlands, Peru, Poland, Russia, Saudi Arabia, South Africa, South Korea, Spain, Sweden, Turkey, the United Kingdom and the United States. Average sample size per country: 458.
Younger, lower-paid and less-educated employees have lost the highest number of hours worked, mostly due to joblessness rather than reduced working time
Working hours fell for different reasons among people of different ages, incomes and education levels: while some lost their jobs, others remained in employment but worked fewer or zero hours (OECD, 2021[11]). Despite the widespread use of job retention schemes in many OECD countries, joblessness accounted for the majority of the hours lost among less-educated, lower-paid and younger workers (OECD, 2021[11]). For example, in Q2 2020 compared to Q2 2019, average hours worked fell by 8.5% among those with a tertiary education, compared to 24.3% among those holding a lower-secondary diploma or less. In addition to having experienced a higher reduction in hours worked, in Q2 2020, half of the total hours lost among less-educated employees was due to joblessness (Figure 5.18, Panel A). By contrast, for people with a tertiary education, net losses in total hours worked are all attributable to reduced working time, while remaining in employment (Figure 5.18, Panel B). Educational disparities were reinforced across the third and the fourth quarters of 2020, when many high-educated employees returned to work, while joblessness persisted among the low-educated (Figure 5.18).

Note: The figure reports the contribution of each category to the change in total hours. The change in hours is decomposed in (1) the change in the average hours worked for at-work employees, (2) the net change in the level of 0-hour employees and (3) the net change in the level of jobless individuals (inactive and unemployed). Positive values for “joblessness” indicate net job creation. See Annex 1.A in OECD (2021[11]) for further details on the decomposition. The OECD average excludes Australia, Colombia, Costa Rica, Iceland, Germany, Israel, Japan, Korea and New Zealand.
Source: OECD (2021[11]), OECD Employment Outlook 2021: Navigating the COVID-19 Crisis and Recovery OECD Publishing, Paris, https://doi.org/10.1787/5a700c4b-en.
Similarly, younger employees lost a higher number of working hours compared to their older peers. In Q2 2020, across the OECD, young people aged 15-24 saw their working hours reduced by 26.3%, while the working hours of those aged 25 and over decreased by 15% compared to Q2 2019. The reduction in working hours of employees over 25 was largely driven by reduced working time in employment, while for younger workers, joblessness was the primary cause (Figure 5.19). Even when young workers lost their hours due to reduced working time, this largely consisted of zero-hours employment (Figure 5.19) (OECD, 2021[11]).

Note: The figure reports the contribution of each category to the change in total hours. The change in hours is decomposed in (1) the change in the average hours worked for at-work employees, (2) the net change in the level of zero-hour employees and (3) the net change in the level of jobless individuals (inactive and unemployed). Positive values for “joblessness” indicate net job creation. See Annex 1.A in OECD (2021[11]) for further details on the decomposition. The OECD average excludes Australia, Colombia, Costa Rica, Israel, Korea and New Zealand.
Source: OECD (2021[11]), OECD Employment Outlook 2021: Navigating the COVID-19 Crisis and Recovery OECD Publishing, Paris, https://doi.org/10.1787/5a700c4b-en.
People who lost their jobs and those with lower levels of educational attainment have been facing particular financial strain
The year 2020 has been characterised by widespread financial difficulty, especially for the less educated and the unemployed, who tend to have less of a financial safety net. Indeed, those who lost their jobs as a result of the COVID-19 crisis tend to belong to more financially vulnerable groups (e.g. young, low-income, racial/ethnic minorities). Similarly, people with higher levels of education typically have greater household wealth to rely upon in times of need and more financial security. Around 2016, data from 28 OECD countries showed that, on average, median wealth among households headed by someone with a tertiary education was around double that of households headed by someone with a below upper secondary education (OECD, 2020[53]). At the same time, 26% of tertiary-headed households on average were financially insecure (measured as having liquid financial wealth to support their household above the poverty threshold for more than three months), while over 35% of households headed by a person lacking tertiary education faced this risk (OECD, 2020[53]).
Given the lower wealth of the less educated before the COVID-19 crisis, it is not surprising that they report greater financial difficulties. Across 25 OECD countries, 33% of respondents with less than a tertiary education reported that they or someone in their household had experienced some form of financial difficulty, compared to 28% of those with at least a tertiary education in September-October 2020 (see note to Figure 5.20 for the full list of financial difficulties) (Figure 5.20, Panel A). Separate evidence collected in 22 European OECD countries reveals that between April-June 2020 and February-March 2021 the share of people with a secondary or lower education facing difficulty in making ends meet increased at a higher rate compared to that of people with a tertiary education (by 1.6 and 0.7 percentage points respectively) (Figure 5.20, Panel B).

Note: In Panel A, ratios with values above 1 indicate better outcomes for those with less than a tertiary education; values below 1 indicate better outcomes for those with at least a tertiary education. Respondents were asked whether, at any time since the start of the COVID-19 pandemic, they (or their household) had experienced one or more of a range of specific finance-related events. Options included: failed to pay a usual expense; took money out of savings or sold assets to pay for a usual expense; took money from family or friends to pay for a usual expense; took on additional debt or used credit to pay for a usual expense; asked a charity or non-profit organisation for assistance because they could not afford to pay; went hungry because they could not afford to pay for food; lost their home because they could not afford the mortgage or rent; or declared bankruptcy or asked a credit provider for help. Respondents could select all the options that applied. The OECD average includes only those 25 countries shown. In Panel B, the OECD average includes Austria, Belgium, the Czech Republic, Denmark, Estonia, Finland, France, Germany, Greece, Hungary, Ireland, Italy, Latvia, Lithuania, Luxembourg, the Netherlands, Poland, Portugal, the Slovak Republic, Slovenia, Spain and Sweden. Differences between groups are significant at the 5% level in April-June 2020, June-July 2020 and February-March 2021. Refer to Box 2.1 for methodological details on the Living, working and COVID-19 survey.
Source: OECD (n.d.[3]), Risks That Matter Survey, http://oe.cd/RTM (Panel A); and Eurofound (n.d.[9]), Living, working and COVID-19 e-survey (database), https://www.eurofound.europa.eu/data/covid-19 (Panel B).
In 25 OECD countries in September-October 2020, those who experienced job loss during the pandemic were more than twice as likely to report financial difficulties. Of people reporting that they or someone else in their household had lost their job, 68% had at least one form of financial difficulty during the pandemic (Figure 5.21, Panel A, see the figure note for the full list of financial difficulties). This compares to an average of 26.3% of people who did not experience job loss. Moreover, almost three-quarters (74%) of those who lost their job during COVID-19 were somewhat or very concerned about their household not being able to pay all expenses and make ends meet in the next year or two, compared to 60% of those who did not report job loss (OECD, 2021[54]).
In 22 European OECD countries, the crisis has widened inequalities in financial difficulties between employment groups. In April-June 2020, on average, 51% of unemployed respondents in 22 European OECD countries reported difficulties in making ends meet, compared to only 17% of the employed. Data from 2018 imply that the percentage of unemployed people who could not make ends meet in the same countries increased by 3.9 percentage points between 2018 and April-June 2020, while the share of employed people in the same condition increased by only 2.2 percentage points. What is more, while the share of employed respondents reporting difficulties to make ends meet decreased to 16% by February-March 2021, that of unemployed respondents in the same condition increased to 57% (Figure 5.21, Panel B).

Note: In Panel A, respondents were asked whether, at any time since the start of the COVID-19 pandemic, they (or their household) had experienced one or more of a range of specific finance-related events. Options included: failed to pay a usual expense; took money out of savings or sold assets to pay for a usual expense; took money from family or friends to pay for a usual expense; took on additional debt or used credit to pay for a usual expense; asked a charity or non-profit organisation for assistance because they could not afford to pay; went hungry because they could not afford to pay for food; lost their home because they could not afford the mortgage or rent; or declared bankruptcy or asked a credit provider for help. Respondents could select all the options that applied. "Job loss in household" refers to respondents reporting that either they or any member of their household have/has either "Lost their job or been laid off permanently by their employer" and/or "Lost their self-employed job or their own business", since the start of the COVID-19 pandemic. The OECD average includes only those 25 countries shown. In Panel B, the OECD average includes Austria, Belgium, the Czech Republic, Denmark, Estonia, Finland, France, Germany, Greece, Hungary, Ireland, Italy, Latvia, Lithuania, Luxembourg, the Netherlands, Poland, Portugal, the Slovak Republic, Slovenia, Spain and Sweden. Differences between groups are significant at the 5% level in April-June 2020, June-July 2020 and February-March 2021. Refer to Box 2.1 for methodological details on the Living, working and COVID-19 survey.
Source: OECD (n.d.[3]), Risks That Matter Survey, http://oe.cd/RTM (Panel A); data from 2018 are from the Eurostat (n.d.[55]), EU Survey on Income and Living Conditions (database), https://ec.europa.eu/eurostat/web/income-and-living-conditions/data/database; and data from 2020-2021 are from Eurofound (n.d.[9]), Living, working and COVID-19 e-survey (database), https://www.eurofound.europa.eu/data/covid-19 (Panel B).
Young people, parents and those from low-income households have been most likely to run into financial difficulties…
In 25 OECD countries, young people, people with children under 18 and those from low-income households have been more likely to be experiencing some kind of financial difficulty in September-October 2020 (Figure 5.22). This reflects the disproportionate job and income losses experienced by these groups since the beginning of the crisis. In particular, as expected, respondents in low-income households – regardless of employment status – were on average the most likely to report having financial trouble (39%), while high-income households were least likely (25%) (Figure 5.22) (see Box 5.6 for evidence from France).
Note: Respondents were asked whether, at any time since the start of the COVID-19 pandemic, they (or their household) had experienced one or more of a range of specific finance-related events. “Less than tertiary” indicates respondents with less than a tertiary education, “tertiary” indicates respondents with a tertiary education. "Low income" households are those with an equivalised disposable income (for 2019) in the bottom three deciles of the national disposable income distribution, "medium income" households those in the middle four deciles, and "high income" households those in the top three deciles. Parents are defined as respondents with at least one own child under age 18 living in the same household. The OECD average includes Austria, Belgium, Canada, Chile, Denmark, Estonia, Finland, France, Germany, Greece, Ireland, Israel, Italy, Korea, Lithuania, Mexico, the Netherlands, Norway, Poland, Portugal, Slovenia, Spain, Switzerland, Turkey and the United States.
Source: OECD (n.d.[3]), Risks That Matter Survey, http://oe.cd/RTM.
The Epidemiology and Living Conditions (EpiCov) survey was set up by Drees, Inserm, Santé Publique France and INSEE (France’s national statistics office) in order to study the impact of the pandemic and associated confinement measures on living conditions. The first wave of the survey took place between 2 May and 2 June 2020. 135 000 people aged 15 or over living in mainland France, Martinique, Guadeloupe and Reunion were selected in the Fidéli 2018 database of INSEE and interviewed online or by phone. The EpiCov survey includes questions on respondents’ financial situation, employment situation, working conditions (especially teleworking) and working time. According to the EpiCov survey, in May 2020, 23% of households declared that their financial situation had deteriorated since the start of confinement. Conversely, only 2% say their financial situation has improved, while for two-thirds it remained stable. Among households within the lowest decile of a standard of living measure based on equivalised income, 35% declared that their financial situation had deteriorated since the start of confinement, compared to 16% of households in the top decile. In addition, people with children were more likely to say that the financial situation of their household has deteriorated (33%) since the confinement, than people without children (18%) (Figure 5.23).

Note: The standard of living is equal to the disposable income of the household divided by the number of consumption units (CU). The standard of living is therefore the same for all individuals in the same household. Consumption units are generally calculated according to the OECD equivalence scale, which assigns 1 CU to the first adult in the household, 0.5 CU to other persons 14 years of age or over, and 0.3 CU to children under 14 years old.
Source: Givord and Silhol (2020[56]), Containment: unequal economic consequences according to households, Insee, https://www.insee.fr/fr/statistiques/4801313#consulter.
A survey conducted in the United States revealed that low-income households with children were facing high rates of financial difficulty in April 2020. 76% reported concerns about financial stability, 69% about food availability, 43% about employment and 31% about housing stability. What is more, 94% of the families reported being food insecure, with a 22-percentage point increase since the final months of 2019.11 Food insecurity was higher among Hispanic/Latino respondents (95%), relative to other racial/ethnic groups (Sharma et al., 2020[57]) (see also Box 5.7).12
Findings from the United Kingdom and the United States indicate that people with lower personal incomes face greater difficulty in meeting both unexpected and routine household costs. In the United Kingdom, between March and July 2020, 37.9% of people with total annual income below GBP 10 000 were unable to pay an unexpected expense of GBP 850 compared to 10.5% of people with an annual income of GBP 40 000 or over (ONS, 2020[58]). In the United States, among lower-income adults, 46% say they have had trouble paying their bills since the pandemic started, and 32% say they have been struggling to pay rent/mortgage. By contrast only 5% and 3% of people from the upper-income group have been struggling to pay bills and rent/mortgage respectively. In addition, 35% of lower-income adults say they have received food from a food bank/organisation, compared to only 12% of middle-income and 1% of upper-income adults (Parker, Minkin and Bennett, 2020[59]).13
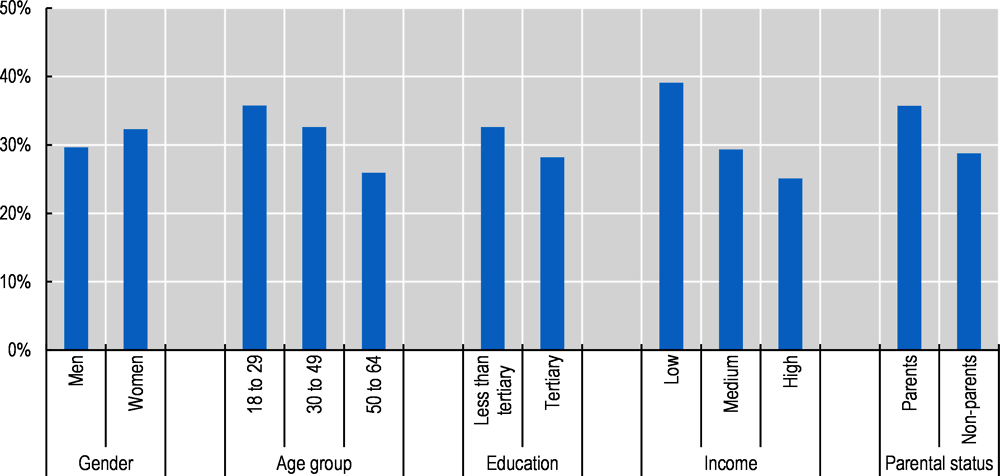
… and women had more financial difficulties than men
Women were more likely than men to experience difficulties in making ends meet. Across 22 European countries, between April-June 2020 and February-March 2021, the share of women reporting difficulties in making ends meet was 23%, which was 3 percentage points higher than for men (Figure 5.24, Panel A). Between June-July 2020 and February-March 2021, the share of women reporting such difficulties increased by 2 percentage points, while that of men remained stable (Figure 5.24, Panel B).

Note: In Panel A, data are not reported where fewer than 100 observations per gender category are available. * denotes countries with between 301 and 500 observations per category. More than 500 observations per category are available for all other countries. The OECD average includes only those 22 countries shown. Differences between groups are significant at the 5% level for the Czech Republic, Hungary, Latvia, OECD 22, Poland and the Slovak Republic. In Panel B, the OECD average includes only those 22 countries shown in Panel A. Refer to Box 2.1 for methodological details on the Living, working and COVID-19 survey.
Source: Eurofound (n.d.[9]), Living, working and COVID-19 e-survey (database), https://www.eurofound.europa.eu/data/covid-19.
In Chile, moderate-severe food insecurity was most common among vulnerable households in November 2020. In particular, it was most prevalent in households which “felt like their income was not enough” and those with no employed members (Figure 5.25).
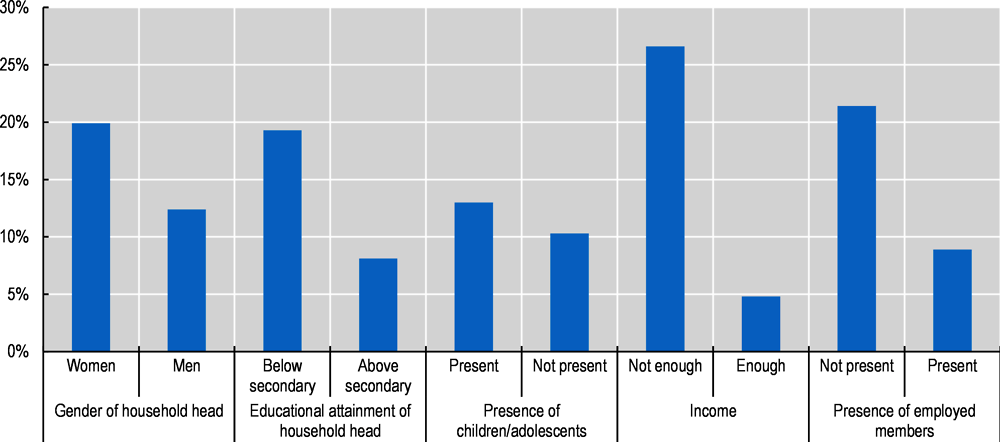
Note: People who face uncertainties in their abilities to acquire food or who are forced to buy less/lower-quality food than usual are said to face moderate food insecurity, and people who often run out of food or that go one or more days without eating are said to face severe food insecurity.
Source: Ministerio Desarrollo Social y Familia (n.d.[18]), Encuesta Social COVID-19 (COVID-19 Social Survey) (database), http://observatorio.ministeriodesarrollosocial.gob.cl/encuesta-social-covid19.
Evidence from the United States reveals similar trends. In June 2020, 20% of households indicated that they often or sometimes ran out of food before having enough money to buy more. Food insecurity was more widespread among individuals without a high school diploma (45%), households with less than USD 30 000 in annual income (40%), Hispanic/Latino households (33%) and households with children (27%) (Wozniak et al., 2020[60]) (refer to Box 3.1 for methods). Evidence from 12-24 May 2021 confirms that American adults in households with children were more likely to report that the household sometimes or often did not have enough to eat in the previous seven days (11%), compared to those in households without children (7%). In addition, 9% of all households living with children reported that the children sometimes or often in the previous seven days were “not eating enough because we just couldn't afford enough food” (US Census Bureau, n.d.[61]). Notably, the prevalence of food insecurity among households differed by race/ethnicity (Figure 5.27). As of late March 2021, single mothers experienced elevated levels of food insecurity (35%), higher than other respondents with children (23%), and higher than the pandemic peak for all respondents on average (24%) (Bauer, 2021[15]).
COVID-19 has also exacerbated the material hardship of racial/ethnic minorities
COVID-19 has exacerbated the material hardship of racial/ethnic minorities in the United Kingdom, Canada, and the United States. In the United Kingdom, prior to the pandemic, households headed by someone of Black African or Other Black ethnicity were significantly less likely to have enough financial assets to cover a drop in employment income than those from most other ethnic groups (ONS, 2020[62]). In April 2020, over a quarter of those from Black, African, Caribbean or Black British ethnic groups reported finding it very or quite difficult to get by financially; this level was significantly higher than those from other ethnic backgrounds, with a 5 percentage point increase compared to 2019 (Figure 5.26, Panel A). All other ethnic groups except for white Irish, also experienced increases in financial insecurity. In May, households that included at least one adult who identifies as ethnic minority also experienced levels of food insecurity at least 50% higher than their white peers (Equality and Human Rights Commission, 2020[63]). Similarly, in May-June 2020, Canadians from visible minority14 groups were more likely than white respondents to report that the pandemic had a strong or moderate impact on their ability to meet their financial obligations or essential needs (Figure 5.26, Panel B). In the United States, while deprivations in May 2021 had fallen from their 2020 heights, compared to white adults, all other racial/ethnic groups, but especially Black, Hispanic/Latino and adults in the Other/Multiracial category, continued to report higher financial insecurity, difficulties paying rent, and food insufficiency (Figure 5.27).
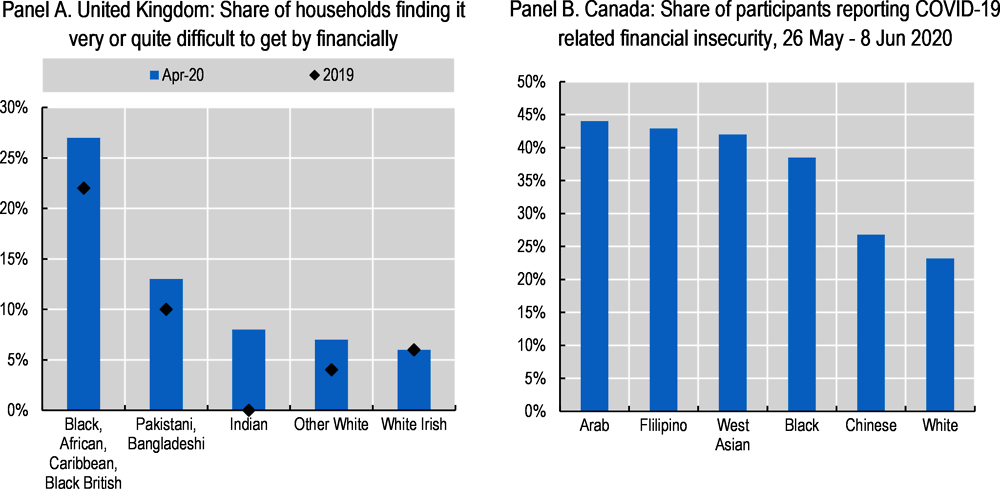
Note: In Panel A, no 2019 data are available for Indian households. Ethnicity is defined as the ethnicity reported by the head of the household. In Panel B, the question refers to participants who reported that COVID-19 has had a strong or moderate impact on their ability to meet their financial obligations or essential needs such as rent or mortgage payments, utilities, and groceries. Since this is sourced from an experimental crowd-sourced survey that does not apply a probabilistic sampling design, inferences about the overall Canadian population or its subgroups should not be made.
Source: ONS (2020[62]), Coronavirus and the social impacts on different ethnic groups in the UK: 2020, Office for National Statistics, https://www.ons.gov.uk/peoplepopulationandcommunity/culturalidentity/ethnicity/articles/coronavirusandthesocialimpactsondifferentethnicgroupsintheuk/2020 (Panel A); and Statistics Canada (2020[64]), Economic impact of COVID-19 among visible minority groups, https://www150.statcan.gc.ca/n1/pub/45-28-0001/2020001/article/00042-eng.htm (Panel B).

Note: In Panels A and B, “Other/Multiracial” refers to people identifying as American Indian, Alaska Native, Native Hawaiian or Pacific Islander, or more than one race. Percentages do not include non-responses. In Panel A, items refer to the share of adults in the United States reporting that it was somewhat or very difficult for their household to pay for usual expenses in the last seven days, in Panel B, that their household is not caught up on rent (share of adult renters only), and in Panel C, that their household sometimes or often did not have enough to eat in the last seven days. In Panel C, “Pre-pandemic” includes data from a self-reported recall question (asked between 23 April - 5 May 2020) about food insufficiency prior to 13 March 2020, in addition to the previous seven days. This limits direct comparability with subsequent data points.
Source: US Census Bureau (n.d.[61]), Measuring household experiences during the coronavirus pandemic (database), https://www.census.gov/householdpulsedata (refer to Box 3.1 for methodological details).
In countries with available data, the pandemic worsened the financial situation for LGBTQ+ communities
LGBTQ+ people are particularly vulnerable to financial difficulty in times of crisis. During the pandemic, LGBTQ+ people have been experiencing considerable employment losses. They also tend to have lower incomes and smaller financial buffers to rely on (Wenham, 2020[43]). In Canada, in 2018, a significantly higher proportion of LGBTQ2+15 Canadians (41%) reported a personal income of less than CAD 20 000 per year compared with their non-LGBTQ2+ counterparts (26%) (Prokopenko and Kevins, 2020[44]). Moreover, in 2018, one-third (33%) of LGBTQ2+ Canadians found it difficult or very difficult to meet their needs in terms of transportation, housing, food, clothing, participation in some social activities and other necessary expenses, compared to 27% among non-LGBTQ2+ Canadians (Prokopenko and Kevins, 2020[44]). According to a survey conducted in the United States in July-August 2020, 66% of LGBTQ households experienced a serious financial problem, compared to 44% of non-LGBTQ households, including: paying utilities like gas or electric, affording medical care, paying credit card bills, loans or other debt. Black and Hispanic/Latino LGBTQ households reported even higher rates of serious financial problems relative to white LGBTQ households: 95%, 75% and 62% respectively. In addition, nearly one in five (19%) LGBTQ households in the United States reported that they did not get enough food to eat in July-August 2020, compared to 6% of non-LGBTQ households (Movement Advancement Project, 2020[46]).
Low-income households, young people and people belonging to racial and ethnic minorities struggle to access affordable and quality housing and are more likely to be homeless
Long-standing inequalities in housing conditions were exacerbated by the pandemic, as they affected how different groups experienced lockdown periods as well as their exposure to the virus. Evidence from the United Kingdom shows that poor housing conditions (living in a cold, damp home), which are disproportionately experienced by vulnerable population groups, are likely to exacerbate or induce respiratory and cardiovascular conditions, which in turn increase the risk of contracting COVID-19 (Centre for Ageing Better, 2020[65]). In addition, nearly one-third of British adults reported physical or mental health problems because of poor housing conditions in June 2020 (National Housing Federation, 2020[66]).16
Across the OECD, many low-income households face gaps in both housing affordability and quality. In 2019, across 32 OECD countries, 27.1% of owners with a mortgage or tenants in the bottom income quintile were overburdened by housing costs – i.e. they spent more than 40% of their disposable income on their mortgage or rent (OECD, n.d.[67]) (OECD, 2021[68]) (refer to Chapter 2 for more information about housing affordability). Low-income households are also more likely to live in poor-quality dwellings. They may not be able to afford regular maintenance or improvements, while at the same time facing barriers to move to better-quality housing. On average, households in the bottom income quintile show a higher share of overcrowding than those in the middle- or top-income quintiles (15.5%, 10.0% and 5.8% respectively) (Figure 5.28) (OECD, n.d.[67]) (OECD, 2021[68]). In addition, within the low-income population, children are more likely to live in overcrowded housing than other age groups (OECD, 2021[68]). In the United Kingdom, over 20% of children from households in the bottom income tertile live in overcrowded conditions, compared to less than 5% of children from households in the top income tertile (Judge and Rahman, 2020[69]).17
Young people have been facing significant difficulties in accessing affordable and quality housing in recent years. In particular, low-income youth face even bigger challenges than their higher-income peers in securing good-quality housing, often because they are not able to rely on their family resources for support (OECD, 2021[68]). For instance, in the United Kingdom, 6% of people aged 16-24 live in a damp home, compared to 2% of people aged 65 or over (Judge and Rahman, 2020[69]). The COVID-19 pandemic is likely to exacerbate these challenges, given the disproportionate impact of the crisis on young people’s jobs and incomes. Indeed, in September-October 2020, in 25 OECD countries 53.4% of young people (aged 18 to 29) reported that they were concerned about not being able to find/maintain adequate housing in the next year or two, compared to 44.1% of the total population (Figure 5.29).
People belonging to ethnic minority groups in the United Kingdom are more likely to live in poor-quality housing. On average, households belonging to ethnic minority groups are larger than white British households, and therefore more likely to live in overcrowded conditions (12% of people from ethnic minority groups live in households of five people or more, compared to 5% of people from white groups) (Haque, Becares and Treloar, 2020[70]).18 In particular, one-quarter of people under age 15 belonging to ethnic minority groups live in overcrowded housing, compared to fewer than 10% of white people (Judge and Rahman, 2020[69]). Furthermore, the proportion of households with no garden is a lot higher among ethnic minorities, as Black people in England are four times as likely as white British people to have no outdoor space at home (37% compared to 10%) (ONS, 2020[71]).19
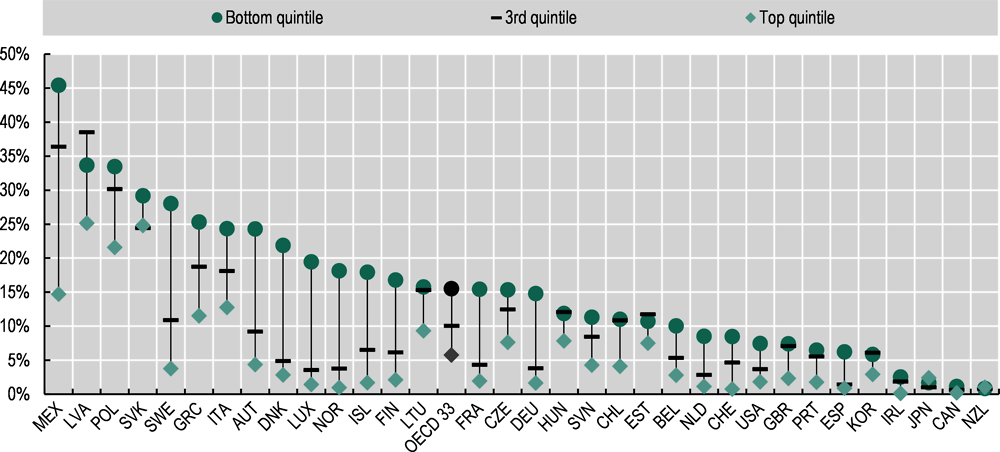
Note: Low-income households are households in the bottom quintile of the (net) income distribution. In Chile, Mexico, Korea and the United States gross income is used due to data limitations. For Chile, Mexico, Denmark, the Netherlands and the United States, no information on subsidised tenants is available due to data limitations. A household is considered overcrowded if it does not have at its disposal a minimum number of rooms equal to: one room for the household; one room per adult couple in the household; one room for each single person aged 18 or over; one room per pair of single persons of the same sex between 12 and 17 years of age; one room for each single person between 12 and 17 years of age and not included in the previous category; or one room per pair of children under 12 years of age. See section "Data and comparability issues" of Indicator HC2.1 in OECD (n.d.[67]) on limits to comparability across countries due to the definition of rooms. Data for Japan are available only on the respondent level due to data limitations. Results therefore refer to the population, rather than to households. Data for Canada are adjusted by Statistics Canada based on the assumption of the presence of a kitchen in dwellings where it is expected, while income quintiles are based on adjusted after-tax household income. The OECD average excludes Australia, Colombia, Costa Rica, Israel and Turkey.
Source: OECD (n.d.[67]), Affordable Housing (database), https://www.oecd.org/housing/data/affordable-housing-database/; and Statistics New Zealand, who provided data for New Zealand.

Note: The OECD average includes only those 25 countries shown.
Source: OECD (n.d.[3]), Risks That Matter Survey, http://oe.cd/RTM.
The pandemic risks pushing more people into homelessness. Indeed, in Europe, the United States, Canada, and New Zealand, homelessness is more common among the vulnerable population groups that were hit the hardest by the crisis. In Europe, a significant number of countries report a strong and sometimes increasing presence of young people between 15 and 29 years old among the homeless population (Baptista and Marlier, 2019[72]). In addition, the European homeless population tends to have lower education levels – mostly primary and secondary – and there is evidence of an association between homelessness, unemployment and very low incomes (Baptista and Marlier, 2019[72]). In the United States, data from 2019 indicate that Black people make up more than 40% of the homeless population. Similarly, American Indians/Alaska Natives, Native Hawaiians and Pacific Islanders and people who identify as two or more racial groups make up a disproportionate share of the homeless population. Hispanic/Latino people constitute a share of the homeless population approximately equal to the general population, while white and Asian people are significantly under-represented (National Alliance to End Homelessness, 2020[73]).20 In Canada, young people aged 13-24 make up about 20% of those experiencing homelessness, and Indigenous people (including First Nations, Métis and Inuit peoples) are over-represented among those experiencing homelessness in urban centers (Gaetz et al., 2013[74]). People from LGBTQ+ communities are also more likely to be homeless or housing insecure. In Canada, 27% of people identifying as LGBTQ2+ reported experiencing some type of homelessness in their lifetime (Prokopenko and Kevins, 2020[44]). In the United States, 25% of LGBTQ people surveyed in July-August 2020 reported that their home has serious heating or cooling problems, mold problems, pest problems, problems with unsafe drinking water, or other serious environmental problems, compared to 10% of non-LGBTQ people (Movement Advancement Project, 2020[46]). Lastly, in New Zealand, data from 2018 indicate that severe housing deprivation particularly affects ethnic minorities and the youth: Māori and Pacific people are respectively four and six times more likely to be severely housing deprived than people of European descent, and people under 25 make up 48.3% of the total housing deprived population (Amore, 2021[75]).21
COVID-19 has also exacerbated the impact of the digital divide in housing, as households without Internet access have greater difficultly in teleworking or participating in distance learning. Across OECD regions, there is a clear urban-rural divide in access to high-speed broadband. On average in 26 OECD countries, 63.6% of households in rural areas have access to high-speed broadband, compared to 87% of all households. Digital divides also exist between income and racial/ethnic groups. In the United Kingdom, only 51% of households earning GBP 6 000-10 000 a year had Internet access at home in 2014, compared to 99% of households with an income of over GBP 40 000 (ONS, 2019[76]). In Canada, 97.9% of households in the top income quartile had Internet access at home in 2012, while 54.9% of households in the bottom quartile had such access (Statistics Canada, 2017[77]). In 2021, in the United States, roughly six-in-ten adults living in households earning USD 100 000 or more a year (63%) reported having home broadband services, a smartphone, a desktop or laptop computer and a tablet, compared to 23% of those living in lower-income households (earning less than USD 30 000 a year) (Figure 5.30, Panel A) (Vogels, 2021[78]). In addition, 80% of white adults reported having a broadband connection at home, while smaller shares of Black and Hispanic/Latino adults said the same – 71% and 65% respectively. White adults in the United States are also more likely to own a computer than Black or Hispanic/Latino adults (80%, 69% and 67% respectively) (Figure 5.30, Panel B) (Atske and Perrin, 2021[79]).22 Access to the Internet and electronic devices can severely impact educational outcomes for vulnerable children. Across the OECD, children under the age of 15 from the bottom economic social and cultural status quartile were least likely to have a computer and access to the Internet at home in 2018 (76.9% versus 97.1% for children in the top quartile).23 Similarly, 76.9% of children whose parents have less than a secondary education and 86.6% of immigrant students had access to a computer and to the Internet at home, compared to 91.6% of children whose parents have at least a tertiary degree and 90.2% of non-immigrant students (OECD, n.d.[80]).
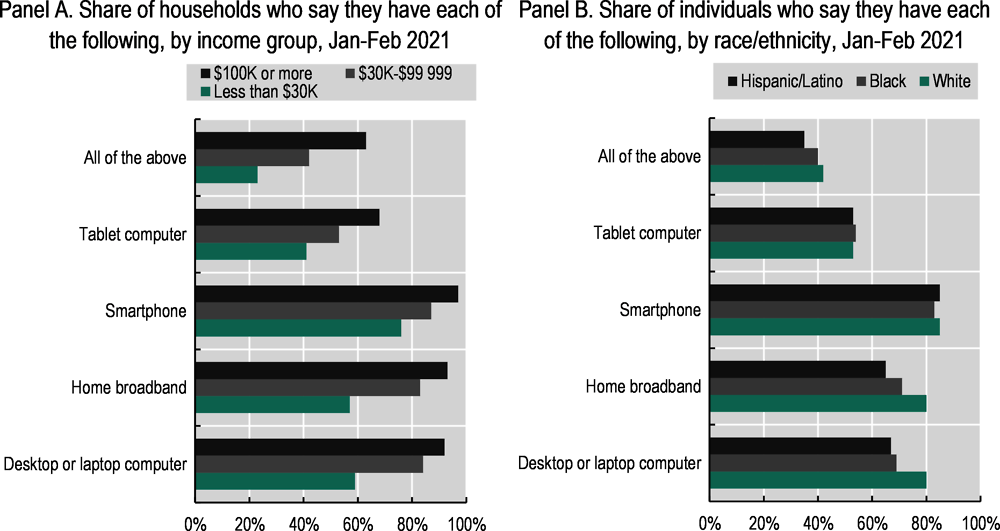
Source: Vogels (2021[78]), Digital divide persists even as Americans with lower income make gains in tech adoption, Pew Research Center, https://www.pewresearch.org/fact-tank/2021/06/22/digital-divide-persists-even-as-americans-with-lower-incomes-make-gains-in-tech-adoption/ (Panel A); and Atske and Perrin (2021[79]), Home broadband adoption, computer ownership vary by race, ethnicity in the U.S., Pew Research Center, https://www.pewresearch.org/fact-tank/2021/07/16/home-broadband-adoption-computer-ownership-vary-by-race-ethnicity-in-the-u-s/ (Panel B).
OECD (2021), Brick by Brick: Building Better Housing Policies, OECD Publishing, Paris, https://dx.doi.org/10.1787/b453b043-en
OECD (2021), Building for a better tomorrow: Policies to make housing more affordable. Employment, Labour and Social Affairs Policy Briefs, OECD Publishing, Paris, http://oe.cd/affordable-housing-2021
OECD (2021), OECD Employment Outlook 2021: Navigating the COVID-19 Crisis and Recovery, OECD Publishing, Paris, https://dx.doi.org/10.1787/5a700c4b-en
OECD (2021), OECD SME and Entrepreneurship Outlook 2021, OECD Publishing, Paris, https://dx.doi.org/10.1787/97a5bbfe-en
OECD (2020), International Migration Outlook 2020, OECD Publishing, Paris, https://dx.doi.org/10.1787/ec98f531-en
OECD (2020), OECD Employment Outlook 2020: Worker Security and the COVID-19 Crisis, OECD Publishing, Paris, https://dx.doi.org/10.1787/1686c758-en
OECD (n.d.), Affordable Housing database, http://www.oecd.org/housing/data/affordable-housing-database/ (accessed 15 June 2021)
References
[75] Amore, K. (2021), Severe housing deprivation in Aotearoa New Zealand, 2018, https://www.hud.govt.nz/assets/News-and-Resources/Statistics-and-Research/2018-Severe-housing-deprivation-estimate/Severe-Housing-Deprivation-2018-Estimate-Report.pdf.
[79] Atske, S. and A. Perrin (2021), Home broadband adoption, computer ownership vary by race, ethnicity in the U.S., Pew Research Center, https://www.pewresearch.org/fact-tank/2021/07/16/home-broadband-adoption-computer-ownership-vary-by-race-ethnicity-in-the-u-s/.
[72] Baptista, I. and E. Marlier (2019), Fighting homelessness and housing exclusion in Europe: A study of national policies, European Commission, Directorate-general for Employment, Social Affairs, and Inclusion, https://op.europa.eu/en/publication-detail/-/publication/2dd1bd61-d834-11e9-9c4e-01aa75ed71a1/language-en.
[50] Barrero, J., N. Bloom and S. Davis (2021), Let me work from home, or I will find another job, VOX.org CEPR Policy Portal, https://voxeu.org/article/let-me-work-home-or-i-will-find-another-job.
[15] Bauer, L. (2021), Mothers are being left behind in the economic recovery from COVID-19, Brookings, https://www.brookings.edu/blog/up-front/2021/05/06/mothers-are-being-left-behind-in-the-economic-recovery-from-covid-19/?utm_campaign=brookings-comm&utm_medium=email&utm_content=125828433&utm_source=hs_email.
[27] Benzeval, M. et al. (2020), The idiosyncratic impact of an aggregate shock: The distributional consequences of COVID-19, Understanding Society Working Paper Series, No. 2020-09, https://www.understandingsociety.ac.uk/sites/default/files/downloads/working-papers/2020-09.pdf.
[23] Berg, L. and B. Farbenblum (2020), As if we weren’t humans - the abandonment of temporary migrants in Australia during COVID-19, Migrant Worker Justice Initiative, https://apo.org.au/sites/default/files/resource-files/2020-09/apo-nid308305.pdf.
[37] Broady, K. (2021), July’s jobs report shows Black teens struggling with the highest unemployment rate, Brookings, https://www.brookings.edu/blog/the-avenue/2021/08/09/julys-jobs-report-shows-black-teens-struggling-with-the-highest-unemployment-rate/.
[22] Brücker, H. (2021), Special COVID-19 Survey of IAB-BAMF-SOEP Refugee Survey, https://www.slideshare.net/StatsCommunications/impact-of-covid19-on-migrant-health-and-labour-market-outcomes-herbert-brcker.
[51] Capgemini Research Institute (2020), The Future of Work: From remote to hybrid, https://www.capgemini.com/it-it/research/the-future-of-work/.
[36] CDC (2020), Loss of Work Due to Illness from COVID-19, Centers for Disease Control and Prevention, https://data.cdc.gov/NCHS/Loss-of-Work-Due-to-Illness-from-COVID-19/qgkx-mswu (accessed on 10 February 2021).
[65] Centre for Ageing Better (2020), Homes, health and COVID-19, https://www.ageing-better.org.uk/sites/default/files/2020-09/Homes-health-and-COVID-19.pdf.
[81] Department of Finance Canada (2021), Budget 2021: A Recovery Plan for Jobs, Growth, and Resilience, Annex 4: Gender, Diversity, and Quality of Life Statement, https://www.budget.gc.ca/2021/report-rapport/anx4-en.html (accessed on 17 June 2021).
[63] Equality and Human Rights Commission (2020), How coronavirus has affected equality and human rights, https://www.equalityhumanrights.com/sites/default/files/equality_and_human_rights_commission_how_coronavirus_has_affected_equality_and_human_rights_2020.pdf.
[48] Eurofound (2020), Living, working and COVID-19 series, Publications Office of the European Union, Luxembourg, https://www.eurofound.europa.eu/sites/default/files/ef_publication/field_ef_document/ef20059en.pdf.
[9] Eurofound (n.d.), Living, working and COVID-19 database, https://www.eurofound.europa.eu/data/covid-19 (accessed on 13 August 2021).
[2] Eurostat (2021), Early estimates of income inequalities during the 2020 pandemic, https://ec.europa.eu/eurostat/statistics-explained/index.php?title=Early_estimates_of_income_inequalities_during_the_2020_pandemic (accessed on 13 August 2021).
[4] Eurostat (2020), Impact of COVID-19 on employment income - advanced estimates, https://ec.europa.eu/eurostat/statistics-explained/index.php?title=Impact_of_COVID-19_on_employment_income_-_advanced_estimates#A_sharp_decrease_in_the_median_employment_income.
[30] Eurostat (n.d.), Employment rates by sex, age and country of birth (%) database, https://ec.europa.eu/eurostat/web/lfs/data/database (accessed on 13 August 2021).
[55] Eurostat (n.d.), EU Survey on Income and Living Conditions database, https://ec.europa.eu/eurostat/web/income-and-living-conditions/data/database (accessed on 20 May 2021).
[41] Fairlie, R. (2020), The impact of COVID‐19 on small business owners: Evidence from the first three months after widespread social‐distancing restrictions, Journal of Economics & Management Strategy, https://doi.org/10.1111/jems.12400.
[49] Fana, M. et al. (2020), Telework, work organisation and job quality during the COVID-19 crisis: a qualitative study, European Commission Joint Research Centre, https://doi.org/JRC122591.
[74] Gaetz, S. et al. (2013), The state of homelessness in Canada, Canadian Homelessness Research Network Press, Toronto, https://www.homelesshub.ca/SOHC2016.
[8] Galasso, V. and M. Foucault (2020), Working during COVID-19: Cross-country evidence from real-time survey data, OECD Social, Employment and Migration Working Papers, OECD Publishing, Paris, https://dx.doi.org/10.1787/34a2c306-en.
[10] Georgetown University (n.d.), Tracking COVID-19 Unemployment and Job Losses, Georgetown University Center on Education and the Workforce, https://cew.georgetown.edu/cew-reports/jobtracker/#unemployment-tracking (accessed on 21 May 2021).
[56] Givord, P. and J. Silhol (2020), Containment: unequal economic consequences depending on the household, Insee, https://www.insee.fr/fr/statistiques/4801313#consulter.
[42] Graeber, D., A. Kritikos and J. Seebauer (2021), COVID-19: A crisis of the female selfemployed, Global Labor Organisation (GLO), https://www.econstor.eu/bitstream/10419/230677/1/GLO-DP-0788.pdf.
[70] Haque, Z., L. Becares and N. Treloar (2020), Over-exposed and under-protected: The devastating impact of COVID-19 on Black and Minority Ethnic communities in Great Britain, Runnymede Trust and ICM, http://www.runnymedetrust.org/uploads/Runnymede%20Covid19%20Survey%20report%20v3.pdf.
[28] Hu, Y. (2020), Intersecting ethnic and native–migrant inequalities in the economic impact of the COVID-19 pandemic in the UK, Research in Social Stratification and Mobility, https://doi.org/10.1016/j.rssm.2020.100528.
[14] ILO and UN Women (2020), Fallout of COVID-19: Working moms are being squeezed out of the labour force, International Labour Organisation, https://ilostat.ilo.org/fallout-of-covid-19-working-moms-are-being-squeezed-out-of-the-labour-force/.
[45] Innovative Research Group (2020), Impact of COVID-19: Canada’s LGBTQI2S community in focus, https://egale.ca/wp-content/uploads/2020/04/Impact-of-COVID-19-Canada%E2%80%99s-LGBTQI2S-Community-in-Focus-2020-04-06.pdf.
[16] Institute for Women’s Policy Research (2021), Equal Pay Day 2021: The Results of a COVID-Impacted Economy, https://iwpr.org/media/in-the-lead/equal-pay-day-2021-the-results-of-a-covid-impacted-economy/#:~:text=Equal%20Pay%20Day%202021%3A%20The%20Results%20of%20a%20COVID%2DImpacted%20Economy,-For%20many%20women&text=Today%2C%20IWPR%20CEO%20and%20President%20C.&.
[52] Ipsos (2020), The COVID-19 pandemic’s impact on workers’ lives, https://www.ipsos.com/sites/default/files/ct/news/documents/2020-12/impact-of-the-covid-19-pandemic-on-workers-lives-report.pdf.
[69] Judge, L. and F. Rahman (2020), Lockdown living: Housing quality across the generations, Resolution Foundation, https://www.resolutionfoundation.org/app/uploads/2020/07/Lockdown-living.pdf.
[7] Kühne, S. et al. (2020), “The need for household panel surveys in times of crisis: The case of soep-cov”, Survey Research Methods, Vol. 14/2, pp. 195-203.
[35] Long, H. et al. (2020), The covid-19 recession is the most unequal in modern U.S. history, The Washington Post, https://www.washingtonpost.com/graphics/2020/business/coronavirus-recession-equality/.
[6] Marshall, J., C. Burd and M. Burrows (2021), Working From Home During the Pandemic, US Census Bureau, https://www.census.gov/library/stories/2021/03/working-from-home-during-the-pandemic.html.
[18] Ministerio Desarrollo Social y Familia (n.d.), Encuesta Social COVID-19 (COVID-19 Social Survey), http://observatorio.ministeriodesarrollosocial.gob.cl/encuesta-social-covid19 (accessed on 20 May 2021).
[46] Movement Advancement Project (2020), The disproportionate impacts of COVID-19 on LGBTQ households in the U.S., http://www.lgbtmap.org/2020-covid-lgbtq-households.
[73] National Alliance to End Homelessness (2020), Racial Inequalities in homelessness, by the numbers, https://endhomelessness.org/resource/racial-inequalities-homelessness-numbers/.
[66] National Housing Federation (2020), Poor housing causing health problems for nearly a third of brits during lockdown, https://www.housing.org.uk/news-and-blogs/news/poor-housing-causing-health-problems-for-nearly-a-third-of-brits-during-lockdown/.
[34] National Women’s Law Center (2020), Four times more women than men dropped out of the labour force in September, https://nwlc.org/resources/four-times-more-women-than-men-dropped-out-of-the-labor-force-in-september/.
[40] OECD (2021), “An in-depth analysis of one year of SME and entrepreneurship policy responses to COVID-19: Lessons learned for the path to recovery”, OECD SME and Entrepreneurship Papers, No. 25, OECD Publishing, Paris, https://dx.doi.org/10.1787/6407deee-en.
[68] OECD (2021), Building for a better tomorrow: Policies to make housing more affordable, Employment, Labour and Social Affairs Policy Briefs, OECD Publising, Paris, http://oe.cd/affordable-housing-2021.
[11] OECD (2021), OECD Employment Outlook 2021: Navigating the COVID-19 Crisis and Recovery, OECD Publishing, Paris, https://dx.doi.org/10.1787/5a700c4b-en.
[39] OECD (2021), OECD SME and Entrepreneurship Outlook 2021, OECD Publishing, Paris, https://dx.doi.org/10.1787/97a5bbfe-en.
[54] OECD (2021), “Risks that matter 2020: The long reach of COVID-19”, OECD Policy Responses to Coronavirus (COVID-19), OECD Publishing, Paris, https://dx.doi.org/10.1787/44932654-en.
[53] OECD (2020), How’s Life? 2020: Measuring Well-being, OECD Publishing, Paris, https://dx.doi.org/10.1787/9870c393-en.
[21] OECD (2020), International Migration Outlook 2020, OECD Publishing, Paris, https://dx.doi.org/10.1787/ec98f531-en.
[1] OECD (2020), OECD Employment Outlook 2020: Worker Security and the COVID-19 Crisis, OECD Publishing, Paris, https://doi.org/10.1787/1686c758-en.
[19] OECD (2020), “What is the impact of the COVID-19 pandemic on immigrants and their children?”, OECD Policy Responses to Coronavirus (COVID-19), OECD Publishing, Paris, https://dx.doi.org/10.1787/e7cbb7de-en.
[13] OECD (2020), “Youth and COVID-19: Response, recovery and resilience”, OECD Policy Responses to Coronavirus (COVID-19), OECD Publishing, Paris, https://dx.doi.org/10.1787/c40e61c6-en.
[17] OECD (n.d.), Employment and Labour Market Statistics database, https://doi.org/10.1787/data-00302-en (accessed on 13 August 2021).
[12] OECD (n.d.), Main Economic Indicators database, https://doi.org/10.1787/data-00046-en (accessed on 13 August 2021).
[67] OECD (n.d.), OECD Affordable Housing database, http://www.oecd.org/housing/data/affordable-housing-database/ (accessed on 15 June 2021).
[80] OECD (n.d.), OECD Child Well-Being Data Portal, https://www.oecd.org/social/family/child-well-being/data/education/ (accessed on 13 August 2021).
[5] OECD (n.d.), OECD Education Statistics database, https://doi.org/10.1787/889e8641-en (accessed on 24 September 2021).
[3] OECD (n.d.), Risks That Matter Survey, https://www.oecd.org/social/risks-that-matter.htm (accessed on 13 August 2021).
[62] ONS (2020), Coronavirus and the social impacts on different ethnic groups in the UK: 2020, Office for National Statistics, https://www.ons.gov.uk/peoplepopulationandcommunity/culturalidentity/ethnicity/articles/coronavirusandthesocialimpactsondifferentethnicgroupsintheuk/2020.
[71] ONS (2020), One in eight British households has no garden, Office for National Statistics, https://www.ons.gov.uk/economy/environmentalaccounts/articles/oneineightbritishhouseholdshasnogarden/2020-05-14.
[58] ONS (2020), Personal and economic well-being in Great Britain: September 2020, Office for National Statistics, https://www.ons.gov.uk/peoplepopulationandcommunity/wellbeing/bulletins/personalandeconomicwellbeingintheuk/june2020.
[25] ONS (2020), Unemployment by ethnic background, Office for National Statistics, https://commonslibrary.parliament.uk/research-briefings/sn06385/ (accessed on 9 February 2021).
[76] ONS (2019), Exploring the UK’s digital divide, Office for National Statistics, https://www.ons.gov.uk/peoplepopulationandcommunity/householdcharacteristics/homeinternetandsocialmediausage/articles/exploringtheuksdigitaldivide/2019-03-04.
[24] ONS (n.d.), A09: Labour market status by ethnic group, Office for National Statistics, https://www.ons.gov.uk/employmentandlabourmarket/peopleinwork/employmentandemployeetypes/datasets/labourmarketstatusbyethnicgroupa09 (accessed on 9 February 2021).
[47] Parker, K., J. Menasce Horowitz and R. Minkin (2020), How the Coronavirus outbreak has – and hasn’t – changed the way americans work, Pew Research Center, https://www.pewresearch.org/social-trends/2020/12/09/how-the-coronavirus-outbreak-has-and-hasnt-changed-the-way-americans-work/.
[59] Parker, K., R. Minkin and J. Bennett (2020), Economic fallout from COVID-19 continues to hit lower-income Americans the hardest, Pew Research Center, https://www.pewresearch.org/social-trends/2020/09/24/economic-fallout-from-covid-19-continues-to-hit-lower-income-americans-the-hardest/.
[33] Pew Research Center (2020), Hispanic women, immigrants, young adults, those with less education hit hardest by COVID-19 job losses, https://www.pewresearch.org/fact-tank/2020/06/09/hispanic-women-immigrants-young-adults-those-with-less-education-hit-hardest-by-covid-19-job-losses/.
[26] Powell, A., B. Francis-Devine and N. Foley (2020), Unemployment by ethnic background, House of Commons Library, https://commonslibrary.parliament.uk/research-briefings/sn06385/ (accessed on 10 February 2021).
[44] Prokopenko, E. and C. Kevins (2020), Vulnerabilities related to COVID-19 among LGBTQ2+ Canadians, Statistics Canada, https://www150.statcan.gc.ca/n1/pub/45-28-0001/2020001/article/00075-eng.htm.
[57] Sharma, S. et al. (2020), Social determinants of health-related needs during COVID-19 among low-income households with children, Centers for Disease Control and Prevention, https://www.cdc.gov/pcd/issues/2020/20_0322.htm.
[29] Statistics Canada (2021), Study: A labour market snapshot of Black Canadians during the pandemic, https://www150.statcan.gc.ca/n1/daily-quotidien/210224/dq210224b-eng.htm.
[64] Statistics Canada (2020), Economic impact of COVID-19 among visible minority groups, https://www150.statcan.gc.ca/n1/pub/45-28-0001/2020001/article/00042-eng.htm.
[38] Statistics Canada (2020), Labour market impacts of COVID-19 on Indigenous people: March to August 2020, https://www150.statcan.gc.ca/n1/daily-quotidien/201102/dq201102c-eng.htm (accessed on 3 March 2021).
[20] Statistics Canada (2020), Transitions into and out of employment by immigrants during the COVID-19 lockdown and recovery, https://www150.statcan.gc.ca/n1/pub/45-28-0001/2020001/article/00070-eng.htm.
[77] Statistics Canada (2017), Household access to the Internet at home, by household income quartile and geography, https://www150.statcan.gc.ca/t1/tbl1/en/tv.action?pid=2210000701 (accessed on 13 August 2021).
[32] US Bureau of Labor Statistics (n.d.), Civilian unemployment rate, https://www.bls.gov/charts/employment-situation/civilian-unemployment-rate.htm (accessed on 13 August 2021).
[31] US Bureau of Labor Statistics (n.d.), Employment status of the civilian population by nativity and sex, not seasonally adjusted, https://www.bls.gov/news.release/empsit.t07.htm (accessed on 13 August 2021).
[61] US Census Bureau (n.d.), Measuring household experiences during the coronavirus pandemic, https://www.census.gov/data/experimental-data-products/household-pulse-survey.html (accessed on 13 September 2021).
[78] Vogels, E. (2021), Digital divide persists even as Americans with lower incomes make gains in tech adoption, Pew Research Center, https://www.pewresearch.org/fact-tank/2021/06/22/digital-divide-persists-even-as-americans-with-lower-incomes-make-gains-in-tech-adoption/.
[43] Wenham, C. (2020), The gendered impact of the COVID-19 crisis and post-crisis period, European Parliament, Brussels, http://www.europarl.europa.eu/supporting-analyses.
[60] Wozniak, A. et al. (2020), COVID Impact Survey, National Opinion Research Center, https://www.covid-impact.org/ (accessed on 9 August 2021).
Notes
← 1. Employment income includes wages and self-employment income. Quintiles are based on people’s ranking in terms of their equivalised disposable income.
← 2. The OECD Risks that Matter (RTM) survey is a cross-national survey examining people’s perceptions of the social and economic risks they face and how well they think their government addresses those risks. The survey was conducted for the first time in two waves in 2018. The 2020 survey, conducted in September-October 2020, draws on a representative sample of over 25 000 people aged 18 to 64 in the 25 OECD countries that agreed to participate: Austria, Belgium, Canada, Chile, Denmark, Estonia, Finland, France, Germany, Greece, Ireland, Israel, Italy, Korea, Lithuania, Mexico, the Netherlands, Norway, Poland, Portugal, Slovenia, Spain, Switzerland, Turkey and the United States.
← 3. Consistent with OECD practice (e.g. in the Migration Outlook), this report uses the words “migrants”, “immigrants” and “foreign-born” synonymously. Unless mentioned otherwise, these include all persons born abroad, regardless of their migration category, legal status or nationality. Likewise, unless mentioned otherwise, native-born includes all persons born in the country, regardless of the country of birth of their parents.
← 4. The main changes involved by the new regulation are: persons on parental leave, and who are either receiving job-related income or benefits, or whose parental leave is expected to last three months or less, are counted as employed; persons raising agricultural products for own-consumption are excluded from employment; seasonal workers outside the season are classified as employed if they still regularly perform tasks and duties for the job or business during the off-season; and people with a job or business who were temporarily not at work during the reference week of the survey but with strong attachment to their job are still considered as employed. In the particular context of the COVID-19 crisis and of the measures applied to combat it, national specificities exist in the assessment of the job attachment; not employed people are considered to be searching for a job only if they use an active search method. The new regulation also achieved further harmonisation in the implementation of questions and modernisation of the nation surveys.
← 5. For example, people stating their ethnicity as “Mixed”, “Indian”, “Pakistani”, “Bangladeshi”, “Chinese”, “Black/African/Caribbean” or “Other”.
← 6. The term "visible minority" is used here because it is the official demographic category defined by the Canadian Employment Equity Act and is used by Statistics Canada in their surveys. The Employment Equity Act defines visible minorities as "persons, other than Aboriginal peoples, who are non-Caucasian in race or non-white in colour". The visible minority population consists mainly of the following groups: South Asian, Chinese, Black, Filipino, Latin American, Arab, Southeast Asian, West Asian, Korean and Japanese. The question of appropriate terminology is currently being reviewed in Canada, in the context of a task force on modernising the Employment Equity Act (Department of Finance Canada, 2021[81]).
← 7. LGBTQ2+ is the official acronym used by the Government of Canada across its programmes and policies. At Statistics Canada, the LGBTQ2+ acronym is used in order to reflect the broad scope of gender and sexual identities that exist in society. Respondents were included in the LGBTQ2+ population on the basis of self-reported sexual orientation (lesbian, gay, bisexual or another minority sexual identity such as asexual, pansexual or queer) or gender identity (transgender, including respondents with non-binary identities like genderqueer, gender fluid or agender).
← 8. The term LGBTQI2S indicates Lesbian, Gay, Bisexual, Transgender, Queer (or Questioning), Intersex, and Two-Spirit.
← 9. Findings of an Innovative Research Group (INNOVATIVE) online poll conducted from 24 to 29 March, 2020. Each survey is administered to a series of randomly selected samples from the panel. Additional respondents were recruited from online advertisements on Facebook and Instagram. The sample has been weighted by age, gender, region and sexual orientation using Statistics Canada’s 2016 Census data and the 2016 General Social Survey to reflect the actual demographic composition of the Canadian and LGBTQI2S populations, resulting in an overall representative national sample size of 2 000 Canadians and representative national LGBTQI2S sample size of 300.
← 10. This report’s findings are based on a polling series called The Impact of Coronavirus on Households, conducted by NPR, the Robert Wood Johnson Foundation and the Harvard T.H. Chan School of Public Health (NPR/RWJF/Harvard). As reported by Harvard, “Interviews were conducted online and via telephone (cellphone and landline), July 1-August 3, 2020, among a nationally representative, probability-based sample of 3 454 adults age 18 or older in the US”. The poll included a question allowing respondents to identify as LGBTQ. The figures compare respondents who identified as LGBQ and/or transgender to those who identified as both heterosexual and cisgender (i.e., “non-LGBTQ”). Of the total sample, 353 identified as LGBTQ. Findings from the series, as well as additional methodological information, are available at www.hsph.harvard.edu/horp/npr-harvard.
← 11. The parent or another adult in the family used the 2-item Hunger Vital Sign screening questionnaire to report household food security status during the COVID-19 pandemic. It is a 2-question screening tool, suitable for clinical or community outreach use, that identifies families with young children as being at risk for food insecurity if they answer that either or both of the following two statements is “often true” or “sometimes true” (vs. “never true”): “Within the past 12 months we worried whether our food would run out before we got money to buy more”; “Within the past 12 months the food we bought just didn’t last and we didn’t have money to get more.”
← 12. An electronic survey was distributed in April 2020 to 16 435 families in 4 geographic areas, and 1 048 responded. The survey asked families enrolled in a co-ordinated school-based nutrition programme about their social needs, COVID-19–related concerns, food insecurity, and diet-related behaviours during the pandemic. Three variables (food insecurity, frequency of eating out, and frequency of shopping for produce) in the responses were compared on similar items in data collected from 3 880 families in the same 4 locations in fall 2019. The Autumn 2019 survey and the April 2020 survey used similar questions for the 3 variables.
← 13. Pew Research Center conducted this study to understand Americans’ assessments of their personal financial situation during the coronavirus outbreak. For this analysis, Pew surveyed 13 200 US adults in August 2020. Everyone who took part in the survey is a member of Pew Research Center’s American Trends Panel (ATP), an online survey panel that is recruited through national, random sampling of residential addresses. This way nearly all US adults have a chance of selection. The survey is weighted to be representative of the United States adult population by gender, race, ethnicity, partisan affiliation, education and other categories.
← 14. The term "visible minority" is used here because it is the official demographic category defined by the Canadian Employment Equity Act and is used by Statistics Canada in their surveys. The Employment Equity Act defines visible minorities as "persons, other than Aboriginal peoples, who are non-Caucasian in race or non-white in colour". The visible minority population consists mainly of the following groups: South Asian, Chinese, Black, Filipino, Latin American, Arab, Southeast Asian, West Asian, Korean and Japanese. The question of appropriate terminology is currently being reviewed in Canada, in the context of a task force on modernising the Employment Equity Act (Department of Finance Canada, 2021[81]).
← 15. The term "visible minority" is used here because it is the official demographic category defined by the Canadian Employment Equity Act and is used by Statistics Canada in their surveys. The Employment Equity Act defines visible minorities as "persons, other than Aboriginal peoples, who are non-Caucasian in race or non-white in colour". The visible minority population consists mainly of the following groups: South Asian, Chinese, Black, Filipino, Latin American, Arab, Southeast Asian, West Asian, Korean and Japanese. The question of appropriate terminology is currently being reviewed in Canada, in the context of a task force on modernising the Employment Equity Act (Department of Finance Canada, 2021[81]).
← 16. The figure is from a YouGov survey of 4 116 adults. Fieldwork was undertaken between 11 and 15 June 2020. The survey was carried out online. The figures have been weighted and are representative of all Great Britain adults (aged 18+). This percentage was applied to the latest ONS mid-year estimate for the total number of adults in Great Britain.
← 17. These figures are based on author calculations from the English Housing Survey. This is a continuous national survey commissioned by the Ministry of Housing, Communities and Local Government (MHCLG). It collects information about people’s housing circumstances and the condition and energy efficiency of housing in England. Each year a sample of addresses is drawn at random from a list of private addresses held by the Royal Mail.
← 18. In the summer of 2020, the polling company ICM administered a survey on behalf of Runnymede Trust to 2 585 adults (aged 18+) in Great Britain. The survey covered people’s experiences of the coronavirus pandemic and lockdown and explored the impact of COVID-19 on physical and mental health, work, finances, relationships, childcare and schooling, as well as the understanding of the government’s COVID-19 social and economic measures. A total of 750 people in the sample belonged to an ethnic minority, including Chinese, Indian, Pakistani, Bangladeshi, Black Caribbean and Black African ethnic groups.
← 19. ONS used a combination of data sources to look into how many people have access to a garden and how far they are from the nearest park. ONS used Natural England’s Monitor for Engagement in the Natural Environment (MENE) survey to examine differences by personal characteristics (such as ethnicity, age and socio-economic group). The MENE survey covers England only. Fieldwork started in March 2009 with around 800 respondents interviewed every week across England using an in-home interview format. Every year at least 45 000 interviews are undertaken.
← 20. Data are from the Annual Homeless Assessment Report to Congress, Part 1, 2020.
← 21. Severe housing deprivation is synonymous with homelessness. It refers to people living in severely inadequate housing due to a lack of access to minimally adequate housing. This means not being able to access a private dwelling to rent or own that has all basic amenities. Housing that lacks at least two of the three core dimensions of housing adequacy – habitability, security of tenure, and privacy and control – is deemed severely inadequate.
← 22. The Pew Research Centre surveyed 1 502 US adults from 25 January to 8 February 2021 by mobile phone and landline. The survey was conducted by interviewers under the direction of Abt Associates, and is weighted to be representative of the United States adult population by gender, race, ethnicity, education and other categories.
← 23. The PISA index of economic, social and cultural status (ESCS) is a composite measure used to estimate a student’s socio-economic background. The index is derived from several variables related to students’ family background: parents’ education, parents’ occupations, a number of home possessions that can be taken as proxies for material wealth, and the number of books and other educational resources available in the home. The index itself is a composite score derived from these indicators via Principal Component Analysis (PCA). Here, however, students are divided into quartiles according to their position in the distribution of ESCS scores in their country or economy.