
2. People
The “People” theme of the 2030 Agenda aims at eradicating poverty and hunger, in all their forms and dimensions, to ensure that all human beings can fulfil their potential, in particular in terms of health and education, and including without being penalised because of their gender. Relying on the global indicator framework, this chapter assesses whether by 2030 the OECD countries are likely to achieve the SDG targets that focus on People. It shows where OECD countries are standing both in terms of their current performance and in terms of changes over time, and what part of the People theme of the 2030 Agenda currently remains unmeasurable. It also discusses some of the main impacts of the COVID-19 pandemic on the People targets.
The 2030 Agenda is a call to action for all countries to act for a better and more sustainable future for all. At its core is a set of 17 Sustainable Development Goals balancing the three dimensions of sustainable development: the economic, social and environmental. Since the adoption of the sustainable development agenda in 2015, its broad scope has often been characterised by five broad themes, i.e. the “5Ps” (UN, 2015[1]): People, Planet, Prosperity, Peace and Partnerships.1 The People theme aims at eradicating poverty (Goal 1) and hunger (Goal 2), in all their forms and dimensions, to ensure that all human beings can fulfil their potential, in particular in terms of health (Goal 3) and education (Goal 4), and without being penalised because of their gender (Goal 5).
Making progress towards the People SDGs also provides an opportunity to empower people and ensure inclusiveness and equality in ways that are mutually reinforcing. For example, the provision of access to quality education (Goal 4) helps improve skill acquisition and promotes economic empowerment. It also enhances people’s ability to find employment (Goal 8) whilst increasing their incomes (Goals 1 and 10) (OECD, 2019[2]).
Even before the pandemic hit, OECD countries were not on track to achieve the People goals. In 2015, OECD countries were on average2 closest to reaching targets for the goals on Poverty eradication (Goal 1), followed by Health (Goal 3) and Education (Goal 4), and they were furthest from achieving the targets for Food (Goal 2) and Gender equality (Goal 5) – see Figure 2.1.
However, OECD countries have been progressing towards the SDG targets for all goals, with the exception of Food (Goal 2). The rate of progress varies among goals, with Poverty eradication (Goal 1) and Education (Goal 4) showing little improvement, while Health and most notably Gender equality (Goals 3 and 5) are showing stronger progress. Projecting trends up to 2030 suggests that all the People goals with the exception of Food (Goal 2) are likely to be closer to reaching their targets, but none of them is likely to actually reach the targets in the absence of additional measures. To overcome some of the challenges relating to composite measures, this chapter dives into the details of the underlying targets and provides an exhaustive picture of where OECD countries stand in terms of meeting the targets.
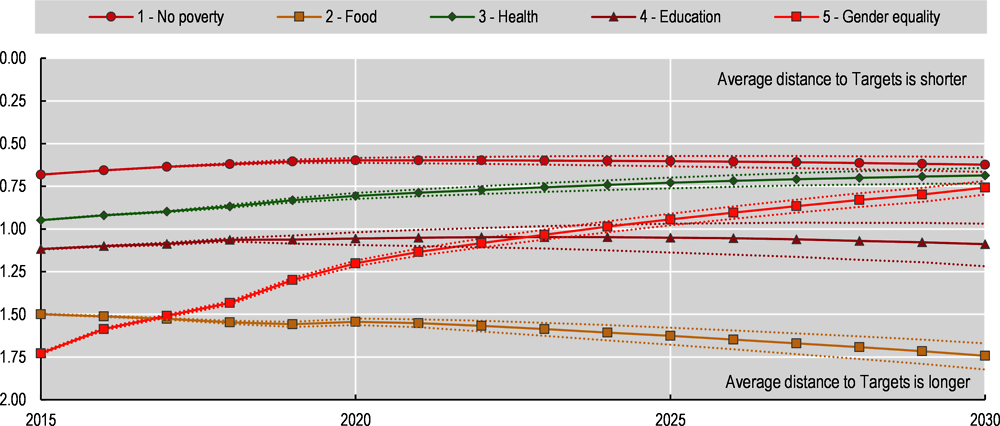
Note: Based on available data series. This figure shows the average distance that OECD countries are projected to travel towards the SDGs based on recent trends; hence these distances are based on existing policies and do not account for the additional measures that OECD countries may have introduced since the latest observation available. Distances are measured in standardised units (see the methodological annex for details), with 0 indicating that the 2030 level has already been attained. Full lines show OECD countries’ average performance against all targets under the relevant goal. Dashed lines show the confidence interval (10th and 90th percentiles of estimated trends). When data are not available for specific years, these are imputed using linear interpolation between the two closest available observations. Past (i.e. before the first available year) and future (i.e. after the latest available year) trajectories are imputed using Monte Carlo simulations (see the methodological annex for details).
Source: All data is taken and adapted from (UNDESA, 2021[3]), SDG Global Database, https://unstats.un.org/sdgs/unsdg and (OECD, 2021[4]), OECD.Stat, https://stats.oecd.org/ (accessed on 29 October 2021).
Many goals lack good quality data,3 which hampers countries’ ability to evaluate policy outcomes and determine priorities for future action. Although there is current data available on almost three-quarters of the targets pertaining to the People category, only 60% of People SDG targets can be monitored over time due to the limited availability of robust time-series data. In addition, this rate is uneven among the different goals. For instance, it is possible to track over time only two of the nine targets for Goal 5 on Gender equality.
Overall, in OECD countries, while governments have been able to buffer some of the effects induced by containment measures, the pandemic and its aftermath may have long-term consequences. Social safety nets and food assistance programmes have been able to cushion some of the short-term impacts of the crisis on poverty (see Impact of the COVID-19 pandemic on Goal 1 for references and details) and on hunger (Impact of the COVID-19 pandemic on Goal 2), but the pandemic may nevertheless have a great impact on malnutrition. In addition, given countries’ heavy reliance on support measures,4 it is much more challenging to assess the longer-term consequences of the pandemic. The tremendous disruptions faced by the systems of Health (Impact of the COVID-19 pandemic on Goal 3) and Education (Impact of the COVID-19 pandemic on Goal 4) will challenge OECD outcomes in these areas for a long time. In many countries, attempts to prevent the circulation of the virus have affected people’s ability to access health-care facilities or to attend school. As for the dimension of Gender equality, covered by Goal 5, the effects of the pandemic are more ambiguous and call for careful monitoring (Impact of the COVID-19 pandemic on Goal 5).
Goal 1 aims at “ending poverty in all its forms everywhere”. Overall, basic living conditions for all are (or are about to be) met in all OECD countries. However, beyond extreme poverty, Member countries show much more diverse outcomes. Relative income poverty in most OECD countries had been stagnating, while there has been limited progress on (absolute) measures of multidimensional poverty. The aggregated performance of OECD countries in terms of social protection coverage is rather anemic and may hide significant disparities – the coverage rates of cash and in-kind programmes to prevent poverty differ across countries and programme types. These overall patterns should, however, be interpreted carefully and in light of what can actually be measured.
The COVID-19 pandemic has had a dramatic impact on poverty at global level. In OECD countries, however, government support measures for households seem to have buffered most of the economic impacts of COVID-19, with micro-simulation models pointing to relative stability of relative poverty rates (and even a decrease in some countries). Social protection has been key to prevent the impact of the crisis from disproportionately affecting vulnerable populations. However, heavy reliance on support measures raises the possibility that progress may be reversed, should the support measures be withdrawn.
Assessing OECD countries’ performance on Goal 1
This report uses data from the SDG Global Database together with OECD sources. Yet, the starting point always remains the global indicator framework, curated by the IAEG-SDGs. Table 2.1 shows that data allow the monitoring of five of the seven targets underpinning Goal 1, and four of them can be assessed over time. For this Goal, two data series are sourced from the OECD and do not follow the global indicator framework. Global indicator supporting Target 1.2 is the proportion of the population living below the national poverty line. To preserve cross-country comparability, this report relies on a relative income poverty rate source from the OECD Income Distribution Database. In the case of Target 1.3.1, data series from OECD databases complement the SDG Global Database. Drawing from OECD databases for this indicator allows offering longer time series and hence meeting higher statistical standards. On top of the indicators listed in Table 2.1, the database includes three additional data series under Target 1.a. Yet, those are considered to be mainly informative in the context of Goal 1 and are not assessed in this report (details and data for all indicators are available at http://www.oecd.org/wise/the-short-and-winding-road-to-2030-data-chapter-2-people.xlsx).
Virtually all OECD countries have already eradicated extreme poverty (Figure 2.3, panel A). Target 1.1 calls on countries to “eradicate extreme poverty” by 2030 – i.e. the extreme poverty rate (measured as the share of people living on less than USD 1.90 a day) is below 3%.5 In 2018, only one OECD country (Colombia) has not met this target yet, but given recent trends, all member states are expected to attain the target by 2030. This conclusion might, however, be at odds with what people with direct experience of poverty report about their lives, even in richer economies (Bray et al., 2019[5]). It might also reflect the statistical and conceptual inadequacy of this metric when applied to high-income countries.
Beyond extreme poverty, OECD countries’ performance is mixed. To overcome some of the methodological issues associated with measures of extreme poverty, Goal 1 also aims at halving “the proportion of men, women and children of all ages living in poverty in all its dimensions according to national definitions”. In the global indicator framework, Target 1.2 is to be monitored with two measures: national measures of income poverty (operationalised through measures of relative income poverty in the OECD context)6 and a measure of multidimensional poverty. In 2018 (or most recent year available). Only six OECD countries are considered to be at a short distance (i.e. less than 7.5% of the population live below the relative poverty rate), while 16 of them have a relative poverty rate exceeding 12% and are thus considered to be far from the target (Figure 2.2). In particular, the United States and Costa Rica are farthest from achieving the target, with 17.8% and 20.5% respectively. On average, one in ten OECD residents is considered as relatively poor, while one in five is at the crossroads of the different dimensions of poverty.7 This means that, on average, OECD countries still have a large distance to travel to meet the target. Over time, changes in the two indicators do not show consistent trends, but no OECD country is expected to make enough progress to reach the target levels by 2030 on both indicators.8 As already underlined in the literature (Morelli, Smeeding and Thompson, 2015[6]), most OECD countries are not showing any specific improvement on relative income poverty. Data included in this report suggest that only five of them achieved some reductions over the past 15 years (Ireland, Mexico, Poland, Turkey and the United Kingdom). On the multidimensional poverty front, only a small majority of OECD countries are making some progress, but only two of them (Colombia and Iceland) at a sufficient rate to halve the level by 2030.

Note: First year refers to 1999 for Finland; 2000 for Canada; 2002 for the United Kingdom; 2005 for Poland; 2006 for Hungary and Switzerland; 2007 for Austria and Spain; 2008 for Germany; 2009 for Chile; 2010 for Costa Rica; 2011 for Denmark, the Netherlands, New Zealand, Turkey and Israel; 2012 for France, Australia and Mexico; 2013 for Sweden and Estonia, 2015 for Luxembourg and Korea; and 2004 otherwise. Last year refers to 2014 for New Zealand, 2016 for the Netherlands, 2017 for Iceland, Denmark, Hungary, Switzerland, Chile and the United States; 2019 for Sweden, Canada, the United Kingdom and Latvia; 2020 for Costa Rica; and 2018 otherwise.
Source: OECD (2021[7]), "Poverty rate" (indicator), https://doi.org/10.1787/0fe1315d-en (accessed on 29 October 2021).
Even in countries with the most advanced systems of social protection, some workers and their families may not be properly covered (OECD, 2019[8]). Target 1.3 aims at "implementing nationally appropriate social protection systems and measures for all, including floors, and by 2030 achieve substantial coverage of the poor and the vulnerable”. For global measurement, the IAEG-SDGs proposes to measure this through the “proportion of population covered by social protection floors/systems”. The target has been operationalised in the SDG Global Database by a series of 12 different indicators covering different aspects of social protection and for different population groups (elderly, unemployed, pregnant women, etc.); however, data are available only for nine of them. In line with previous OECD analysis of this issue, this report also includes a proxy measure of recipients of secondary out-of-work benefits (safety nets) as a percentage of the poor working-age population, sourced from the OECD. On average, over the different dimensions of social protection, around three-quarters of OECD countries can be classified as currently having a “medium” or “large” distance to the 2030 target levels for comprehensive coverage (operationalised at 97% of the respective reference population9), and more than half of them are not making any progress towards universal coverage (Figure 2.3, panel B).This implies that most OECD countries do not currently provide social protection to all vulnerable populations and that these coverage rates have been stagnating or even falling through time. However, when assessing social protection programmes that address different risks separately,10 the picture is more nuanced. While the coverage rates for family, disability and old-age benefits are, on average, quite high (relative to their population of interest), the rates are much lower when it comes to the proportion of unemployed receiving unemployment cash benefits, the proportion of the poor working-age population receiving secondary out-of-work benefits, and the proportion of the employed population covered in the event of work injury. Not all data series allow to assess changes over time; for instance, the evolution of family benefits cannot be assessed with the available data. Coverage rates for disability and old-age benefits are likely to remain above the target level,11 while the proportion of unemployed receiving unemployment cash benefits as well as the proportion of the poor working-age population receiving secondary out-of-work benefits are stagnating or even declining in most OECD countries.12 These patterns are in line with previous OECD analysis of social protection systems (OECD, 2019[9]), which have pointed to long-term declines in benefit coverage (OECD, 2018[10]).
Most OECD countries secure decent living standards for all (Figure 2.3, panel A). Target 1.4 aims at ensuring that all “have equal rights to economic resources, as well as access to basic services, ownership and control over land and other forms of property, inheritance, natural resources, appropriate new technology and financial services, including microfinance”. First, Target 1.4 is monitored through the proportion of population living in households with access to basic services (understood as the proportion of population with access to basic sanitation and the proportion of population with access to drinking water services). While the language of the target suggests that 100% of the population should have access to both basic sanitation and drinking water services, the threshold to consider the target as achieved were set at 97% to allow for measurement errors. On average, in 2020, almost all OECD residents already had access to basic services such as drinking water (99.6%) or sanitation (98.3%). However, as shown by Figure 2.3, panel B, projecting past trends does not suggest that a comprehensive coverage will be reached in all countries by 2030.13 In addition, as highlighted by the OECD (2017[11]), most countries already reached their economic and technical limits in terms of connection to basic services and may need to find other ways of serving small and isolated areas in order to reach complete coverage. Beyond access to basic services, the global indicator framework also includes a measure focusing on secure tenure rights to land. This is not included in this report, however, as available data do not cover enough OECD countries.
When it comes to the resilience of the vulnerable population towards shocks and disasters, the distance to target varies greatly among OECD countries (and indicators). Target 1.5 commits countries to “build the resilience of the poor and those in vulnerable situations and reduce their exposure and vulnerability to climate-related extreme events and other economic, social and environmental shocks and disasters”. Five indicators are available to assess OECD countries’ current performance on Target 1.5 on prevention and resilience towards shocks: i) the adoption and implementation of DRR strategies in line with the Sendai Framework at national and ii) at local levels; iii) the number of deaths and missing persons attributed to natural disasters as well as iv) directly affected persons and v) the direct economic loss attributed to disasters relative to GDP. Following the global indicator framework for the Sustainable Development Goals and targets of the 2030 Agenda for Sustainable Development, these indicators are repeated under Targets 11.5, 11.b and 13.1. Overall, most OECD countries are considered to be at a rather short distance to the target, but available data do not allow gauging progress over time.14 On policy indicators, most OECD countries already had DRR strategies at both national and local levels in 2019. However, data from the SDG Global Database suggest that 11 OECD countries (Canada, Denmark, Iceland, Ireland, Israel, Italy, the Netherlands, the Slovak Republic, Sweden, Turkey and Portugal) stand far from the target, with a score on the adoption and implementation of DRR strategies below 43% (100% being full adoption and implementation).15 Disasters cost lives and disrupt socio-economic activities and livelihoods, causing important economic costs each time they occur. Yet, given the large disparities existing among OECD countries, on average across three indicators on the impacts of disasters, most OECD countries (14 of 23) were at a rather short distance to the target in 2019 (or latest year); however, available data do not allow gauging progress over time. In terms of loss of life due to disasters, the OECD average is around 1 death per 100 000 inhabitants. So far, with 0.20% of total economic loss attributed to disasters in 2018, available data show a limited impact of natural disasters in most OECD countries.16
Data are not adequate to assess countries’ efforts to end poverty. Goal 1 includes two “means of implementation” targets (1.a and 1.b). Target 1.a focuses on mobilising resources to implement programmes and policies to end poverty (it is monitored through data on the share of government spending on essential services, education, health and social protection, and ODA that focuses on poverty reduction), and Target 1.b, refers to the existence of policy frameworks aiming to support investment in poverty eradication actions (it is to be monitored through a measure of pro-poor public social spending). Rather than indicators of “performance”, these indicators are useful to contextualise Goal 1 (and no data are available to monitor performance on the latter indicator). Concretely, OECD work on social data and indicators and specific publications such as (OECD, 2020[12]) provide some insights into those areas. In particular, these show that after decades of rapid growth in the 1960s and 1970s, fiscal consolidation efforts implied a lower growth of social spending after 1990 and a decline over the past decade.
Summing up
Overall, OECD countries show a mixed performance on the different targets of Goal 1 (on poverty) (Figure 2.3). Basic needs, such as eradicating extreme poverty (Target 1.1) and access to basic services (Target 1.4), are met in most OECD countries. Figure 2.3, panel A, shows that virtually all OECD countries are extremely close to eradicating extreme poverty. Similarly, on access to basic services, nine in ten OECD countries are within a short distance of meeting the target. However, more comprehensive measures, such as the relative poverty rate or multidimensional measures (Target 1.2), show more unbalanced outcomes. Nine in ten OECD countries are currently considered to be at a medium or even large distance from hitting the target on multidimensional poverty and more than three-quarters show no progress towards the target. Although social protection is an effective way to tackle poverty (OECD, 2019[13]), it is not universal even in countries with the most advanced systems. Progress towards full coverage is also insufficient, as more than half of OECD countries are expected to show no progress or move away from Target 1.3 (Figure 2.3, panel B). In addition, many OECD countries still lack the means to mitigate vulnerability to climate-related extreme events and other economic, social and environmental shocks and disasters (Target 1.5). While progress is not assessed for building resilience of the vulnerable to shocks, current distances to targets show that only two in five OECD countries can be considered close to the corresponding target.
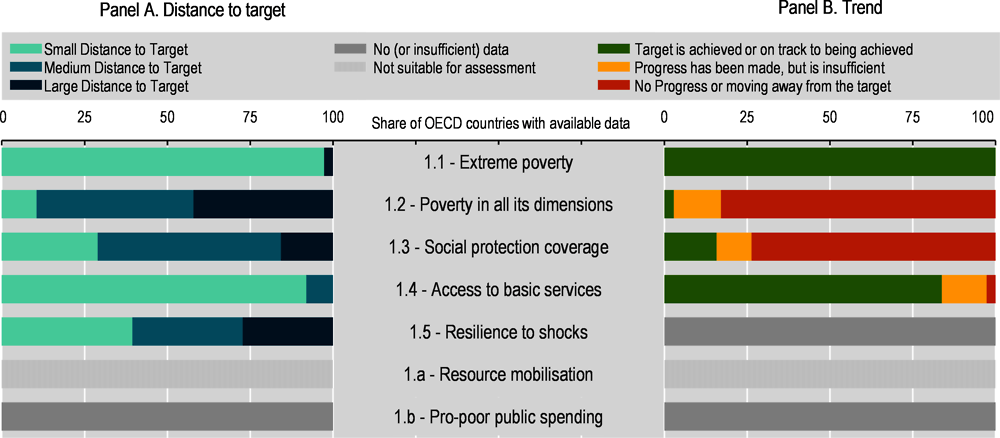
Note: * refers to targets with a 2020 deadline. Panel A shows the distribution of OECD countries in terms of the distance that they need to travel to reach each SDG target. Distances are measured in standardised units (s.u.) – see the methodological annex for details. Countries’ distances, based on the level of the indicators in the most recent available observation, have been grouped into three clusters: small distances (i.e. less than 0.5 s.u.), shown in light blue; medium distances (from more than 0.5 s.u. to 1.5 s.u.), shown in medium blue; and large distances (i.e. more than 1.5 s.u.), shown in dark blue. Panel B shows the distribution of OECD countries in terms of recent changes in their indicators for each target. Countries’ progress, based on changes in the indicators over recent years, are grouped into three clusters: those whose recent pace of progress should be sufficient to meet the target by 2030, shown in green; those whose recent progress should be insufficient to meet the target by 2030, shown in orange; and those countries whose recent performance has been stagnating or moving further away from the 2030 target, shown in red – see the methodological annex for details. The figure also highlights targets with no data to assess either their current distance to target or their pace of progress (shown in grey). Time series are considered as missing when there are two or fewer data points for each country; indicators are considered as missing when they are unavailable for 20 OECD countries or more, or for less than three world regions – see methodological annex for details.
Source: All data is taken and adapted from (UNDESA, 2021[3]), SDG Global Database, https://unstats.un.org/sdgs/unsdg and (OECD, 2021[4]), OECD.Stat, https://stats.oecd.org/ (accessed on 29 October 2021).
Impact of the COVID-19 pandemic on Goal 1
At global level, the pandemic had a dramatic impact on extreme poverty, but the evidence for its impact in the OECD area is scant (Target 1.1) – see Table 2.2. Global extreme poverty is expected to have risen in 2020 for the first time in over 20 years due to COVID-19 (World Bank, 2020[14]). However, assessing the impact of the crisis on extreme poverty across OECD countries is more challenging, because of a much smaller number of studies.
In most OECD countries, government support measures to households have helped offset some impacts of the COVID-19 crisis on relative poverty (Target 1.2). While most macro-economic measures of economic performance such as GDP or employment dramatically declined during the crisis, average household disposable income (as measured by national accounts) rose by 5.3% in the second quarter of 2020, thanks to government cash transfers (OECD, 2020[15]), though it then gradually fell until the fourth quarter of 2020 (OECD, 2021[16]). While data on average household income do not allow meaningful inferences on the impact of the crisis on income poverty, recent research using micro-simulation models tends to confirm the effectiveness of social protection systems in cushioning shocks on household incomes17 (Figari and Fiorio, 2020[17]; Brewer and Tasseva, 2020[18]; Almeida et al., 2020[19]; Lustig et al., 2020[20]; Li et al., 2020[21]; Han, Meyer and Sullivan, 2020[22]).18 Provisional estimates prepared by the OECD19 show that earning losses were heavier for the most vulnerable. Those losses were alleviated to a large extent by taxes and social transfers, and in particular by the extraordinary measures put in place by national governments. Despite that, some working-age people, particularly young workers, have experienced increases in poverty rates in some countries (Eurostat, 2021[23]).
As noted above, social protection (Target 1.3) has been key to limiting the economic impact of a crisis on vulnerable populations, as it plays a critical role in softening the drop in income as a result of the crisis. However, there is a risk that many vulnerable households will nevertheless experience a drop in disposable income, and a greater risk of poverty, as the crisis lasts longer. Entitlements to job retention schemes and unemployment benefits are often time-limited, and governments will eventually have to phase out some of the temporary emergency income support provided outside of standard social protection systems. As shown by OECD (2021[16]), the decline in real household disposable income per capita between the second and fourth quarters of 2020 reflects the decrease in government transfers to households. As stressed in OECD (2021[24]), while support remains key for sectors still heavily affected by social distancing restrictions, for others where economic activities have resumed the design of these schemes is to be progressively adjusted. In addition, supporting all vulnerable households and closing social protection gaps will remain key priorities beyond the crisis (OECD, 2020[25]), in particular for the large number of workers in non-standard jobs who are being left behind even in countries with the most advanced social protection. Overall, though, as the COVID-19 crisis and government responses affected both the number of vulnerable households as well as the number of people entitled to social protection, the actual impact on the coverage rate (Target 1.3) is still unknown (Table 2.2).
Target 1.5 on population’s resilience to economic, social and environmental shocks includes measures of both policy stance and the impact of these disasters. The excess mortality induced by the COVID-19 pandemic will dramatically impact the second part of the target. In particular, this target includes an indicator on risk reduction (a score of adoption and implementation of “national disaster risk reduction strategies in line with the Sendai Framework for Disaster Risk Reduction 2015-2030”), which covers risks of epidemics and pandemics.20
As underlined by the OECD (2020[26]), the COVID-19 pandemic is expected to lead to a marked increase in social spending (Targets 1.a and 1.b). Demands on health-care systems have increased, and a wide array of social support measures were put in place or expanded to help people cope with the economic effects of the pandemic (OECD, 2021[27]). Yet, given the difficulty to gauge just how informative this indicator actually is (an increase in public spending cannot be classified as progress), Table 2.2 has summarised the impact as mixed.
Goal 2 aims at achieving food security for all and ending malnutrition, but also at promoting agricultural practices that are sustainable for the environment and that preserve the living conditions of food producers. On the consumption side, severe hunger has been eradicated in the vast majority of OECD countries. Nonetheless, in many countries malnutrition and food insecurity remain an issue, and the situation is unlikely to improve by 2030. On the production side, despite progress in some dimensions, the environmental sustainability performance of agriculture is still insufficient. Making better policies for food systems will, however, require overcoming large evidence gaps on the extent, characteristics and drivers of policy issues, but also on the effectiveness of policy instruments and on some of the policy implications (OECD, 2021[28]).21
On the consumption side, the fall in household income induced by the COVID-19 crisis may have led to a dramatic rise in food insecurity, especially in poorer countries. In OECD countries, however, safety nets and food assistance programmes should have softened the main effects of the crisis on hunger. Nonetheless, income losses, unemployment, stress and more sedentary behaviours induced by the pandemic raise concerns about an increase of malnutrition. On the production side, even though food supply chains have proved remarkably resilient in the face of the pandemic, the crisis is likely to have a long-term impact on the agricultural sector, most notably on farmers’ livelihoods and greenhouse gas emissions (OECD, 2020[29]).
Assessing OECD countries’ performance on Goal 2
This report uses data from the SDG Global Database together with OECD sources. Yet, the starting point always remains the global indicator framework, curated by the IAEG-SDGs. Table 2.3 shows that data allow the monitoring of five out of the eight targets underpinning Goal 2. For this goal, two indicators sourced from the OECD complement the SDG Global Database. Relying on OECD data sources allows monitoring Indicator 2.4.1 (which is to be measured by the proportion of agricultural area under productive and sustainable agriculture), for which no data series are available in the SDG Global Database. In addition, using OECD data sources on Target 2.2 on malnutrition provides wider country coverage and allows coverage of an area that is critical for OECD countries, beyond those covered by the global indicator framework. On top of the indicators listed in Table 2.3, the database includes six extra data series to monitor Targets 2.5 and 2.a, but those are considered to be mainly informative in the context of Goal 2 (details and data for all indicators are available at http://www.oecd.org/wise/the-short-and-winding-road-to-2030-data-chapter-2-people.xlsx).
Severe hunger has been eradicated in the vast majority of OECD countries, but food insecurity remains an issue for many of them. Target 2.1 commits countries to “end hunger and ensure access …to safe, nutritious and sufficient food”. For global measurement, the IAEG-SDGs proposes to measure this through the prevalence of undernourishment (2.1.1) and the prevalence of moderate or severe food insecurity (2.1.2). Overall, around three in four OECD country are close to having eradicated Hunger (Figure 2.6, panel A). In 2019, the levels of undernourishment (i.e. the proportion of the population whose habitual food consumption is insufficient to provide the dietary energy levels that are required to maintain a normal active and healthy life) and severe food insecurity (i.e. the proportion of individuals who have experienced food insecurity, as measured through the “Food Insecurity Experience Scale”) are below 3% in almost all OECD countries, and below this level measures are likely to reflect measurement errors. The only notable exceptions are the Slovak Republic and Colombia, where 4% to 9% of the population still miss the dietary energy levels required to maintain a normal active and healthy life. In addition, in Mexico, the distance to target is large for both the prevalence of undernourishment (7%) and the prevalence of severe food insecurity (6%). Beyond extreme hunger though, moderate food insecurity remains an issue for a significant share of OECD countries. Only 12 OECD countries are at a short distance from eradicating food insecurity (i.e. less than 5.2% of the population is food insecure); with more than 10% of their population suffering from severe to moderate food insecurity, nine Member countries are considered to remain far from the target. When looking at recent developments in the prevalence of undernourishment over time, the picture is positive for all countries but four (Mexico, the Slovak Republic, Chile and Colombia) (Figure 2.6, panel B). However, considering the lack of progress on moderate food security, more than three in four OECD countries may not achieve the overall target by 2030.
No OECD country is considered as being close to ending malnutrition. While Target 2.2 refers to “ending all forms of malnutrition” and “addressing the nutritional needs of adolescent girls, pregnant and lactating women and older persons”, global indicators focus only on children under the age of 5 and women of reproductive age. Available data do not cover enough OECD countries to measure the prevalence of stunting among children under age 5 (Indicator 2.2.1), and relying on the SDG Global Database would restrict the assessment to the prevalence of anaemia among women of reproductive age (2.2.3). Anaemia is highly prevalent globally, disproportionately affecting children and women of reproductive age. It negatively affects cognitive and motor development and work capacity, and among pregnant women iron deficiency anaemia is associated with adverse reproductive outcomes, including preterm delivery, low-birth-weight infants and decreased iron stores for the baby, which may lead to impaired development. In OECD countries, on average 14% of women of reproductive age suffered from anaemia in 2019. While the target had been set at 3% (below this level measures are likely to reflect measurement errors), no OECD country is considered to be at a short distance to the target, and only two (Australia and Chile) are deemed to be at a medium distance. With more than one in five women suffering from anaemia, distances are particularly large in the Czech Republic, Colombia, Latvia, Estonia, Slovenia and the Slovak Republic. While blood haemoglobin concentrations can be affected by many exogenous factors, including altitude, pregnancy, age and sex, unhealthy behaviour (such as smoking or a diet lacking in certain vitamins and minerals) also plays a significant role. Over the last two decades, the prevalence of anaemia has been increasing in all but seven OECD countries (mostly from Latin America and Eastern Asia), but even in these the pace would not be sufficient to lead to significant reductions.
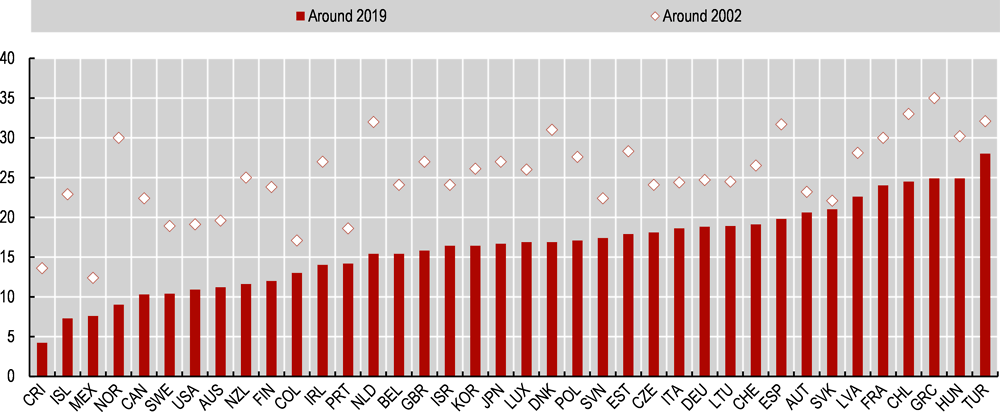
In addition, other types of malnutrition, beyond those covered by the global indicator framework, prevail in OECD countries. In particular, obesity, which was already high in the vast majority of OECD countries, had been increasing in virtually all of them over the past two decades (Figure 2.4) not expected to be eliminated in any of them. With less than 6% of the population classified as obese, Japan and Korea are the only OECD countries that can be considered as close to the aspirational target of eliminating obesity, which is operationalised at 3% of the resident population. With more than 15% of their resident population being obese, distances to target are considered to be large for 31 OECD countries. For six of them, including Australia, Chile, Hungary, Mexico, New Zealand and the United States, the prevalence of obesity even exceeds 30% of adults. Being overweight, including obese, is a major risk factor for various non-communicable diseases (NCD) such as diabetes, cardiovascular diseases and certain cancers (see Target 3.4 for further details).

Note: For Austria, Denmark, Greece, Iceland, Italy, Lithuania, Luxembourg, Netherlands, Norway, Poland, Slovenia, Spain, Sweden and Switzerland obesity rates are based on self-reported measures. First year refers to 1999 for Germany; 1999 for Israel; 2000 for Japan, Italy, Sweden, the Netherlands, Denmark, the Czech Republic, Finland, the United Kingdom, Mexico, the United States; 2001 for Spain and Korea; 2002 for Switzerland, Iceland and Norway; 2003 for Chile and New Zealand; 2004 for Canada, Poland and the Slovak Republic; 2005 for Colombia and Lithuania; 2006 for Austria, France and Greece; 2007 for Australia, Ireland and Slovenia; 2009 for Hungary; 2011 for Turkey, 2015 for Portugal; 2014 for otherwise. Last year refers to 2008 for the Slovak Republic; 2010 for the Czech Republic; 2012 for Germany; 2014 for Costa Rica and Estonia; 2015 for Israel, Colombia, France and Portugal; 2016 for Chile; 2017 for Denmark, Finland, Switzerland, Iceland, Poland, Australia and Turkey; 2018 for Mexico, Belgium and Latvia; 2020 for Spain and New Zealand; 2019 for otherwise.
Source: OECD (2021[30]), “Overweight or obese population” (indicator), https://doi.org/10.1787/86583552-en (accessed on 29 October 2021).
Beyond food consumption, hunger and malnutrition, Goal 2 also includes targets pertaining to the inclusiveness and the environmental impacts of the food production sector. Target 2.3 for instance, aims at fostering agricultural productivity and incomes of small-scale food producers. While data exist for some OECD countries, thus far, they cover only European countries and Canada and are thus not available for enough OECD countries to be included in this report.
The agricultural sector’s pressure on the environment is high in several OECD countries, and, despite some progress, concerns remain. Target 2.4 aims at “ensuring sustainable food production systems and implementing resilient agricultural practices”. At global level, Target 2.4 is measured by the share of agricultural area under productive and sustainable use, but there is no agreement as to how to measure it among OECD countries (OECD, 2019[31]). To overcome this problem, and in line with previous OECD analysis on this issue, this report measures the environmental pressure of the agricultural sector through data on the nitrogen surplus associated to agricultural production.22 Nitrogen surpluses contribute to water and air pollution, while, conversely, agricultural areas with sustained nutrient deficits may suffer reductions in soil fertility (zero surplus can thus be considered as an aspirational target for 2030). Based on data for the latest year available (around 2018), only six OECD countries (Iceland, Colombia, Australia, Estonia, the Slovak Republic and Canada) can be considered as being “close to the 2030 target” (i.e. less than 25 kg of nitrogen per hectare of agricultural land), while nine OECD countries (Denmark, the United Kingdom, Norway, the Czech Republic, Luxembourg, Belgium, Japan, the Netherlands and Korea) report more than 70kg/ha and are thus considered as having a large distance to the target (Figure 2.5). Beyond the static snapshot, progress towards reduced nitrogen balances is mixed. While declining on average across OECD countries, balances have been stagnating or even increasing in more than half of them, including in some countries with already high levels of nitrogen surplus. Figure 2.6, panel B, shows that despite some progress in a few countries, none of them is expected to achieve a nitrogen balance by 2030. In addition, recent analysis has shown that the decline in nitrogen surpluses has slowed almost everywhere, raising concerns about the ability of OECD countries to attain their target by 2030 (OECD, 2019[32]).

Note: First year refers to 1996 for Lithuania, Greece, Denmark, Luxembourg and Belgium; 1997 for Norway; 2017 for Australia, Mexico, the United States, Austria, Portugal, Spain, Finland, Germany, Ireland, Slovenia, Switzerland, Italy, the Czech Republic, Japan, the Netherlands and Korea; 2000 for Estonia, Hungary and the United Kingdom; and 1999 for otherwise. Last year refers to 2015 for Lithuania Greece, Denmark, Luxembourg, Belgium and Estonia; 2016 for Norway; 2018 for Iceland, Colombia, the Slovak Republic, Canada, Turkey, Latvia, France, Costa Rica, Sweden, Poland and New Zealand; and 2017 for otherwise.
Source: (OECD, 2021[33]), “Nutrient balance” (indicator), https://doi.org/10.1787/82add6a9-en (accessed on 29 October 2021).
Despite the fact that Target 2.5 is one of the very few with an earlier (i.e. 2020) deadline, a very high share of local livestock breeds are at risk of extinction, with very few countries making progress. Target 2.5 commits countries to “maintain the genetic diversity of seeds, cultivated plants and farmed and domesticated animals and their related wild species” and “promote access to and fair and equitable sharing of benefits arising from the utilization of genetic resources and associated traditional knowledge”. One of the measures to monitor Target 2.5 is the proportion of local breeds classified as being at risk of extinction (Indicator 2.5.2). While the natural target is zero, the target level had been set at 3% to allow for measurement errors. Even though the deadline to meet the target has passed, no OECD country had been able to make enough progress. On average, across OECD countries, in 2021, 80% of local breeds are still classified by the FAO as being “at risk” (as a share of local breeds with known level of extinction risk), and only one country (Mexico) can be considered as being close to the target (i.e. less than 15% of local breeds at risk of extinction). Yet, caution should be taken when interpreting the results, as for the majority of local breeds around the world, the risk status remains unknown due to a lack of data. For instance, even though Mexico is considered to be the only country to achieve the target level based on available data (Figure 2.6, panel B), the actual status of only 6% of local breeds was known in Mexico in 2021. While the deadline has already passed, overall trends are not encouraging, and, with the exception of three countries (Austria, Colombia and Germany), no OECD country is expected to make any further progress towards the target in the absence of specific policies (Figure 2.6, panel B). Beyond reducing the risk of extinction, this target also aims at developing facilities for the conservation of plant and animal genetic resources for food and agriculture. Available data are, however, expressed as the total number of secured resources and do not allow any comparative assessment.
The distance to target is not assessed for two of the three “means of implementation” targets under this goal (2.a and 2.b). Target 2.a focuses on investment in rural infrastructure and agricultural research and is monitored through data on government spending and ODA going to the agriculture sector. While the type and impact of government spending in agriculture and food may be gauged, the amount of spending is a contextual indicator, rather than an indicator of performance. Therefore, it is not used to measure distance to target. In addition, as most recent agricultural policy developments have been dominated by responses to the impact of the COVID pandemic, the trend of this indicator is further discussed in the section below (Impact of the COVID-19 pandemic on Goal 2). Similarly, ODA flows are not used to monitor progress. ODA flows are conditioned by both the donor’s and recipient’s context and cannot be benchmarked properly. Yet, OECD data show that, driven by a shift away from bilateral aid that finances infrastructure and production, with aid focusing more on social sectors, aid to agriculture in developing countries has fallen from nearly 25% of total ODA in the mid-1980s to only 5% in 2019 (OECD, 2021[34]). Whilst the share of aid to agriculture has hovered around 5%, in volume terms it more than doubled since 2002. Part of this trend is due to the increase in total ODA since 2002, as well as to increased food security concerns and to a renewed interest in agricultural technology for the poor.
The indicator supporting the assessment of Target 2.b on trade restrictions and distortions in agricultural markets (monitored through agricultural export subsidies) is also considered as providing contextual information. Agricultural export subsidies are reported in millions of USD and do not take into account the different sizes of agricultural economies. Using a wide range of measures of support to agriculture, OECD work on agricultural policies shows that about two-thirds of support to farmers is provided through measures that strongly distort farm business decisions – thereby distorting global agricultural production and trade (OECD, 2020[35]; OECD, 2021[36]).
Virtually all OECD countries are (or will be) able to limit food price anomalies. Target 2.c focuses on ensuring the functioning of food commodity markets and facilitating timely access to market information. It is monitored through an indicator of food price anomalies (IFPA)23 that aims at identifying market prices that are abnormally high.24 In 2019, as shown in Figure 2.6, panel A, no OECD country reported a large distance on this indicator (with scores ranging between 0.90 and 1.20, only three OECD countries including Australia, the Netherlands and Poland are considered to be at a medium distance). Past trends suggest all countries are likely to remain in a “normal range” by 2030 (Figure 2.6, panel B). This suggests that in OECD countries, existing institutions and mechanisms allowed preventing high volatility in food prices in the long-run.
Summing up
Overall, while most OECD countries have alleviated severe hunger and limited extreme food price volatility, few of them will be able to meet most Goal 2 targets on eradicating hunger and malnutrition. As stressed by the OECD, food systems need to meet the triple challenge of ensuring food security and nutrition, providing livelihoods for farmers and others in the food chain, and improving the environmental sustainability of the sector (OECD, 2021[28]). Food security remains an issue, particularly for the most vulnerable (Placzek, 2021[37]), but a vast majority of OECD residents have access to sufficient, safe and nutritious food (Target 2.1). Yet, beyond hunger, more and more people are experiencing malnutrition and obesity (Target 2.2). On the environmental sustainability front, despite progress in some dimensions, the performance of agriculture is still unsatisfactory. Most OECD countries lack the mechanisms to maintain diversity of seeds and livestock (Target 2.5), and despite nearly half of OECD countries showing some progress, none is expected to relieve the environmental pressure of the agricultural sector by 2030 (Target 2.4). While the impact of climate change and the rise in extreme weather conditions may impact food security and price stability, for now no OECD country is experiencing high food price volatility. Target 2.c on the functioning of food commodity markets is actually the only target that virtually all OECD countries are likely to reach by 2030 (if previous trends materialise).

Note: * refers to targets with a 2020 deadline. Panel A shows the distribution of OECD countries in terms of the distance that they need to travel to reach each SDG target. Distances are measured in standardised units (s.u.) – see the methodological annex for details. Countries’ distances, based on the level of the indicators in the most recent available observation, have been grouped into three clusters: small distances (i.e. less than 0.5 s.u.), shown in light blue; medium distances (from more than 0.5 s.u. to 1.5 s.u.), shown in medium blue; and large distances (i.e. more than 1.5 s.u.), shown in dark blue. Panel B shows the distribution of OECD countries in terms of their recent changes in the indicators for each target. Countries’ progress, based on changes in the indicators over recent years, are grouped into three clusters: those whose recent pace of progress should be sufficient to meet the target by 2030, shown in green; those whose recent progress should be insufficient to meet the target by 2030, shown in orange; and those countries whose recent performance has been stagnating or moving further away from the 2030 target, shown in red – see the methodological annex for details. The figure also highlights targets with no data to assess either their current distance or their pace of progress (shown in grey). Time series are considered as missing when there are two or fewer data points for each country; indicators are considered as missing when they are unavailable for 20 OECD countries or more, or for less than three world regions – see the methodological annex for details.
Source: All data is taken and adapted from (UNDESA, 2021[3]), SDG Global Database, https://unstats.un.org/sdgs/unsdg and (OECD, 2021[4]), OECD.Stat, https://stats.oecd.org/ (accessed on 29 October 2021).
Impact of the COVID-19 pandemic on Goal 2
The biggest risk for food security in OECD countries (Target 2.1) is not limited food availability but rather consumers’ lack of access to food due to income limitations. Despite many factors adversely affecting agricultural and food markets during the pandemic, including a lack of seasonal labour and disruption of air freight, shortfalls in the availability of food have so far been limited. Food supply chains have demonstrated resilience in the face of the stress induced by the pandemic, and a food-price crisis similar to the one experienced in 2007-08 has been avoided (OECD, 2020[38]). However, a persistent gulf between supply and demand for some goods, together with rising food costs, has led to higher and more enduring price increases than expected (OECD, 2021[39]). In addition, the rise in unemployment triggered by containment measures has resulted in unprecedented numbers of people relying on social protection programmes or food handouts delivered by charities and anti-poverty associations. As noted in the previous section, social safety nets and food assistance programmes have helped to mitigate the main effects of the crisis on food insecurity in most OECD countries. Yet, even in countries with the most advanced social protection, some, such as workers with non-standard jobs and their families, young people not in education, employment or training, students, etc., may have missed out. In addition, while food assistance usually provides staple food, low-income people may lack proteins and vitamins and suffer from malnutrition (Placzek, 2021[37]). As food insecurity is associated with increased risk for chronic diseases, changes in the depth and breadth of food insecurity during the COVID-19 pandemic could have serious and long-lasting health consequence (Leddy et al., 2020[40]).
In addition, the pandemic may have increased the risk of obesity (Target 2.2) – see Table 2.4. The COVID-19 crisis and lockdowns have led to dramatic changes in people’s behaviours, prompting people to cut back on physical activity and to increase sedentary behaviours (Stockwell et al., 2021[41]). In parallel, as research (Torres and Nowson, 2007[42]; Adam and Epel, 2007[43]) shows that higher stress and anxiety are likely to influence eating behaviour (leading to greater consumption of foods that are energy and nutrient dense, i.e. high in sugar and fat). While no definitive evidence exists on the impact on the risk of obesity, the risk is expected to have significantly increased following the pandemic (Mattioli et al., 2020[44]).
The COVID-19 pandemic is expected to significantly affect the agricultural sector over the next decade. Beyond food consumption, Goal 2 also aims at ensuring the livelihoods of people working in food production (Target 2.3) and preserving the sustainability of agriculture. In particular, recent OECD analysis (OECD, 2020[29]) highlights how falling incomes at global level would have had a cascade effect on many different aspects of the food sector in the absence of government intervention. Yet, most recent analysis suggests that average farm incomes rose in 2020 for a majority of OECD countries (OECD, 2021[45]).
Support to agriculture (Target 2.a) may be distortive (Target 2.b), inefficient, inequitable and harmful (Target 2.4). Substantial resources – USD 75 billion – were earmarked for COVID-19 sectoral support in OECD countries – but actual disbursements have so far been much lower, partly reflecting the overall resilience of agriculture to the COVID-19 shock. Yet, most of this support was provided through potentially distorting instruments (market price support and payments linked to output or the unconstrained use of inputs) that are inefficient at transferring income to farmers (a large share of the benefits is capitalised into land values or leak in the form of higher prices for inputs). They also tend to be inequitable, to the extent that support is linked directly to production, and not targeted to producers with low incomes. Finally, through direct incentives to increase production, these instruments contribute to increasing resource pressures, including through impacts on water quality, and can raise GHG emissions. Given also a lack of complementary environmental policies, fewer countries have managed to combine productivity growth with lower resource pressures and reduced emissions (OECD, 2021[45]).
While the consequences of the COVID-19 pandemic are strongly visible in international trade, food prices remained robust (Target 2.c). Many governments moved swiftly to keep agricultural supply chains functioning, including by designating agriculture and food as an essential sector. As a result, policies were generally successful in maintaining the overall functioning of food supply chains. After dropping by 7% in the second quarter of 2020, average international food prices increased towards the end of the year, and annual averages ended 3% higher than in 2019, with contrasting movements between crop and livestock markets (OECD, 2021[45]). Yet, more recently, global food prices have risen to their highest level in a decade, amidst strong demand and weather-related disruptions to production in key food-exporting economies (OECD, 2021[46]). In October 2021, annual food price inflation rose to 4.5%, from 1.5% in May 2021. While inflation is expected to fade through 2022-23, it could continue to surprise on the upside (OECD, 2021[39]).
Since the onset of the pandemic, more than 2 million people have died from COVID-19 in OECD countries. This has had a dramatic impact on Goal 3, which aims at ensuring “healthy lives and well-being for all and at all ages”. While combatting non-communicable disease had been the most salient health-care challenge for OECD countries for long, the pandemic is bringing back the combat against infectious diseases as a major challenge for OECD countries. In this context, more than ever, Goal 3 is a central piece in reaching the targets of the 2030 Agenda.
Before the pandemic hit, OECD countries were progressing on the vast majority of targets relating to Goal 3. However, the pace of progress would not have allowed achieving the targets underpinning Goal 3 by 2030. While nearly all OECD countries greatly reduced maternal and infant mortality, significant challenges remain in other fields. Among those, combatting non-communicable diseases was probably the major challenge for OECD countries before the pandemic hit. Fuelled by unhealthy lifestyles, including smoking, drinking and obesity, but also by environmental factors, like air pollution, and demographic changes, non-communicable diseases were the leading cause of death in OECD countries. While the toll imposed by communicable diseases had significantly declined, a range of factors – lower confidence in the safety and efficacy of vaccines, the diffusion of antibiotic-resistant infections and new viral outbreaks such as COVID-19 – are about to undo part of the progress achieved. To overcome those persistent changes, strong and inclusive health-care systems are essential. While most OECD countries have achieved universal coverage for a core set of health services, the range of services covered and the degree of coverage vary substantially across countries. Effective access to different types of care can also be limited because of shortages of health workers, long waiting times or long travel distances to the closest health-care facility.
COVID-19 is directly affecting the health of millions of people, but the pandemic also has an indirect effect on many other dimensions of health. The pandemic revealed and amplified vulnerabilities in health-care systems. In many countries, attempts to prevent the circulation of the virus largely disrupted normal health-care services. By limiting people’s ability to go to health-care facilities to seek services such as check-ups, vaccinations and even urgent medical care, the pandemic is affecting the prevention, early diagnosis and treatment of many diseases. Conversely, in the very short term, some of the protective measures put in place to limit the pandemic have had a positive impact. For instance, the substantial drops in mobility resulted in a large decrease in road accidents and in temporary reductions of air pollution.
Assessing OECD countries’ performance on Goal 3
This report uses data from the SDG Global Database together with OECD sources. Yet, the starting point always remains the global indicator framework, curated by the IAEG-SDGs. Table 2.5 shows that data allows the monitoring of 12 of the 13 targets underpinning Goal 3 (all of which can be monitored over time). For this goal, 12 indicators sourced from the OECD complement the SDG Global Database. In most cases, they align with the global indicator framework. In some cases, drawing from OECD databases also allows for a longer time span (3.3.4 and 3.7.2), being timelier (3.a.1), or mirroring specific conditions in OECD countries. For instance, using OECD data to assess mortality indicators (3.1.1, 3.2.1, 3.2.2, 3.4.2, 3.6.1 and 3.9.3) allows greater accuracy, as mortality rates are age-standardised based on the structure of the OECD population. Therefore, drawing from OECD databases prevents country comparisons from being disproportionately influenced by country differences in the population’s age structure. Finally, while the SDG Global Database has available data series on new HIV infections (3.3.1), since it does not cover enough OECD countries, an indicator of new incidences of AIDS is included from OECD sources. On top of the indicators listed in the table, the database includes eight extra data series (under Targets 3.b and 3.c), but these are considered to be contextual indicators rather than measures of performance and cannot be included in the assessment of Goal 3 (details and data for all indicators are available at http://www.oecd.org/wise/the-short-and-winding-road-to-2030-data-chapter-2-people.xlsx).
Figure 2.9, panel A, shows that all OECD countries already have greatly reduced both maternal mortality (Target 3.1) and deaths of newborns and children (Target 3.2). Target 3.1 calls on countries to “reduce the global maternal mortality ratio to less than 70 per 100 000 live births”, which is supported by two distinct indicators: the maternal mortality ratio and the proportion of births attended by skilled heath personnel. In 2018 (or latest year available), all OECD countries already exceeded the target level for both indicators.25 However, Figure 2.9, panel B, also shows that, in the absence of additional measures, around 15% of OECD countries may fail to reach the target for maternal mortality (Target 3.1). While no OECD country is expected to fail in achieving the target on maternal mortality, past trends suggest that a few may not be able to reach the target on the proportion of births attended by skilled health personnel (including France, Denmark, Iceland, the Slovak Republic and New Zealand).
Through Target 3.2, the 2030 Agenda aims at “ending preventable deaths of newborns and children under 5 years of age neonatal”. It even proposes numerical targets to be reached by 2030 for both mortality rates: below 12 per 1 000 live births for neonatal mortality and below 25 per 1 000 live births for under-five mortality. All OECD countries were already well below those rates in 2019, and none of them is expected to exceed those rates in 2030. This report also includes measures of infant mortality (i.e. below one year of age) for which the target had been set at 15 per 1 000 live births to be consistent with the targets for neonatal and under-five mortality. Similarly, all OECD countries are already below target level for the infant mortality rate (or will be by 2030).
Before the COVID-19 pandemic hit, most OECD countries had achieved strong progress in reducing the incidence of communicable diseases, yet these diseases remain a threat to the health of OECD citizens. Target 3.3. refers to “ending the epidemics of AIDS, tuberculosis, malaria and neglected tropical diseases” and “combatting hepatitis, water-borne diseases and other communicable diseases”, which is to be monitored by six measures, each corresponding to a different disease (target levels are set at 3 per 1 000 000 population).
On HIV/AIDS, relative to the OECD average in 2018, distance to the target on the number of new AIDS26 cases are short in a vast majority of countries. Distances are longer in Colombia, Costa Rica and Mexico and to a lesser extent in Chile, the United States, Latvia and Estonia. As progress in HIV/AIDS therapy has allowed decoupling HIV infection from its progression to AIDS (Gaind, 2016[47]), a majority of OECD countries (20 of 38) show declining rates of new AIDS infections. However, this should not hide the lack of progress on the rates of new HIV infections in many OECD countries. In addition, only 11 OECD countries are expected to reach the target level for AIDS incidences by 2030.
On tuberculosis, in 2018, distances to target are short for both new reported cases and deaths for more than half of OECD countries, but they are long in Colombia, Korea, Lithuania and Latvia. Death rates are stable or declining in all OECD countries, and available data does not suggest any progress on the front of new cases in seven OECD countries. While some countries already have rather low rates (Australia, Iceland, Norway and Sweden), other countries show high rates and no progress (Colombia, Korea and Mexico).
On hepatitis B, in 2019, distances are short in all OECD countries besides Chile, Belgium and Canada (and to a lesser extent in Costa Rica and Colombia) when the assessment is based on incidence. However, using surface antigen (HBsAg) prevalence among children under age five suggests that in 2015 fewer than half of OECD countries can be considered to be at a short distance to the target (14 of 38). While trends cannot be assessed for HBsAg prevalence, hepatitis B incidence is likely to remain at a low rate or even be decreasing in most OECD countries. Yet, for eight countries, incidences had been on an upward trend over the past few years (Canada, Belgium, Chile, Costa Rica and Colombia but also Portugal, Korea and Japan, where incidences are rather low).
Target 3.3 also refers to tropical diseases and malaria. Yet, tropical diseases are negligible in all OECD countries other than Colombia and Mexico, and no data are available on malaria for any OECD country.
Overall, while seven in ten OECD countries are considered to be at a short distance from Target 3.3, in the absence of further measures, only four in ten countries will be able to reach the target by 2030 (Figure 2.9, panel B).
Despite current downward trends in mortality rates attributed to non-communicable diseases (NCDs) and suicide rates in most OECD countries, countries are not on track to meet target levels by 2030. Target 3.4 calls countries to “reduce by one-third premature mortality from non-communicable diseases through prevention and treatment and promote mental health and well-being”. Accordingly, the global indicator framework encompasses both deaths from non-communicable diseases as well as deaths from suicide. Regarding the former, as a result of both unhealthy living conditions (see Targets 2.2, 3.5 and 3.a) and population ageing, non-communicable diseases, such as cardiovascular disease, cancer, diabetes and chronic respiratory disease, had been by far the leading cause of death in most OECD countries (OECD, 2019[48]). Figure 2.7 shows that, in 2019, most OECD countries are considered to be at a medium or long distance from the 2030 target (i.e. the probability of dying between the ages of 30 and 70 from cardiovascular disease, cancer, diabetes or chronic respiratory disease is higher than 10%).27 At the same time, over the last two decades, all OECD countries have experienced declines in the probability of dying from such diseases. However, in the absence of further measures, the current pace of progress would be insufficient to reach the 2030 target for 28 of the 38 OECD countries.

Source: (UNDESA, 2021[3]), SDG Global Database, https://unstats.un.org/sdgs/unsdg (accessed on 29 October 2021).
The second segment of Target 3.4 covers quite a different aspect of premature mortality: death from suicide.28 On average across OECD countries in 2018, 11 people per 100 000 die each year from suicide, but large cross-country disparities exist. Overall, despite minor differences between data from the OECD and from the SDG Global Database, Turkey, Greece and Mexico and to a lesser extent Israel and Italy can be considered to be close to target (i.e. suicide rate is below 6 in 100 000 people).29 Conversely, death rates from suicide are twice as high in the vast majority of OECD countries. This conclusion is further strengthened when considering that death registries are likely to under-represent the phenomena due to different reporting practices and stigma (OECD, 2020[49]).
Alcohol consumption has been declining in a (small) majority of OECD countries, but consumption patterns remain high in many of them. Target 3.5 is about substance abuse, a leading driver of higher mortality. For global measurement, the IAEG-SDGs proposes monitoring the coverage of treatment interventions for substance abuse and alcohol per capita consumption (aged 15 years or older). When measured through sales data, alcohol consumption in individuals aged 15 or over was estimated at around 10 litres of pure alcohol per person in 2019 – this is equivalent to two bottles of wine, or nearly 4 litres of beer, per week per inhabitant in OECD countries. Yet, this average masks significant variations both across countries and, within the same country, across different population groups (OECD, 2021[50]).
Alcohol intake is a major risk factor for many non-communicable diseases (Target 3.4) and significantly contributes to road traffic accidents (Target 3.6), violence and homicide (Target 16.1), suicide and mental health disorders (Target 3.4) – see (OECD, 2021[50]). While there is no international benchmark to gauge alcohol consumption, in 2013, countries worldwide have agreed nine voluntary global NCD targets, among which one aims to achieve at least a 10% reduction in the harmful use of alcohol by 2025 against a baseline in 2010. Applying this 10% reduction to alcohol consumption set the target for 2030 at 8.5 litres of pure alcohol per person and per year. Using this benchmark, 23 OECD countries are considered close to target (i.e. consumption is lower than 10 L per capita), while Latvia is the only country considered to be far from the target, with an average annual alcohol consumption of 12.9 litres of pure alcohol per person in 2019. Over the past two decades, average alcohol consumption has been declining in 23 OECD countries, but only 10 of them are progressing fast enough to reach the target by 2030.
Note that data on alcohol consumption per capita help to assess long-term trends but do not identify the risk from harmful drinking patterns, which account for an important share of the burden of disease (OECD, 2019[48]). Alcohol use disorders are of particular concern: more than one in ten adults suffer from disorders attributable to the consumption of alcohol in 12 OECD countries, particularly in Latvia (16%) and Hungary (21%). While substance abuse goes beyond alcohol (for instance, the global indicator framework aims at including coverage of treatment interventions for substance abuse), available data prevent a comprehensive assessment.
All OECD countries (except Colombia) experienced fewer deaths from road traffic accidents over the past two decades, but very few would have managed to halve the 2015 ensuing death rate by the end of 2020, as per Target 3.6 (Figure 2.9, panel B).30 While the available data on death rates due to road traffic injuries do not cover 2020 yet, 2019 data suggest that the United Kingdom, Switzerland, Norway, Iceland and Sweden are the only countries that may reach that target.
Target 3.7 focuses on access to sexual and reproductive health care, but available data only allow tracking the adolescent fertility rate. Adolescent fertility rates have been declining in almost all OECD countries. While the 2030 Agenda does not set any numerical target, this rate is benchmarked against the distribution of OECD outcomes in 2015.31 This implies that the target is set at 3 per 1 000, and the distance to target is considered to be long when this rate exceeds 27 per 1 000. In 2018, very few OECD countries (Mexico, Chile, Costa Rica and Colombia) showed high adolescent fertility rates relative to those standards. Figure 2.9, panel B, shows that over the past two decades, adolescent fertility rates declined in all countries (i.e. progressing towards the target) with the exception of only four countries (the Slovak Republic, Mexico, Hungary and Czech Republic).
Despite high coverage rates for core services in all OECD countries, barriers to access to health care persist (Target 3.8). In the global indicator framework, the coverage of essential health services is the first measure proposed to monitor access to universal health care. Most OECD countries have universal (or near-universal) coverage for a core set of health services, but while the share of a population covered offers an initial assessment of access to care, it is only a partial measure of accessibility and coverage. The notion of universal health coverage also depends on the range of services covered and the actual provision of such services (OECD, 2019[48]). Yet, these additional factors are not covered by the measure included in the global indicator framework. For global monitoring, the IAEG-SDGs proposed to use the Universal Health Service Coverage Index. This measure of service coverage (defined as people receiving the service they need)32 shows that, despite constant progress in all OECD countries, none have yet been able to reach top scores, nor are they expected to meet them by 2030 (operationalised at 97%). In addition, barriers to access persist, particularly amongst the less well-off (OECD, 2019[48]). The second measure proposed in the global indicator framework is the proportion of population with large shares of household expenditures on health. On average, health expenditures exceed 10% of total household expenditures for around 8% of OECD residents. For the latest year available,33 this share exceeds 10% of the population in Belgium, Estonia, Poland and Chile and is above 15% in Latvia, Greece, Portugal, Switzerland and Korea.
Overall, while mortality attributed to unsafe water is not an issue for OECD countries, air pollution is a major cause of death, and its impact is likely to be even greater in the future. Target 3.9 aims at reducing the number of deaths due to pollution and contamination. For global monitoring of Target 3.9, the IAEG-SDGs proposes three measures: mortality rate attributed to household and ambient air pollution; mortality rate attributed to unsafe water, unsafe sanitation and lack of hygiene; and mortality rate attributed to unintentional poisoning.34 In 2016, among OECD countries, mortality rates from unsafe water were on average close to 0, but ambient (outdoor) and household (indoor) air pollution caused about 40 deaths per 100 000 people (crude death rate). On the latter, distances are short (i.e. less than 9 deaths per 100 000) in Sweden, Canada, Finland, New Zealand, Australia and Iceland, but longer (above 20 deaths) in 15 OECD countries and above 30 deaths in Lithuania, the Slovak Republic, Mexico, Colombia, Poland, Hungary, Latvia and Turkey. While the data included in this report do not allow to track progress for premature deaths from exposure to ambient air pollution over time, projections suggest that by 2060 outdoor air pollution may cause 6 to 9 million premature deaths a year worldwide and cost 1% of global GDP as a result of sick days, medical bills and reduced agricultural output (OECD, 2015[51]). Target 3.9 also includes deaths from accidental poisoning. In this area, results are mixed. Deaths from accidental poisoning are on average rather low (at 4 per 100 000 in 2018), and more than half of OECD countries are likely to maintain low death rates or even reduce them. Yet, four OECD members report more than 9 deaths per 100 000 population (Canada, the United States, Estonia and Finland), and 19 of them did not achieve any progress towards the eradication of deaths from poisoning in the recent past. In many of these countries, deaths from accidental poisoning have been driven by overdoses from opioids (OECD, 2019[52]).
Whilst smoking rates are declining in most countries, too many OECD adults still smoke every day. Target 3.a, which refers to “strengthening the implementation of the World Health Organization Framework Convention on Tobacco Control”, is to be monitored by the prevalence of current tobacco use. With more than one in ten adults smoking daily, most recent data (2018 or latest) suggest that distances to target are long in all OECD countries except Costa Rica, Mexico, Iceland and Norway. Smoking rates even exceed twice this rate in Latvia, France, Switzerland, Hungary, Greece and Turkey (Figure 2.8). Daily smoking rates have decreased in most OECD countries over the last two decades, but the current pace of progress will not allow eradicating tobacco use by 2030. Using OECD data, the only country that is expected to meet the target is Costa Rica, where only 4% of the adult population were smoking every day in 2018.35 Overall, smoking rates have not declined significantly in five OECD countries (including France, Portugal, Austria, Turkey and the Slovak Republic) in at least one of the data sources.
Note: Around 2002 refers to 1998 for Denmark; 1999 for Costa Rica and Germany; 2000 for Mexico, Sweden, the United States, the Netherlands, the United Kingdom, Israel, Japan, Italy, France, Greece and Hungary; 2002 for Ireland, Estonia, the Czech Republic and Switzerland; 2003 for the Slovak Republic, Chile and Turkey; 2005 for Lithuania; 2006 for Portugal and Australia; 2008 for Colombia and Latvia; and 2001 for otherwise. Around 2019 refers to 2013 for Colombia; 2016 for Chile; 2017 for Denmark, Germany, Mexico and Switzerland; 2018 for Costa Rica and Belgium; 2020 for Iceland, Norway, New Zealand, Finland, Luxembourg, Spain and Estonia; and 2019 for otherwise.
Source: OECD (2021[53]), "Daily smokers" (indicator), https://doi.org/10.1787/1ff488c2-en (accessed on 29 October 2021).
Vaccination levels are high in all OECD countries, but some have experienced significant reductions over the last decade. Target 3.b aims at supporting research and development of vaccines and medicines and providing access to them. As such, this target includes three types of indicators: the proportion of the target population covered by vaccines, ODA to medical research and basic health sectors, and proportion of health facilities that have a core set of essential medicines available. Based on 2019 data, most OECD countries comply with the WHO recommendation of vaccinating more than 90% of the target population against DTP (36 OECD countries), measles (36) or pneumococcus (33). Immunisation rates are, however, much lower for human papillomavirus, and distances are considered to be short in only eleven OECD members (i.e. more than 78% of the population is vaccinated). However, over the last decade, vaccination rates did not progress or have fallen in around one-third of OECD countries. As discussed in OECD (2019[48]), eroding public confidence in the safety and efficacy of vaccination, despite the lack of scientific evidence to support this loss of confidence, may have played a role in declining coverage in some countries.
Beyond vaccination, Target 3.b also aims at boosting development assistance to poorer countries for medical research, but, as detailed in previous sections, while there is a clear international benchmark for total ODA provided by donor countries, the ideal sectoral breakdown of this aid depends on the needs of each recipient and the priorities of each donor. OECD data nonetheless show that ODA for basic health has increased significantly over the past decade (with more than half of the total coming from the Global Fund, the Bill and Melinda Gates Foundation and the United States government). Finally, Target 3.b aims at fostering the creation of health facilities that offer a core set of essential medicines at affordable prices, but the lack of data prevents assessing this dimension of the target.
Target 3.c focuses on increasing the health workforce and is monitored through indicators on the number of health workers per 10 000 population (including dentists, nurses, midwives, pharmacists and physicians). These indicators are considered as contextual and therefore are not included in the measure of performance. Some OECD reports (e.g. (OECD, 2019[48]) provide background information on current levels and trends in the health and social care sector. They show that, in OECD countries, health and social systems employ more workers now than at any other time in history (about one in every ten jobs is found in health or social care).
Overall, performance under the International Health Regulations (IHR) is very unequal among OECD countries. Target 3.d aims at strengthening the capacity for “early warning, risk reduction and management of national and global health risks”. A country’s progress in this area is measured through two sets of indicators: International Health Regulations capacity and health emergency preparedness, and measures of antimicrobial-resistant organisms. Yet, available data only allows assessing the first segment of the target. While disease outbreaks and other acute public health risks are often unpredictable and require a range of responses, IHR provide a legal framework defining people’s rights and governments’ obligations when handling public health events and emergencies. This legally binding instrument is used to monitor progress towards Target 3.d on preparedness for health emergencies. The indicator is defined as the percentage of attributes of core capacities,36 with 100% as the implicit target (operationalised at 97%). Based on 2020 observations, performance on this indicator is diverse among OECD countries, with three groups of similar sizes: 11 countries are at a short distance from the target (i.e. more than 91% of the core capacities has been attained), 15 countries are at a medium distance, and 12 are considered to be at a long distance (i.e. attainment of less than 78%). Current trends show that while most OECD countries have been making progress at a pace that would allow them to reach 97% coverage by 2030, six are progressing at an insufficient pace, and nine do not show any progress towards the target level.37
Summing up
Prior to the COVID-19 pandemic, while most OECD countries made significant progress in many areas of health, the pace of progress has been insufficient to meet all Goal 3 targets (Figure 2.9). Before the pandemic hit, countries were closest to meeting the targets relating to reproductive, maternal and child health, with virtually all OECD countries achieving very low maternal and infant mortality rates and most on a decreasing trend for adolescent fertility (Targets 3.1, 3.2 and 3.7). However, most OECD countries also experienced difficulties in the other areas covered by Goal 3. For instance, despite significant progress over the last two decades, unhealthy behaviours (Targets 3.5 and 3.a) and poor environmental conditions (Target 3.9) have been fuelling premature mortality (Target 3.4). While most OECD countries made significant progress towards Target 3.3 on ending the epidemics of AIDS and tuberculosis and reducing hepatitis B, the COVID-19 pandemic has been a painful reminder that communicable diseases may pose unpredictable challenges. As OECD countries confront lower public confidence in the safety and efficacy of vaccines and the spread of antibiotic-resistant infections, it remains more important than ever to build inclusive and effective health-care systems. While the majority of OECD countries have universal or near-universal coverage for a core set of essential health services, providing universal health coverage also depends on the range of services covered and the degree of cost-sharing for these. Some issues persist on these fronts, and no OECD country is expected to achieve true universal coverage by 2030 (Target 3.8).
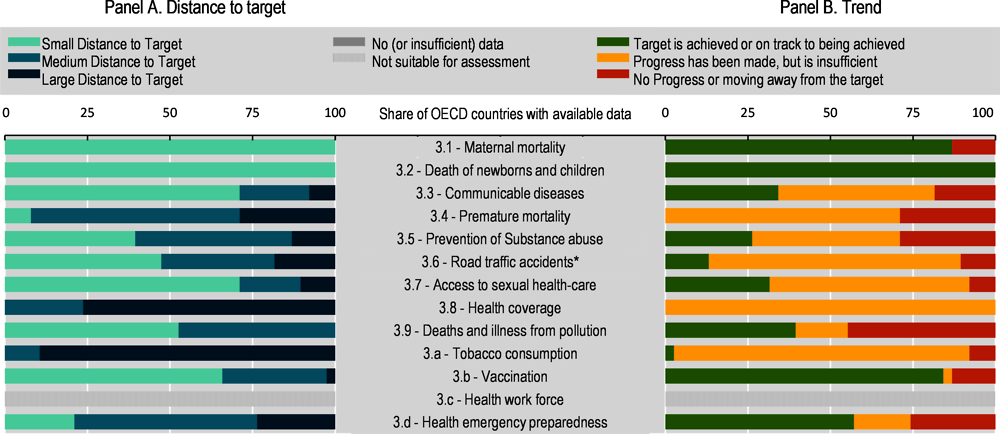
Note: * refers to targets with a 2020 deadline. Panel A shows the distribution of OECD countries in terms of the distance that they need to travel to reach each SDG target. Distances are measured in standardised units (s.u.) – see the methodological annex for details. Countries’ distances, based on the level of the indicators in the most recent available observation, have been grouped into three clusters: small distances (i.e. less than 0.5 s.u.), shown in light blue; medium distances (from more than 0.5 s.u. to 1.5 s.u.), shown in medium blue; and large distances (i.e. more than 1.5 s.u.), shown in dark blue. Panel B shows the distribution of OECD countries in terms of the recent changes in their indicators for each target. Countries’ progress, based on changes in the indicators over recent years, are grouped into three clusters: those whose recent pace of progress should be sufficient to meet the target by 2030, shown in green; those whose recent progress should be insufficient to meet the target by 2030, shown in orange; and those whose recent performance has been stagnating or moving further away from the 2030 target, shown in red – see the methodological annex for details.
Source: All data is taken and adapted from (UNDESA, 2021[3]), SDG Global Database, https://unstats.un.org/sdgs/unsdg and (OECD, 2021[4]), OECD.Stat, https://stats.oecd.org/ (accessed on 29 October 2021).
Impact of the COVID-19 pandemic on Goal 3
While no reductions of child mortality (Target 3.2) have been reported so far, several studies reported significant declines of preterm births (the leading cause of child mortality) occurring during lockdowns. These declines were observed in many different countries, including Israel, Italy, Denmark, Ireland, the United States and Japan (Philip et al., 2020[54]; Been et al., 2020[55]; Meyer et al., 2021[56]; De Curtis, Villani and Polo, 2020[57]; Maeda et al., 2020[58]; Hedermann et al., 2020[59]). Some of these studies also reported significant reductions in the numbers of admissions to neonatal intensive care units. The reasons for these declines are unclear. However, the COVID-19 lockdown has drastically changed our lives by changing our working environment (including commuting), reducing physical interactions and increasing our focus on hygiene. This unusual situation is likely to have influenced several risk factors for premature birth.
COVID-19 is a communicable disease and, as such, it has a direct impact on the achievement of Target 3.3. More broadly, by disrupting the continuity of care, the COVID-19 pandemic also had a knock-on effect on the diagnosis, treatment and prevention of both communicable (Target 3.3) and non-communicable (Target 3.4) diseases (Table 2.6). First, to absorb the pressure put on health systems and to handle the influx of patients during the pandemic, routine and non-emergency medical care was temporarily interrupted in many countries (OECD, 2021[60]). In addition, early surveys suggested that patients had been delaying or even avoiding essential care out of fear of contracting the virus or concern about overstressing the health-care systems (American College of Emergency Physicians, 2020[61]; Lazzerini et al., 2020[62]; Van Mol et al., 2020[63]). These two factors led to significant delays in or even avoidance of medical treatments, which might have increased the morbidity and mortality risk associated with treatable and preventable health conditions, thereby contributing to excess deaths in the short, medium and long-term. In addition, some evidence suggests that unhealthy lifestyles and increased anxiety associated with the lockdowns may have long-term effects on cardiovascular disease (Mattioli et al., 2020[64]). Conversely, protective measures put in place during the crisis led to fewer fatalities from other communicable illnesses, such as seasonal flu (Jones, 2020[65]). In addition, although in the early periods of the pandemic suicide rates were expected to increase due to a decline in the population’s mental health, a deepening economic crisis and lack of access to mental health services, data from 2020 and 2021 do not show any considerable change compared to previous years (OECD, 2021[16]).
The anxiety induced by the pandemic and its aftermath is nevertheless likely to impact significantly on the consumption of addictive substances (Targets 3.5 and 3.a). The potential effects of stress and isolation on alcohol misuse (Target 3.5), tobacco consumption (Target 3.a), substance abuse and other addictions has been largely documented (Dubey et al., 2020[66]). The COVID-19 pandemic and its associated government measures to limit mobility have impacted pre-pandemic patterns and sites of alcohol consumption (OECD, 2021[67]). Some of the problems associated with harmful alcohol consumption were intensified by the crisis, such as engaging in harmful drinking to cope with stress or domestic violence (OECD, 2021[67]). Looking at preliminary data on government tax receipts, alcohol sales rose by 3% to 5% in Germany, the United Kingdom and the United States in 2020 compared to 2019 (OECD, 2021[67]). Early evidence based on household final consumption expenditure (System of National Accounts) suggests a significant increase in the aggregate, “Alcoholic beverages, tobacco and narcotics”. Focusing on the different items separately suggests that most of this surge is led by a rise in the consumption of alcoholic beverages (while the decrease in the consumption of tobacco seems to be milder than it used to be in many countries, suggesting that either fewer smokers than usual quit tobacco in 2020 or that those who did not quit smoked more).
The substantial drops in mobility observed during lockdowns resulted in large decreases in road accidents (Target 3.6). The most recent data collected by the International Transport Forum (ITF, 2020[68]) show significant reductions in the number of road fatalities during the first few months of 2020.38 However, ITF (2020[68]) also highlights that that the number of road deaths has not fallen in proportion to the decrease in traffic. Furthermore, country evidence (e.g. France (ONISR, 2020[69])) suggests an increase in motor vehicles’ average speed and in the severity of road accidents. Fewer road fatalities reflect, however, the strict containment measures and are not likely to last as more cars come back on the road and economic activity resumes.
The disruption of health services induced by the COVID-19 crisis may have short-term effects on access to reproductive health care (Target 3.7) and vaccinations (Target 3.b). Stringent and lengthy lockdown measures adopted to avoid health systems being overwhelmed have resulted in significant disruption of essential services. Based on a survey conducted among 105 countries at various levels of development from different world regions, WHO (2020[70]) suggested that routine immunisation services and family planning and contraception services had been among the most impacted.
The confinement measures put in place to reduce the spread of the virus led to temporary reductions of air pollution in the early periods of the pandemic (Target 3.9), largely due to reduced traffic and other activities. Reviewing 11 studies from EU and non-EU countries, Brunekreef et al. (2021[71]) concluded that reductions in air pollution related to COVID-19 lockdowns were most pronounced for traffic-related pollutants. The concentration of nitrogen dioxide (NO2) resulting from road transport decreased by 30% to 50% during lockdowns in Europe, while reductions in concentrations of particulate matter (PM2.5 and PM10), mostly from residential heating, agriculture and industry, was much less pronounced.39 Although air quality levels have now returned to pre-lockdown levels in many parts of the world, this period revealed some of the beneficial health impacts that could be achieved from a lasting and sustainable reduction in air pollution (Giani et al., 2020[72]; Venter et al., 2020[73]).
While there is no evidence yet that the COVID-19 pandemic will affect global health preparedness in the long run (Jacobsen, 2020[74]), and despite the fact that many countries were unprepared for COVID-19, even those with high IHR scores, control of public health risks, including infectious disease outbreaks, is at the heart of the 2030 Agenda. In particular, Target 3.d directly aims at “strengthening the capacity for early warning, risk reduction and management of national and global health risks”. Still, as highlighted by the OECD (2021[39]), the pandemic revealed that preventive and curative health-care systems were not ready to absorb such a shock: “pandemic preparedness needs improvement, and the distribution of medical equipment and drugs needs better co-ordination”.
Goal 4 is the education goal. It calls countries to “ensure inclusive and equitable quality education and promote lifelong learning opportunities for all”. Despite some variation among OECD countries, school enrolment and attendance – from pre-primary schools to upper secondary education – are high, and an increasing share of adults has access to education and training opportunities. However, the achievement of Goal 4 by 2030 is not assured in OECD countries, as too many children, youth and adults currently lack the basic skills needed to become engaged citizens and live better lives. Inequities in education start early in life and tend to accumulate owing to a number of different factors, including socio-economic background, gender and geographic location.
Education has been much affected by the COVID-19 crisis. The lockdowns have interrupted education at all levels, with nationwide closures of schools, universities and training facilities in most OECD countries. While education systems in OECD countries have made important efforts to maintain learning continuity during this period, especially through remote learning using digital technology, children and students have had to rely more on their own resources to continue learning remotely. However, some programmes such as vocational education and training are less suited to remote delivery. Not only is work-based learning difficult to replicate in a virtual setting, but a number of employers have also cut back in providing apprenticeships due to confinement measures and economic slowdowns. Moreover, among more disadvantaged students lower connectivity and access to digital materials, and a less quiet learning environment at home risk impeding learning.
Assessing OECD countries’ performance on Goal 4
This report uses data from the SDG global Database together with OECD sources. Yet, the starting point always remains the global indicator framework, curated by the IAEG-SDGs. Table 2.7 shows that data allow the monitoring of nine of the ten targets underpinning Goal 4, but only four of them can be assessed over time. For this goal, seven indicators sourced from the OECD complement the SDG Global Database. In most cases, they align with the global indicator framework.40 Yet, drawing from OECD databases allows increasing country coverage (e.g. 4.2.2) or meeting higher statistical standards by preserving a strict comparability.41 In other cases, a proxy measure from OECD sources is included in order to allow monitoring the target, while the available data in the SDG Global Database cover only a few OECD countries.42 On top of the indicators listed in the table below, the database includes one extra data series for Target 3.a, but it is considered to be mainly informative in the context of Goal 4 (details and data for all indicators are available at http://www.oecd.org/wise/the-short-and-winding-road-to-2030-data-chapter-2-people.xlsx).
Recent trends in educational attainment and achievement in OECD countries are remarkably stable, meaning that, on current trends, Target 4.1 will be missed in 2030. Target 4.1 seeks to ensure that all students achieve a basic standard of learning while they are in school. The target encompasses both the quantity of schooling (through completion rates) and its quality (through measures of students’ proficiency in reading and mathematics). While school completion rates are high on average, many young people still leave school without meeting the minimum proficiency levels in reading and mathematics, and the situation was not improving even before the COVID-19 pandemic hit. In 2014, on average among OECD countries, more than 95% of children complete lower secondary. 22 OECD countries have already achieved universal completion rates43 for lower secondary education, and four additional countries are within a short distance of the target. Yet, two countries, Colombia and Costa Rica, remain far from the target with more than one in four children leaving school before completing lower secondary. In addition, on average one in five children in OECD countries still does not complete upper secondary education, and nine OECD countries are considered to be far from the target, with completion rates below 78% (down to less than 60% in Turkey, Costa Rica and Mexico).
Beyond school completion, Target 4.1 is also monitored through measures of students’ proficiency in reading and mathematics at different stages of schooling (operationalised at 97% of students meeting the minimum proficiency requirements). In 2018 (or latest available year), at the end of primary schooling and at the end of lower secondary around 25% of students, on average, do not meet the minimum proficiency requirements in mathematics, and in reading around 10% fail to do so at the end of primary but 25% at the end of lower secondary. This rate can rise to 50% or above in some countries, such as Chile, Mexico, Costa Rica and Colombia (Figure 2.10). Recent trends suggest that learning outcomes are stable in most countries, with improvements observed in only a handful of cases – most notably in Poland, Portugal and Turkey – but no OECD country is expected to meet Target 4.1.
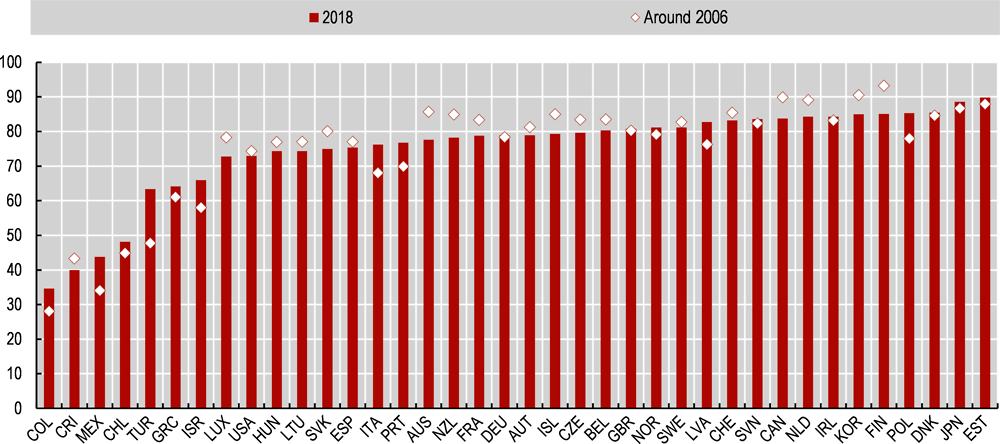
Note: Around 2006 refers to 2006 for Colombia, Chile, Israel, Lithuania, the United Kingdom, Slovenia and Estonia; 2009 for Costa Rica; and 2003 for otherwise.
Source: OECD, PISA 2018 Database, https://www.oecd.org/pisa/data/2018database/ (accessed on 29 October 2021).
Target 4.2 seeks to ensure that all children benefit from quality early childhood education and care (ECEC). Available measures show high levels of access to quality ECEC in most OECD countries. The SDG global indicators on early childhood education refer to the proportion of children under age 5 who are “developmentally on track in health, learning and psychosocial well-being”. This is a complex outcome, for which a methodology was approved only recently by the Inter-Agency and Expert Group on SDG Indicators (which includes the OECD as an observer). Until the new methodology is more widely adopted, Target 4.2 focuses only on access to quality early childhood care and education as measured by the participation rate in organised learning (one year before the official primary entry age), with the target level set at 97%. This report includes data from both the SDG Global Database and OECD. However, while the two sources are almost perfectly aligned,44 this report only discusses estimates based on OECD data sources, as the country coverage is broader. In 2018, on average across OECD countries, 96% of children one year younger than the official primary school entry age were enrolled in ECEC. Some countries, including Australia, the Slovak Republic and Turkey, are still far from universal coverage, with more than one child in ten not being enrolled in these countries. While most OECD countries are expected to progress towards (or remain at) very high rates, nine countries do not show any progress in ECEC enrolment (and some of them, such as the Slovak Republic, the United States, Japan, Hungary and the Czech Republic, even show declines).
Beyond upper secondary education, lifelong learning has become more widespread, but large disparities among OECD countries remain in this area. Target 4.3 on quality Technical and Vocational Education and Training (TVET) and tertiary education recognises the many alternative paths through which young people and adults can acquire the necessary skills to ease their transition into the labour market, become engaged citizens and live better lives.45 To monitor Target 4.3, the measure proposed by the IAEG-SDGs is the participation rate of youth and adults in formal and non-formal education and training in the previous 12 months. In this report, the target level is operationalised at 64% relative to the best performances observed in 2016 among OECD countries (Switzerland, the Netherlands, New Zealand and Sweden). On average, around half of youth and adults in OECD countries engaged in formal or non-formal education and training in the previous 12 months (whether for work or non-work purposes), but large country disparities exist. Based on rates observed in 2015, eight countries (Sweden, Switzerland, New Zealand, the Netherlands, Norway, Austria, Canada and the United States) can be considered as having a large share of participation in formal and non-formal education – i.e. more than 57% of youth and adults. Conversely, in Lithuania, Poland, Ireland, Turkey and Greece, less than 30% of adults were engaged in education and training. On average, the number of students pursuing tertiary education has grown continuously over the past two decades, and it is expected to continue growing through to 2030 (OECD, 2018[75]), but progress is uneven; while 11 OECD countries are progressing or record high participation rates, 13 are stable at lower levels or are declining.
Information and communications technology skills vary greatly between OECD countries. Target 4.4 aims to increase the number of youth and adults with the necessary skills to thrive in the labour market. Since in today’s increasingly digitalised economies, literacy and numeracy skills may not be sufficient to thrive in the labour market, Target 4.4 includes measures of skills in information and communications technology (ICT). ICT skills refer to nine computer-related activities with varying levels of difficulty, from transferring files between a computer and other devices to writing a computer programme using a specialised programming language. These skills are benchmarked against the best performance observed in 2015 among OECD countries, with performance varying largely across countries and skills.46 For example, while on average, over 50% of adults over the age of 15 are able to transfer files between a computer and other devices, less than 10% them are able to use specialised programming language. Overall, four OECD countries (Iceland, Denmark, Norway and Luxembourg) are among the top performers on all ICT skills, while four of them (Italy, Poland, Turkey and Colombia) show relatively poor outcomes in all areas where data is available. Around three out of five OECD countries are considered to be within short or medium distances to target levels of ICT skills, and none are expected to fully meet these targets by 2030.
Differences in gender, socio-economic background and location explain a significant share of the differences in education outcomes. Leaving no one behind is one of the key principles of Agenda 2030. Target 4.5 calls for eliminating gender disparities in education and ensuring equal access to all levels of education and vocational training for vulnerable persons. The Goal 4 monitoring framework allows the disaggregation of education indicators by individual characteristics in many different areas. The high-level picture presented here relies on 44 different data series and includes parity indices (by socio-economic, gender, location and migration status) for different levels of education (pre-primary school, primary school, lower secondary, upper secondary as well as the training of youths and adults). By construction, the target levels were set to 1 (i.e. full parity). The richness of evidence provided by parity indices presented by the OECD (2018[75]; 2021[76]) shows that the performance of 15-year-olds is strongly associated with the location of their school (in rural or urban areas) and with their socio-economic background and migrant status. The socio-economic status of students also influences their participation in early childhood education, as well as in vocational and technical education.47 Figure 2.11 shows that, in 2018, no OECD country was able to prevent socio-economic inequalities from affecting education outcomes. The impact of the financial, social, cultural and human capital resources available to students appears to be lowest in Japan and Estonia, while it is highest in Mexico, Chile, Costa Rica and Colombia. No OECD country has been able to reach the short distance to the targets for all the indicators included in this report. Still, the impact of inequality on education differs substantially among countries, with Canada, Estonia and Ireland being the countries reporting the lowest impact, while Chile, Japan, Costa Rica, Mexico, Turkey and Colombia show the highest impact. Trends differ among countries and indicators but, as confirmed by more specific analysis, in a vast majority of cases, besides gender inequality, inequalities have not decreased in the last decade (OECD, 2018[75]; OECD, 2021[76]).
Note: Around 2006 refers to 2006 for Colombia, Chile, Israel, Lithuania, the United Kingdom, Slovenia, Estonia and Costa Rica and 2003 for otherwise.
Source: OECD, PISA 2018 Database, https://www.oecd.org/pisa/data/2018database/ (accessed on 29 October 2021).
Low-skilled adults make up a significant share of the population in most OECD countries. Target 4.6 aims at ensuring that most adults achieve literacy and numeracy proficiency (operationalised at 97% of the adult population being above the minimum proficiency level in literacy or numeracy). Using data from 2013, only two OECD countries can be considered to be at a short distance to target on at least one indicator: Colombia, where more than 90% of adults can be considered as having high skills in literacy,48 and Japan, where more than 90% of adults meet the minimum proficiency level in both literacy and numeracy. Conversely, the distance to target is long in around half of OECD countries in numeracy and in one-third of them in literacy (i.e. more than 20% of the adult population is below the minimum proficiency level). In Chile, Mexico and Turkey, this rate exceeds 45% in both dimensions. The available data does not allow to monitor progress over time.
Despite the paucity of data, early estimates suggest a great diversity of outcomes among OECD countries when it comes to education to promote sustainable development. As emphasised in the 2030 Agenda, education is also key in ensuring that youth become engaged citizens and participate in society. In particular, Target 4.7 aims at “ensuring that all learners acquire the knowledge and skills needed to promote sustainable development, including, among others, through education for sustainable development and sustainable lifestyles, human rights, gender equality, promotion of a culture of peace and non-violence, global citizenship, and appreciation of cultural diversity and of culture’s contribution to sustainable development”. Indicator 4.7.1 measures the extent to which i) global citizenship education and ii) education for sustainable development, including gender equality and human rights, are mainstreamed at all levels in: a) national education policies, b) curricula, c) teacher education and d) student assessment, for which the target levels are 1 (i.e. fully mainstreamed). Following the Global indicator framework for the Sustainable Development Goals and targets of the 2030 Agenda for Sustainable Development, this indicator is repeated under Targets 12.8 and 13.1. Technical work led by the UNESCO Institute for Statistics (UIS) and supported by the OECD is underway to produce instruments for measuring this indicator. Early results suggest that in 2020, among the 24 OECD countries for which some data is available, a few such as France, Spain, Germany and Latvia are already mainstreaming global citizenship education and education for sustainable development in at least three of the measured areas. Conversely, some countries such as Canada, Austria, Denmark, the Slovak Republic, the Czech Republic, the United Kingdom and New Zealand seem to be much further from achieving Target 4.7. Yet, the limited data availability and the stark differences among the different domains may nuance this assessment. For instance, while 13 OECD countries can be considered as close to target when focusing on national education policies, the same is true for six countries on teacher education and only one (France) for curricula.
Target 4.a addresses the need for adequate physical infrastructure and safe, inclusive environments that nurture learning for all, regardless of a person’s background or disability status. It is monitored through the proportions of schools offering different types of basic services.49 All schools in most OECD countries offer basic facilities to support teaching and learning, including electricity, safe drinking water and sanitation facilities. In addition, with a few exceptions (mainly in Colombia, Costa Rica, Italy, Israel and Mexico), almost all students in OECD countries have access to computers and the Internet at school. Available measures, however, do not provide information on how often computers are used or made available to students or on how well technology is integrated into learning practices.
The distance to target is not assessed for Target 4.b on education scholarships available to developing countries. Beyond measures of learning outcomes, ensuring equitable participation and skills acquisition relies on the availability of resources. Target 4.b aims to measure the extent to which international education assistance is targeted to the countries that are most in need. To monitor Target 4.b, the indicator proposed by the global indicator framework is the volume of ODA flows for scholarships by sector and type of study. As detailed for other aid-related indicators, such measures are not assessed in this report. Unlike total ODA, which has a clear international benchmark, the sectoral breakdown of aid depends on many contextual factors. Still, it provides useful information, and it is discussed extensively in OECD reports (OECD, 2018[75]). Official development assistance for scholarships is concentrated among five donor countries and institutions (France, Japan, EU institutions, Saudi Arabia and Turkey), which provided more than half of the total in 2019.
Despite some differences between OECD countries, most teachers benefit from regular training. Target 4.c aims at increasing the supply of qualified teachers. It is to be measured through the proportion of teachers with the minimum required qualifications. Still, few OECD countries are covered by the data series available in the SDG Global Database. Therefore, the assessment for Target 4.c relies on OECD sources to measure the proportion of teachers who received in-service training in the last 12 months (operationalised at 97%). Teachers are often at the centre of initiatives to improve the quality of education, as their work shapes the quality of instruction and student learning outcomes (Ainley and Carstens, 2018[77]). Continuous professional development (CPD) is a vital element of teachers’ career path, providing training that can affect both classroom and school practice, and it is a key component of Target 4.c. Overall, the OECD Teaching and Learning International Survey (TALIS) showed that in 2018 participation in some kind of in-service training was commonplace among teachers in all OECD countries, with more than 90% of teachers and principals attending at least one continuous professional development activity in the year prior to the survey. Five countries (France, Chile, Portugal, Japan and Mexico) nonetheless report lower shares of teachers participating in CPD, although still with levels of participation above 80%.
Summing up
While inclusive and equitable quality education is key to achieve sustainable development, no OECD country is expected to meet all the targets relating to Goal 4 on quality education by 2030. Even prior to the pandemic, most OECD countries were showing no progress towards or were even moving away from most of the education targets. Target 4.2 on access to early childhood education and care was the only exception, with the majority of countries expected to meet this target (Figure 2.12, panel B). While school enrolment and completion rates are high on average, no OECD country is close to achieving the relevant learning outcomes and too many young people cannot meet the minimum proficiency levels in reading and mathematics (Target 4.1). Worse, inequities in education (Target 4.5) start early in life and tend to accumulate, owing to a number of different factors, including socio-economic background, gender and geographic location, leading to literacy and numeracy skills that are below target levels even among adults in most OECD countries (Target 4.3). Yet, formal and non-formal education and training have become more prevalent in most countries (Target 4.6). Besides literacy and numeracy skills, developing skills in information and communication technology has become indispensable in different aspects of daily life, ranging from the labour market to access to services, and even more so since the onset of the pandemic (see Impact of the COVID-19 pandemic on Goal 4). Still, the majority of young people and adults lack ICT skills in most OECD countries (Target 4.4).

Note: * refers to targets with a 2020 deadline. Panel A shows the distribution of OECD countries in terms of the distance that they need to travel to reach each SDG target. Distances are measured in standardised units (s.u.) – see the methodological annex for details. Countries’ distances, based on the level of the indicators in the most recent available observation, have been grouped into three clusters: small distances (i.e. less than 0.5 s.u.), shown in light blue; medium distances (from more than 0.5 s.u. to 1.5 s.u.), shown in medium blue; and large distances (i.e. more than 1.5 s.u.), shown in dark blue. Panel B shows the distribution of OECD countries in terms of their recent changes in the indicators for each target. Countries’ progress, based on changes in the indicators over recent years, are grouped into three clusters: those whose recent pace of progress should be sufficient to meet the target by 2030, shown in green; those whose recent progress should be insufficient to meet the target by 2030, shown in orange; and those countries whose recent performance has been stagnating or moving further away from the 2030 target, shown in red – see the methodological annex for details. The figure also highlights targets with no data with which to assess either their current distance or their pace of progress (shown in grey). Time series are considered as missing when there are two or fewer data points for each country; indicators are considered as missing when they are unavailable for 20 OECD countries or more, or for less than three world regions – see methodological annex for details.
Source: All data is taken and adapted from (UNDESA, 2021[3]), SDG Global Database, https://unstats.un.org/sdgs/unsdg and (OECD, 2021[4]), OECD.Stat, https://stats.oecd.org/ (accessed on 29 October 2021).
Impact of the COVID-19 pandemic on Goal 4
The unprecedented health crisis that we are experiencing, linked to the rapid spread of COVID-19 throughout the world, is having strong impacts on education systems (Targets 4.1 and 4.2). Schools have had to close for several months in most countries, with school closures representing roughly 28% of total instruction days over a typical academic year at pre-primary and more than 56% at upper secondary level on average across OECD countries (OECD, 2021[78]). Governments have reacted to ensure pedagogical continuity over this period, and distance learning has taken over rather effectively. In many cases, this had to be done immediately. However, this is not necessarily the most appropriate response for the most disadvantaged students who need more individualised support, nor for the less well-off families, who do not necessarily have sufficient equipment or material comfort to provide their children with the conditions they need to follow their courses and not drop out. Preliminary analysis has shown that learning disruptions may have significant repercussions on students’ performances. For instance, the World Bank estimated that learning disruptions could lead to a 25% increase in the share of secondary students performing below PISA level 2 (Azevedo et al., 2020[79]). Other studies estimated that students who missed in-school instruction due to the pandemic are likely to return in autumn 2020 with approximately 63%-68% of the learning gains in reading relative to a typical school year and with 37%-50% of the learning gains in math (Kuhfeld et al., 2020[80]).The UNESCO Institute for Statistics estimates that for Europe and North America, it may take 4 to 10 years to catch up the lost learning resulting from the lockdowns in lower primary, from 6 to 13 years in upper primary and from 6 to 15 years in upper secondary (UIS, 2021[81]).
Access to education and training for adults (Target 4.3) was heavily disrupted in 2020, particularly for vocational education and training programmes (VET) (Table 2.8). Survey data show that all OECD countries had at least partially closed VET institutions during 2020 (OECD, 2021[82]). While the more academic streams have been able to offer more flexible learning options, VET suffered from a double disadvantage. First, although VET institutions also used online platforms during closures, whether they are school-based or combined school- and work-based programmes, practical teaching forms a particularly important part of their curricula, which is difficult to do at a distance (OECD, 2021[82]). Second, the lockdown had serious consequences on the work-based components of those programmes. For example, apprentices who were placed in companies and sectors that have come to a standstill have largely stopped their working activities. Further, with an economic crisis looming, it is also an open question whether companies will wish to continue to take on apprentices when their priority will be to relaunch their businesses (OECD, 2020[83]). In the long run, a reduced availability of work-based learning opportunities for VET students may also lead to fewer students choosing to enrol in VET programmes (OECD, 2021[82]).
The pandemic highlighted even further the key role of ICT skills for adults in a digitalised world (Target 4.4). From school to work, COVID-19 has resulted in a significant expansion of the online environment. The crisis highlighted some of the key barriers to digitalisation, including the prerequisites of adequate digital skills, computer equipment and Internet access to undertake training online and the difficulty of performing traditional work online. Yet the pandemic may also have induced gains in digital skills.
The impact of the crisis on education is far from being even (Target 4.5), with some groups, including girls, ethnic minorities and students with learning disabilities, being much more likely to be affected (Azevedo et al., 2020[79]; Hanushek and Woessmann, 2020[84]). In addition, while on average across OECD countries more than 90% of advantaged students report having a quiet place to study at home and a computer that they can use for schoolwork, only 69% of disadvantaged students have access to such facilities, putting them at greater risk of disengagement (OECD, 2019[85]). In addition, as stressed in (OECD, 2021[86]), parents from disadvantaged backgrounds may face more challenges in supporting their children with schoolwork (e.g. due to time constraints, or lack of familiarity with the learning material).Some studies even suggest that losing ground during the COVID-19 school closures would not be universal, with the top third of students potentially making gains in reading (Kuhfeld et al., 2020[80]).
Governments have reacted quickly to ensure pedagogical continuity during the lockdowns, and distance learning has taken over rather effectively. In many cases, this had to be done immediately and without specific preparation, which also challenged teachers to use new techniques and methods and further highlighted the need for thorough training in this area (Target 4.c) (OECD, 2020[83]). Few countries (Belgium, Colombia, Israel, Finland, Lithuania, Luxembourg and Turkey) have so far provided comparable data on the proportion of primary and secondary teachers with training in ICT tools before and after the onset of the pandemic, with all seven countries showing improvements (OECD, 2021[78]).
Goal 5 aims to “achieve gender equality and empower all women and girls”. It primarily focuses on social norms, equal representation and violence against women. Available data suggest that despite progress, innumerable challenges remain, and women’s rights and opportunities are still limited in both the private and public spheres. In OECD countries, no country has been able to reach the maximum score when it comes to having a legal framework that promotes gender equality, nor has any country reached equal representation at higher levels of decision making in political, economic and public life or been able to close the gender gap in wages and in paid and unpaid work. In addition, while more reliable information is still needed, the evidence already available shows that violence against women remains a serious problem. Progress has been observed in the few areas where data allow tracking progress over time, but to better understand both the magnitude and root causes of gender inequality, more comprehensive and more regular data collections are needed.
The pandemic has affected the levels of women’s paid and unpaid work. As women make up a large share of workers in the sectors defined as essential, including health care and education, they have been facing exceptional work demands (OECD, 2021[24]). Women have also suffered from bigger employment losses and higher unemployment (OECD, 2020[87]). In addition, school closures and home confinement have increased their unpaid work time. The pandemic has, however, had effects on women far beyond time-use. Lockdowns are also likely to have undermined women’s personal safety by exacerbating the problem of domestic violence.
Assessing OECD countries’ performance on Goal 5
This report uses data from the SDG Global Database together with OECD sources. Yet, the starting point always remains the global indicator framework, curated by the IAEG-SDGs. Table 2.9 shows that data allow the monitoring of six of the nine targets underpinning Goal 5 on gender equality, but only two targets can be assessed over time. For this goal, five indicators sourced from the OECD complement the SDG Global Database. In most cases, these align with the global indicator framework, and drawing from OECD databases allows for higher country coverage (5.4.1 and 5.5.2). In other cases (5.3.2 and 5.b.1), although the OECD indicators slightly deviate from the global indicator framework, relying on OECD data sources allows monitoring indicators for which data are not available for enough OECD countries in the SDG Global Database (details and data for all indicators are available at http://www.oecd.org/wise/the-short-and-winding-road-to-2030-data-chapter-2-people.xlsx).
While no OECD country has a comprehensive legal framework to end discrimination against women, some are closer than others. Target 5.1, which is about ending all forms of discrimination against women, is measured through the share of countries having at least minimum laws to promote, enforce and monitor gender equality, hence the natural target is 100% (operationalised at 97%).50 Overall, in 2020, the picture is rather mixed. According to available data, Portugal appears to be the only OECD country that can be considered to be at a short distance to the target on average over the four dimensions of the legal framework, while 19 OECD countries are deemed to be at a medium distance. Conversely, 13 countries are, on average, at a long distance. Among these, Japan, Israel, Chile, the Czech Republic, Hungary and Ireland are not at a short distance in any sub-dimension of the index. Data from the SDG Global Database also allow disentangling the different aspects of the legal frameworks. Overall, OECD countries appear to be closest on the “employment and economic benefits” dimension (92% of laws covered on average), followed by laws on violence against women and on marriage and the family (83% and 84% on average) and furthest on the “overarching legal frameworks and public life” dimension (with 76% of laws on average). Yet, the lack of consistent time series prevents assessing trends.
While more reliable information is needed, the available evidence shows that violence against women remains a serious problem. Violence against women is one of the most widespread, persistent and devastating violations of human rights in the world. Women face risks of violence wherever they go — at home, in public, at work and online. Target 5.2 calls for “eliminating all forms of violence against all women and girls in the public and private spheres, including trafficking and sexual and other types of exploitation”. For global monitoring, the IAEG-SDGs suggested that Target 5.2 would be measured by the proportion of women who experienced violence (whether physical or psychological) by an intimate or non-intimate partner in the previous 12 months. Unfortunately, available data fail to provide a comprehensive assessment. The SDG Global Database includes data only on violence committed by an intimate partner (current or former) over the past 12 months and is restricted to women aged 15-49. In addition, the lack of time series does not allow monitoring trends in violence against women over time. All forms of violence against women are unacceptable, which implies that the ideal target should be set at 0; however, the target level is operationalised (mainly for statistical reasons) at a slightly higher level of 3%. Among the 22 OECD countries for which data are available, in 2018, this rate was at 3% or lower only in Spain, Australia, Iceland, Canada and Switzerland. Conversely, in six countries, including Costa Rica, Korea, Finland, Mexico, Colombia and Turkey, this rate ranges from 7% to 12%. Factors such as inadequate public resources for data collection, shame and fear on behalf of the victim, as well as reluctance to identify and take action against the perpetrators, suggest that the real prevalence is likely to be well above reported levels (Queisser, 2020[88]).51 In addition, special attention needs to be paid to the scope of the indicator. While violence against women may have long-term consequences, it is limited to the previous 12 months, focuses on intimate violence only and is restricted to women aged 15 to 49.
Few OECD countries offer a legal framework that protects women and girls from female genital mutilation. Target 5.3 aims at eliminating harmful practices such as early and forced marriage as well as female genital mutilation (FGM). However, such data are rarely collected in OECD countries (and even when they are, they are not reported in comparable forms). To overcome this issue and provide some elements of understanding, this report relies on a composite measure from the OECD’s Gender, Institutions and Development Database (GID-DB). Yet, while the GID-DB aims at including global data on laws, attitudes and practices related to different areas in which women face discrimination for OECD countries, the available data only allows tracking the legal aspect of FGM, and not attitudes towards FGM nor the actual prevalence among women. The measure ranges from 0, when the legal framework protects women and girls from FGM and when customary, religious and traditional laws or practices do not encourage the practice (0 is thus considered as the target level), to 1 (the legal framework does not at all protect women and girls from FGM). In 2019, the distances were deemed to be short for eight OECD countries, including Australia, Belgium, Sweden, the United States, Austria, Ireland, the United Kingdom and New Zealand. Yet, nine of them (Canada, Germany, the Netherlands, Italy, France, Switzerland, Portugal, Norway and Spain) have scores of 0.25 (some customary, religious and traditional laws or practices encourage the practice, but the law takes precedence over these laws or practices and protects women and girls from FGM). These countries are considered to be at a medium distance to the target. Finally, 21 countries are considered to be far from target, with scores exceeding 0.75 (the legal framework protects women and girls from FGM but does not foresee criminal penalties for all types of practitioners of FGM).
In all OECD countries, women still do the lion’s share of unpaid work. When combining both paid and unpaid work, the very long hours spent in unpaid work (e.g. routine housework, care of children and frail elderly, shopping for household goods and services, travel related to household activities) leave women working longer hours than men in most OECD countries (OECD, 2020[49]). Target 5.4, which is about recognising and valuing unpaid work, is to be monitored by different measures of the allocation of time spent on unpaid domestic and care work by gender. Although the natural target is to have no difference between women and men, target levels for each data series used from the OECD and SDG Global Database have been operationalised at 3 minutes difference per day to allow for measurement errors. These data suggest that most OECD countries can be considered as being at a small to medium distance from target on gender gaps in care work (with the exceptions of Portugal, Costa Rica, Colombia, Chile, Australia and Mexico, where gender gaps are greater than 33 minutes per day52). Cross-country differences are even larger when it comes to domestic chores, with 12 OECD countries reporting gaps exceeding 94 minutes per day. Overall, gender gaps in time spent on unpaid work greatly vary among countries. When different types of activities (such as routine housework, shopping, care work, volunteering, travel related to household activities) are assessed together, no OECD country is close to the target (Figure 2.13). Yet, untimely data (for 5 OECD countries, the latest year available date back to 2005 or earlier, for instance) and the lack of consistent time series block an understanding of the evolution of unpaid work in most countries (OECD, 2021[89]).
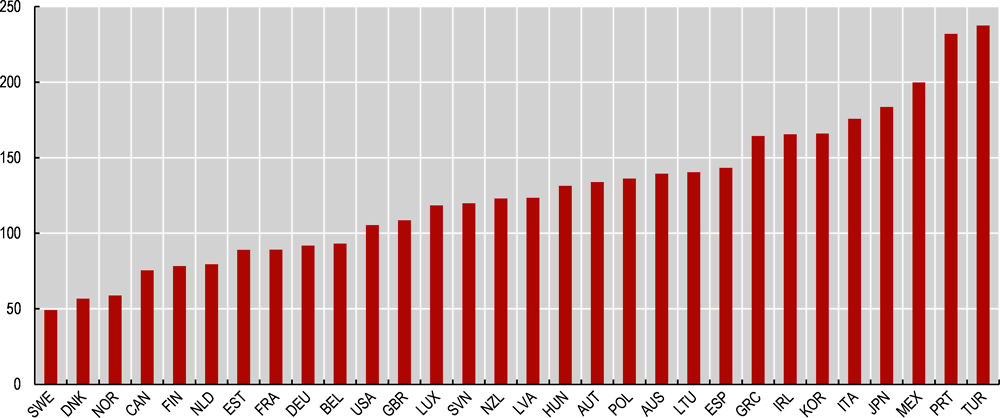
Note: Data are observed in 1999 for Portugal, 2001 for Denmark and Slovenia; 2003 for Latvia and Lithuania; 2005 for Ireland; 2006 for Australia; 2009 for Austria; 2011 for Norway; 2013 for Germany, Belgium, Luxembourg, Poland and Greece; 2014 for Korea, Italy and Mexico; 2015 for Canada, the United Kingdom and Turkey; 2016 for the Netherlands, Japan and the United States; and 2010 for otherwise.
Source: OECD, Time Use Database, https://stats.oecd.org/Index.aspx?DataSetCode=TIME_USE (accessed on 29 October 2021).
Despite progress, particularly in the political sphere, women remain under-represented in public decision making. Target 5.5 aims to “ensure women’s full and effective participation and equal opportunities for leadership at all levels of decision making in political, economic and public life”. To monitor Target 5.5, the IAEG-SDGs proposes two indicators. The first indicator focuses on the proportion of seats held by women in i) national parliaments and ii) local governments (operationalised at 50%, i.e. equal representation). As highlighted by the OECD (2021[90]), in 2021, women’s participation in the lower/single house of parliaments across OECD countries averaged at 32%. The level is considered at a short distance to the target (i.e. over 45%) in Costa Rica, Finland, Mexico, New Zealand and Sweden and at a large distance (i.e. less than 35%) in the majority of OECD countries. Distances are particularly large in Hungary and Japan, with less than 15% women’s participation in parliament. Despite an overall positive trend in women representatives in national parliaments, ensuring a balance in women’s representation in political decision making requires stronger action. In some countries (including in Germany, Iceland and Slovenia), the share of women in parliament has been falling (OECD, 2021[90]). The IAEG-SDGs’ second indicator focuses on the economic sphere and the proportion of women in managerial positions, where women also appear to be under-represented. In 2019, three out of five OECD countries are at a medium to large distance to the target when it comes to closing the gender gap in managerial positions (target level set at 1, i.e. equal shares of men and women in managerial positions). The gap is highest in Japan and Korea. While there are signs of improvement, a glass ceiling continues to prevent women’s full and effective participation.
The available data does not allow covering Target 5.6 on access to reproductive health. While measures do exist concerning the extent to which countries have laws and regulations that guarantee full and equal access to women and men to sexual and reproductive health care, information and education, these do not cover enough OECD countries to be included in this report. The IAEG-SDGs also suggests monitoring Target 5.6 through data on the share of women who make informed decisions regarding sexual relations, contraceptive use and reproductive health care. Yet, data are lacking for all OECD countries on this front.
Women’s land ownership rights (Target 5.a) are not assessed due to lack of data. No data are available to measure how many women own agricultural land in OECD countries, and data on policy measures related to women’s rights to land ownership53 are available only in Colombia, Costa Rica, Italy, Portugal, the Slovak Republic, Switzerland and Sweden.
The majority of women in all OECD countries have access to ICT tools, and their use of them has been constantly increasing. Target 5.b calls to “enhance the use of enabling technology, in particular information and communications technology (ICT), to promote the empowerment of women”. The global indicator framework proposes the proportion of individuals who own a mobile telephone as a measure to monitor Target 5.b. As not enough OECD countries are covered in the available data for this measure in the SDG Global Database, this report includes a measure of the proportion of women using the Internet from OECD sources (operationalised at 96%). Based on this indicator, in 2019, 89% of women (on average across OECD countries) accessed to the Internet. Although distances to target are large in four countries (Italy, Greece, Mexico and Turkey – where around 25% of women do not use the Internet), all OECD countries are progressing towards the target.
There are no available data to assess Target 5.c. The adoption and strengthening of policies and enforceable legislation for the promotion of gender equality and the empowerment of all women and girls at all levels (Target 5.c) is to be tracked through measures of systems to track and make public allocations for gender equality and women’s empowerment. To date no data are available for OECD countries.
Summing up
While the lack of sufficient data hinders a comprehensive assessment of progress towards all the targets related to Goal 5, available data do suggest that most OECD countries are currently far from achieving gender equality and empowering women and girls in both public and private spheres (Figure 2.14, panel A). The picture is relatively positive for Target 5.b relating to women’s use of enabling technology, as only one in ten OECD countries is at a large distance to target, and none of them are showing regressive trends (Figure 2.14, panel B). Yet, apart from women’s access to technology, serious barriers to achieving gender equality persist. Violence against women is still widespread and remains a major issue in most OECD countries (Target 5.2). Only one in three OECD countries can be considered at a short distance to eliminating violence against women. Gender inequalities also persist in terms of unpaid work (Target 5.4). While the gap is smaller in some OECD countries, in all of them women still spend much more time on unpaid domestic and care work than do men. Similarly, in the political and economic spheres, no country has achieved equal representation of women and men at different levels of decision making (Target 5.5). Although half of OECD countries are currently making progress towards equal representation, none are expected to achieve it by 2030. While filling legal gaps helps women fully enjoy their human rights, most OECD countries fall short in this regard too. No OECD country has a comprehensive legal framework to promote and ensure gender equality in all its dimensions (Target 5.1), and most of them also lack a legal framework to prevent and criminalise harmful practices such as female genital mutilation (Target 5.3).

Note: Panel A shows the distribution of OECD countries in terms of the distance that they need to travel to reach each SDG target. Distances are measured in standardised units (s.u.) – see the methodological annex for details. Countries’ distances, based on the level of the indicators in the most recent available observation, have been grouped into three clusters: small distances (i.e. less than 0.5 s.u.), shown in light blue; medium distances (from more than 0.5 s.u. to 1.5 s.u.), shown in medium blue; and large distances (i.e. more than 1.5 s.u.), shown in dark blue. Panel B shows the distribution of OECD countries in terms of their recent changes in the indicators for each target. Countries’ progress, based on changes in the indicators over recent years, are grouped into three clusters: those whose recent pace of progress should be sufficient to meet the target by 2030, shown in green; those whose recent progress should be insufficient to meet the target by 2030, shown in orange; and those countries whose recent performance has been stagnating or moving further away from the 2030 target, shown in red – see the methodological annex for details. The figure also highlights targets with no data to assess either their current distance or their pace of progress (shown in grey). Time series are considered as missing when there are two or fewer data points for each country; indicators are considered as missing when they are unavailable for 20 OECD countries or more, or for less than three world regions – see the methodological annex for details.
Source: All data is taken and adapted from (UNDESA, 2021[3]), SDG Global Database, https://unstats.un.org/sdgs/unsdg and (OECD, 2021[4]), OECD.Stat, https://stats.oecd.org/ (accessed on 29 October 2021).
Impact of the COVID-19 pandemic on Goal 5
Target 5.1 (on legal discrimination against women) cannot be considered as being directly impacted by the COVID-19 pandemic. Still, as highlighted by the OECD (2020[87]), by redirecting policy priorities the health crisis might well have slowed progress on introducing new legislation and implementing existing legislation in many countries (Table 2.10).
Early evidence on the impact of COVID-19 suggests a striking increase of domestic violence after lockdown measures were introduced (Target 5.2). However, the pandemic also multiplied the challenges in collecting data on gender-based violence. Preliminary data should therefore be interpreted with caution. As stressed by the UNODC (2020[91]), lockdown measures can act as a potential catalyst for violence against women in two conflicting ways: by increasing strains in the home (as women spend more time in isolation); and by reducing exposure to crime committed outside of the home. So far, the UNODC has concluded that the impact of the COVID-19 on violence against women is ambiguous: “no significant, homogeneous effect on recorded incidents of crime across countries has been identified so far”. Still, the reporting of rape and sexual assault to the authorities decreased, suggesting a reduction in the number of incidents outside the domestic sphere (reported violence reverted to previous levels once confinement measures were relaxed). In addition, UNODC analysis shows that in most countries more women reached out to helplines and that the increase in calls was greater where lockdown measures were more stringent. Finally, the UNODC reports that there was no notable change in the number of gender-related killings of women and girls, with a decrease in some countries.
While both men and women increased their participation in housework and childcare during the lockdown, most of the burden fell on women, who were already doing most of the housework before the crisis. With more time and people at home, household chores and care increased accordingly (Target 5.4). In particular, the widespread closure of schools and childcare facilities increased the amount of time that parents must spend on childcare and child supervision, and this also introduced responsibilities for home schooling. Preliminary evidence from many OECD countries suggests that both men and women were affected by this rise in unpaid work, but that most of the additional burden fell on women (Abdo et al., 2020[92]; Farre et al., 2020[93]; Craig and Churchill, 2020[94]; İlkkaracan and Memiş, 2021[95]). In the longer run, however, the impact of the COVID-19 pandemic could be positive (Table 2.10). Fathers who were staying home were able to take primary responsibility for childcare. This may help change social norms that currently contribute to a lopsided distribution of the division of labour in housework and childcare (Alon et al., 2020[96]).
The disruption of health services induced by the COVID-19 crisis may have short-term effects on access to reproductive health care (Target 5.6). Stringent and lengthy lockdown measures adopted to avoid overwhelming health systems resulted in a significant disruption of essential services. Based on a survey conducted among 105 countries at various levels of development from different world regions, WHO (2020[70]) has suggested that family planning and contraception services were among the most impacted.
Target 5.c (on “adopting and strengthening sound policies and enforceable legislation for the promotion of gender equality and the empowerment of all women and girls”) does not seem to have been substantially impacted by the COVID-19 pandemic. Yet, as highlighted for Target 5.1, by redirecting policy priorities, the health crisis might well have slowed progress on introducing new legislation and implementing existing legislation in many countries.
References
[92] Abdo, N. et al. (2020), Care in the Time of Coronavirus: Why care work needs to be at the centre of a post-COVID-19 feminist future, https://doi.org/10.21201/2020.6232.
[43] Adam, T. and E. Epel (2007), “Stress, eating and the reward system”, Physiology & Behavior, Vol. 91/4, pp. 449-458, https://doi.org/10.1016/j.physbeh.2007.04.011.
[77] Ainley, J. and R. Carstens (2018), “Teaching and Learning International Survey (TALIS) 2018 Conceptual Framework”, OECD Education Working Papers, No. 187, OECD Publishing, Paris, https://doi.org/10.1787/799337c2-en.
[19] Almeida, V. et al. (2020), “Households´ income and the cushioning effect of fiscal policy measures during the Great Lockdown”, JRC Working Papers on Taxation and Structural Reforms, No. 06/2020, European Commission, Seville, https://joint-research-centre.ec.europa.eu/publications/households-income-and-cushioning-effect-fiscal-policy-measures-during-great-lockdown_en (accessed on 14 March 2022).
[96] Alon, T. et al. (2020), The Impact of COVID-19 on Gender Equality, National Bureau of Economic Research, Cambridge, MA, https://doi.org/10.3386/w26947.
[61] American College of Emergency Physicians (2020), Poll on COVID-19, https://www.emergencyphysicians.org/article/covid19/public-poll-emergency-care-concerns-amidst-covid-19 (accessed on 14 March 2022).
[79] Azevedo, J. et al. (2020), “Simulating the Potential Impacts of COVID-19 School Closures on Schooling and Learning outcomes: A Set of Global Estimates”, Policy Research Working Paper, No. 9284, World Bank, Washington, DC, https://openknowledge.worldbank.org/handle/10986/33945.
[55] Been, J. et al. (2020), “Impact of COVID-19 mitigation measures on the incidence of preterm birth: a national quasi-experimental study”, The Lancet Public Health, Vol. 5/11, pp. e604-e611, https://doi.org/10.1016/s2468-2667(20)30223-1.
[5] Bray, R. et al. (2019), The Hidden Dimensions of Poverty, Fourth World Publications, Montreuil, https://www.atd-quartmonde.org/wp-content/uploads/2019/12/Hidden-Dimensions-of-Poverty-20-11-2019.pdf (accessed on 14 March 2022).
[18] Brewer, M. and I. Tasseva (2020), “Did the UK policy response to Covid-19 protect household incomes?”, The Journal of Economic Inequality, Vol. 19, pp. 433-458, https://doi.org/10.1007/s10888-021-09491-w (accessed on 14 March 2022).
[71] Brunekreef, B. et al. (2021), Air pollution and COVID-19, https://www.europarl.europa.eu/RegData/etudes/STUD/2021/658216/IPOL_STU(2021)658216_EN.pdf (accessed on 14 March 2022).
[94] Craig, L. and B. Churchill (2020), “Working and Caring at Home: Gender Differences in the Effects of Covid-19 on Paid and Unpaid Labor in Australia”, Feminist Economics, pp. 1-17, https://doi.org/10.1080/13545701.2020.1831039.
[57] De Curtis, M., L. Villani and A. Polo (2020), “Increase of stillbirth and decrease of late preterm infants during the COVID-19 pandemic lockdown”, Archives of Disease in Childhood - Fetal and Neonatal Edition, pp. fetalneonatal-2020-320682, https://doi.org/10.1136/archdischild-2020-320682.
[66] Dubey, M. et al. (2020), “COVID-19 and addiction”, Diabetes & Metabolic Syndrome: Clinical Research & Reviews, Vol. 14/5, pp. 817-823, https://doi.org/10.1016/j.dsx.2020.06.008.
[23] Eurostat (2021), Early estimates of income inequalities during the 2020 pandemic, https://ec.europa.eu/eurostat/statistics-explained/index.php?title=Early_estimates_of_income_inequalities_during_the_2020_pandemic (accessed on 14 March 2022).
[93] Farre, L. et al. (2020), “How the Covid-19 Lockdown Affected Gender Inequality in Paid and Unpaid Work in Spain”, IZA Discussion Paper, No. 13434, Institute of Labor Economics, https://docs.iza.org/dp13434.pdf.
[17] Figari, F. and C. Fiorio (2020), “Welfare resilience in the immediate aftermath of the COVID-19 outbreak in Italy”, EUROMOD Working Paper, No. EM6/20, University of Essex, Institute for Social and Economic Research (ISER), Colchester, https://www.econstor.eu/bitstream/10419/228405/1/1697333176.pdf (accessed on 14 March 2022).
[47] Gaind, N. (2016), “Global rate of new HIV infections hasn’t fallen in a decade”, Nature, https://doi.org/10.1038/nature.2016.20305.
[72] Giani, P. et al. (2020), “Short-term and long-term health impacts of air pollution reductions from COVID-19 lockdowns in China and Europe: a modelling study”, The Lancet Planetary Health, Vol. 4/10, pp. e474-e482, https://doi.org/10.1016/s2542-5196(20)30224-2.
[22] Han, J., B. Meyer and J. Sullivan (2020), Income and poverty in the COVID-19 Pandemic, Brookings Papers on Economic Activity, https://www.brookings.edu/wp-content/uploads/2020/06/Han-et-al-conference-draft.pdf (accessed on 14 March 2022).
[84] Hanushek, E. and L. Woessmann (2020), “The economic impacts of learning losses”, OECD Education Working Papers, No. 225, OECD Publishing, Paris, https://doi.org/10.1787/21908d74-en.
[59] Hedermann, G. et al. (2020), “Danish premature birth rates during the COVID-19 lockdown”, Archives of Disease in Childhood - Fetal and Neonatal Edition, pp. fetalneonatal-2020-319990, https://doi.org/10.1136/archdischild-2020-319990.
[95] İlkkaracan, İ. and E. Memiş (2021), “Transformations in the Gender Gaps in Paid and Unpaid Work During the COVID-19 Pandemic: Findings from Turkey”, Feminist Economics, pp. 1-22, https://doi.org/10.1080/13545701.2020.1849764.
[68] ITF (2020), Road Safety Annual Report 2020, OECD Publishing, Paris, https://doi.org/10.1787/f3e48023-en.
[74] Jacobsen, K. (2020), “Will COVID-19 generate global preparedness?”, The Lancet, Vol. 395/10229, pp. 1013-1014, https://doi.org/10.1016/s0140-6736(20)30559-6.
[65] Jones, N. (2020), “How coronavirus lockdowns stopped flu in its tracks”, Nature, https://doi.org/10.1038/d41586-020-01538-8.
[80] Kuhfeld, M. et al. (2020), “Projecting the Potential Impact of COVID-19 School Closures on Academic Achievement”, Educational Researcher, Vol. 49/8, pp. 549-565, https://doi.org/10.3102/0013189x20965918.
[62] Lazzerini, M. et al. (2020), “Delayed access or provision of care in Italy resulting from fear of COVID-19”, The Lancet Child & Adolescent Health, Vol. 4/5, pp. e10-e11, https://doi.org/10.1016/s2352-4642(20)30108-5.
[40] Leddy, A. et al. (2020), “A conceptual model for understanding the rapid COVID-19–related increase in food insecurity and its impact on health and healthcare”, The American Journal of Clinical Nutrition, Vol. 112/5, pp. 1162-1169, https://doi.org/10.1093/ajcn/nqaa226.
[21] Li, J. et al. (2020), The impact of COVID-19 and policy response on Australian income distribution and poverty, https://www.researchgate.net/publication/344180947_The_Impact_of_COVID-19_and_Policy_Responses_on_Australian_Income_Distribution_and_Poverty (accessed on 14 March 2022).
[20] Lustig, N. et al. (2020), “The Impact of COVID-19 Lockdowns and Expanded Social Assistance on Inequality, Poverty and Mobility in Argentina, Brazil, Colombia and Mexico”, CGD Working Paper, No. 556, Centre for Global Development, https://www.cgdev.org/sites/default/files/impact-covid-19-lockdowns-and-expanded-social-assistance.pdf (accessed on 14 March 2022).
[58] Maeda, Y. et al. (2020), “Trends in intensive neonatal care during the COVID-19 outbreak in Japan”, Archives of Disease in Childhood - Fetal and Neonatal Edition, pp. fetalneonatal-2020-320521, https://doi.org/10.1136/archdischild-2020-320521.
[44] Mattioli, A. et al. (2020), “Obesity risk during collective quarantine for the COVID-19 epidemic”, Obesity Medicine, Vol. 20, p. 100263, https://doi.org/10.1016/j.obmed.2020.100263.
[64] Mattioli, A. et al. (2020), “Quarantine during COVID-19 outbreak: Changes in diet and physical activity increase the risk of cardiovascular disease”, Nutrition, Metabolism and Cardiovascular Diseases, Vol. 30/9, pp. 1409-1417, https://doi.org/10.1016/j.numecd.2020.05.020.
[56] Meyer, R. et al. (2021), “A marked decrease in preterm deliveries during the coronavirus disease 2019 pandemic”, American Journal of Obstetrics and Gynecology, Vol. 224/2, pp. 234-237, https://doi.org/10.1016/j.ajog.2020.10.017.
[6] Morelli, S., T. Smeeding and J. Thompson (2015), “Post-1970 Trends in Within-Country Inequality and Poverty”, in Handbook of Income Distribution, Elsevier, https://doi.org/10.1016/b978-0-444-59428-0.00009-6.
[45] OECD (2021), Agricultural Policy Monitoring and Evaluation 2021: Addressing the Challenges Facing Food Systems, OECD Publishing, Paris, https://doi.org/10.1787/2d810e01-en.
[89] OECD (2021), Bringing Household Services Out of the Shadows: Formalising Non-Care Work in and Around the House, OECD Publishing, https://doi.org/10.1787/fbea8f6e-en.
[16] OECD (2021), COVID-19 and Well-being: Life in the Pandemic, OECD Publishing, Paris, https://doi.org/10.1787/1e1ecb53-en.
[34] OECD (2021), “Creditor Reporting System: Aid activities”, OECD International Development Statistics (database), https://doi.org/10.1787/data-00061-en (accessed on 19 November 2021).
[53] OECD (2021), Daily smokers (indicator), https://doi.org/10.1787/1ff488c2-en (accessed on 13 December 2021).
[36] OECD (2021), “Developments in Agricultural Policy and Support”, in Agricultural Policy Monitoring and Evaluation 2021: Addressing the Challenges Facing Food Systems, OECD Publishing, Paris, https://doi.org/10.1787/05bd280b-en.
[76] OECD (2021), Education at a Glance 2021: OECD Indicators, OECD Publishing, Paris, https://doi.org/10.1787/b35a14e5-en.
[90] OECD (2021), Government at a Glance 2021, OECD Publishing, Paris, https://doi.org/10.1787/1c258f55-en.
[82] OECD (2021), Implications of the COVID-19 Pandemic for Vocational Education and Training, OECD Publishing, Paris, https://doi.org/10.1787/55afea00-en.
[28] OECD (2021), Making Better Policies for Food Systems, OECD Publishing, Paris, https://doi.org/10.1787/ddfba4de-en.
[101] OECD (2021), Measuring the Environmental Performance of Agriculture Across OECD Countries, OECD Publishing, Paris, https://doi.org/10.1787/4edcd747-en.
[33] OECD (2021), Nutrient balance (indicator), https://doi.org/10.1787/82add6a9-en (accessed on 13 December 2021).
[46] OECD (2021), OECD Economic Outlook, Interim Report September 2021: Keeping the Recovery on Track, OECD Publishing, Paris, https://doi.org/10.1787/490d4832-en.
[39] OECD (2021), OECD Economic Outlook, Volume 2021 Issue 2, OECD Publishing, Paris, https://doi.org/10.1787/66c5ac2c-en.
[24] OECD (2021), OECD Employment Outlook 2021: Navigating the COVID-19 Crisis and Recovery, OECD Publishing, Paris, https://doi.org/10.1787/5a700c4b-en.
[4] OECD (2021), OECD.Stat (database), https://stats.oecd.org/.
[30] OECD (2021), Overweight or obese population (indicator), https://doi.org/10.1787/86583552-en (accessed on 13 December 2021).
[7] OECD (2021), Poverty rate (indicator), https://doi.org/10.1787/0fe1315d-en (accessed on 13 December 2021).
[50] OECD (2021), Preventing Harmful Alcohol Use, OECD Health Policy Studies, OECD Publishing, Paris, https://doi.org/10.1787/6e4b4ffb-en.
[27] OECD (2021), Social Benefit Recipients - High Frequency Database (SOCR-HF), https://www.oecd.org/social/soc/recipients-socr-hf.htm (accessed on 14 March 2022).
[60] OECD (2021), Strengthening the frontline: How primary health care helps health systems adapt during the COVID 19 pandemic, https://doi.org/10.1787/9a5ae6da-en.
[67] OECD (2021), “The effect of COVID-19 on alcohol consumption, and policy responses to prevent harmful alcohol consumption”, OECD Policy Responses to Coronavirus (COVID-19), OECD Publishing, Paris, https://doi.org/10.1787/53890024-en.
[78] OECD (2021), The State of Global Education: 18 Months into the Pandemic, OECD Publishing, Paris, https://doi.org/10.1787/1a23bb23-en.
[86] OECD (2021), The State of School Education: One Year into the COVID Pandemic, OECD Publishing, Paris, https://doi.org/10.1787/201dde84-en.
[83] OECD (2020), Education at a Glance 2020: OECD Indicators, OECD Publishing, Paris, https://doi.org/10.1787/69096873-en.
[15] OECD (2020), Household dashboard database, https://stats.oecd.org/Index.aspx?DataSetCode=HH_DASH.
[49] OECD (2020), How’s Life? 2020: Measuring Well-being, OECD Publishing, Paris, https://doi.org/10.1787/9870c393-en.
[35] OECD (2020), Measuring distortions in international markets: the agriculture sector, OECD Publishing, https://issuu.com/oecd.publishing/docs/measuring_distortions_in_internatio (accessed on 14 March 2022).
[26] OECD (2020), OECD Economic Outlook, Interim Report September 2020, OECD Publishing, Paris, https://doi.org/10.1787/34ffc900-en.
[100] OECD (2020), OECD Economic Outlook, Volume 2020 Issue 1, OECD Publishing, Paris, https://doi.org/10.1787/0d1d1e2e-en.
[12] OECD (2020), Social spending makes up 20% of OECD GDP, https://www.oecd.org/els/soc/OECD2020-Social-Expenditure-SOCX-Update.pdf (accessed on 14 March 2022).
[25] OECD (2020), “Supporting livelihoods during the COVID-19 crisis: Closing the gaps in safety nets”, OECD Policy Responses to Coronavirus (COVID-19), OECD Publishing, Paris, https://doi.org/10.1787/17cbb92d-en.
[29] OECD (2020), The impact of COVID-19 on agricultural markets and GHG emissions, https://doi.org/10.1787/57e5eb53-en.
[38] OECD (2020), “The role of transparency in avoiding a COVID-19 induced food crisis”, OECD Policy Responses to Coronavirus (COVID-19), OECD Publishing, Paris, https://doi.org/10.1787/d6a37aeb-en.
[87] OECD (2020), Women at the core of the fight against COVID-19 crisis, https://doi.org/10.1787/553a8269-en.
[52] OECD (2019), Addressing Problematic Opioid Use in OECD Countries, OECD Health Policy Studies, OECD Publishing, Paris, https://doi.org/10.1787/a18286f0-en.
[31] OECD (2019), Agricultural Policy Monitoring and Evaluation 2019, OECD Publishing, Paris, https://doi.org/10.1787/39bfe6f3-en.
[13] OECD (2019), Can Social Protection Be an Engine for Inclusive Growth?, OECD Publishing, https://doi.org/10.1787/9d95b5d0-en.
[48] OECD (2019), Health at a Glance 2019: OECD Indicators, OECD Publishing, Paris, https://doi.org/10.1787/4dd50c09-en.
[85] OECD (2019), PISA 2018 Results (Volume II): Where All Students Can Succeed, PISA, OECD Publishing, Paris, https://doi.org/10.1787/b5fd1b8f-en.
[2] OECD (2019), Policy Coherence for Sustainable Development 2019: Empowering People and Ensuring Inclusiveness and Equality, OECD Publishing, Paris, https://doi.org/10.1787/a90f851f-en.
[9] OECD (2019), Society at a Glance 2019: OECD Social Indicators, OECD Publishing, Paris, https://doi.org/10.1787/soc_glance-2019-en.
[8] OECD (2019), “The future of work: What do we know?”, in OECD Employment Outlook 2019: The Future of Work, OECD Publishing, Paris, https://doi.org/10.1787/ef00d169-en.
[32] OECD (2019), Trends and Drivers of Agri-environmental Performance in OECD Countries, OECD Publishing, Paris, https://doi.org/10.1787/b59b1142-en.
[103] OECD (2018), Assessing the Real Cost of Disasters: The Need for Better Evidence, OECD Reviews of Risk Management Policies, OECD Publishing, Paris, https://doi.org/10.1787/9789264298798-en.
[75] OECD (2018), Education at a Glance 2018: OECD Indicators, OECD Publishing, Paris, https://doi.org/10.1787/eag-2018-en.
[10] OECD (2018), “Unemployment-benefit coverage: Recent trends and their drivers”, in OECD Employment Outlook 2018, OECD Publishing, Paris, https://doi.org/10.1787/empl_outlook-2018-9-en.
[102] OECD (2017), Government at a Glance 2017, OECD Publishing, Paris, https://doi.org/10.1787/gov_glance-2017-en.
[11] OECD (2017), Green Growth Indicators 2017, OECD Green Growth Studies, OECD Publishing, Paris, https://doi.org/10.1787/9789264268586-en.
[51] OECD (2015), The Economic Consequences of Climate Change, OECD Publishing, Paris, https://doi.org/10.1787/9789264235410-en.
[98] OECD (2011), Quality Framework for OECD Statistical activities, Version 2011/1, OECD Publishing, https://www.oecd.org/officialdocuments/publicdisplaydocumentpdf/?cote=std/qfs(2011)1&doclanguage=en.
[69] ONISR (2020), Impact of population lockdown during spring 2020 COVID crisis, https://www.onisr.securite-routiere.gouv.fr/en/knowledge-centre/evaluation/impact-of-population-lockdown-during-spring-2020-covid-crisis#:~:text=Overall%20mortality%20drops%20by%20%2D63,decrease%20more%20(%2D73%25) (accessed on 14 March 2022).
[54] Philip, R. et al. (2020), “Unprecedented reduction in births of very low birthweight (VLBW) and extremely low birthweight (ELBW) infants during the COVID-19 lockdown in Ireland: a ‘natural experiment’ allowing analysis of data from the prior two decades”, BMJ Global Health, Vol. 5/9, p. e003075, https://doi.org/10.1136/bmjgh-2020-003075.
[37] Placzek, O. (2021), “Socio-economic and demographic aspects of food security and nutrition”, OECD Food, Agriculture and Fisheries Papers, No. 150, OECD Publishing, Paris, https://doi.org/10.1787/49d7059f-en.
[88] Queisser, M. (2020), One in Three is Too Many: Taking action on violence against women, https://www.oecd-forum.org/posts/one-in-three-is-too-many-taking-action-on-violence-against-women (accessed on 14 March 2022).
[41] Stockwell, S. et al. (2021), “Changes in physical activity and sedentary behaviours from before to during the COVID-19 pandemic lockdown: a systematic review”, BMJ Open Sport & Exercise Medicine, Vol. 7/1, p. e000960, https://doi.org/10.1136/bmjsem-2020-000960.
[42] Torres, S. and C. Nowson (2007), “Relationship between stress, eating behavior, and obesity”, Nutrition, Vol. 23/11-12, pp. 887-894, https://doi.org/10.1016/j.nut.2007.08.008.
[81] UIS (2021), Pandemic-related disruptions to schooling and impacts on learning proficiency indicators: A focus on the early grades, UNESCO Institute for Statistics, Montreal, https://unesdoc.unesco.org/ark:/48223/pf0000377781/PDF/377781eng.pdf.multi (accessed on 14 March 2022).
[1] UN (2015), 70/1. Transforming our world: the 2030 Agenda for Sustainable Development, Resolution adopted by the UN General Assembly, https://sdgs.un.org/2030agenda (accessed on 14 March 2022).
[3] UNDESA (2021), SDG Global Database, The United Nations (UN) Department of Economic and Social Affairs, https://unstats.un.org/sdgs/dataportal (accessed on 29 October 2021).
[97] UNESCWA (2018), The 5Ps of the Sustainable Development Goals, https://www.unescwa.org/sites/www.unescwa.org/files/u593/the_5ps_of_the_sustainable_development_goals.pdf.
[99] UNISDR (2015), Sendai Framework for Disaster Risk Reduction 2015-2030, United Nations Office for Disaster Risk Reduction, Geneva, https://www.undrr.org/publication/sendai-framework-disaster-risk-reduction-2015-2030 (accessed on 14 March 2022).
[91] UNODC (2020), What crime and helpline data say about the impact of the COVID-19 pandemic on reported violence against women and girls, United Nations Office on Drugs and Crime, https://www.unodc.org/documents/data-and-analysis/covid/Violence_against_women_24Nov.pdf (accessed on 14 March 2022).
[63] Van Mol, P. et al. (2020), “LBA78 A microsimulation model to assess the impact of SARS-CoV-2 on cancer outcomes, healthcare organization and economic burden”, Annals of Oncology, Vol. 31, p. S1207, https://doi.org/10.1016/j.annonc.2020.08.2319.
[73] Venter, Z. et al. (2020), “COVID-19 lockdowns cause global air pollution declines”, Proceedings of the National Academy of Sciences, Vol. 117/32, pp. 18984-18990, https://doi.org/10.1073/pnas.2006853117.
[70] WHO (2020), Pulse survey on continuity of essential health services during the COVID-19 pandemic: interim report, https://www.who.int/publications/i/item/WHO-2019-nCoV-EHS_continuity-survey-2020.1 (accessed on 14 March 2022).
[14] World Bank (2020), Poverty and Shared Prosperity 2020 : Reversals of Fortune, Washington, DC: World Bank, https://doi.org/10.1596/978-1-4648-1602-4.
Notes
← 1. The preamble of the 2030 Agenda starts by saying that it is “a plan of action for People, Planet and Prosperity [that] also seeks to strengthen universal Peace [with] all countries and all stakeholders, acting in collaborative Partnership”. Yet, no official mapping between the 5Ps and goals and targets had been endorsed. The mapping proposed here was first proposed by the United Nations (UNESCWA, 2018[97]) but it should not be considered as binding; the SDGs are integrated and indivisible, and some goals might relate to more than one P.
← 2. The aggregation at goal level assumes equal weights among the data series measuring the same SDG indicator and equal weights among the indicators measuring the same target. The OECD average refers to the unweighted average.
← 3. According to the Quality Framework for OECD Statistical activities, data quality is defined in terms of seven dimensions including relevance; accuracy; credibility; timeliness; accessibility; interpretability; and coherence (OECD, 2011[98]).
← 4. Based on a tracking of more than 800 measures in response to COVID-19 on food and agriculture conducted by the OECD, it seems that many of the policy measures will remain in place in the medium term. Out of the 54 countries tracked, a minimum USD 157 billion was earmarked for the sector, with half for food assistance (OECD, 2021[36])
← 5. While Target 1.1 refers to “eradicating extreme poverty” (i.e. attaining a 0% level by 2030), the World Bank suggested that, due to statistical errors and friction costs, the target could be considered as attained upon reaching a level of 3%.
← 6. For a few SDG targets, the 2030 Agenda relies on relative end-values, i.e. the level of achievement to be attained is defined as a fraction or multiple of the country’s starting position. This is the case for Target 1.2, which refers to reducing by half the proportion of people living in poverty based on national measures. In order to allow for comparability between countries, the target to be reached is defined as a share of the OECD median in 2015. For Target 1.2, the median relative poverty rate was 10.9% in 2015, thus the target to be reach for all countries was set at 5.45% by 2030.
← 7. While poverty has traditionally been defined as the lack of money, a person who is poor can suffer multiple disadvantages at the same time – for example, they may have poor health or malnutrition, a lack of clean water or electricity, poor quality of work or little schooling. The OECD average for multidimensional poverty should be interpreted carefully, as it includes only 24 countries, mostly European as well as Mexico, and because the design of measures of multidimensional poverty may not be consistent across countries.
← 8. While Colombia is expected to meet the target, the assessment relies only on the measure of multidimensional poverty.
← 9. The reference population is different for the different indicators. For instance, in the case of work injury the reference population is the employed population, while in the case of unemployment cash benefits, the reference population is the unemployed population, etc.
← 10. Social protection consists of policies and programmes designed to reduce poverty and vulnerability notably by addressing the risks of unemployment, poverty, sickness, disability and old age, as well as through programmes targeting vulnerable groups with special needs.
← 11. Both the share of population above statutory pensionable age receiving an old-age pension as well as the share of population with severe disabilities receiving disability cash benefit seem to be constant at a rather high rate and thus likely to remain above the target level by 2030.
← 12. Around one-third of OECD countries have progressed towards their target on the share of poor working-age population receiving secondary out-of-work benefits (safety nets) or the share of unemployed receiving unemployment cash benefit over the last decade, and only two of them are on track to meet their target.
← 13. The very high rates of coverage and the absence of any notable trend create some noise in the measurement and may explain why complete coverage would not be expected by 2030.
← 14. For data series supporting 1.5.1, the target level to be reached is set at 0 deaths and missing persons per 100 000 inhabitants. Similarly, for 1.5.2 (the direct economic loss attributed to disasters relative to GDP), the target level was set at 0% of GDP. The data series supporting the measurement of 1.5.3 and 1.5.4 are policy measures concerning the adoption and implementation of DRR strategies in line with the Sendai Framework at national and local levels. For those indicators, the target level was set at 100% (full adoption and implementation).
← 15. While Italy scored 40% on the adoption and implementation of national DRR strategies in line with the Sendai Framework, another nine countries (Canada, Denmark, Iceland, Ireland, Israel, the Netherlands, the Slovak Republic, Sweden and Turkey) have a score of 0%. Yet, some of these data has not followed an official validation process and may be subject to revision at a later date, for instance, according to the Canada SDG hub, this score is 100% in Canada.
← 16. Yet, given the nature and the volatility of the indicator, careful interpretation is needed. In the last 30 years, the number of disasters has significantly increased across OECD Member countries (OECD, 2017[102]). In addition, as acknowledged by the United Nations Office for Disaster Risk Reduction (UNDRR), some of the data feeding these indicators have not been officially validated and may be revised at a later date. Also, their full economic impact remains largely unknown, especially the cost of smaller disasters and indirect impacts such as those due to business disruptions (OECD, 2018[103]).
← 17. While possible trajectories vary a lot between countries depending on the existing economic stabilisers and extraordinary policy packages put in place, all studies show that safety nets prevented or at least limited the expected rise in poverty. However, the results also depend on whether the poverty line is anchored to the pre-crisis level. When not doing so, most studies suggest that the impact of the crisis could be negligible in most countries.
← 18. While informative, these estimates should be interpreted carefully, as not all of the budgeted allocations will be used (for instance, due to a low take-up). According to official estimates, the effective take-up of credit guarantees as a percentage of outstanding commitments was 4% in Australia (as of end August), 6% in Germany (as of end September), and 80.5% in Spain, 41.7% in France, 22.2% in the United Kingdom and 24% in Italy (as of end October) (OECD, 2020[100]).
← 19. Estimates are derived from microdata from the United States Census Bureau, and flash estimates produced by Eurostat and Statistics Canada, using nowcasting techniques based on microsimulation.
← 20. “Enhanced work to reduce exposure and vulnerability, thus preventing the creation of new disaster risks, and accountability for disaster risk creation are needed at all levels. More dedicated action needs to be focused on tackling underlying disaster risk drivers, such as the consequences of … pandemics and epidemics.” (UNISDR, 2015[99])
← 21. In September 2021, the UN Food Systems Summit was held as a part of the Decade of Action for delivery on the SDGs by 2030. Serving as a catalyst for discussions on SDG2 and beyond, the aim of the Summit was to “deliver progress on all 17 of the SDGs through a food systems approach, leveraging the interconnectedness of food systems to global challenges such as hunger, climate change, poverty and inequality” (see https://www.un.org/foodsystemssummit).
← 22. While nitrogen surplus is important, the measurement could rely on a few other indicators such as: land use, water use, greenhouse gas emissions and ammonia emissions (OECD, 2021[101]). Still, these additional measures confirm that OECD countries increased their agricultural production in the last decade, and the agriculture sector’s environmental performance registered mixed results. In particular, progress was achieved in reducing phosphorus balances, ammonia emissions and nitrogen balances. While progress was also made in reducing the intensities of greenhouse gas (GHG) emissions, the overall GHG emissions volumes did not fall.
← 23. Primarily, the IFPA focuses on cereal products (maize and maize products, wheat and wheat flour, rice, sorghum and millet), which accounts for the most important caloric intake. Yet, to be more comprehensive, the FAO also calculates the IFPA on countries’ officially reported food price indices. This facilitates cross-country comparisons, as it uses a national level food basket covering all the most important commodities consumed. While the basket differs from country to country, this approach is more reflective of national and global trends, as countries have predefined the commodities that have the greatest impact on local consumers. This approach also facilitates the implementation of the indicator, as countries will not be asked to create a new index or modify existing methodologies.
← 24. The FAO (which developed this measure) mentions that the IFPA is considered to be normal below 0.5, moderately high when it ranges between 0.5 and 1, and abnormally high when it is above 1. Therefore, the end value had been set at 0.5. Given the distribution in OECD countries, it turns out that distances are considered short when the IFPA is below 0.80 and long when it goes above 1.50.
← 25. Following the 2030 Agenda, the target level for maternal mortality has been set at 70 per 100 000 live births, while the target regarding the proportion of births attended by skilled personnel is set at 97% to allow for measurement errors.
← 26. HIV infection causes the onset of AIDS (Acquired Immunodeficiency Syndrome), which manifests itself through many different diseases, such as pneumonia and tuberculosis, as the immune system is no longer able to defend the body, leaving it susceptible to different infections and tumours. There is a time lag between HIV infection, AIDS diagnosis and death, which can vary greatly depending on the treatment administered.
← 27. The 2030 Agenda calls for a reduction of premature mortality by one-third. In order to preserve comparability among OECD countries, the target level was set at 7.5% – i.e. two-thirds of the median risk of dying between the ages of 30 and 70 from cardiovascular disease, cancer, diabetes or chronic respiratory disease. Therefore, a rate below 10% is considered to be at a short distance to the target.
← 28. The target level for suicide rates is set at 3 deaths per 100 000 people.
← 29. While Turkey, Greece and Mexico are considered to be close to target using both OECD and UN sources, Israel and Italy appear to be close to target when using only one source.
← 30. Target 3.6 aimed at halving the number of global deaths from road traffic accidents by the end of 2020 – i.e. less than 2.7 deaths from road traffic per 100 000 inhabitants. In order to preserve comparability between countries, the target has been operationalised in this study as half the 2015 OECD median rate.
← 31. The target had been set using the 10th percentile of the OECD distribution in 2015, with Denmark, Korea, Switzerland and the Netherlands being the countries with the highest performance.
← 32. The Universal Health Coverage Index was developed by the WHO. It aims at measuring the access to health services (including reproductive, maternal, newborn and child health, infectious diseases, non-communicable diseases and service capacity and access). It is presented on a scale of 0 to 100.
← 33. Latest year refers to 2016 for Mexico, Turkey, Colombia, Poland, Chile and Greece; 2015 for Japan and Korea; 2013 for the United Kingdom and the United States; 2012 for Slovenia, Israel and Costa Rica; 2009 for Latvia; 2007 for Estonia; 2004 for Switzerland; and 2010 otherwise.
← 34. The target levels for all of the mortality rates relating to Target 3.9 are operationalised at 3% to allow for measurement errors.
← 35. Yet, in 2018, this rate was 10% when relying on the SDG Global Database.
← 36. Core capacity is defined as the essential public health capacity that State Parties are required to have in place throughout their territories. The IHR lists 13 core capacities, namely: (1) Legislation and financing; (2) IHR Coordination and National IHR Focal Point Functions; (3) Zoonotic events and the human-animal health interface; (4) Food safety; (5) Laboratory; (6) Surveillance; (7) Human resources; (8) National Health Emergency Framework; (9) Health service provision; (10) Risk communication; (11) Points of entry; (12) Chemical events; (13) Radiation emergencies.
← 37. Data was collected with the same questionnaire until 2017, and a new IHR State Parties Annual Assessment and Reporting Tool has been implemented since 2018. Current distance to the target is then assessed through the latter, while trends are assessed using the former.
← 38. Preliminary data shows that in all OECD countries (with the exception of Denmark, where the lockdown was phased out from 15 April 2020, as well as the Netherlands and Sweden, where there was no lockdown), deaths from road traffic accidents in April 2020 were significantly lower than 12 months earlier.
← 39. The different studies included in the meta-analysis showed that PM2.5 decreased by 5% to 20% while PM10 concentrations only marginally decreased.
← 40. The United Nations Educational, Scientific and Cultural Organization (UNESCO) oversees the education SDG agenda in the context of the UN-led SDG framework. As the custodian agency for most of the Goal 4 indicators, the UNESCO Institute of Statistics (UIS) is co-ordinating global efforts to develop the indicator framework to monitor progress towards Goal 4 targets. In addition to collecting data, the UIS works with partners to develop new indicators, statistical approaches and monitoring tools to better assess progress across the education-related SDG targets. In this context, the OECD is working with the UIS, the Goal 4 Steering Committee and the technical working groups that have been put in place to help build a comprehensive data system for global reporting and to agree on the data sources and formulae to be used for reporting on the Goal 4 global indicators and on selected thematic indicators for OECD and partner countries (OECD, 2021[76]).
← 41. Indicators 4.1.1 and 4.5.1 rely on both OECD and UN data sources. Using indices from the OECD's Programme for International Student Assessment (PISA) allows better comparability. The same applies for 4.3.1 (the participation rate of adults in formal and non-formal education) and 4.6.1 (the proportion of adults achieving at least a fixed level of proficiency in functional numeracy skills), both of which are based on the OECD PIAAC survey.
← 42. For Indicator 4.c.1, the SDG Global Database provides data series on the proportion of teachers with the minimum required qualifications for only a few OECD countries. Therefore, this report uses a measure of the proportion of teachers who received in-service training in the last 12 months, using OECD sources.
← 43. Given possible measurement errors, universal completion is understood as 97% of students completing school for a given level.
← 44. The SDG Global Database and OECD estimates are in principle perfectly aligned for Goal 4. Still, estimates may vary slightly due to differences in the time spans and timeliness of the data series.
← 45. Formal and non-formal education and training can be offered in a variety of settings, including schools and universities, workplace environments and others, and can have a variety of durations.
← 46. Benchmarked against the best performances observed in 2015 among OECD countries, the target levels are set at 60% for using basic arithmetic formulas in a spreadsheet, 74% for copying or moving a file or folder, 73% for using copy-and-paste tools to duplicate or move information within a document, 54% for creating electronic presentations with presentation software, 12% for writing a computer programme using a specialised programming language, 70% for finding, downloading, installing and configuring software, and 63% for transferring files between a computer and other devices.
← 47. Children from a lower socio-economic status are less likely to participate in early childhood education and care, while it is the other way around for vocational training. In this latter case, children from lower socio-economic backgrounds are more likely to enter an upper secondary vocational track than a general one. This then impacts their opportunities to access tertiary education, as not all upper secondary vocational programmes provide access to tertiary education.
← 48. Measures of literacy skills in Colombia do not rely on the same source. Significant variations in methodology between the different surveys might affect data comparability.
← 49. The target levels are set at 97% for the data series sourced from the SDG Global Database.
← 50. The Inter-Agency Expert Group on Gender Statistics (IAEG-GS) agreed to assess the legal frameworks “that promote, enforce and monitor gender equality” through 42 yes/no questions falling under four areas of law: i) overarching legal frameworks and public life; ii) violence against women; iii) employment and economic benefits; and iv) marriage and family. Results of the four areas are reported as percentages on a dashboard. The score for each area (a number between 0 and 100) therefore represents the percentage of achievement of that country in that area, with 100 being the best practice achieved on all questions in the area.
← 51. These factors are also likely to vary across countries and societies and may thus have an impact on cross-country comparisons.
← 52. In Latin American countries, comparability is limited, as time-use estimates in the region are based on modules of Labour Force Surveys rather than on detailed diaries, as in most OECD countries. As a result, unpaid work is usually overestimated in the region.
← 53. The indicator aims at measuring the level to which a country’s legal framework supports women’s land rights, by testing that framework against six proxies drawn from international law and internationally accepted good practices. In particular, it considers the Convention on the Elimination of Discrimination Against Women (CEDAW), ratified by 189 countries (including all OECD countries besides the United States). It also considers the Voluntary Guidelines for the Responsible Governance of the Tenure of Land Fisheries and Forestry (VGGT), endorsed by the Committee of Food Security (made of UN agencies, NGOs, international agricultural research institutions, international and regional financial institutions as well as private sector associations and philanthropic foundations).