
4. Trends in the secondary plastics markets
Recycling has an important role to play in lowering plastics’ environmental footprint alongside strategies to reduce plastic waste through reduced consumption and reuse systems. Recycling diverts material from more harmful waste management practices, and the availability of secondary (recycled) plastics can help lower demand for primary (virgin) plastics.
The production of secondary plastics has more than quadrupled in weight in the last 20 years and is growing more quickly than primary plastic production. However secondary plastic markets remain small and in 2019, secondary plastics production accounted for only 6% of total plastic production. Most sectors continue to rely on primary plastics for economic or quality reasons.
Markets for secondary plastics remain vulnerable. Historically, secondary material has often been used as a substitute for primary plastic. As a result, the price of secondary plastics correlated with the price of primary plastic equivalents. This absence of a separate demand for secondary material affects the viability of recycling, since secondary prices do not fully reflect the costs of secondary production (e.g. collection, sorting, and processing), but follow price patterns of primary plastics and their inputs (e.g. oil prices). As well, compared with firms that produce primary plastics, recycling firms produce less material, are less capital-intensive and have fewer sales making them less resilient.
There are positive signs for secondary plastics markets. Recent policies in some countries have strengthened policies to “push” supply through taxes on non-recycled plastic waste, and “pull” demand for secondary plastic through recycled content targets. An emerging differentiation in price with primary equivalents in some markets for some polymers, and growing innovation in recycling technologies, are positive signs.
Since January 2021, amendments to the Basel Convention and OECD Decision on Transboundary Movements of Waste have set new requirements for plastic waste trade. These measures are expected to prolong a trend of diminishing trade volumes, increasing domestic processing and recycling, as well as exports shifting to new countries, initiated when the People’s Republic of China introduced its National Sword policy in 2017, which banned most imports of plastic waste.
As highlighted by the “3 R framework” (reduce, reuse, recycle), policies should seek first to reduce plastic consumption and maintain plastic material in higher value loops, prior to recycling. Reducing plastics can be done by optimising product design and reusing can be done by shifting from single-use to more durable plastic products, which can lower the energy use per consumption cycle. Recycling plastics and using this “secondary” plastic material can reduce environmental pressures when reduction or substitution away from plastics is not feasible, or would lead to greater environmental impacts and when durable plastic product reach their end of life. Recycling plastics is thus an important component of the circular economy.
As far as it displaces primary plastic production and does not induce additional plastic consumption, recycling provides environmental benefits (Zink and Geyer, 2018[1]). The separate collection of plastics for recycling helps to keep plastic waste out of landfills (where plastics can emit harmful compounds and leachates), and incineration, during which plastics generate flue gases and other harmful emissions (Ilyas et al., 2018[2]). Moreover, revenues from recycling encourage valuable materials to be collected and adoption of measures for reducing the volume of mismanaged waste. Finally, recycling provides feedstock for secondary plastics, which can be used to make products with a reduced carbon footprint (Benavides et al., 2018[3]; Zheng and Suh, 2019[4]).
Recycling plastics requires several costly upstream steps, including collecting, sorting and transporting waste. The organisation of these activities differs structurally across countries (Table 4.1). Most high-income countries have a formal system of separate collection organised by the government. The collected material is frequently sorted using capital-intensive processing. In contrast, in low-income countries, separate collection and sorting of high value recyclables such as PET (polyethylene terephthalate) are often performed by low-skilled workers or by an informal recycling sector (i.e. waste pickers). While informal workers can perform key functions in collecting and sorting wastes, there are serious concerns that informal recycling processes are relatively inefficient and environmentally harmful, often failing to prevent emissions of hazardous substances and resulting in health and environmental risks (Box 4.1).
Informal recycling refers to waste recovery activities that are not supported or recognised by the public sector’s waste management authorities. Activities range from waste collection and separation (i.e. “waste picking”), to more “downstream” recycling and processing. At least 15 million people worldwide work in the informal waste sector, collecting and recovering recyclable material from waste, which demonstrates the prevalence of the informal sector (Medina, 2008[6]).
The impacts of the informal sector on recycling are complex and context-dependent. In developed countries with formal waste management systems, “waste-picking” can undermine the financing of these systems by removing valuable materials from the waste stream. However, in low-income countries with limited formal collection and sorting, the informal waste sector can collect and sort high value recyclables effectively (Gunsilius, 2011[7]; CWG and GiZ, 2011[8]).
Nevertheless, there are serious environmental concerns over informal “downstream” operations such as the recycling and treatment of waste. These operations often use crude processes that are not environmentally sound. For instance, informal recycling processes for e-waste often involve burning products to recover valuable metals. Informal waste processers may also discard, dump, burn or otherwise improperly manage residual waste of insufficient economic value, causing leakage of plastics or pollutants into the environment.
There are also serious social and public health concerns surrounding informal waste management. It is often marginalised or vulnerable groups, including migrants, women, the unemployed, disabled and children, who engage in waste picking, sometimes both working and living in dreadful circumstances on dumpsites (Medina, 2008[6]). Other health impacts include exposure to hazardous emissions from open burning (Velis and Cook, 2021[9]). The occupation is particularly socially precarious as workers are rarely covered by social protection or health insurance. Informal enterprises are, by definition, unregistered, which makes them vulnerable to exploitation, while their lack of proper inventories leave operators vulnerable to theft.
A challenge for lower- and middle-income countries is therefore to find ways to formally integrate workers engaged in the informal waste sector to secure their positive contribution, while mitigating the environmental, health and social impacts (Wilson, Velis and Cheeseman, 2006[10]).
The origin of a plastic waste stream determines the level of purity that can be attained after recycling, and thus the value of the resultant secondary plastic (Table 4.2). Post-industrial waste and post-consumer commercial waste can be collected in large containers to minimise logistic costs. Moreover, control mechanisms (e.g. training employees and visual inspection during pickup) can help to achieve high-quality streams and high market prices. In contrast, post-consumer household waste has a high cost of collection (e.g. kerbside collection is expensive) and often contains a substantial share of impurities. Consequently, the collection of most household waste streams tends to generate a net cost for the municipalities in charge. The high-income countries with the highest recycling rates tend to use Extended Producer Responsibility schemes to finance the collection of recyclable plastics from households (explained in Chapter 6) in order to compensate these costs.
Currently, only mechanical recycling1 of PET and polyethylene (PE) plastics demonstrates widespread commercial viability (Garcia and Robertson, 2017[14]). Mechanical recycling of polypropylene (PP) and polyvinyl chloride (PVC) also occurs, but to a lesser extent. Compared with other forms of plastics production and recycling (see below), mechanical recycling requires little capital investment and has fewer barriers to entry for new firms (Hundertmark et al., 2018[15]). However, it results in varying degrees of degradation and quality can only be maintained for a limited number of cycles involving the same material (Hatti-Kaul et al., 2020[16]). Therefore, manufacturers often use mechanically recycled plastics for lower value applications, known as downcycling (Ellen MacArthur Foundation, 2016[17]). Advances in design, separation (either separate collection or using technology to sort mixed waste), pre-treatment and recyclability can improve the output quality of mechanical recycling.
Chemical recycling operations2 can complement mechanical recycling by expanding recycling opportunities to additional resins and waste streams (Ragaert et al., 2021[18]). However, chemical recycling facilities are still predominantly in the pilot or demonstration stages (Hann and Connock, 2020[19]). The primary barrier to expansion is economic feasibility. In addition, due to the high energy intensity of these processes and their production of toxic by-products, chemical recycling may not always be environmentally beneficial. However, the processes can produce particularly high-quality, pure material (in purification and plastic-to-monomer applications) that can meet the standards for food applications, potentially justifying the costs (Ragaert et al., 2021[18]). Plastic-to-fuel applications, in which plastic waste is transformed into fuels, can generate equally high-quality end products, but some countries and stakeholders do not consider this to be recycling. In the coming decades, industry is likely to increase investments in chemical recycling due to its potential role in future recycling markets.
Recycling markets are the fora of exchange for the numerous actors involved at different points in the supply chain, including the public sector, firms, traders (exporters and importers), brokers, and ultimately manufacturers. Markets allocate recycled plastics to the use with the highest value and create a profit motive that incentivises higher recycling rates. The larger the scale and depth of the markets, the better secondary materials are able to compete with primary equivalents, in turn driving the environmental benefits of recycling.
Secondary plastics production has more than quadrupled in the last two decades, from roughly 6.7 Mt in 2000 to 29.1 Mt in 2019, but remains small compared to primary plastics production. Production of primary equivalents nearly doubled over the same period amounting to 431 Mt in 2019. Taken together, the continued growth in primary production and the relatively small size of secondary production suggests that there has not been a fundamental shift in the market to secondary plastics (Figure 4.1).
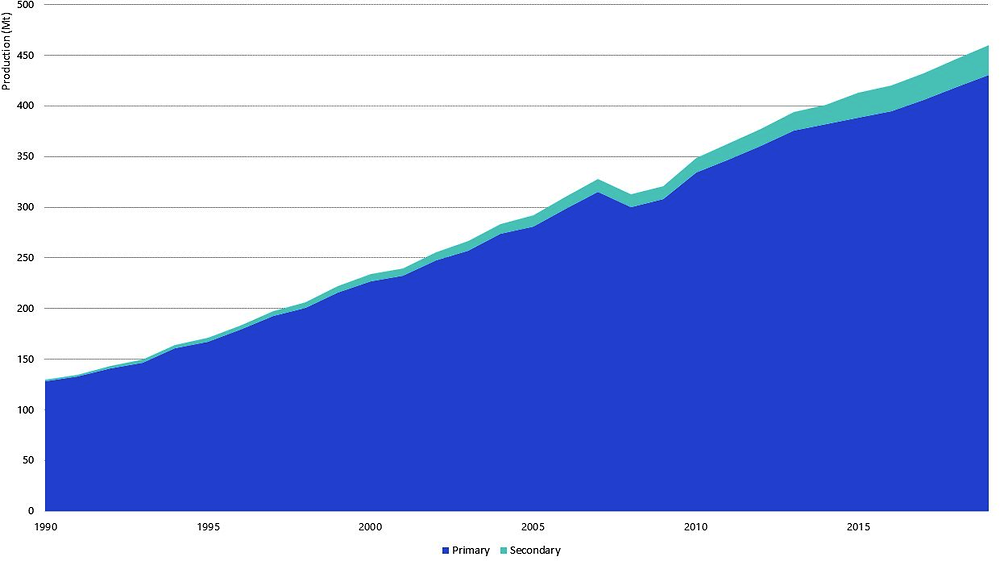
Source: OECD Global Plastics Outlook Database, https://doi.org/10.1787/c0821f81-en.
There are regional differences in secondary production capacity. The Asia-Pacific region is the largest producer by weight, followed by Europe and North America. Recycling is likely to continue increasing in Asia-Pacific due to growing infrastructure development as well as low labour costs. Introducing more advanced technology and upscaling operations could further improve the quantity and quality of the supply of secondary plastics in these markets. In Europe growth is expected due to policies such as recycled content standards that favour the production and use of secondary plastics (Grand View Research, 2020[20]).
Economically, there are several drivers of and barriers to secondary production. Historically, secondary material has often been used by manufacturers as a (low-cost) substitute for primary plastic. As a result the price of secondary plastics correlated with the price of primary plastic equivalents. This absence of a separate demand for secondary material affects the viability of recycling, since secondary material prices do not fully reflect the costs of secondary production (e.g. collection, sorting, and processing), but follow price patterns of primary plastics and their inputs (e.g. oil prices). This leaves secondary plastics markets exposed to price fluctuations in primary plastics markets. As well, compared with firms that produce primary plastics, recycling firms produce less material, are less capital-intensive and have fewer sales making them less resilient (Table 4.3). These differences between primary and secondary markets suggest that secondary markets are relatively small and vulnerable (OECD, 2018[5]).
Another barrier to the growth of secondary plastics is the quality of the plastic waste collected. The wide range of polymers and additives (including hazardous chemicals) used in the manufacture of plastics means that polymers in plastic waste are often co-mingled and contaminated (see Annex A for more details). Moreover, if not sorted properly and kept apart from other waste streams such as organic waste, collected plastic waste is of little value for secondary material production due to the difficulty of extracting impurities and the limited range of potential applications for low-grade recycled material.
Regulation strongly affects the business case for recycling activities and the market for secondary plastics. High landfill and incineration taxes are strong drivers of recycling, as are landfill bans. However, if not accompanied by strong environmental standards and enforcement, the risk is that waste will continue to be dumped, incinerated or mismanaged, weakening recycling rates (OECD, 2018[5]).
4.4.1. Policy frameworks are being strengthened
Public authorities are strengthening policy frameworks to both restrain the demand for primary plastics (Chapter 6) and to replace primary plastics with secondary material in applications where plastics are the optimal material. Previous OECD work evaluated 51 policy interventions to improve secondary plastics markets (OECD, 2018[5]) that remain highly relevant. To summarise, policies can foster secondary markets and increase their resilience in three ways:
Demand-“pull” measures, such as recycled content standards or green public procurement can increase the demand for secondary materials.
Supply-“push” measures, such as extended producer responsibility (EPR) schemes or research and development funds for recycling technologies can lower costs and improve the quality of supply. Eco-design and information requirements, such as design standards for disassembly and information requirements or bans of hazardous substances can further improve the quality of supplied secondary materials (Box 4.2). Landfill and incineration taxes are further policies that incentivise recycling.
Policies that aim to ensure that the price of primary plastic includes the external costs of primary production can level the playing field for recycling. Examples include taxes on primary production, and reforming support for fossil fuel production and consumption.
In many countries there are strict requirements on the use of recycled plastics for food-grade material. For example, in the European Union only recycled PET sourced from previous food contact material is allowed to be used for food-grade applications (European Union, 2008[27]). For PET1 or high-density polyethylene (HDPE), these requirements can be met by selectively collecting beverage containers and milk bottles, but this is more challenging for many other polymer streams as they are often collected together with non-food-grade material (Victory, 2020[28]).
Current design and waste collection practices only provide small amounts of the high-quality material that meets the regulatory requirements. In the medium and long term, growing demand for secondary plastics and subsequent price increases can encourage better supply quality and quantity.
Design requirements can help to improve the quality of plastics, enabling recycling for higher end secondary use. Examples of such policies include bans or clear marking of hazardous additives. In addition, policies that incentivise design for disassembly can enable greater flexibility for both re-use and recycling.
← 1. PlasticsEurope considers all PET resin grades placed on the EU market to be food-contact approved (EFSA CONTAM Panel, 2016[29]).
Three recent policy developments are worth further consideration for their potential to shift the demand and supply from primary to secondary plastics:
An increasing number of countries are introducing mandatory minimum recycled content standards or similar incentives. For instance, the EU’s Single-Use Plastics Directive will require plastic bottles to contain at least 25% recycled content by 2025 and 30% recycled content by 2030 (European Union, 2019[30]). From 2022, California’s Assembly Bill No. 793 will require a minimum share (up to 50% in 2030) of post-consumer recycled plastic in plastic beverage containers (California Legislative Information, 2020[31]). Also from 2022, the UK will apply a tax (GBP 200 per tonne) on plastic packaging with less than 30% recycled material (HM Revenue & Customs, 2020[32]). These policies aim to “pull” demand for secondary plastics though requirements or incentives for the composition of products or packaging. In turn, demand can help to instigate improved supply of secondary material as an input for regulated products.
In addition, several countries are planning to tax non-recycled plastic waste. The European Union introduced a levy on its Member States of EUR 0.8 for every kilogramme of non-recycled plastic packaging waste generated. This levy is in place since 1 January 2021 and is likely to lead to the introduction of a round of related national taxes in the coming years (European Commission, 2021[33]). For example, Italy and Spain have each announced they will introduce national taxes on non-recycled, single-use plastic packaging (KPMG, 2020[34]). Market-based instruments, such as these can help to increase the cost of waste management options that compete with recycling, lowering its relative cost. These measures can be a “push” for recycling by increasing the quantity of material collected for recycling.
Voluntary corporate commitments may help to generate significant additional demand for recycled post-consumer household polymers of high quality and purity. In recent years, leading brand-owners of fast-moving consumer goods and other sectors have made an increasing number of commitments to incorporate post-consumer recycled material in their products. Examples include the Ellen MacArthur Foundation’s New Plastics Economy Global Commitment and the European Circular Plastics Alliance (Ellen MacArthur Foundation, 2021[35]; European Commission, 2021[36]). If these commitments are realised, they will substantially increase demand for recycled plastics, especially for food-grade secondary material.
4.4.2. The prices of some secondary plastic grades seems to be decoupling from primary equivalents
The European PET market suggests that the combination of policy instruments and recent industry commitments discussed above may be creating a specific demand for recycled polymers at prices that are less dependent on the prices of substitutes (Brown and Kinner, 2020[37]). From 2018, the difference between the reported price of secondary food-grade PET pellets and the spot price of a primary equivalent has grown to over EUR 600/tonne in 2020 (Victory, McGeough and Tudball, 2021[38]). The difference suggests some decoupling of primary and secondary prices in this market, especially for food-grade applications. This specific demand for secondary material should mean prices better reflect the underlying costs and should make demand less volatile, which should further boost recycling and secondary material supply.
4.4.3. Innovation in recycling is on the rise
The interest of entrepreneurs and investors in the circular use of plastics is also picking up. The total number of patents for environmentally relevant plastic innovation rose by a factor of 3.4 between 1990 and 2017 (for details see Chapter 5). In addition, new patents are increasingly focusing on waste prevention and recycling, with about half of all patented plastic innovations in 2017 having a focus on these areas. Changes in consumer priorities and an increasing policy emphasis on plastic recycling seem to have improved the business case for investments in new recycling technologies and projects (Box 4.3).
The business case for investing more in recycling has until recently been undermined by the low prices of primary material (in part due to their external costs), the high cost of recycling and competition with other disposal options. The following emerging shifts should improve the viability of secondary plastics:
Growing public awareness of plastic leakage is driving policy interventions and voluntary commitments from the private sector and strengthening the demand for recycled material.
Technological advances are lowering recycling costs, improving the quality (i.e. price) of secondary plastic material and expanding commercial recycling to more polymers and waste streams.
Demand for plastics (and demand for feedstock for plastic production) is starting to grow, especially in emerging economies.
A growing use of policies internalises the external costs of primary plastic production and alternative waste disposal options.
However, the following developments could reduce the viability of secondary plastics:
Investment in capital-intensive waste-to-energy infrastructure establishes a long-term constant demand for incineration, which could create a “lock-in” effect and lower the incentive to launch recycling projects.
Technological advances in extraction or oversupply reduce the price of fossil fuels, driving down the relative price of primary plastics.
4.4.4. Trade in plastic waste is expected to keep falling in the near future
International trade in plastic waste and scrap can enable economic efficiencies by moving materials to countries with a comparative advantage in recycling plastic. For example, markets in Asia – particularly China and India – can produce secondary material cheaply due to lower labour costs and a well-developed recycling infrastructure (Locock et al., 2017[24]). China has historically been the predominant export destination for many OECD countries, largely for these reasons, as well as a high demand for (secondary) plastics by its manufacturing sector. In addition, the availability of inexpensive shipping to China, driven by the country’s trade surplus and its prominent role in global manufacturing supply chains, has facilitated export flows to China (Wang et al., 2020[39]; Merrington, 2017[40]). The economies of scale that such trade enables are likely to be an essential tool for strengthening secondary markets and bridging (part of) the gap in production between primary and secondary plastics.
On the other hand, trade in waste may lead to environmental leakage, if it is motivated by differences in the stringency or enforcement of environmental regulation (e.g. lower environmental standards for contaminated or hazardous plastic waste treatment) (Yamaguchi, 2018[41]; Kellenberg, 2012[42]). Some export destinations have experienced a serious influx of plastic waste that is heavily contaminated and hard to recycle. A share of this waste is treated by the informal waste management sector, which can lead to environmental and health issues (Box 4.1).
Global waste trade peaked in 2014, but then started to decrease following the introduction of strict import requirements by China (Figure 4.2 and Box 4.4). Since 2013, China has imposed several drastic restrictions on imported plastic waste in order to increase quality, reduce waste leakage and promote recycling of domestically-collected waste. The “Green Fence” policy began in 2013 and banned imports of mixed plastic waste that contained more than 1.5% contamination with non-recyclables (Velis, 2014[43]). Since 2017, the “National Sword” policy has tightened this restriction to 0.5% contamination (Wang et al., 2020[39]; Brooks, Wang and Jambeck, 2018[44]). As these new levels are challenging for industry to meet, the policy effectively banned the vast majority of waste exports to China.
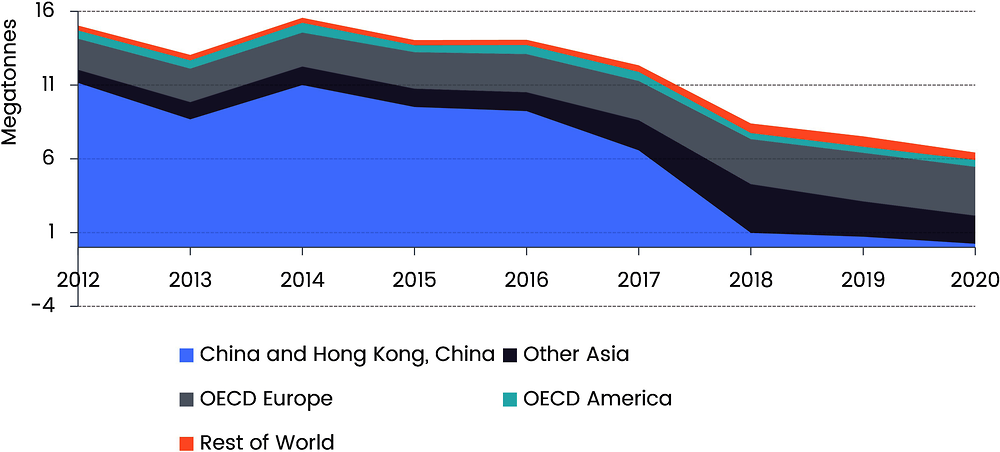
Note: Other Asia is based on country groupings in the OECD ENV-Linkages model and does not include OECD member countries Japan and Korea. OECD America includes Canada, USA, Chile, Colombia, Costa Rica and Mexico. See Table A.A.2 in Annex A for more information on regional aggregations. The graph shows annual data of Harmonised Code (HS) 3915 “Waste, parings and scrap, of plastics” from UN Comtrade. For 2016-18, the sum of monthly reported data for HS 391510, HS 391520, HS 391530 and HS 391590 are used for US reported exports. This is to address a possible gap in annual data, as described by Law et al (2020[45]).
Source: Authors’ analysis based on UN Comtrade Database, https://comtrade.un.org, accessed 12 October 2021.
Between 2014 and 2020, the global share of plastic waste exported in overall plastic waste generated declined from about 5.3% (15.6 Mt exported out of 296.2 Mt waste generated) to roughly 1.8% (6.4 Mt exported out of 359.9 Mt generated). Changes in Chinese policy were especially disruptive for Australia and New Zealand, as well as for Japan and Korea, all of which were heavily reliant on exporting plastic waste (Figure 4.3).
The rapid reduction in waste trade, combined with the steady increase in plastic waste, has induced a sudden surge in other outlets: domestic recycling, domestic disposal, domestic stockpiling, or unreported trade. Initially, many companies stockpiled waste for domestic processing or for exporting at a later stage. However, the combination of the sudden restrictions in exports and the short-term recycling capacity limitations has likely lead to a significant amount of plastic waste being disposed of through incineration and landfilling.
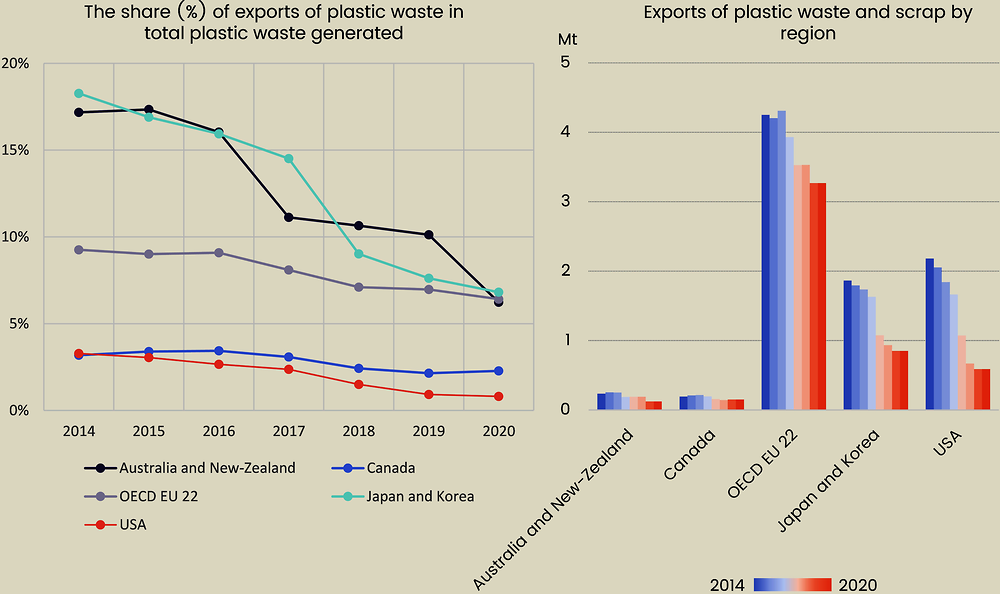
Note: The share is a ratio of the Harmonised Code (HS) HS 3915 “Waste, parings and scrap, of plastics” reported by exporters (reporters), organised by region, to the total weight of plastic waste generated estimated by the OECD ENV-linkages model. For 2016-2018, the sum of monthly reported data for HS 391510, HS 391520, HS 391530 and HS 391590 are used for US reported exports.
Source: Own analysis based on UN Comtrade Database, https://comtrade.un.org, accessed 12 October 2021; and OECD Plastics Outlook Database.
Trade restrictions, like those introduced by China, shift trade patterns and the demand for domestic processing. Table 4.4 summarises the most relevant opportunities and risks linked to trade restrictions.
Following the closure of the Chinese market, global trade declined and export flows shifted to other countries, mostly in Southeast Asia (Wang et al., 2020[39]). Exports of plastic waste to a number of destinations increased substantially from early 2017 to mid-2018: Indonesia (218%), Malaysia (440%), Thailand (1141%), Turkey (314%), and Vietnam (203%) (Figure 4.4). Substantial increases in imports in such a short period put immense pressure on local recycling and waste management capacity. The increase in exports to these destinations coincided with an increase in the detection of illegal landfilling, waste fires and unlicensed recycling operations. As imported material is more frequently pre-sorted and of higher value than domestically sourced waste in these countries, the increased imports have likely pushed some domestic waste sources to be (illegally) disposed of in a context of limited recycling capacities (INTERPOL, 2020[46]).
In response to the growing pressures from imported plastic waste on customs offices and domestic treatment, several emerging export destinations have set their own restrictions and bans (Box 4.4). Malaysia, Thailand and Viet Nam all implemented import restrictions over the course of 2018. This led to decreases in exports to these countries in the second half of 2018 (Wang et al., 2020[39]). In 2019, India also banned imports of plastic waste (Staub, 2019[48]). Exports to Malaysia, Viet Nam and most notably Turkey, continued to rise again in 2019. In spring 2021, Turkey introduced an import ban for some types of plastic waste, which was subsequently replaced by an enhanced licensing system (Republic of Turkey, 2021[49]).
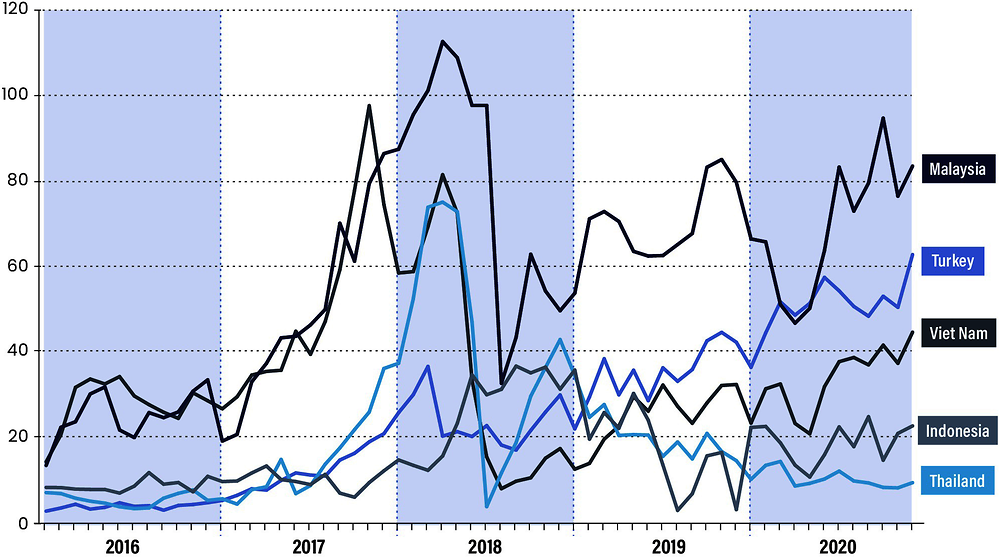
Source: Own analysis based on monthly data of Harmonised Code (HS) 3915 “Waste, parings and scrap, of plastics” from UN Comtrade (UN Comtrade, n.d.[50]), UN Comtrade Database, https://comtrade.un.org, accessed 12 October 2021.
The continued demand for feedstock materials in China has triggered foreign investment by Chinese recycling firms in other Asian states. Whilst waste processing has shifted to other countries, China often remains the ultimate destination for much of the processed secondary plastic material (Morita and Hayashi, 2018[51]; Toloken, 2020[52]). Exemplifying China’s shift from an importer of plastic waste to an importer of processed secondary plastics, Chinese imports of secondary pellets grew from 10 000 tonnes per month before scrap import restrictions were introduced, to around 400 000 tonnes per month in 2018 (Taylor, 2018[53]).
In addition to unilateral trade restrictions, recent amendments to the Basel Convention and OECD Council Decision 0266 to address environmental concerns stemming from the lack of environmentally sound management of imported plastic waste came into force in 2021:
The Conference of the Parties (COP) to the Basel Convention on the Control of Transboundary Movements of Hazardous Wastes and Their Disposal (the Basel Convention) adopted amendments to Annexes II, VIII and IX to restrict the transboundary movement of certain plastic waste unless it is almost free of contamination and destined for recycling in an environmentally sound manner (Secretariat of the Basel Convention, 2020[54]).
The OECD Decision of the Council on the Control of Transboundary Movements of Wastes Destined for Recovery Operations [OECD/LEGAL/0266] (the OECD Decision), which is closely interlinked with the Basel Convention and allows for facilitated intra-OECD waste shipments, was subsequently also amended, enabling OECD Member Countries to control non-hazardous plastic waste in line with their domestic legislation and international law (OECD, 2020[55]).
These amendments have expanded the plastic waste types that are subject to trade restrictions and have also fragmented the rules for intra-OECD trade. The additional heterogeneity in trade rules will likely raise compliance costs for waste traders and increase complexity for enforcement organisations. Taken together these developments are likely to further reduce trade volumes of affected plastic waste in the short term. Conversely, the stricter rules could help to reduce trade in problematic and hard-to-recycle (i.e. highly mixed or contaminated) plastic waste, lowering plastic leakage to the environment. Indirectly, the trade rules also help incentivise better collection and sorting practices, which can improve the efficiency of recycling in the long-term.
References
[3] Benavides, P. et al. (2018), “Exploring Comparative Energy and Environmental Benefits of Virgin, Recycled, and Bio-Derived PET Bottles”, ACS Sustainable Chemistry & Engineering, Vol. 6/8, pp. 9725-9733, https://doi.org/10.1021/acssuschemeng.8b00750.
[44] Brooks, A., S. Wang and J. Jambeck (2018), “The Chinese import ban and its impact on global plastic waste trade”, Science Advances, Vol. 4/6, https://doi.org/10.1126/sciadv.aat0131.
[37] Brown, A. and C. Kinner (2020), Will Coronavirus Change The Course Of Plastic Circularity?, https://www.woodmac.com/news/opinion/will-coronavirus-change-the-course-of-plastic-circularity/ (accessed on 5 October 2020).
[31] California Legislative Information (2020), Bill Text - AB-793 Recycling: plastic beverage containers: minimum recycled content., https://leginfo.legislature.ca.gov/faces/billTextClient.xhtml?bill_id=201920200AB793 (accessed on 20 October 2021).
[25] Clews, R. (2016), Project Finance for the International Petroleum Industry, Elsevier Inc., https://doi.org/10.1016/C2013-0-13683-5.
[8] CWG and GiZ (2011), “The Economics of the Informal Sector in Solid Waste Management: Economic Aspects of the Informal Sector in Solid Waste Management”, https://www.giz.de/en/downloads/giz2011-cwg-booklet-economicaspects.pdf (accessed on 23 July 2021).
[21] Deloitte (2019), Economic Study of the Canadian Plastic Industry, Market and Waste, http://publications.gc.ca/collections/collection_2019/eccc/En4-366-1-2019-eng.pdf (accessed on 26 February 2021).
[29] EFSA CONTAM Panel (2016), “Statement on the presence of microplastics and nanoplastics in food, with particular focus on seafood”, EFSA Journal, Vol. 14/6, p. 30, https://doi.org/10.2903/j.efsa.2016.4501.
[35] Ellen MacArthur Foundation (2021), Global Commitment - New Plastics Economy, https://www.newplasticseconomy.org/projects/global-commitment (accessed on 21 September 2021).
[17] Ellen MacArthur Foundation (2016), “The New Plastics Economy: Rethinking the future of plastics”, Ellen MacArthur Foundation January.
[36] European Commission (2021), Circular Plastics Alliance, https://ec.europa.eu/growth/industry/policy/circular-plastics-alliance_en (accessed on 21 September 2021).
[33] European Commission (2021), Plastics own resource, https://ec.europa.eu/info/strategy/eu-budget/long-term-eu-budget/2021-2027/revenue/own-resources/plastics-own-resource_en (accessed on 1 February 2022).
[30] European Union (2019), DIRECTIVE (EU) 2019/904 OF THE EUROPEAN PARLIAMENT AND OF THE COUNCIL on the reduction of the impact of certain plastic products on the environment, https://eur-lex.europa.eu/legal-content/EN/TXT/PDF/?uri=CELEX:32019L0904&from=EN (accessed on 21 September 2021).
[27] European Union (2008), COMMISSION REGULATION (EC) No 282/2008 on recycled plastic materials and articles intended to come into contact with foods and amending Regulation (EC) No 2023/2006, https://eur-lex.europa.eu/legal-content/EN/TXT/PDF/?uri=CELEX:32008R0282&from=EN (accessed on 21 September 2021).
[14] Garcia, J. and M. Robertson (2017), The future of plastics recycling, American Association for the Advancement of Science, https://doi.org/10.1126/science.aaq0324.
[20] Grand View Research (2020), Recycled Plastics Market: Market Analysis.
[7] Gunsilius, E. (2011), “The role of the informal sector in solid waste management and enabling conditions for its integration experiences from GTZ”.
[19] Hann, S. and T. Connock (2020), Chemical Recycling: State of Play, Eunomia, https://www.eunomia.co.uk/reports-tools/final-report-chemical-recycling-state-of-play/ (accessed on 21 September 2021).
[16] Hatti-Kaul, R. et al. (2020), “Designing Biobased Recyclable Polymers for Plastics”, Trends in Biotechnology, Vol. 38/1, pp. 50-67, https://doi.org/10.1016/j.tibtech.2019.04.011.
[32] HM Revenue & Customs (2020), Plastic packaging tax - GOV.UK, https://www.gov.uk/government/publications/introduction-of-plastic-packaging-tax/plastic-packaging-tax (accessed on 4 May 2021).
[15] Hundertmark, T. et al. (2018), Recycling and the future of the plastics industry, https://www.mckinsey.com/industries/chemicals/our-insights/how-plastics-waste-recycling-could-transform-the-chemical-industry (accessed on 21 September 2021).
[2] Ilyas, M. et al. (2018), Plastic waste as a significant threat to environment - A systematic literature review, De Gruyter, https://doi.org/10.1515/reveh-2017-0035.
[46] INTERPOL (2020), Emerging criminal trends in the global plastic waste market since January 2018, INTERPOL, Lyon, http://www.INTERPOL.int.
[11] ISO (2016), ISO 14021:2016 Environmental labels and declarations - Self declared environmental claims (Type II environmental labelling), https://www.iso.org/obp/ui/#iso:std:iso:14021:ed-2:v1:en:sec:7.8.1.1 (accessed on 2 March 2021).
[42] Kellenberg, D. (2012), “Trading wastes”, Journal of Environmental Economics and Management, Vol. 64/1, pp. 68-87, https://doi.org/10.1016/j.jeem.2012.02.003.
[34] KPMG (2020), EU: Review of the proposal for plastic tax, environmental-related measures, https://home.kpmg/us/en/home/insights/2020/09/tnf-eu-review-porposal-plastic-tax-environmental-related-measures.html (accessed on 4 May 2021).
[45] Law, K. et al. (2020), “The United States’ contribution of plastic waste to land and ocean”, Science Advances, Vol. 6/44, https://doi.org/10.1126/sciadv.abd0288.
[47] Leigh Mills, S., C. Van der Ven and C. Bodouroglou (2020), Sustainable Trade in Resources: Global Material Flows, Circularity, and Trade, United Nations Environment Programme, Nariobi, Kenya, https://www.unep.org/resources/publication/sustainable-trade-resources-global-material-flows-circularity-and-trade (accessed on 10 December 2020).
[24] Locock, K. et al. (2017), The Recycled Plastics Market: Global Analysis and Trends Copyright and disclaimer, https://publications.csiro.au/rpr/pub?pid=csiro:EP19308 (accessed on 29 September 2020).
[6] Medina, M. (2008), The informal recycling sector in developing countries, https://ppp.worldbank.org/public-private-partnership/library/informal-recycling-sector-developing-countries (accessed on 23 July 2021).
[40] Merrington, A. (2017), “Recycling of Plastics”, in Applied Plastics Engineering Handbook: Processing, Materials, and Applications: Second Edition, Elsevier Inc., https://doi.org/10.1016/B978-0-323-39040-8.00009-2.
[51] Morita, Y. and S. Hayashi (2018), “Proposals to Strengthen Japan’s Domestic Measures and Regional Cooperation on Stable and Environmentally Sound Plastic Scrap Recycling: Response to China’s Ban on Imports of Plastic Scrap”, IGES Policy Brief, Vol. 41, https://www.iges.or.jp/en/pub/proposals-strengthen-japan’s-domestic-measures/en.
[55] OECD (2020), Full summary of the amendments to the OECD Council Decision, https://www.oecd.org/environment/waste/Full_summary_of_the_amendments_to_the_OECD_Council_Decision.pdf (accessed on 26 October 2020).
[5] OECD (2018), Improving Markets for Recycled Plastics: Trends, Prospects and Policy Responses, OECD Publishing, Paris, https://dx.doi.org/10.1787/9789264301016-en.
[26] Oestreich, J. et al. (2020), Der Abfalls der Anderen – Über die Verantwortung für die Plastikflut in Asien, https://polyproblem.org/wp-content/uploads/POLYPROBLEM-%E2%80%93-Wertsachen.pdf (accessed on 1 March 2021).
[22] Plastic Waste Management Institute (2019), An introduction to plastic recycling 2019, http://www.pwmi.or.jp/ei/plastic_recycling_2019.pdf (accessed on 26 February 2021).
[12] Plastics Europe (2019), The Circular Economy for Plastics: A European Overview, https://www.plasticseurope.org/en/resources/publications/1899-circular-economy-plastics-european-overview (accessed on 2 March 2021).
[23] Polymer Properties Database (2018), Top 10 Plastic Resin Producers, Polymer Database, https://polymerdatabase.com/Polymer%20Brands/Plastic%20Manufacturers.html (accessed on 6 October 2020).
[18] Ragaert, K. et al. (2021), “(forthcoming) A stock take on the technological state-of-the-art for the recycling of plastics ”.
[49] Republic of Turkey (2021), ÇEVRENİN KORUNMASI YÖNÜNDEN KONTROL ALTINDA TUTULAN ATIKLARIN İTHALAT DENETİMİ TEBLİĞİ (ÜRÜN GÜVENLİĞİ VE DENETİMİ: 2022/3), https://www.resmigazete.gov.tr/eskiler/2021/12/20211231M4-2.htm (accessed on 22 September 2021).
[54] Secretariat of the Basel Convention (2020), Basel Convention Plastic Waste Amendments, http://www.basel.int/Implementation/Plasticwaste/PlasticWasteAmendments/Overview/tabid/8426/Default.aspx (accessed on 22 December 2020).
[48] Staub, C. (2019), “Plastic shipments to India stall as ban draws near”, Plastics Recycling Update, https://resource-recycling.com/plastics/2019/08/14/plastic-shipments-to-india-stall-as-ban-draws-near/ (accessed on 4 December 2020).
[53] Taylor, B. (2018), “Is China’s shift to plastic pellet imports gaining steam?”, Recycling Today, https://www.recyclingtoday.com/article/china-recycled-plastic-pellet-imports-2018/#:~:text=%E2%80%9CChina's%20imported%20%5Brecycled%2Dcontent,soared%2C%E2%80%9D%20states%20the%20group.
[52] Toloken, S. (2020), “New limits from China on recycled pellets ‘real threat’”, Plastics News, https://www.plasticsnews.com/news/new-limits-china-recycled-pellets-real-threat (accessed on 5 October 2020).
[13] Toowoomba Region (2020), Definition of domestic waste versus commercial waste, https://www.tr.qld.gov.au/environment-water-waste/waste-recycling/waste-facilities-rubbish-tips/7413-what-is-domestic-waste (accessed on 2 March 2021).
[50] UN Comtrade (n.d.), Un Comtrade, United Nations Statistical Office, https://comtrade.un.org/ (accessed on 5 October 2020).
[43] Velis, C. (2014), Global recycling markets - plastic waste: A story for one player – China.
[9] Velis, C. and E. Cook (2021), “Mismanagement of Plastic Waste through Open Burning with Emphasis on the Global South: A Systematic Review of Risks to Occupational and Public Health”, Environmental Science & Technology, Vol. 55/11, pp. 7186-7207, https://doi.org/10.1021/acs.est.0c08536.
[28] Victory, M. (2020), Insight: recycling chain facing deeply challenging times but investment opportunities remain, Independent Commodity Intelligence Services , London, https://www.icis.com/explore/resources/news/2020/05/19/10509185.
[38] Victory, M., H. McGeough and M. Tudball (2021), 2021 Global Market Outlook Sustainability, https://www.icis.com/explore/resources/2021-global-market-outlook-sustainability-content/ (accessed on 28 January 2021).
[39] Wang, C. et al. (2020), “Structure of the global plastic waste trade network and the impact of China’s import Ban”, Resources, Conservation and Recycling, Vol. 153, https://doi.org/10.1016/j.resconrec.2019.104591.
[10] Wilson, D., C. Velis and C. Cheeseman (2006), “Role of informal sector recycling in waste management in developing countries”, Habitat International, Vol. 30/4, pp. 797-808, https://doi.org/10.1016/j.habitatint.2005.09.005.
[41] Yamaguchi, S. (2018), “International Trade and the Transition to a More Resource Efficient and Circular Economy: A Concept Paper”, OECD Trade and Environment Working Papers, No. 2018/03, OECD Publishing, Paris, https://dx.doi.org/10.1787/847feb24-en.
[4] Zheng, J. and S. Suh (2019), “Strategies to reduce the global carbon footprint of plastics”, Nature Climate Change, Vol. 9/5, pp. 374-378, https://doi.org/10.1038/s41558-019-0459-z.
[1] Zink, T. and R. Geyer (2018), “Material Recycling and the Myth of Landfill Diversion”, Journal of Industrial Ecology, Vol. 23/3, pp. 541-548, https://doi.org/10.1111/jiec.12808.
Notes
← 1. Mechanical recycling processes plastic waste by washing, shredding, melting, followed by re-moulding and is often blended with virgin material to form a finished product, typically in the form of pellets.
← 2. Chemical recycling processes plastic waste by applying chemical agents that break down waste material into its building blocks (either polymers, monomers or fuels).