copy the linklink copied!Use of primary care services
Primary care services are the main entry point into health systems. Indicators on the use of such services therefore provide a critical barometer of accessibility, with data disaggregated by income illustrating the degree of inequalities in access.
In terms of access to a doctor, on average just under 80% of individuals aged 15 or over reported visiting a doctor in the past year, adjusting for need (Figure 5.5). Note that need is modelled, rather than measured directly (see definition and comparability box). Furthermore, the probability of visiting a doctor may be lower in some countries because people make greater use of other types of health professionals, such as nurses. This is the case, for example, in Sweden, where other licensed healthcare professionals see patients that do not have a clear medical need for a doctor. Notwithstanding these issues, cross-country differences in utilisation are large, with need-adjusted probabilities of visiting a doctor ranging from around 65% in Sweden and the United States to 89% in France.
Socioeconomic inequalities in accessing a doctor are evident within almost all OECD countries. Excepting Denmark and the Slovak Republic, wealthier individuals are more likely to see a doctor than individuals in the lowest income quintile, for a comparable level of need. Pro-rich inequalities in doctor access are highest in Finland and the United States (over 15 percentage-points difference) but practically non-existent in the United Kingdom, Ireland and the Netherlands. Income inequalities in accessing doctors are much more marked for specialists than for general practitioners (OECD, 2019 [1]).
For dental care, only 63% of individuals aged 15 or over reported visiting a dentist in the past year, on average across 27 OECD countries (Figure 5.6). This is partly due to benefit design: public coverage for dental care is much lower than for hospital care or doctor consultations in many OECD countries (see indicator on “Extent of health care coverage”). Overall access to dental care ranged from 41% of people visiting a dentist in the United States, to 93% in Ireland. Socioeconomic disparities are large – on average, there is an almost 20 percentage-point difference in visits between high and low-income groups (72% of wealthier individuals visited a dentist, compared with 54% among those from the lowest income quintile). Inequalities are largest in Canada, Portugal and the United States (over 30 percentage-point difference); but almost zero in Ireland.
Uptake of cancer screening is also lower amongst the less well-off. This is despite most OECD countries providing screening programmes at no cost. For example, on average 79% of wealthier women had a Pap smear test for cervical cancer, as compared with 65% amongst women from the lowest income quintile (Figure 5.7). Wealthier people also have greater access to screening for both breast and colorectal cancer, though inequalities are less marked than for cervical cancer. Screening for cervical cancer is disproportionately low among the bottom income group in Sweden and Norway (over 30 percentage-point gap between income quintiles), but relatively equal in Ireland, Chile and Iceland. Overall uptake of cervical cancer screening ranged from just under 50% in the Netherlands, to over 85% in the Czech Republic and Austria. This applies to women aged 20 to 69 with a screening interval of three years. Note that some countries (e.g. the Netherlands) offer screening amongst a narrower age group and less frequently. This may result in lower screening rates but not necessarily worse performance. Countries offering nationwide population-based screening programmes have more equal access, as compared with countries where cancer screening happens in a more ad-hoc manner (Palencia, 2010[2])
Such observed problems in accessing health services, particularly for the less well-off, occur despite most OECD countries having universal or near-universal coverage for a core set of services (see indicator on “Population coverage for health care”). Part of the explanation are high cost sharing, exclusion of some services from benefit packages or implicit rationing of services. Limitations in health literacy, imperfect communication strategies, and low quality of care are also contributing factors.
The health care module of the European Health Interview Survey (EHIS) and of national surveys allows respondents to report on their utilisation of health care services, whether they have visited a GP, specialist or dentist in the past year, as well as their use of various screening services.
The probability of visiting a doctor is defined as having seen a GP or a specialist in the past year. However, the volume of care a person receives in itself does not accurately measure access, as people have varying health care needs. Need is not measured directly. Rather, predicted needs are modelled, and then the probability of visiting a doctor is adjusted by this value (see O’Donnell (2008[3]) for further methodological details). Here, four categorical variables are used to model predicted need: age, sex, self-rated health and activity limitations.
Cervical cancer screening is defined as the proportion of women aged 20-69 who have undergone a Pap smear test in the past 3 years.
References
[4] Moreira, L. (2018), “Health literacy for people-centred care: Where do OECD countries stand?”, OECD Health Working Papers, No. 107, OECD Publishing, Paris, https://doi.org/10.1787/d8494d3a-en.
[3] O’Donnell, O. (2008), Analyzing Health Equity Using Household Survey Data: A Guide to Techniques and Their Implementation, World Bank Group, Washington D.C., https://doi.org/10.1596/978-0-8213-6933-3.
[1] OECD (2019), Health for everyone? Social Inequalities in Health and Health Systems, OECD Health Policy Studies, OECD Publishing, Paris, https://doi.org/10.1787/3c8385d0-en.
[2] Palencia, L. (2010), “Socio-economic inequalities in breast and cervical cancer screening practices in Europe: influence of the type of screening program”, International Journal of Epidemiology, Vol. 39/3, pp. 757-765.
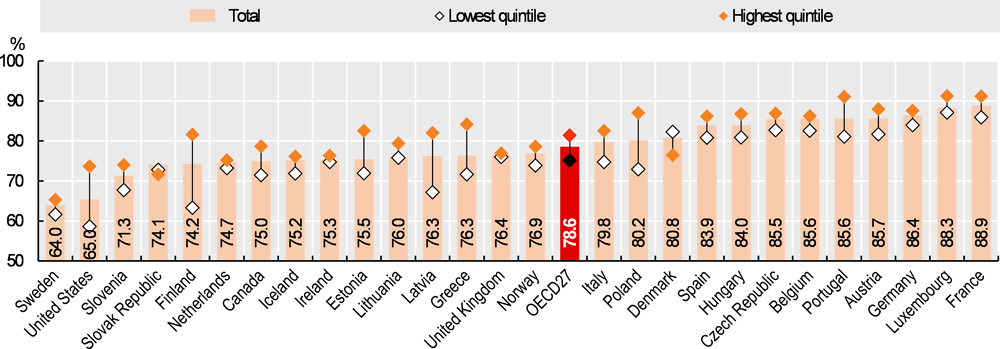
Source: OECD estimates based on EHIS-2 and other national survey data. In Sweden, the low number is explained in part by patients often visiting other healthcare professionals rather than doctors in primary care.
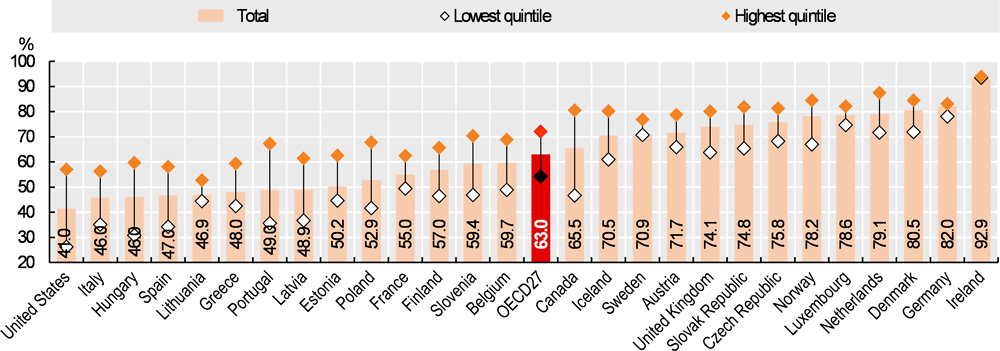
Source: OECD estimates based on EHIS-2 and other national survey data.
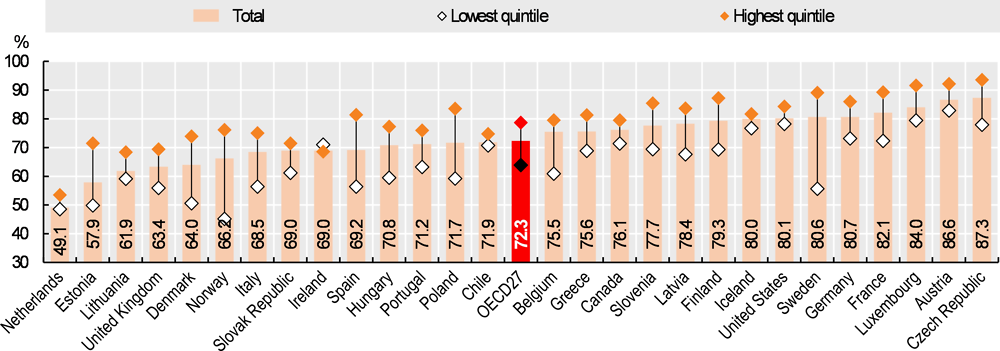
Source: OECD estimates based on EHIS-2 and other national survey data.
Metadata, Legal and Rights
https://doi.org/10.1787/4dd50c09-en
© OECD 2019
The use of this work, whether digital or print, is governed by the Terms and Conditions to be found at http://www.oecd.org/termsandconditions.