Chapter 4. Disruptions in non-urban passenger transport
This chapter assesses the impact of potential disruptions on non-urban passenger travel. Three disruptions are considered: a further expansion of low-cost aviation into long-haul services, the introduction of ultra-high-speed rail services and the large-scale availability of alternative fuels for aviation. Beyond the two scenarios outlining future pathways for transport under policies reflecting either current ambitions or high ambitions, three additional scenarios are examined. These look at the combined impacts of the potential disruptions identified for non-urban passenger transport and provide projections for the development of non-urban travel demand and its CO2 emissions to 2050.
Demand for non-urban passenger transport set to rise sharply
Non-urban travel is estimated to have made up nearly 60% of global passenger travel in 2015. Global demand for domestic and international passenger transport will increase by 225% between 2015 and 2050 if current trends continue. It will thus grow more than twice as fast as urban transport demand, which is projected to increase by 104% over the same period. The main drivers of this growth are rising incomes and population growth. It will be especially high in developing countries and for long-distance travel, for instance for non-urban domestic rail travel and international air travel.
In terms of CO2, non-urban passenger travel was responsible for about half of all passenger transport emissions in 2015. The projected demand growth will push the share of CO2 emissions from transport much higher: in 2050, it could represent two-thirds of all passenger transport CO2 emissions. A second factor in this growth is the lack of concrete decarbonisation policies for non-urban transport. This contrasts starkly with the many policy instruments in place that target the effects of car use and emissions in urban areas. Arguably, this policy gap exists because many downsides of urban mobility, such as congestion and air pollution, have a more immediate impact on people’s lives than those of non-urban transport.
For the purposes of this study, non-urban passenger travel consists of both international and domestic mobility. International travel involves trips between two countries by road (bus and car), rail and air. Domestic travel refers to non-urban trips within the same country. Domestic travel can be further split into travel between urban areas (inter-urban travel, carried out by road, rail or air), and regional travel (within the same region but originating outside urban areas, carried out by road and rail).
The non-urban transport sector has not seen major disruptions during the past few decades. The major change has been strongly growing demand since the early 2000s, especially for international air travel. This may change, however. Several disruptive developments could affect non-urban transport and inter-urban passenger travel in particular. Each of them may influence demand, mode choice or externalities to differing degrees, and not always in beneficial ways. Their impact will also depend on the political, social, geographical or economic context and therefore differ from country to country or region to region.
The following analysis considers three potential disruptions of non-urban passenger travel:
-
1. The expansion of low-cost airlines into long-haul aviation: Low-cost airlines already offer medium- and long-haul flights, but not to the extent that they are present in short-haul markets. An increase in the number of low-cost operators in long-haul markets could drive airfares down and further stimulate demand for international air travel.
-
2. The rise of ultra-high speed surface transport: Ultra-high speed surface transports such as Maglev and Hyperloop already exist or are in the planning phase in some parts of the world, but are not yet widely available. A potential extension of the current high speed rail (HSR) network and the construction of new surface links using Maglev and Hyperloop may generate new demand or divert demand from aviation, even if they are unlikely to become a large-scale alternative for air services (de Rus, 2008[1]).
-
3. The large-scale availability of alternative fuels in aviation: Alternative energy sources for aviation such as electricity or synthetic fuels offer the potential of carbon-free or zero net emissions aviation. This would enable the sector to grow even under a strict policy environment requiring aviation to drastically reduce its CO2 emissions reductions
The three primary disruptions examined in this chapter will not have a direct impact on road transport beyond modal shift. Carbon related costs will have a smaller impact on road travel as low-emission or no-emission options already exist for road vehicles. Other developments also stand to disrupt non-urban passenger transport in future years. Road transport, which represents nearly 40% of inter-urban trips, could be affected by developments such as autonomous and electric vehicles and shared mobility. In this Chapter, shared mobility for the non-urban context refers to carpooling or other sharing services that increase average vehicle occupancy. While the impact of these disruptions is likely to be smaller in non-urban travel compared to urban passenger travel, they should not be disregarded.
A range of potential policy decisions may also affect the cost of non-urban travel, and hence demand. Most notably, a growing awareness of the climate impacts of CO2 emissions is leading to policies to mitigate the externalities of burning fossil fuels. In the aviation sector, the International Civil Aviation Organization (ICAO) has adopted a new aircraft CO2 emissions standard (ICAO, 2017[2]) and is also implementing the Carbon Offsetting and Reduction Scheme for International Aviation, known as CORSIA (ICAO, 2016[3]). Under CORSIA, aircraft operators will collectively offset CO2 emissions that exceed a threshold based on the average level of CO2 emissions in 2019/20. CORSIA will become mandatory in 2026, following a trial phase between 2021 and 2023 and a voluntary phase from 2024 and 2026. A few exceptions will be made, for instance for least-developed countries.
The mitigation potential of transport policies for non-urban passenger travel
The International Transport Forum (ITF) has developed a global non-urban passenger transport model which assesses transport demand, mode shares and related emissions under various policy scenarios for non-urban passenger travel in all world regions to 2050.
The two main scenarios examined in this chapter are a current ambition scenario and a high ambition scenario. Both reflect the trends that may impact non-urban travel; they differ in their assumptions on the level of adoption of policies aiming to reduce CO2 emissions from non-urban travel. The current ambition scenario extrapolates the current trajectory of technologies and policies in a business-as-usual approach. Technological advances, policy decisions and investments occur as foreseen today according to existing measures as well as already-announced mitigation commitments. Open Skies policies follow current trends, while the share of seats offered by low-cost airlines remains stable. Overall aviation demand grows in line with GDP and population projections. Aircraft fuel efficiency improves and the relative cost of air travel falls over time following current trends and fuel costs.
Such policies raise transport costs for all modes that rely on fossil fuels. In the current ambition scenario, alternative energy sources remain too expensive to compete with fossil fuels, and electric aviation would only appear towards mid-century. With regard to surface modes, fuel efficiency standards are in place for car, bus and rail. Only currently planned high speed rail lines are built. The share of autonomous vehicles in non-urban travel remains marginal, while shared non-urban travel by private car see a marginal increase. These assumptions for surface travel are in line with the International Energy Agency’s New Policies Scenario (IEA, 2018[4])
The high ambition scenario reflects more advanced aspirations surrounding the deployment of technology and implementation of policies. The details of the two scenarios for non-urban travel are summarised in Table 4.1.
|
Table 4.1. Current and high ambition scenario specifications for non-urban transport
|
|||
|---|---|---|---|
|
Mitigation Measures |
|||
|
|
Carbon pricing |
USD 100 per tonne of CO2 |
USD 500 per tonne of CO2 |
|
|
Efficiency improvements and electric vehicles |
The share of electric vehicles in use varies between 0.4% and 17.4% for cars and between 1% and 31.7% for busses across regions |
The share of electric vehicles in use varies between 29.4% and 53.7% for cars and between 10.5% and 56.5% for busses across regions |
|
Potentially disruptive developments |
|||
|
|
Long-haul low-cost carriers |
Very low share of low-cost carriers o long-haul flights (current trend) |
Very low share of low-cost carriers on long-haul flights (current trend) |
|
|
Energy innovations in aviation |
Alternative fuel cost four times higher relative to 2015 conventional fuel prices Range of electric planes increases up to 1 000 km by 2050 |
Alternative fuel cost three times higher relative to 2015 conventional fuel prices Range of electric planes increases up to 1 600 km by 2050 |
|
|
Autonomous vehicles |
Share of autonomous vehicles in use varies between 0% and 2.5% for cars and 0% and 1.25% for busses across regions |
|
|
|
Shared mobility |
The percentage of shared trips of total car trips equals 6.7% |
The percentage of shared trips of total car trips varies between 13.3% and 20% across regions |
|
|
Ultra-high-speed rail |
High speed rail operational where current projects exist or are planned |
High speed rail operational where current projects exist or are planned |
|
Note: Values for electric vehicles based on IEA (2018[4]) for the current ambition scenario and IEA (2018[5]) for the high ambition scenario. |
|||


The carbon price for each scenario reflects a global average. In reality, the level of carbon pricing will vary between regions. Under the current ambition scenario, carbon taxation and offsets reach USD 100 by 2050. In the high ambition scenario, carbon-related prices reach USD 500 by 2050. This reflects greater mitigation ambitions outlined by international agreements and specific national governments. For instance, France aims to raise the price of one tonne of CO2 to EUR 250 by 2030 (Quinet, 2019[6]).
The previous ITF’s international aviation model has been extended to include all non-urban passenger mobility in all main passenger modes (except maritime passengers’ movements such as cruise shipping that are mainly recreational and not a derived transport activity).
The model separates the inter-urban traffic from the regional traffic not measured already in the urban passenger model. The inter-urban traffic is assessed using a four-step model approach that starts with the setting of the travel demand – propensity to travel (for different travel ranges), continues with destination choice, mode choice and finally route assignment. All this is developed under a unified model where surface modes can be used as “feeding” modes to aviation and the propensity to travel of all modes is inter dependent while allowing for modal transfers to occur.
The regional model results originate from a travel activity generation model; the travel demand is then split among the surface modes available in each region, given the local context variables (e.g. infrastructure, car ownership).The model is presented in more detail in Annex 4. The main changes can be summarised in the following:
-
1. Greater degree of disaggregation: The newest model has 1 191 centroids, which are the source of all intercity activity in the world. They were identified from all medium and large size airports in the world that have an international air traffic license. Airports are clustered in city airport codes, when they are considered as such by ICAO or when they are within 100 km of the main airport and within the same country.
-
2. Incorporation of national and regional traffic: The model is able to assess the development of domestic travel as well of the regional traffic and how they may be influenced by transport policies or exogenous factors.
-
3. Propensity to travel instead of propensity to fly: The model incorporates the concept of modal availability in several ranges of travel. It also examines mode alternatives that may occur in the future following the development of new transport infrastructure or changes in the cost of travel for any mode.
-
4. Intermodality: The access to an airport within a region may be performed by surface modes (e.g. rail, car or bus), which allows expanding the influence area of city airports and reduce some over estimation of seeding air travel.
Today’s policies will not decouple demand for non-urban transport from emissions
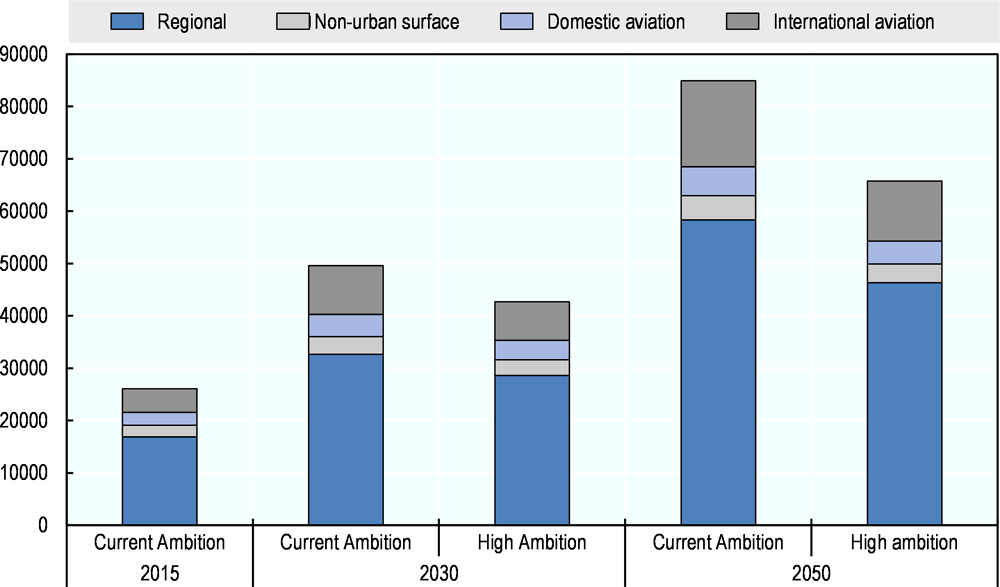
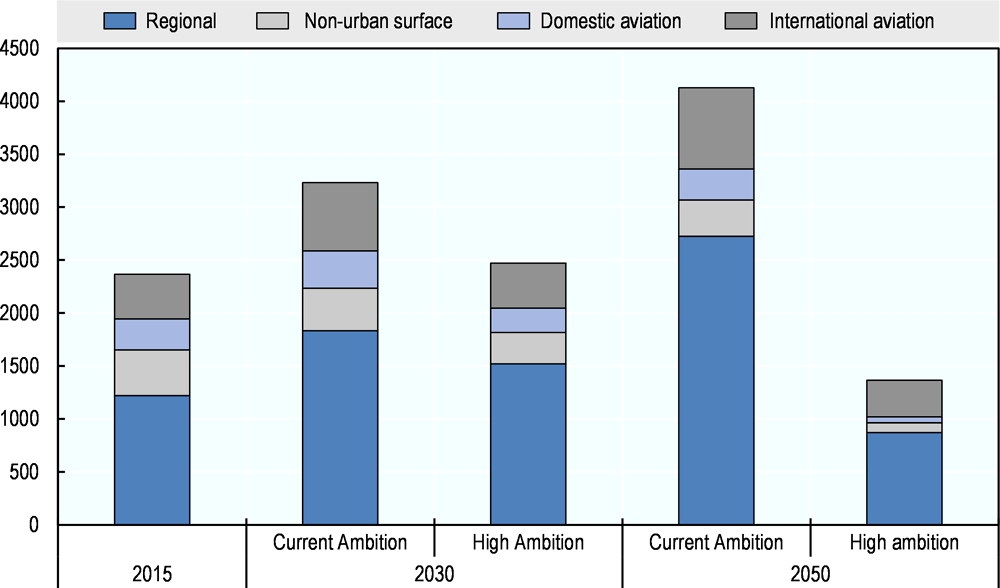
Total non-urban travel reached an estimated 26 000 billion p-km in 2015. Of these, 17 000 passenger-kilometres represent regional travel. By comparison, air travel represented 7 000 billion p-km. By 2050, the total number of passenger-kilometres travelled in a non-urban setting is estimated to reach 85 000 billion p-km, of which almost 60 000 billion would be regional travel. In terms of CO2 emissions, regional travel is responsible for 51% of all non-urban CO2 in 2015, a figure that grows to 67% by 2050.
As a result of existing policies and goals targeting improvements in fuel efficiency in all modes and increased electrification of surface modes, non-urban transport CO2 emissions are expected to grow significantly less than passenger-kilometres. In the current ambition scenario, non-urban travel grows by 225%, while CO2 emissions increase by 74%.
Regional travel is a major part of non-urban travel and the main driver of emissions in this scenario (Figure 4.1 and Figure 4.3). In the base year 2015, regional travel corresponds to two thirds of all non-urban travel demand, a figure that is expected to grow to 70% by 2050.
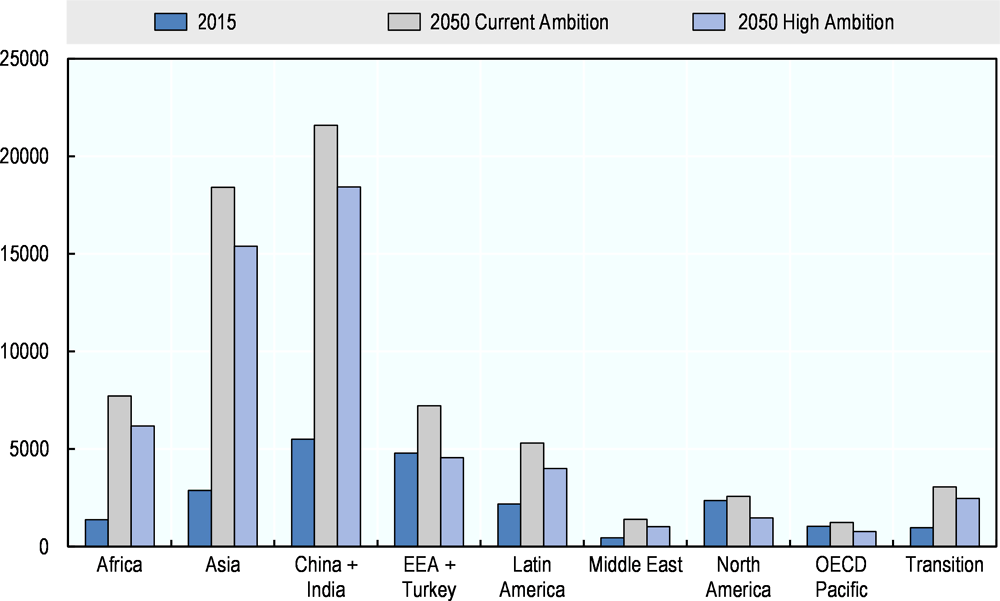
Domestic travel and emissions in non-OECD countries are set to increase drastically under assumptions of the current ambitions scenario. By 2050, domestic non-urban transport grows by 332% in non-OECD countries, driven by the growth of population and GDP. By comparison, the projected increase in OECD countries is only 35%.
The difference is even more pronounced in terms of CO2 emissions. The policies planned in OECD countries with regard to the vehicle fleet can reduce emissions by 40% compared to 2015 levels. Non-OECD countries are not able to address the growing demand despite technological developments in the current ambition scenario. As a result, total non-urban emissions increase by 181% to 2050. The strongest growth in both non-urban transport demand and CO2 emissions is expected in Asia (excluding India, the People’s Republic of China and OECD Pacific) and Africa (Figure 4.3). In Asia especially, non-urban travel and related emissions grow at the same rate. India and China would remain the biggest absolute contributor in both passenger-kilometres and emissions, but the rest of Asia is catching up fast in both parameters.
Aviation will see high growth in both domestic and international markets. Air travel demand is boosted by more Open Skies agreements (ITF, n.d.[7]) and relatively cheap air fares due to improved fuel efficiency of aircraft and stable long-term fuel price projections (IEA, 2018[5]).
International aviation reaches the highest compound annual growth rate of all non-urban travel modes, with 3.8% through 2050. Thus, international flights would provide a total of 16 500 billion p-km in the current ambition scenario that is 3.6 times the 2015 volume. Domestic aviation also grows fast, but less than international aviation since short-haul flights face direct competition from surface modes. Nevertheless, domestic aviation more than doubles volume to 2.2 times the 2015 level, reaching 5 520 billion p-km.
The air network grows with an average annual rate of 2.8% between 2015 and 2050. The highest growth is expected in developing countries, especially in Asia (excluding China and India). Despite aircraft fuel efficiency improvements in new generation aircraft, total aviation CO2 emissions in 2050 are estimated to be 49% higher than 2015, reaching 1 061 million tonnes. As surface modes are also experiencing massive growth in this scenario, the share of aviation emissions to the total non-urban emissions decreases from 30% in 2015 to 25% in 2050.
In terms of passenger numbers, Africa, Asia and Latin America will see the strongest increases to 2050, with demand driven by growing incomes. Almost 180 million passengers are expected to travel between these regions and North America in 2050, compared with 63 million in 2015. China and India generate the most new demand for international aviation in the current ambitions scenario; a finding in line with projections by the International Air Transport Association (IATA, 2016[8]) By 2050, almost one billion trips by air will originate from these two countries, compared to 130 million in 2015. Almost two thirds of this new demand is directed towards other Asian countries, however (Table 4.1). Aviation markets in developed economies, notably in particular Europe and North America, are already liberalised and saturated. In conjunction with competition from high speed rail, this limits the growth of aviation in these regions.
Passenger numbers for airports follow a similar pattern. Asian (especially Indian) and African airports will see the biggest share of passenger growth. In China, some airports may eventually become the world’s largest, with large cities like Beijing or Shanghai passing more than 500 million passengers annually. Latin American airports are also expected to grow significantly, mainly in large cities and tourism destinations such as the Caribbean islands and Peruvian cities.
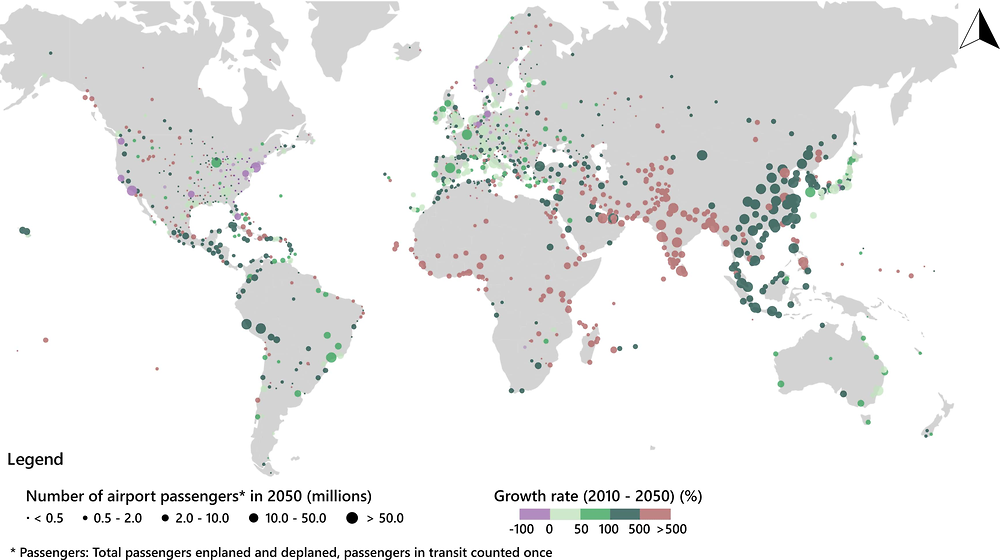
Passenger growth at European airports, on the other hand, could slow down compared to recent years. Some airports in northern European cities may even see a small decrease in passenger volumes. Reasons for the slow growth are demographic factors and the decreasing relevance of the hub-and-spoke model for intra-European air traffic. Airports in the United States could also face decreases traffic, mainly in the largest cities. A main factor here is the planned development of a high speed rail network in the US, which could absorb a significant share of domestic air traffic. A second factor is the greater prevalence of low-cost airlines which tend to avoid large airports and add direct connections between smaller airports.
A reduction of CO2 emissions from non-urban passenger transport is possible
The high ambition scenario assumes a set of policies and technological developments that likely reduce transport CO2 emissions to a greater extent than in the current ambition scenario. These policies make non-urban travel more costly (of USD 500 per tonne of CO2 on average) than in the current ambition scenario. This affects predominantly fossil fuel-dependent aviation, fostering a faster development and uptake of alternative energy sources for aviation, such as synthetic fuels and electric planes, ultimately enabling carbon-neutral aviation at competitive cost. Surface modes see no additional investments; the high speed rail network remains the same as in the current ambitions scenario, with only planned lines being built. The uptake of electric vehicles is accelerated and vehicle occupancy increases Generally, the assumptions regarding technology in the high ambition scenario follow the International Energy Agency’s 30@30 scenario (IEA, 2018[5]).
Demand for non-urban travel in the high ambition scenario is affected significantly by higher travel costs that result from the increased cost of emissions. Global non-urban travel globally will total 65 700 billion passenger-kilometres in 2050, a 22% reduction compared to the current ambition scenario. Higher fuel-related costs affect longer trips more strongly, as for these fuel is a bigger share of the total cost. Therefore the reduction is more pronounced for aviation, and especially international aviation which sees a 30% fall in p-km in 2050 compared to the current ambition scenario. All transport modes see a drop in total distance travelled, however.
As the cost of non-urban transport rises, demand for inter-urban travel is expected to decrease faster than demand for regional travel. Regional travel in the high ambition scenario in 2050 is estimated at 46 thousand billion passenger-kilometres, a 22% reduction compared to the current ambition scenario. Amongst regional travel, the biggest reduction occurs for car travel (25%). This is because regional travel consists mostly of travel that is essential for the livelihood of citizens residing outside of cities. Inter-urban travel, however, has a large tourism component which is not essential travel.
The more ambitious decarbonisation policies and the technology development assumptions of the high ambition scenario show a pathway for the decarbonisation of non-urban passenger transport. Despite a growth of non-urban travel by 150% under the high ambition scenario compared to 2015, CO2 emissions in 2050 are only 58% of those of the base year 2015. This reduction is the result of developments in both OECD and non-OECD countries. In OECD countries, the vehicle fleet is almost entirely electrified by 2050 and transport demand decreases by 18%. As a result, CO2 emissions form non-urban passenger transport reach only 14% of the 2015 level. In non-OECD countries, CO2 emissions fall by 10% over the same period - despite an increase in non-urban travel demand of 257%. These figures do not include international travel, where CO2 emissions fall by 25%, while travel in terms of passenger-kilometres increases 150%.
A possible solution for ending the dependency of aviation on fossil fuels is electric aviation, at least for short-haul flights. In the high ambition scenario, electric aircraft serve most short-haul routes up to 1 600 kilometres, so that these become true zero emission commercial air links, assuming that the electricity is generated from renewables. If synthetic aviation fuels also become available and cost competitive towards 2050, as the high ambition scenario assumes, the combined impact of these two developments would be impressive: Domestic aviation would produce only 20% of its 2015 CO2 emissions by 2050, despite a projected demand increase of 78% over the same period, Similarly, international aviation would succeed in reducing its CO2 emissions by 20% compared to 2015, despite a compounded annual growth rate of 2.7% that will take the sector 11 500 billion p-km travelled, up from 4 500 in 2015.
The average mass of passenger cars in the European Union has increased by around 40% over the past four decades. In 2015, a vehicle weighed on average 1 400 kg, compared to just under 1 000 kg in 1975. Additional mass consumes more energy and results in higher CO2. Hence, a reduction in vehicle mass can contribute to reduce CO2 emissions from vehicles.
A scenario for the impact of vehicle mass reductions developed by the International Transport Forum shows that CO2 emissions from light duty vehicles in 2050 may be 21% lower than in 1990 in the baseline scenario, due to increased fuel efficiency combined with a moderate uptake of electric vehicles. A gradual reduction of vehicle mass to 1 000 kg for new passenger cars and 1 100 kg for new light commercial vehicles results in a near doubling of the CO2 reduction compared to the baseline scenario: CO2 emissions fall by 39% compared to 1990. Around 85% of these reductions would come from passenger cars.
However, these reductions would not be sufficient for reaching the European Union’s target of a 60% reduction in road transport CO2 of these types of vehicles by 2050 compared to 1990 levels. The gap could be closed by a higher share of zero-emission passenger cars among new vehicles sold. If the share of zero-emission vehicles reached 64% for passenger cars and 68% for light commercial vehicles, EU emissions target could be attained.
Such mass reductions would entail a financial gain for consumers on top of the environmental benefits for society. Changes in fuelling and purchase costs alone would save consumers EUR 213 per tonne of CO2 not emitted. For light commercial vehicles the picture is less favourable because reducing vehicle mass is more costly and purchasing them therefore more expensive. Here, owners pay EUR 977 for each tonne of CO2 saved. Also the monetised environmental benefits would not outweigh the increased costs for the consumer.
Source: ITF (2017[9])
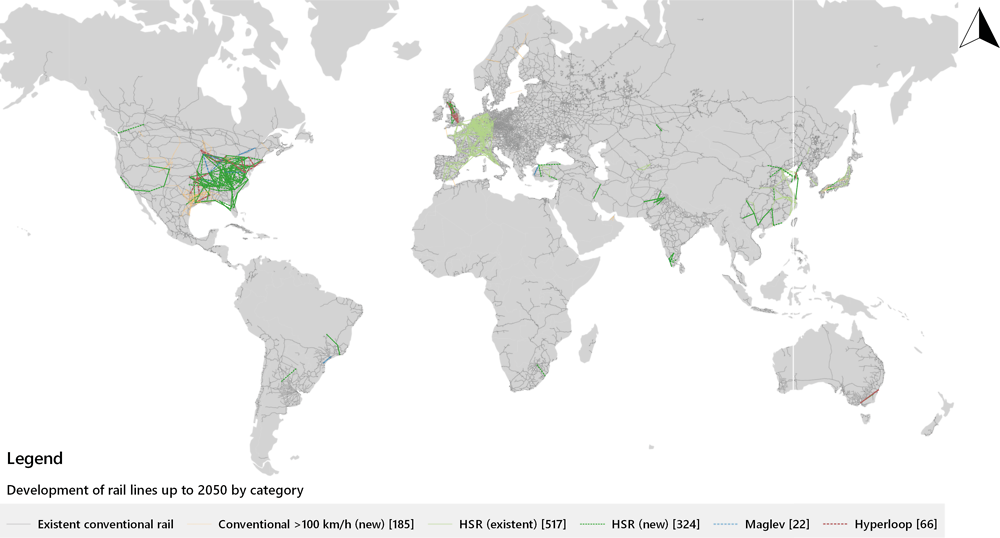
Ultra-high-speed rail

High speed rail has proven to be a flexible and attractive technology for users and has developed under different contexts and cultures. More than 43 000 kilometres of rail tracks were adapted to speeds of more than 250 km/h in 2018. High-speed rail systems were initially developed in Japan, with the Shinkansen in 1961, and then, starting from 1981, in Europe with the TGV in France. The first connections served large metropolitan areas within 200-400 km distance, i.e. routes where demand is high and high speed rail can be competitive with air transport.
Until 2010, the network was developing at a slow pace, with the great majority of the lines in Western Europe and Japan. Adoption has accelerated during the last decade. In particular, high-speed rail in China has developed rapidly over the past 15 years and covers 30 000 km of track today, 75% of the world total. Worldwide, 10 000 km of high speed rail lines are under construction, with an additional 40 000 km lines are planned or under discussion (UIC, 2018[10]).
Ultra-high speed (UHS) rail could be the next technological breakthrough, with the potential to disrupt current transport patterns. Whereas traditional high-speed rail systems use conventional wheel-to-steel technology with electric propulsion fuelled via overhead cables, UHS rail systems are based on electro-magnetic suspension. They could have operational speeds ranging in theory from 500 km/h to 1 200 km/h, compared to slightly above 300km/h for high speed rail. UHS trains are not new but there is a renewed interest in the topic, arguably because technological progress is foreseen in the near future. Two main types of UHS technologies exist today: Maglevs and Hyperloop.
Maglevs are trains operating solely via magnetic levitation. Maglev trains have been developed since the late 1960s in Germany and Japan with the aim of offering operational speeds of around 500 km/h. Although the technology has been used for a number of low-speed projects in the UK, Germany, Japan, and South Korea, high-speed Maglev systems have the most potential for changing current travel patterns in a significant way. Few high-speed Maglevs are currently in operation, but a large number of projects have been proposed in recent years. In China, a short high-speed Maglev line was opened in December 2003 between Shanghai Airport and the city’s Pudong financial district. In Japan, a high-speed Maglev train between Tokyo and Osaka is slated to start operation in 2027. Further projects have been proposed throughout the world, including in India, China, and Iran.
Hyperloop systems are based on the concept of vacuum tube trains (“vactrains”): they use magnetic levitation technology in the same way as Maglev, but the train cars in these systems are sealed pods that travel enclosed in a reduced-pressure tube. This near-vacuum environment removes virtually all air drag and enables the vehicles to reach speeds of up to 1 200 km/h. An open-source conceptual model of the technology was published in 2013 in order to encourage technological advances and bring Hyperloop systems to market (Musk, 2013[11]).
A number of companies are now working on commercialising the Hyperloop technology and several prototypes are currently operational. The pods can be designed to carry passengers, vehicles, and freight, although preliminary study suggests that the Hyperloop’s attractiveness for freight transport is limited (Taylor et al., 2016[12]). Feasibility studies and proposals have been submitted to construct Hyperloops around the world, including between San Francisco and Los Angeles, Chicago and Pittsburgh, Chicago and Seattle, Helsinki and Stockholm, Toronto and Montreal, Edinburgh and London, Glasgow and Liverpool, Mumbai and Pune, Shengaluru and Chennai, and Paris and Amsterdam.
What promotes the development of ultra-high-speed rail systems?
The uptake of ultra-high speed rail will mainly depend on its effective construction costs, the resulting fare levels, and the corresponding demand. As Maglevs and Hyperloops offer transport services which are in many aspects comparable to traditional rail – reliable trips between city centres with smooth boarding processes – final demand will depend mainly on fares. Ultra-high speed rail will be competitive if fares match users’ willingness to pay for increased speed and if there is sufficient demand to cover upfront costs. The capital costs of UHS, and thus the fares required to cover them, are the key factors for their uptake.
With no large scale UHS service available today, the capital costs of these systems are largely uncertain. Multiple sources report variations in cost estimates differing by orders of magnitude (Table 4.3). The financial feasibility of the Hyperloop system in particular has received criticism see McLean and Nicolas (2016[13]) for a detailed costs analysis. While the original estimation for the Los Angeles–San Francisco project was USD 10 million per kilometre in 2013, subsequent commercial proposals put the figure at USD 40 million. Independent experts have also suggested the capital costs of the Hyperloop system (including vehicle costs) could exceed USD 75 million per km (for a review see Walker (2018[14])).
Furthermore, these estimates exclude cost of land acquisition as well as the various engineering and legal expenses required for large infrastructure projects. Also present may be the optimism bias seen in the costing of many large transport projects – an ex-post study of high speed rail projects in France, for instance, showed that actual construction costs were on average 20% higher than predicted (Meunier and Quinet, 2010[15]). Finally, ultra-high speed systems require relatively straight routes to avoid excessive lateral forces. The costs might thus slip to unstainable levels in regions with hilly topography, protected landscapes and high land values.
Maglevs are already in operation and the technology’s further development primarily depends on the financial model. As upfront costs are high, the long-term return on investment is uncertain and the level of risks is considerable, future Maglev infrastructure will likely not be funded from private funding sources in the near term. Government support will thus be essential, as it has been for high speed rail. As economies of scale should lower costs and demand for higher speed connections will probably increase, other financial models may well become viable in the long run.
Bringing Hyperloop systems into operation still requires technological advances. Significant technical issues need to be solved so that Hyperloop companies can meet their aim of having a fully operational system ready as soon as 2023. One of the steepest technological challenges is to maintain a vacuum in a tube several hundred kilometres long. The maximum speed Hyperloops have reached is slightly under 400 km/h, with a small-scale prototype on a test site. Traditional high speed trains have achieved test speeds of 570 km/h.
Questions have also been raised regarding the feasibility of Hyperloop’s value proposition. The original Hyperloop proposal suggested that it could carry up to 3600 passengers per hour, with one 28-seater pod departing every 30 seconds. Several experts have argued that 80 seconds would be a more realistic departure frequency, given the minimum headway required for the vehicle to stop safely. This would dramatically reduce the capacity of the system, however. Other concerns raised focus on passengers’ safety and comfort.
What impacts would ultra-high-speed rail systems have on passenger transport?
If implemented, UHS rail is likely to reshape transport patterns. Most adapted to provide trips in the 400 to 800 km range, UHS could potentially attract travellers now relying on short-haul aviation. The impact would thus be especially significant in regions with high levels of domestic aviation activity, such as the United States and China. They might also supersede traditional high speed rail services. Given that higher income levels are associated with higher values of travel time savings, new UHS rail projects could be favoured over new high speed rail projects, especially in countries such as the United States and the United Kingdom where extensive conventional high speed rail networks do not already exist.
Hyperloops and Maglevs could thus help to reduce congestion of airways and at airports. UHS rail would also contribute significantly to lower transport-related CO2 emissions. Short-haul flights are particularly carbon-intensive, while electricity-powered UHS rail has a small carbon footprint, provided the source of electricity is sufficiently clean. That said, in terms of energy consumption the balance might not necessarily be positive for UHS. Maglevs require more energy per passenger-kilometre than traditional rail services, since air friction increases rapidly with speed, but do not offer significant energy savings compare to air transport. The Hyperloop system, on the other hand, consumes little energy as friction is limited in near vacuum. Its expected energy requirement could be 80% less than the one of an average US train. In principle this could be powered via solar panels mounted directly on the Hyperloop tubes (Taylor et al., 2016[12]).
UHS systems could also improve regional accessibility and stimulate regional economic development. This has arguably been a major impact of high speed rail, which can improve local business activity by changing the region’s economic profile. High speed rail projects alter the relationship between accessibility and urban productivity. An important body of literature within the field of New Economic Geography has shown that the spatial concentration of economic activities entails productive advantages, the so called economies of agglomeration.
For example, projections see the planned high speed rail connection between London and northern England generating productivity increases worth between EUR 700 million and EUR 1.3 billion annually. Although it is difficult to assess to which extent, UHS will likely have similar effects with a much higher magnitude. They will fundamentally transform the economies they serve, inducing significant households and firms relocations. This is not to say that there are more benefits obtained from UHS rail than aviation. The potential UHS connections however would bring additional benefits as they would be added on top of air connections.
There is thus a case for further developing the traditional high speed rail network development. There are still around 200 links between city pairs for which a high speed rail link could be economically viable, according to an analysis by ITF that examined demand, costs and distance, among other factors. This untapped potential represents 50 000 km of tracks. Of these 75% would be in North America, reflecting the fact that high speed rail has been historically underdeveloped in this region.
This potential for development is already being acknowledged to some extent, with high speed rail receiving increased attention in the United States over the past decade. A High Speed Rail Strategic Plan produced by the US Federal Railroad Association identifies strategic corridors with 10 000 km of potential high speed track. California’s high speed rail project is currently under construction and will run to a length of 1 200 km, assuming it is fully implemented.
The potential for high speed rail will become larger over time as transport demand grows and willingness to pay increases. Beyond the 50 000 kilometres of potential rail lines, an additional 25 000 km of tracks could be considered by 2050. At this time horizon, high speed rail is likely to also develop in middle income countries, especially in India, Latin America and, to a lesser extent, in North Africa. There are already signs of a growing interest for high speed rail in middle income countries. In Central Asia, Uzbekistan is successfully operating a 600 km network of high speed tracks allowing speeds of 250 km/h. India's first high-speed rail corridor between Mumbai and Ahmedabad started construction in 2017 and is slated to open by 2022. In North Africa, the Tangiers-Casablanca line opened in 2018, as the first phase of a planned 1 500 km high speed rail network in Morocco.
Note: HSR refers to high-speed rail
Developing high speed rail and UHS rail services are not the only possible path forward. Conventional and optimised rail services could serve as an alternative in many cases. Such services would not compete with aviation or high-speed rail in terms of travel time, but could be very competitive in terms of fare levels and thus able to attract a different user segment.
Simulation results
Investing into high speed rail can significantly increase rail traffic in terms of passenger-kilometres. Projections see an additional 170 billion rail passenger-kilometres to 2050 if all economically feasible high speed rail projects are implemented in the interim. This would represent a 14% increase in intercity rail traffic on 2015.
More than half of this increase would be in China and India. But the Americas would also see a notable increase in rail ridership, with an additional 35 billion passenger-kilometres in North America and 23 billion in Latin America. For city pairs located 400km to 800km apart, the market share of rail is expected to reach more than 50% by 2050. This is because the competiveness of high speed rail relatively to car and plane will increase with the expected increase in fuel prices and the progressive introduction of carbon pricing. Note that the total traffic expected on these new high speed rail systems is higher as a significant share of their patronage will come from traditional rail services. The total ridership of the new high speed rail services will amount to nearly 400 billion p-km in 2050 according to ITF estimates.
Yet globally this will have a minor impact on the total rail traffic. Currently rail traffic between large cities only represents 8% of total non-urban rail. Thus high speed rail has limited potential to increase significantly rail ridership. The projected additional 170 billion p-km only amounts for 1% of total rail ridership. Furthermore the impact of high speed rail projects on non-urban transport emissions is limited. The high speed rail projects would decrease CO2 emissions by 5 million tonnes, which less than 1% of the domestic emissions of non-urban transport.
The prospects for UHS are more limited. Even if all the technological hurdles are passed and assuming there is no substantial subsidies, our estimates show a potential for 10 000 kilometres of UHS tracks, most of it located in Western Europe, North America and China. Although this implies that the UHS technologies as such could be viable, they will have a negligible impact on global transport pattern. UHS would generate an additional 40 billion p-km, with more than half of resulting for a modal shift from air transport.
Long-haul low-cost aviation

Civil aviation used to be a very strictly regulated and closed business sector dominated by network carriers. With increasing liberalisation of the aviation market, new players entered new business models started to emerge (Carmona Benitez and Lodewijks, 2008[17]; ITF, 2015[18]). The low-cost business model, pioneered in the United States by Southwest Airlines, employs point-to-point operations, shorter turn-around times, and service de-bundling among other elements (Doganis, 2005[19]; Doganis, 2010[20]). Different variations of that model exist (Alamdari and Fagan, 2017[21]) and have increasingly come to dominate short-haul aviation over the past 30 years. In 2017, low-cost airlines had a market share in excess of 50% of the seats offered in some regions: 57% in South Asia and 53% in South-East Asia. In Europe, a solid 37% of seats are booked with low-cost airlines and 32% in North America.
Importantly, airlines’ business models have been blending for a while: Network carriers offer cheap de-bundled fare options, while low-cost carriers also sell up-market, almost business class-like options to their passengers. The main distinction can be drawn between low-cost airlines and full-service carriers. Full-service carriers have long relied on a strategy that involved big central hubs from which they service a multitude of destinations like spokes. The hub-and-spoke model enables them to gather enough demand to serve a large number of destinations in a cost-efficient way. This strategy is especially important for medium- and long-haul flights, because these require larger airplanes but are less in demand.
Low-cost airlines, on the other hand, mostly rely on direct point-to-point connections for their short-haul routes, which gives them a competitive advantage over full-service carriers. They have thus brought significant benefits to air travellers in the form of lower prices and new destinations, mostly on the short-haul sectors. It is therefore important to consider what would happen in long-haul markets if these would be entered by low-cost airlines on a large scale.
A number of network carrier, low-cost airlines, entrepreneurs and other players have attempted to transfer the low-cost model to the long-haul market (Morrell, 2008[22]). Most of these have failed, highlighting the differences that exist between short-haul and long-haul flights:
-
A lack of origin-destination demand makes long-haul point-to-point operations less viable.
-
Fuel costs are a much higher component of the total costs for long-haul operation and leave less room for cost reductions.
-
Aircraft utilisation rates on long-haul routes are already high and reduce the potential to reduce costs through optimised utilisation.
-
In-flight comfort and service is more important for passengers on long flights.
-
Staff costs are significantly higher on long-haul routes.
Full-service carriers generate a large part of their profits on long-haul routes through business and first class passengers as well as cargo transport. Low-cost airlines cannot provide the schedule frequency, reliability and comfort that business passengers demand or offer the frequent flyer benefits that these often enjoy. Hardware aspects also complicate the entry of low-cost carriers into the long-haul market. Most use only a single type of aircraft, usually last-generation single-aisle planes with very high fuel efficiency. These are usually purchased in large numbers at a significant discount. However, the lower range of single-aisle airplanes limits their usability on long-haul routes, thus forcing low-cost newcomers to long-haul markets to buy or lease bigger aircraft and lose the cost advantages of a single-type, single-aisle fleet.
Nonetheless, a small number of low-cost carriers have succeeded in entering the long-haul market in the last few years, among them Air Asia X and Norwegian Long Haul. Both airlines successfully serve multiple long-haul destinations, taking advantage of air liberalisation and flying with 5th and 6th freedom rights. Freedom rights give airlines the ability to fly to destinations beyond their native country; 5th and 6th freedom rights allow airlines to operate flights between two foreign countries under certain conditions. To a degree, they also use a hub-and-spoke strategy, as they use their parent companies, the traditional low-cost carriers AirAsia and Norwegian Air Shuttle, to deliver long-haul passengers to them. Using last-generation aircraft with significantly more fuel-efficient engines allows them to maintain a cost structure that is low enough to make operations economically viable. Nonetheless, their long-haul operations serve mostly big market pairs, and with a lower flight frequency than full-service carriers.1
What promotes the expansion of long-haul-low cost carriers?
Three main factors are behind the emergence of long-haul low-cost aviation. Firstly, the liberalisation of aviation markets makes it easier for new players to enter previously protected or closed markets in many world regions. Low-cost carriers in particular benefit from these regulatory changes, and many may soon offer cheaper flights also on long-haul routes where demand exists.
Secondly, the technological evolution of aircraft brings increased fuel efficiency and also allows new fuel mixes. Low-cost airlines rely on latest-generation planes to keep their costs low, therefor engineering advances in are more likely to translate into cost advantages and higher profit margins than for other airlines. Reductions in the fuel-related costs for longer flights or increased flight range of single-aisle aircraft put low-cost airlines in a good position to compete with full-service carriers on some long haul routes with high demand.
Thirdly, increased demand for air travel also leads to a growth of long-haul low-cost airlines. As more people want to go to specific destinations, their market becomes big enough to support new low-cost entrants. This is notably the case for the emerging aviation markets and of those in Asia in particular. Whether low-cost airlines generate new demand or absorb demand from full-service carriers has been much debated. The prevailing opinion holds that low-cost aviation does not add new demand, even if they need to absorb demand from full-service carriers in order to be viable (Gillen and Morrison, 2003[23]; Gillen and Lall, 2004[24]; de Wit and Zuidberg, 2012[25]). Therefore as demand is growing and is expected to continue growing, more routes will become viable for low-cost airlines.
Because of the characteristics of long-haul routes, the profit margin of low-cost airlines on these is smaller compared to short-haul routes. This makes operators very sensitive to oscillations in costs, and several initially successful low-cost airlines were forced out of business as fuel prices rose or the economy reduced the available budget of customers. The factors described above will likely make long-haul low-cost carriers more resilient.
Additional potential for long-haul low-cost airlines lies in absorbing market share from charter flights, similarly to what happened in the short-haul market (Rodríguez and O’Connell, 2018[26]). The characteristics of the typical charter passenger and the provided service are quite different from those of low-cost airlines, however, so that it is unlikely that low-cost carriers will completely replace long-haul charter flights. Nonetheless, this is another aviation market that long-haul low-cost carriers are likely to disrupt.
What are the impacts of long-haul low-cost aviation on air travel?
Low-cost airlines have had a huge impact on short-haul passenger aviation. Many network carriers initially ignored them, expecting them to fail. The aggressive stance of low-cost operators in combination with air liberalisation completely reshaped the aviation market. They development forced mergers between network carriers, pushed them to lower their prices and follow suit with other attributes of the low-cost model, such as service de-bundling.
Today, the entrance of low-cost carriers is disrupting the business model of network carriers on the long-haul routes. The low fares offered by budget operators will almost definitely absorb some cost-conscious customers from full-service carriers. Since the long-haul market is one of the most profitable sections for full-service carriers (Morrell, 2008[22]), full-service carriers are likely to compete aggressively; their larger profit margin might even allow them to sustain losses for a certain time. Overall, the arrival of low-cost airlines on the long-haul market will lower the cost of flying on these routes, thus increasing demand for these destinations, and ultimately traffic. Because all these additional trips will cover comparatively great distances, they will have a disproportionate impact on aviation’s overall passenger-kilometres travelled and CO2 emissions.
Currently, low-cost airlines offer medium- and long-haul flights mainly between Europe and North America and within East and Southeast Asia. Their market share in these regions was about 10% in 2018. Few low-cost flights exist for long- and ultra-long-haul routes, which points towards a maximum length for profitable low-cost services. Growth is more probable firstly on the shorter routes of the long-haul market, especially those that that can be covered with long-range single-aisle aircraft, and secondly in regions with a lot of untapped travel potential.
The first category includes route pairs such as North America and Europe, Europe and Asia, South and Central America to North America. The second category consists of South, Southeast and East Asia. These routes are also likely to first appear between cities that are already characterised by high demand. Routes that are today served by charter airlines are also likely to be see other operators offering low-cost flights for instance from Europe or North America to Central America or the Caribbean. This could be either new low-cost airlines entering that market or a full-service carrier flying a low-cost service.
The number of seats on medium- and long-haul flights provided by low-cost carriers will increase as aviation volumes continue to increase over the coming decades. Their market share will likely plateau at around 20% of the total aviation market, however, given the threshold conditions for profitable low-cost operations, the market characteristics and passenger preferences and priorities.
Continued liberalisation of aviation markets will increase the competition between network carriers and low-cost airlines on medium and long-haul routes. The result could be a further market consolidation that would reduce the number of big players, which could then compete more aggressively with low-cost carriers, either directly or with their own low-cost subsidiaries. Direct competition between the low-cost carriers will also become more intense as their market share grows.
Simulation results
A completely liberalised global aviation market in which low-cost carriers have entered most medium- and long-haul markets would be 9.5% bigger in terms of the number of air links in 2050 than in 2015 in the current ambition scenario. In terms or total passenger-kilometres, it would be 3.6% bigger. All of this growth would occur in international aviation, where the total passenger-kilometres increase by 5%. This section examines a scenario in which international air travel would reach 1 000 billion passenger-kilometres more in 2050 compared to the current ambition scenario.
Logically, the share of low-cost aviation in this scenario is higher. In the current ambition scenario, the share of low-cost airlines stays stable around 12-13% of the total aviation passenger-kilometres throughout the period 2015 to 2050. In a scenario in which low-cost carriers disrupt the aviation market, their share of total aviation p-km reaches 16% by 2050. This increase might not seem significant, but it represents a 20% market growth. The biggest market share increases for low-cost airlines in a disruption scenario are expected on routes between certain regions, particularly Middle East and transition countries. Nonetheless, the biggest absolute growth occurs in areas where low-cost carriers are already widespread, such as Europe and between Asia and China/India.
Alternative aviation fuels
Aviation has witnessed record growth in the past decade. It is currently responsible for 2-3% of manmade emissions, and its share is set to rise in the coming years as demand for both passenger and freight air transport is expected to grow further. Aviation is exclusively reliant on liquid hydrocarbons, so that demand for jet fuel will also continue to grow strongly. In 2015, jet fuel comprised 7.5% of global oil products (IEA, 2017[27]). Jet fuel is a product of petroleum refinement and blending, and its combustion produces CO2, NOx and aerosols. The particulate matter produced through combustion of jet fuel is also responsible for increased cloudiness, which contribute to climate change (Lee et al., 2009[28]).
Most CO2 emission reductions from aircraft derive from increased fuel efficiency of newer aircraft and the use of biofuels. Improvements in the fuel efficiency of narrow body aircraft may decrease the amount of fuel burned per revenue passenger-kilometre by about 2% per year until 2050 (Schäfer et al., 2016[29]) and as much as 3% if more ambitious measures are adopted (Dray et al., 2017[30]). With demand for passenger flights expected to grow by an average of 3.6% per year in terms of passenger-kilometres over the same period, efficiency gains alone will not be able to reduce aviation’s CO2 emissions below current levels but merely limit potential increase. Biofuels have long been considered to be a solution for decoupling the growth in air travel from the associated CO2 emissions. However, concerns about negative side effects of biofuel generation, along with their high cost and limited availability, have prevented their more widespread uptake.
Electrification is playing a less significant role in aviation than in other transport modes, mainly because of the high energy requirements of air travel. Nevertheless, some potential for electrification in the aviation sector exists for short-haul flights, although it is conditional on sufficient technological progress (Schäfer et al., 2016[29]). Flights covering distances of less than 1 000 km account for 15% of all global revenue for passenger-kilometres and almost half of global departures. Electrifying these flights could eliminate around 40% of emissions associated with the take-off and landing of aircraft and reduce total commercial aircraft jet fuel use by 15% (Schäfer et al., 2016[29]). A reduction of other types of greenhouse gas emissions and noise pollution are additional benefits of electric aircraft.
Synthetic fuel also offers CO2 mitigation potential. Synthetic fuel is created through chemical processes that combine carbon monoxide and hydrogen. Carbon monoxide can be extracted from multiple sources. A process known as direct air capture (DAC) is particularly promising in terms of it mitigation potential. In DAC, filters are used to capture CO2 directly from the air, after which it is transformed into carbon monoxide that is used to create products such as gasoline and jet fuel. As the carbon content of synthetic fuel is extracted from the atmosphere, the emissions generated from the combustion of synthetic fuel do not increase the total amount of CO2 in the atmosphere. Synthetic fuel also has a higher level of purity, which reduces the emission of other pollutants. A significant amount of energy is required to produce synthetic fuels, however.
What encourages the uptake of alternative energy sources in aviation?
The prospects for electric aircraft and synthetic aviation fuel depend heavily on the development of the respective technologies. The pace of development of battery technology in particular will play an important role in determining the prospects for electric aviation, as the weight and energetic capacity of electric batteries constitute a prominent barrier to their use in planes. Until constraints regarding power output, weight, and range can be eased, the role of electric planes will be limited.
Another major factor behind the extent and speed of electrification and synthetic fuel use in the sector will be cost, and their uptake will be strongly influenced by the evolution of oil and electricity prices. Commercial aviation costs are very sensitive to oil prices, and demand for aviation is also relatively sensitive to changes in price (Doganis, 2005[19]). Given current technology and energy prices, all-electric planes are more expensive than conventional aircraft (Schäfer et al., 2016[29]). Strong incentives favouring electric aviation will be needed to close the gap between the total costs of electric vs. conventional planes. The availability of cheap and renewable electricity will be a prerequisite for the scaling up of both technologies and will play an important role in determining the trajectory of their growth.
Increased prices of carbon in the future will translate into higher fares for conventionally-powered air travel, which could diminish demand. The price of flights powered by electricity and synthetic fuels would be relatively unaffected by a carbon tax. Thus, these technologies can play a role for decarbonising aviation as well as for ensuring mobility needs will continue to be met by aviation.
What are the impacts of alternative fuels on the aviation sector?
The electrification of short-haul flights and the use of synthetic fuels can significantly reduce the carbon intensity of air travel. As a matter of fact, Norway aims to become the first country where all short-haul flights are carried out with electric aircraft by 2040. Although both electrification and synthetic fuels emit no net tank-to-wheel emissions, the well-to-tank emissions generated by their production should also be considered when evaluating their mitigation potential. Fully decoupling aviation from fossil fuel consumption requires the use of renewably-generated electricity. If the decoupling can be achieved, this would facilitate significant growth in the demand for air travel, which could in turn result in a modal shift away from other inter-urban transport modes such as rail and road transport. A growing segment of the population avoids air travel for environmental reasons and emission-free aviation would allow them to consider using planes for their mobility needs.
A large share of the emissions from aviation is released in the upper atmosphere. There, the climate impacts of non-CO2 pollutants can be significantly greater than the impact of their CO2 emissions alone (Wickrama, Henderson and Vedantham, 1999[31]). Scientists debate the magnitude of this radiative forcing (Williams, Noland and Toumi, 2002[32]; Köhler et al., 2008[33]; Borken-Kleefeld, Berntsen and Fuglestvedt, 2010[34]). Electric planes and planes powered by synthetic fuels would significantly reduce radiative forcing effects because electric aviation does not produce any tank-to-wheel emissions and the combustion of synthetic fuel produces fewer non-CO2 pollutants than conventional jet fuel.
Electric planes have the potential to disrupt the aviation market for short-haul flights up to 1 000 km. This segment accounts for 15% of aviation’s revenue passenger-kilometres and about half of all take-offs and landings (Schäfer et al., 2018[35]). Given the weight, space and range limitations associated with currently foreseeable battery technologies, electrification is unlikely to extend beyond medium-sized planes and short-haul flights. Electric aircraft are also particularly likely to be used on routes for which other inter-urban surface modes require the construction of expensive infrastructure, for instance between islands or to connect remote locations. The uptake of electric aircraft is also more likely to occur first in countries where environmental concerns are more pronounced or where regulations for aviation emissions and noise pollution are more stringent.
The uptake of synthetic fuel in aviation will be heavily influenced by the evolution in the cost of conventional fuel (which may vary between countries or regions) and the costs involved in the production of synthetic fuel itself. In regions where electricity is relatively cheap and conventional oil relatively expensive, the cost basis of synthetic fuel will become more attractive than that of conventional jet fuel, and this will accelerate its uptake. Fuel taxes or carbon pricing could also contribute to increasing the cost advantage of synthetic fuel over conventional fuel.
Simulation results
The impact of alternative fuels on total aviation emissions does not depend solely on the development of the respective technologies and their cost. Switching to a new energy source will be mainly a cost decision, with few exceptions. Therefore the cost of conventional fuel and related policies will also affect the how fast and to what extent alternative energy sources will penetrate aviation.
In the setting of the current ambition scenario, conventional fuel will remain cheaper than alternative energy sources for most flights until 2045. Only in 2050 will electric aviation begin to be competitive and dominate some routes, covering 2% of all flights. In a disruptive alternative fuels scenario, the technological development of alternative energy sources happens more quickly and the related cost drop faster. With all else remaining equal, electric aviation replaces 42% of all flights in this disruption scenario. This share comprises most short-haul flights, since the assumed maximum range of electric planes is 1 600 km. The result would be drastically reduced emissions from short-haul aviation, particularly from domestic flights by 2050. Domestic aviation in the current ambition scenario would emit 293 million tonnes of CO2 by that year, while it would be only 130 million tonnes of CO2 in the alternative fuels scenario. International aviation will be less affected, as it includes mostly longer-distance flights. Nevertheless, emissions from international aviation will fall from 768 million tonnes of CO2 in 2050 in the current ambition scenario to 700 million tonnes of CO2 in the alternative fuels scenario.
The high ambition scenario provides a different policy and technology background than the current ambition scenario. Under high ambition policies, airplane efficiency increases compared to current ambitions and alternative fuel technology matures faster, albeit not as fast as in the disruptive scenario. More importantly, the carbon emission-related costs reach USD 500 by 2050. The combination of these elements fosters the development of carbon-free or zero net-carbon aviation. Thus, almost 37% of all flights would be in electric aircraft by 2050, while 2% would be powered by synthetic fuel. This would reduce CO2 emissions, especially in domestic aviation, where they fall to 55 million tonnes of CO2.by 2050, from 290 million tonnes in 2015. International aviation CO2 emissions drop by 20% to 2050, reaching 343 million tonnes of CO2, despite providing 2.7 more passenger-kilometres. Combined with the technological assumptions made in the high ambition scenario, the use of alternative aviation fuels on a large scale has even more ground-breaking results. In such circumstances, only 24% of all flights would use conventional fuel by 2050. All flights under 1 600 km would be carried out with electric planes and almost 50% of medium- and long-haul flights are powered by synthetic fuel. Aviation’s CO2 emissions in 2050 would consequently stand at 40% of the base year 2015, at 288 million tonnes of CO2.
Three disruptive scenarios for non-urban passenger transport
This section analyses demand and emissions projections to 2050 in three scenarios that reflect more pronounced disruptive developments and mitigation measures in non-urban passenger transport. The potential impacts of these developments are uncertain and vary depending on demand, traveller’s choices, new business models, the role of the service providers, as well as on other exogenous factors. Policy measures or their absence can strongly affect the ultimate impact of disruptive developments in the sector. Well-aligned policy measures can steer mobility changes towards more sustainable outcomes, such as vehicle sharing, which reduces congestion and emissions and increases connectivity and quality of service. To explore the scope of more extreme technological changes and the effect of non-urban related policy measures, three disruption scenarios were designed and tested. Table 4.4 summarises each of the tested scenarios.
The policy disruption scenario assumes that governments and international organisations in cooperation with private sector strongly promote decarbonisation in aviation and road transport. It implies three major changes. Firstly, carbon-related cost (in the form of carbon pricing or offsets) are charged at USD 1 000 per tonne of emitted CO2. Secondly, favourable conditions for long-haul low-cost airlines and a halving of the cost of launching new long-haul air routes. Thirdly, an increase of shared non-urban transport and the creation of seamless multi-modal solutions for intercity passengers lead to one third of intercity trips will be shared trips. The pace at which technological changes integrate into mass transport solutions remains moderate in this scenario.
The technology disruption scenario assumes drastic technological progress in rail, road and aviation. Implementation of any new technologies is merely a question of economic feasibility. Policy makers make only moderate efforts to steer the changes. Specific assumptions include that the cost of alternative fuels in aviation will drop even faster than in the high ambition scenario relative to the cost of conventional fuel, the range of electric planes will increase to 2 000 km and that ultra-high speed rail systems will be introduced where economically feasible. In the road sector, the share of autonomous vehicles in non-urban traffic will reach 25% for cars and 12.5% for buses.
|
Table 4.4. Specification for three disruptive scenarios for non-urban transport
|
|||||
|---|---|---|---|---|---|
|
Mitigation Measures |
|||||
|
Assumptions |
High ambition scenario |
Policy disruption scenario |
Technology disruption scenario |
Full disruption scenario |
Assumptions |
|
|
Carbon pricing |
USD 500 per tonne |
USD 1 000 per tonne |
USD 500 per tonne |
USD 1 000 per tonne |
|
|
Efficiency improvements and electric vehicles |
Varies by region: 29.4-53.7% of cars and 10.5-56.5% of busses |
Varies by region: 29.4-53.7% of cars and 10.5-56.5% of busses |
Varies by region: 29.4-53.7% of cars and 10.5-56.5% of busses |
Varies by region: 29.4-53.7% of cars and 10.5-56.5% of busses |
|
Potentially disruptive developments |
|||||
|
Assumptions |
High ambition scenario |
Policy disruption scenario |
Technology disruption scenario |
Full disruption scenario |
Assumptions |
|
|
Long-haul low-cost carriers |
Very low share of low-cost airlines on long-haul flights (current trend) |
Favourable conditions for long-haul low-cost airlines. Cost of creating a new route decreases by 50% |
Favourable conditions for long-haul low-cost airlines |
Favourable conditions for long-haul low-cost airlines. Cost of creating a new route decreases by 50% |
|
|
Energy innovations in aviation |
Cost decreases three-fold by 2050 compared to conventional fuels. Range of electric planes reaches 1 600 km by 2050 |
Cost decreases three-fold by 2050 compared to conventional fuels. Range of electric planes reaches 1 600 km by 2050 |
Cost decreases four-fold by 2050 compared to conventional fuels. Range of electric planes reaches 2 000 km by 2050 |
Cost decreases four-fold by 2050 compared to conventional fuels. Range of electric planes reaches 2 000 km by 2050 |
|
|
Autonomous vehicles |
Varies by region: 0-2.5% of cars and 0-1.25% of busses |
Varies by region: 0-2.5% of cars and 0-1.25% of busses |
Varies by region: 10-25% of cars and 5-12.5% of busses |
Varies by region: 10-25% of cars and 5-12.5% of busses |
|
|
Shared mobility |
13.3-20% of all trips are shared |
20.0 - 26.7% of all trips are shared |
13.3-20% of all trips are shared |
20.0 - 26.7% of all trips are shared |
|
|
Ultra-high-speed rail |
current high speed rail projects or where they are already economically feasible |
Current and feasible high speed rail projects plus Maglev |
Current and feasible high speed rail projects plus Maglev and Hyperloop |
Current and feasible high speed rail projects plus Maglev and Hyperloop |
The full disruption scenario assumes that drastic technological changes occur and that policy-makers strongly promote decarbonisation in the aviation and road sector. It thus combines the impacts of both previous scenarios.
All three disruption scenarios assume that the electrification of vehicle fleets will reach the same level as in the high ambition scenario, i.e. in line with the EV30@30 scenario of the International Energy Agency (IEA, 2018[5]).
Each of the three disruption scenarios contains a combination of changes affecting travel costs, travel time and modes’ convenience. These combinations have the potential to promote or supress demand. More specifically, the promotion of low-cost long-haul aviation, decrease in cost of electric vehicles and market penetration of autonomous vehicles, as well as possibility to share intercity trips, induces demand. Expansion of high-speed rail will likely bring additional demand as well, due to reduced travel time. Finally, it is assumed that vehicle load factors are inversely proportional to GDP growth; the corresponding elasticities used in the scenarios are based on Balcombe (2004[36]). This means that as GDP grows, passenger kilometres increase as well, all else being equal. On the other hand, carbon-related costs, which can be quite significant for all the disruption scenarios (Table 4.4) will raise travel costs and, therefore, affect the demand negatively.
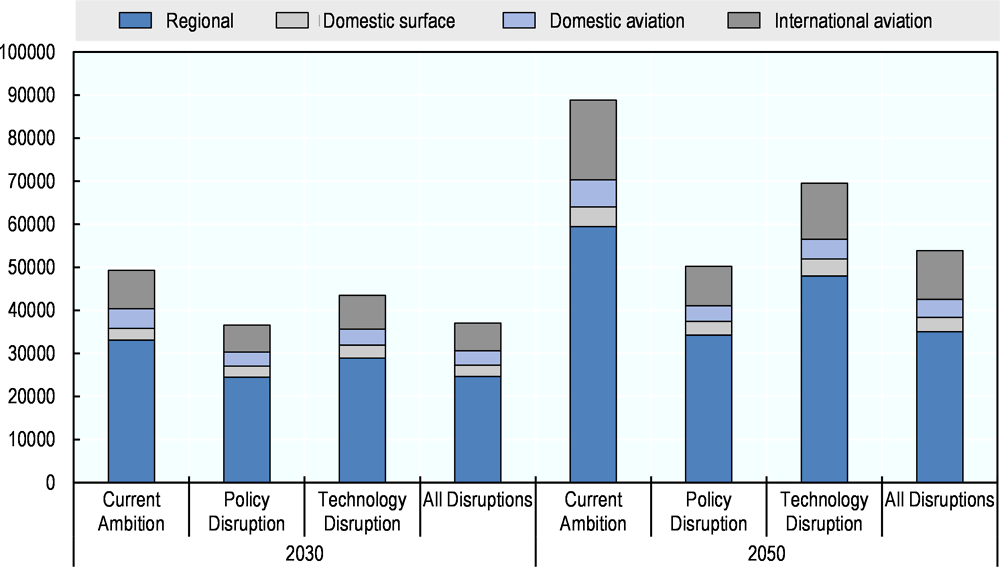
The results of the disruptions scenario analysis show that sufficiently high carbon-related costs can lower overall travel demand and reduce CO2 emissions, despite improved service and more convenience that tend to induce demand (Figure 4.4 and Figure 4.6). This finding is similar to the high ambition scenario, which leads to substantial CO2 reduction compared with the current ambition scenario based on a medium level of carbon-related costs.
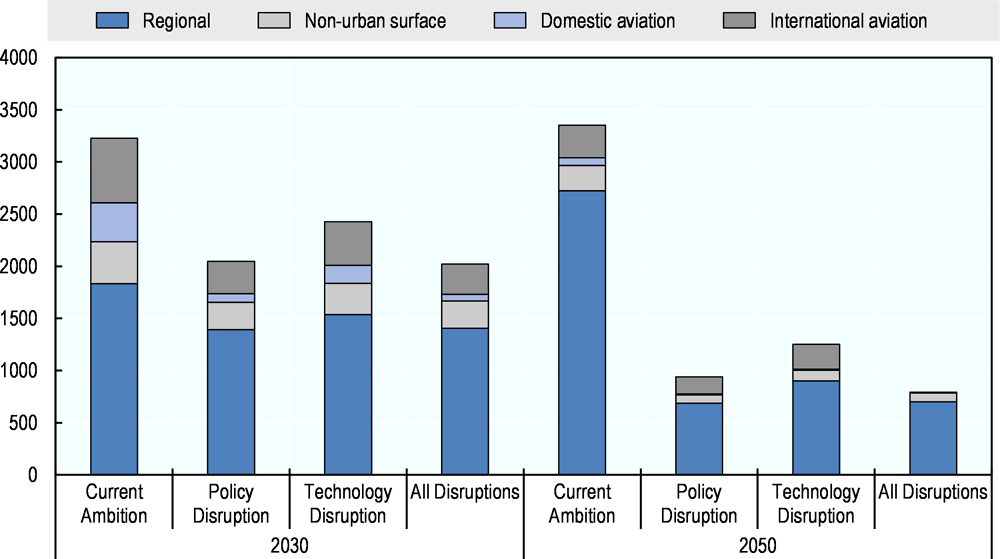
The policy-induced disruptions achieve the strongest CO2 mitigation, while the technology disruption scenario displays the least improvements. The policy disruption scenario thus confirms the importance of action by governments and the private sector. This scenario results in a reduction of total non-urban transport CO2 from 3.3 billion tonnes in the current ambition scenario to 2.05 billion tonnes in 2030 and from 4.1 to 0.94 billion tonnes in 2050.
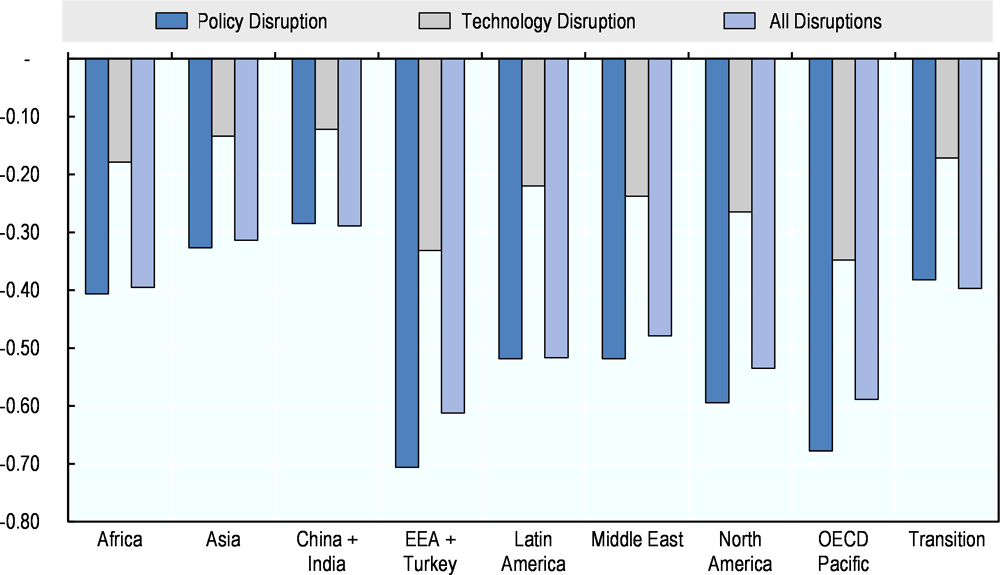
The observed reduction trends for passenger-kilometres and CO2 reductions are similar for regional and domestic surface modes, as well as for domestic and international aviation (Figure 4.4). The regional decomposition of all domestic urban travel shows that the disruption scenarios have the potential to reduce demand mostly in the OECD countries, and least of all in Asia (Figure 4.5). Carbon emission-related costs would reduce demand growth in every region of the world, but to a smaller degree in Asia.
The CO2 emissions variation across the scenarios follows the changes in demand (Figure 4.4 and Figure 4.6). Carbon intensity does not vary significantly across the disruptive scenarios, decreasing over time for each mode (Table 4.5). Yet policy-related disruptions will have stronger effect than technological changes on the carbon intensity of most non-urban modes.
The carbon intensity of aviation decreases significantly in relation to other modes. This would make aviation a highly sustainable mode in the future, if the assumed shift to alternative fuels and electric planes takes place. While the cost reduction of the alternative aviation fuels and the increase of the range of electric planes mostly depend on technological advances and thus were assigned to the technology disruption scenario, governments and the private sector can adopt a variety of measures to make the corresponding emission reduction happen sooner rather than later. These include subsidies and tax incentives, stimulating research, and legal support (e.g. guidance on handling agreements for alternative fuels or aircraft conversions) to actors in the aviation sector shifting to alternative fuels.
A comparison of the mode shares across the five scenarios shows that policies for non-urban travel should target the entire demand and carbon intensity, rather than focus on a significant shift towards less carbon-intensive modes. The non-urban mode shares (in terms of both passenger-kilometres and passengers numbers) are not especially sensitive to the changes in technology and policy considered, with a variance of 1-2% for all modes compared with the current ambition scenario. Rail gains modal share slightly in all disruptive scenarios. The small order of magnitude of this change shows that the expansion of ultra-high-speed rail is unlikely to attract many users from other modes. Nevertheless, the introduction of ultra-high-speed rail will improve user experiences and will further reduce the carbon intensity of rail transport.
Carbon-related costs strongly affect non-urban travel demand and its CO2 emissions in all scenarios. Still, the results of the high ambition scenario and the technology disruption scenario demonstrate the effects of technological progress and some policy changes under the same level of carbon taxation. The comparison shows that fostering low-cost long-haul aviation could increase international aviation passenger-kilometres. In the technology disruption scenario, passenger-kilometres for international aviation grows by 14% from 215 to 2050. As mode shares stay almost identical, the additional travel distance stems from longer trips and not from an influx of passengers from other modes or a significant increase in the number of travellers.
The passenger-kilometres for railway trips also grow. As train services become faster, travellers are willing to travel farther. Besides that, the policy and technology scenarios show very similar demand across years and modes, implying that the technological disruptions do not have very strong effects on non-urban demand. On the contrary, the policy disruption scenario results in a more significant decrease in emissions, suggesting that policy measures will likely be more influential than technological changes in reducing emissions from non-urban passenger travel.
References
[21] Alamdari, F. and S. Fagan (2017), “Impact of the adherence to the original low-cost model on the profitability of low-cost airlines”, in Low Cost Carriers, Routledge.
[36] Balcombe, R. (2004), The demand for public transport: a practical guide, TRL Limited, Crowthorne.
[34] Borken-Kleefeld, J., T. Berntsen and J. Fuglestvedt (2010), “Specific Climate Impact of Passenger and Freight Transport”, Environmental Science & Technology, Vol. 44/15, pp. 5700-5706, https://doi.org/10.1021/es9039693.
[17] Carmona Benitez, R. and G. Lodewijks (2008), Literature review of the passenger airline business models: Full service carrier, low-cost carrier and charter airlines, Transport, Infrastructure and Logistics (TRAIL).
[16] Cour des Comptes (2014), Rapport public thématique sur La grande vitesse ferroviaire, https://www.ccomptes.fr/sites/default/files/EzPublish/20141023_rapport_grande_vitesse_ferroviaire.pdf (accessed on 30 January 2019).
[37] De Poret, M., J. O’Connell and D. Warnock-Smith (2015), “The economic viability of long-haul low cost operations: Evidence from the transatlantic market”, Journal of Air Transport Management, Vol. 42, pp. 272-281, https://doi.org/10.1016/j.jairtraman.2014.11.007.
[1] de Rus, G. (2008), “The Economic Effects of High Speed Rail Investment”, OECD/ITF Joint Transport Research Centre Discussion Papers, No. 2008/16, OECD Publishing, Paris, https://dx.doi.org/10.1787/235171703148.
[25] de Wit, J. and J. Zuidberg (2012), “The growth limits of the low cost carrier model”, Journal of Air Transport Management, Vol. 21, pp. 17-23, https://doi.org/10.1016/J.JAIRTRAMAN.2011.12.013.
[20] Doganis, R. (2010), Flying off course : airline economics and marketing, Routledge, https://books.google.fr/books/about/Flying_Off_Course.html?id=2u9juAAACAAJ&redir_esc=y (accessed on 19 April 2019).
[19] Doganis, R. (2005), Airline business in the 21st century, Routledge.
[30] Dray, L. et al. (2017), THE GLOBAL POTENTIAL FOR CO2 EMISSIONS REDUCTION FROM JET ENGINE PASSENGER AIRCRAFT, http://discovery.ucl.ac.uk/10049085/1/Dray%20DrayetalTRB2018_final.pdf (accessed on 23 January 2019).
[24] Gillen, D. and A. Lall (2004), “Competitive advantage of low-cost carriers: some implications for airports”, Journal of Air Transport Management, Vol. 10/1, pp. 41-50, https://doi.org/10.1016/j.jairtraman.2003.10.009.
[23] Gillen, D. and W. Morrison (2003), “Bundling, integration and the delivered price of air travel: are low cost carriers full service competitors?”, Journal of Air Transport Management, Vol. 9/1, pp. 15-23, https://doi.org/10.1016/S0969-6997(02)00071-6.
[8] IATA (2016), IATA Forecasts Passenger Demand to Double Over 20 Years, https://www.iata.org/pressroom/pr/Pages/2016-10-18-02.aspx (accessed on 19 April 2019).
[2] ICAO (2017), ICAO Council adopts new CO2 emissions standard for aircraft, https://www.icao.int/newsroom/pages/icao-council-adopts-new-co2-emissions-standard-for-aircraft.aspx (accessed on 19 April 2019).
[3] ICAO (2016), Resolution A39-3: Consolidated statement of continuing ICAO policies and practices related to environmental protection-Global Market-based Measure (MBM) scheme, https://www.icao.int/environmental-protection/Documents/Resolution_A39_3.pdf (accessed on 19 April 2019).
[5] IEA (2018), Global EV Outlook 2018: Towards cross-modal electrification, International Energy Agency, Paris, https://dx.doi.org/10.1787/9789264302365-en.
[4] IEA (2018), World Energy Outlook 2018, International Energy Agency, Paris, https://dx.doi.org/10.1787/weo-2018-en.
[27] IEA (2017), “Key World Energy Statistics”, Statistics, p. 82, https://www.iea.org/publications/freepublications/publication/KeyWorld2017.pdf (accessed on 23 January 2019).
[9] ITF (2017), Lightening Up: How Less Heavy Vehicles Can Help Cut CO2 Emissions, OECD Publishing, Paris, https://doi.org/10.1787/ecf5b956-en (accessed on 15 April 2019).
[18] ITF (2015), EU Air Transport Liberalisation Process, Impacts and Future Considerations | ITF, OECD Publishing, https://doi.org/10.1787/5jrw13t57flq-en. (accessed on 19 April 2019).
[7] ITF (n.d.), Liberalisation of Air Transport | ITF, https://www.itf-oecd.org/liberalisation-air-transport (accessed on 19 April 2019).
[33] Köhler, M. et al. (2008), “Impact of perturbations to nitrogen oxide emissions from global aviation”, Journal of Geophysical Research, Vol. 113/D11, p. D11305, https://doi.org/10.1029/2007JD009140.
[28] Lee, D. et al. (2009), “Aviation and global climate change in the 21st century”, Atmospheric Environment, Vol. 43/22-23, pp. 3520-3537, https://doi.org/10.1016/J.ATMOSENV.2009.04.024.
[13] McLean, N. and Nicholas (2016), Comparative analysis of the Hyperloop against high speed rail for commuting between Sydney, Canberra and Melbourne, The University of Queensland, https://doi.org/10.14264/uql.2017.192.
[15] Meunier, D. and E. Quinet (2010), “Tips and Pitfalls in PPP design”, Research in Transportation Economics, Vol. 30/1, pp. 126-138, https://doi.org/10.1016/j.retrec.2010.10.013.
[22] Morrell, P. (2008), “Can long-haul low-cost airlines be successful?”, Research in Transportation Economics, Vol. 24/1, pp. 61-67, https://doi.org/10.1016/j.retrec.2009.01.003.
[11] Musk, E. (2013), Hyperloop Alpha, SpaceX, https://www.spacex.com/sites/spacex/files/hyperloop_alpha-20130812.pdf (accessed on 18 April 2019).
[6] Quinet, A. (2019), La valeur de l’action pour le climat Une valeur tutélaire du carbone pour évaluer les investissements et les politiques publiques Rapport de la commission présidée par, https://www.strategie.gouv.fr/sites/strategie.gouv.fr/files/atoms/files/fs-2019-rapport-la-valeur-de-laction-pour-le-climat_0.pdf (accessed on 8 March 2019).
[26] Rodríguez, A. and J. O’Connell (2018), “Can low-cost long-haul carriers replace Charter airlines in the long-haul market? A European perspective”, Tourism Economics, Vol. 24/1, pp. 64-78.
[35] Schäfer, A. et al. (2018), “Technological, economic and environmental prospects of all-electric aircraft”, Nature Energy, p. 1, https://doi.org/10.1038/s41560-018-0294-x.
[29] Schäfer, A. et al. (2016), “Costs of mitigating CO2 emissions from passenger aircraft”, Nature Climate Change, Vol. 6/4, pp. 412-417, https://doi.org/10.1038/nclimate2865.
[38] Soyk, C., J. Ringbeck and S. Spinler (2017), “Long-haul low cost airlines: A new business model across the transatlantic and its cost characteristics”, https://doi.org/10.1016/j.jairtraman.2014.11.007.
[12] Taylor et al. (2016), “Hyperloop Commercial Feasibility Analysis” July, https://rosap.ntl.bts.gov/view/dot/12308 (accessed on 30 January 2019).
[10] UIC (2018), High Speed Rail: Fast Track to Sustainable Mobility, https://uic.org/IMG/pdf/uic_high_speed_2018_ph08_web.pdf (accessed on 30 January 2019).
[39] Vidović, A., I. Štimac and D. Vince (2013), “Development of business models of low-cost airlines”, ijtte-International Journal for Traffic and Transport Engineering, Vol. 3/1, p. 69, http://ijtte.com/uploads/2013-03-25/5d57e65e-a0a9-482fIJTTE_Vol%203(1)_7.pdf.
[14] Walker, R. (2018), Hyperloop : Cutting through the hype, Transport Research Laboratory, London, https://trl.co.uk/sites/default/files/Hyperloop white paper_0.pdf (accessed on 30 January 2019).
[40] Whyte, R. and G. Lohmann (2015), “Low-cost long-haul carriers: A hypothetical analysis of a ‘Kangaroo route’”, Case Studies on Transport Policy, Vol. 3/2, pp. 159-165, https://doi.org/10.1016/j.cstp.2015.01.003.
[31] Wickrama, U., S. Henderson and A. Vedantham (1999), Aviation and the Global Atmosphere: A Special Report of IPCC Working Groups I and III, https://www.ipcc.ch/site/assets/uploads/2018/03/av-en-1.pdf (accessed on 30 January 2019).
[32] Williams, V., R. Noland and R. Toumi (2002), “Reducing the climate change impacts of aviation by restricting cruise altitudes”, Transportation Research Part D: Transport and Environment, Vol. 7/6, pp. 451-464, https://doi.org/10.1016/S1361-9209(02)00013-5.
Note
← 1. A significant body of literature examines the potential of expanding the low-cost model on the long-haul market. Some focus on specific markets and try to determine whether potential exists in the specific OD pairs: De Poret, O’Connell and Warnock-Smith (2015[37]) and Whyte and Lohmann (2015[40]). Others try to examine the business models and identify the elements that give an edge to successful attempts: Vidović, Štimac and Vince (2013[39]) and (Soyk, Ringbeck and Spinler (2017[38]).