copy the linklink copied!Gross replacement rates: Public vs Private, Mandatory vs Voluntary schemes

copy the linklink copied!
Key results

Private pensions play a large role in about half of OECD countries. For mandatory schemes, the OECD average for gross replacement rates of an average earner from public schemes alone is 40%, compared with 49% with private pensions included. For the eight OECD countries where voluntary private pensions are widespread, plus Israel and Mexico, the average replacement rate is 58% for an average earner choosing to contribute for the whole career compared with 36% when only mandatory schemes are considered. If the full-career average-wage earner only starts contributing in a voluntary scheme from age 45, the replacement rate is 45% against 59% when contributing for the whole career on average among the eight countries.

Table 5.3 shows the interplay between mandatory public, mandatory private and voluntary pension schemes. As shown in the previous indicator, the average replacement rate from mandatory schemes for a full-career average earner is equal to 49%: for the 17 OECD countries where the calculations of entitlements only cover mandatory public pensions, the average replacement rate for an average worker earner is 55%; for the 9 OECD countries with both public and mandatory private provision but no voluntary, the average replacement rate is 51%; and for the last 10 countries with significant voluntary pensions, the replacement rate from the mandatory component alone is 36%.

Mandatory private pensions

Mandatory private pensions exist in 11 countries including Denmark, the Netherlands and Sweden where private pensions have near-universal coverage, and are described as “quasi-mandatory”.

In Iceland, the Netherlands and Switzerland, private pensions are mainly defined benefit, whilst in the other countries they are defined contribution. Replacement rates from mandatory private schemes range from 6% in Norway to over 50% in Denmark and Iceland. All of the other countries are between 19% and 32% at the average wage, with the exception of the Netherlands at 42%. In Sweden the contribution rate for the private pension increases from 4.5% below to 30% above the ceiling for the public scheme, hence the total replacement rate is higher for high earners than average earners.

Voluntary private pensions

Voluntary private pensions are shown for eight countries where voluntary private pensions cover more than 40% of the population aged 15 to 64 (see the indicator of “Coverage of private pension plans” in Chapter 9). In addition, the housing account in Mexico and the severance account in Israel have been added as if they are not utilised during the working career, they are then transferred to the pension accounts at retirement. Voluntary private pensions include both voluntary occupational and voluntary personal plans. In Japan, a defined benefit plan is modelled, with the others having defined contribution schemes. In Israel the voluntary scheme modelled is the severance pay scheme, which is used as a pension if not utilised during the career. In Mexico the housing account is modelled, which is also used as a pension at the point of retirement if funds still remain.

When voluntary private pensions are taken into account for the whole career in Belgium, Canada, Germany, Ireland, Israel, Japan, Mexico, New Zealand, the United Kingdom and the United States the average replacement, for these ten countries, is 58% for an average earner compared with 36% when only mandatory schemes are considered. The voluntary component has the largest impact on the replacement rate (more than 29 percentage points) in Ireland, the United Kingdom and the United States.

The length of the contribution period clearly has an impact on the total replacement rate. The chart below compares the full-career full-contribution case with the full-career case but with contributions in the voluntary scheme from age 35 and 45 only, perhaps a more appropriate scenario. The schemes in Israel and Mexico are not considered as contributions are mandatory at all ages to severance and housing accounts respectively.

copy the linklink copied!
Gross replacement rate including voluntary contributions from different ages

 StatLink https://doi.org/10.1787/888934041478

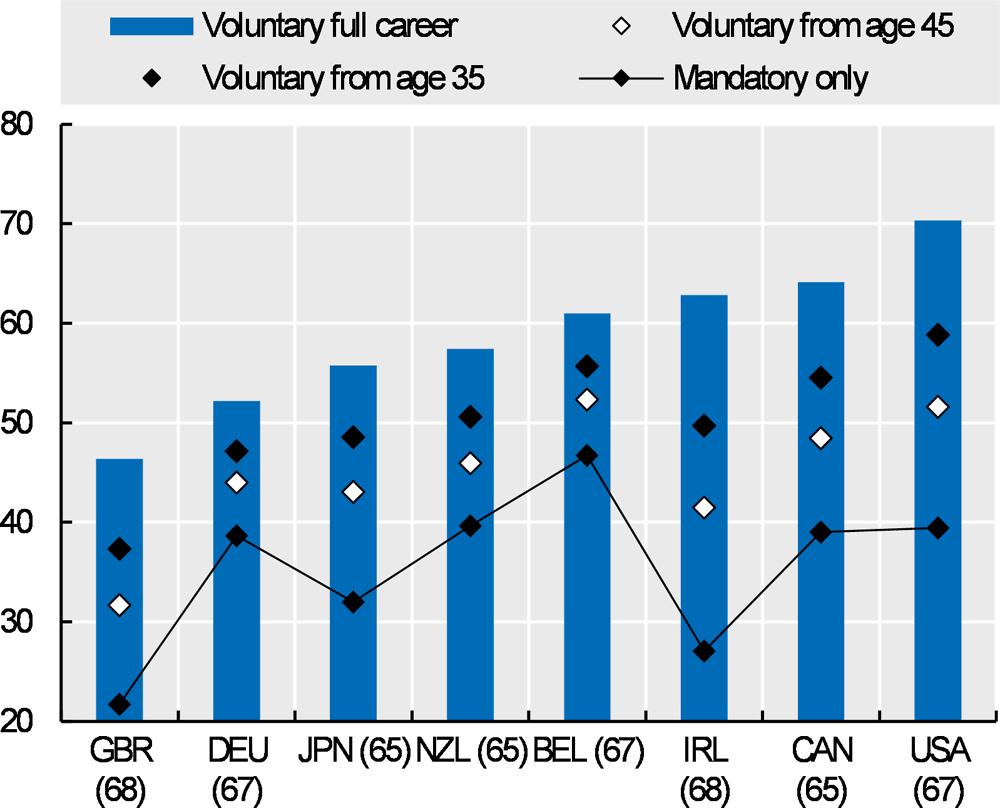
Among these eight countries, only contributing from age 35 (45) reduces the gross replacement rate by 10 (16) percentage points on average compared with the full-contribution case. In Belgium, Canada and the United States making contributions to the voluntary scheme from age 35 would result in a gross replacement rate above 55%.

copy the linklink copied!
Table 5.3. Gross pension replacement rates from mandatory public, mandatory private and voluntary private pension schemes
Percentage of individual earnings


Mandatory Public

Mandatory private (DB & DC)

Total mandatory

Voluntary (DB & DC)

Total with voluntary

0.5

1

1.5

0.5

1

1.5

0.5

1

1.5

0.5

1

1.5

0.5

1

1.5

Australia

34.0

0.0

0.0

30.9

30.9

30.9

64.9

30.9

30.9

Austria

76.5

76.5

76.5

76.5

76.5

76.5

Belgium

57.3

46.8

33.7

57.3

46.8

33.7

14.2

14.2

10.4

71.6

61.0

44.1

Canada

50.9

39.0

29.8

50.9

39.0

29.8

25.1

25.1

25.1

71.9

64.1

54.9

Chile

5.1

0.0

0.0

31.1

31.2

31.2

36.2

31.2

31.2

Czech Republic

75.0

45.9

36.2

75.0

45.9

36.2

Denmark

63.1

23.7

13.3

50.7

50.7

50.7

113.8

74.4

64.0

Estonia

33.8

19.4

14.6

27.6

27.6

27.6

61.4

47.1

42.3

Finland

56.5

56.5

56.5

56.5

56.5

56.5

France

60.2

60.1

54.0

60.2

60.1

54.0

Germany

38.7

38.7

38.7

38.7

38.7

38.7

13.5

13.5

13.5

52.2

52.2

52.2

Greece

63.1

49.9

45.5

63.1

49.9

45.5

Hungary

56.1

56.1

56.1

56.1

56.1

56.1

Iceland

12.3

3.1

2.1

63.0

63.0

63.0

75.3

66.1

65.1

Ireland

54.1

27.0

18.0

54.1

27.0

18.0

35.8

35.8

35.8

89.9

62.9

53.8

Israel

36.1

18.0

12.0

41.3

32.1

21.4

77.4

50.1

33.4

19.8

15.4

10.3

97.2

65.5

43.7

Italy

79.5

79.5

79.5

79.5

79.5

79.5

Japan

42.5

32.0

28.5

42.5

32.0

28.5

23.8

23.8

23.8

66.2

55.8

52.3

Korea

55.6

37.3

27.0

55.6

37.3

27.0

Latvia

44.6

44.6

44.6

44.6

44.6

44.6

Lithuania

36.8

23.6

19.2

36.8

23.6

19.2

Luxembourg

91.5

78.8

74.5

91.5

78.8

74.5

Mexico

12.6

3.2

2.0

22.5

22.5

22.5

35.1

25.7

24.6

17.3

17.3

17.3

48.2

43.0

41.9

Netherlands

57.9

29.0

19.3

15.6

42.0

50.8

73.5

70.9

70.1

New Zealand

79.3

39.7

26.4

79.3

39.7

26.4

17.8

17.8

17.8

97.1

57.4

44.2

Norway

45.7

39.6

30.1

4.7

5.9

6.2

50.4

45.4

36.3

Poland

29.4

29.4

29.4

29.4

29.4

29.4

Portugal

75.8

74.4

73.1

75.8

74.4

73.1

Slovak Republic

59.5

49.6

47.0

59.5

49.6

47.0

Slovenia

47.8

38.8

36.0

47.8

38.8

36.0

Spain

72.3

72.3

72.3

72.3

72.3

72.3

Sweden

41.6

41.6

30.8

12.5

12.5

34.4

54.1

54.1

65.3

Switzerland

32.4

21.4

15.2

20.6

21.0

14.0

53.0

42.4

29.2

Turkey

67.4

67.4

67.4

67.4

67.4

67.4

United Kingdom

43.5

21.7

14.5

43.5

21.7

14.5

29.1

29.1

22.9

72.6

50.9

37.4

United States

50.1

39.4

33.1

50.1

39.4

33.1

30.9

30.9

30.9

81.0

70.3

64.0

OECD

51.1

39.6

34.9

60.0

49.0

44.7

66.1

55.2

50.5

Argentina

83.7

71.2

67.1

83.7

71.2

67.1

Brazil

92.1

58.9

58.9

92.1

58.9

58.9

China

90.6

71.6

65.2

90.6

71.6

65.2

India

83.4

83.4

83.4

83.4

83.4

83.4

Indonesia

33.1

33.1

33.1

22.2

22.2

22.2

55.3

55.3

55.3

Russian Federation

62.3

49.6

44.9

20.4

20.4

20.4

82.7

70.0

65.2

Saudi Arabia

59.6

59.6

59.6

59.6

59.6

59.6

South Africa

34.5

17.2

11.5

34.5

17.2

11.5

49.1

49.1

49.1

49.1

49.1

49.1

EU28

54.7

45.5

41.2

60.3

52.0

48.8

63.6

55.4

51.8

Note: DB=defined benefit; DC = defined contribution.

Source: OECD pension models.

 StatLink https://doi.org/10.1787/888934041497

Disclaimer

This work is published under the responsibility of the Secretary-General of the OECD. The opinions expressed and arguments employed herein do not necessarily reflect the official views of OECD member countries.

This document, as well as any data and map included herein, are without prejudice to the status of or sovereignty over any territory, to the delimitation of international frontiers and boundaries and to the name of any territory, city or area.

The statistical data for Israel are supplied by and under the responsibility of the relevant Israeli authorities. The use of such data by the OECD is without prejudice to the status of the Golan Heights, East Jerusalem and Israeli settlements in the West Bank under the terms of international law.

Note by Turkey
The information in this document with reference to “Cyprus” relates to the southern part of the Island. There is no single authority representing both Turkish and Greek Cypriot people on the Island. Turkey recognises the Turkish Republic of Northern Cyprus (TRNC). Until a lasting and equitable solution is found within the context of the United Nations, Turkey shall preserve its position concerning the “Cyprus issue”.

Note by all the European Union Member States of the OECD and the European Union
The Republic of Cyprus is recognised by all members of the United Nations with the exception of Turkey. The information in this document relates to the area under the effective control of the Government of the Republic of Cyprus.

Corrigenda to publications may be found on line at: www.oecd.org/about/publishing/corrigenda.htm.

© OECD 2019

The use of this work, whether digital or print, is governed by the Terms and Conditions to be found at http://www.oecd.org/termsandconditions.